88
PERFORMANCE UNDERLYING STRENGTH CALLOWAY REIT 2009 Annual Report

PERFORMANCE UNDERLYING
STRENGTHCALLOWAY REIT 2009 Annual Report


SIMON NYILASSY President and Chief Executive Officer
CALLOWAY REIT 2009 Annual Report 01
PRESIDENT’S MESSAGE
In 2009, Calloway REIT had a mission: maintain the industry-leading performance from our existing portfolio, increase liquidity and keep strong alliances with tenants. The strategy was based on our belief that maintaining consistent streams of income through all economic cycles is directly related to our underlying strength: quality assets. Quality assets means rent paying tenants and quality relationships. At the base of this strategy is our focus on keeping a high level of occupancy. Although the recession put some pressure on retailers, during 2009 Calloway filled 289,000 square feet of vacant space. Calloway has a tenant-centric business approach, which attracts an expanding roster of national leading retailers with good covenants such as Dollarama, Bed Bath & Beyond and Forzani Group. The Forzani Group’s Sport Chek banner will fill three of the vacancies left by Linens ‘N Things, which represents 93,000 square feet. Future Shop will fill a fourth in 2010.

02 CALLOWAY REIT 2009 Annual Report
President‘s Message
In terms of renewals, Calloway extended leases in 460,000 square feet, putting the renewal rate for the year at over 90%. This is related to the portfolio’s quality assets, strong tenants and solid tenant relations. The average increase over previous rent rates was 7% – a good result in a difficult year. In addition, the Trust completed 775,000 square feet in development and leased the space to strong tenants such as Winners, Golf Town, Dollarama and Calloway’s first Lowes store, which opened in Oshawa, Ontario. At year-end, the total occupancy rate of the portfolio was 98.9% – close to the level achieved before the recession – a level Calloway has maintained for five straight years. With the goal of increasing liquidity, financing in 2009 was addressed aggressively and at many levels. A total of $905.8 million in capital was raised over the year – all with minimum dilution to Unitholder equity.
In the first quarter, Calloway refinanced two maturing mortgages. As a result of these refinancings and a $105 million syndicated bank facility, Calloway was able to raise $138.9 million. During the second quarter, Calloway raised $225 million through the issuance of five-year unsecured debentures, with the net proceeds being used to repay over 75% of the existing unsecured series A debentures maturing in 2010 and the balance to repay outstanding operating lines.

We are Canada’s dominant owner of large-scale, unenclosed shopping centres. Our properties are in heavily populated communities across the country.
The leasable space of our properties totals 22.8 million square feet, and we have the potential for another 5.1 million square feet of future development.
Our properties are primarily newly built shopping centres, with the age of the portfolio averaging just 7.8 years.
Calloway’s high-quality portfolio consists of 127 properties, with 117 in full operation and 10 being developed.
IT STARTS WITH
CHOICE ASSETSExceptional places to shop – that’s our industry-leading
network of unenclosed retail shopping centres,
located in thriving markets across the country. These
choice assets are valued at more than $4 billion.

04 CALLOWAY REIT 2009 Annual Report
President‘s Message
The Trust also closed $67 million in new term mortgages. In the third quarter, Calloway raised $175.4 million through the issuance of 3.2 million units at $15.50 for gross proceeds of $50 million and $125.4 million in term financing. Also during the quarter, Calloway negotiated a new two-year $160 million operating line to replace two maturing operating facilities. In the fourth quarter, the company sold a combination of $60 million principal amount convertible debentures and 2,100,000 Trust Units at a price of $19.05 per unit to raise gross proceeds of $100 million. The Trust also raised $39.5 million in term financing. As a result of these financing efforts, Calloway finished the year with $171.3 million available in cash and undrawn lines of credit providing sufficient capital resources to fund growth through to 2011. The debt to gross book value ratio is 55.3%, sitting just above the lower limit of Calloway’s target range of 55–60%. Calloway executed its financing strategy with minimum dilution to our Unitholders.
Portfolio Age (year of construction)
87.8%
2000–present
3.7%
Before 1994
8.5%
1995–1999

RETAILING
POWER-HOUSESWhat draws shoppers is our ever-growing list of
leading retailers. These retailers are household names
dedicated to providing value, with Wal-Mart Canada
anchoring three-quarters of our centres.
TOP 10 TENANTS
1. Wal-Mart
2. Canadian Tire/ Mark’s Work Wearhouse
3. Best Buy/Future Shop
4. HBC
5. Reitmans
6. Winners
7. Sobeys
8. Rona
9. Staples
10. The Brick

06 CALLOWAY REIT 2009 Annual Report
President’s Message
In terms of key financial metrics, Calloway’s income-producing portfolio generated revenues of $447 million, for a $32 million increase over 2008. Net operating income of $294 million increased $19 million or 7%. Income from continuing operations decreased $15 million, mainly as a result of increased interest expense and property operating costs. Cash flow as measured by funds from operations (FFO) totalled $162 million, a decrease of $7 million or 4%. The results were negatively affected by increased interest expense from new financings and lower interest income from repaid mezzanine loans, offset somewhat by completed acquisitions and developments generating revenues of $4.1 million. FFO per unit (fully diluted) was $1.67 compared to $1.81 in 2008. This solid performance allowed Calloway to maintain its annual distributions at $1.55 per unit. As mentioned at the outset, maintaining strong relationships with valued tenants and other key stakeholders is central to the realization of Calloway’s high-functioning, high-quality, income- producing portfolio. Wal-Mart Canada continues to be Calloway’s largest tenant, and we share a deep commitment to providing quality and value at many levels. The mutual benefits of this alliance were evident in 2009 as Wal-Mart’s expansion strategy continued to evolve with 10 Supercentre conversions. These conversions substantially increase the food offering in Wal-Mart’s stores to encompass a full line of fresh groceries. This, in turn, increases the draw of the store, driving more consumers to Calloway’s centres. A prime example of this successful, symbiotic relationship is the 126,000 square feet of remerchandised space located in (Rexdale), Ontario.
1.9
0.1
4.6 4.4
10Month-to-
month
11 12
6.2
7.3
5.8
13 14 15
4.7
16
5.85.2
8.3
6.4
17 18 19 20
7.7
21
6.2
9.6
4.3
2.5
7.9
1.1
22 23 24 25 Beyond Vacant
Lease Expiries (per cent)
Year of Expiry

TENANT SATISFACTION
A FULL HOUSE
We are the landlord of choice for top-tier value
retailers, offering the right merchandising mix to
attract shoppers. That keeps our tenants satisfied
and gives Calloway its industry-leading occupancy
rates – topping 98% over the past five years.
OCCUPANCY
2009
December – 98.9%
September – 98.7%
June – 98.6%
March – 98.3%
2008
December – 99.1%
September – 99.2%
June – 99.2%
March – 99.2%
08 CALLOWAY REIT 2009 Annual Report
President’s Message
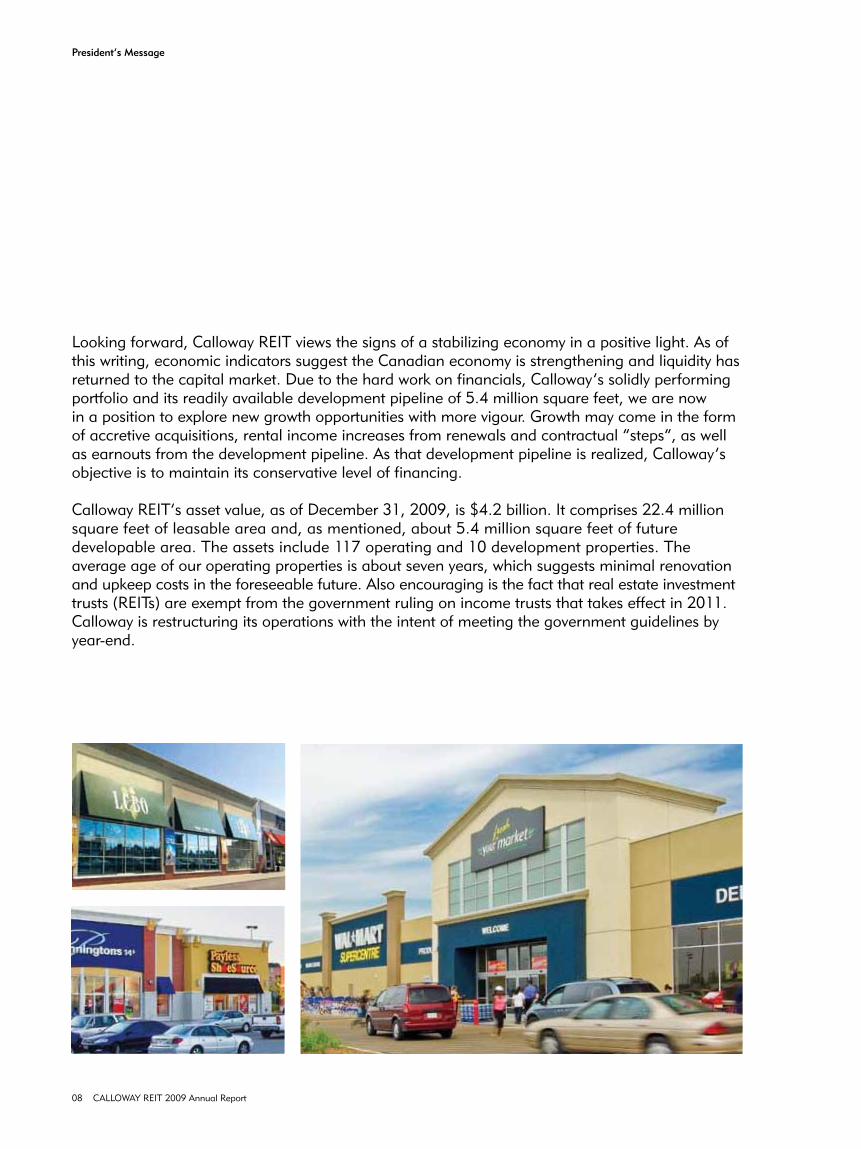
Looking forward, Calloway REIT views the signs of a stabilizing economy in a positive light. As of this writing, economic indicators suggest the Canadian economy is strengthening and liquidity has returned to the capital market. Due to the hard work on financials, Calloway’s solidly performing portfolio and its readily available development pipeline of 5.4 million square feet, we are now in a position to explore new growth opportunities with more vigour. Growth may come in the form of accretive acquisitions, rental income increases from renewals and contractual “steps”, as well as earnouts from the development pipeline. As that development pipeline is realized, Calloway’s objective is to maintain its conservative level of financing.
Calloway REIT’s asset value, as of December 31, 2009, is $4.2 billion. It comprises 22.4 million square feet of leasable area and, as mentioned, about 5.4 million square feet of future developable area. The assets include 117 operating and 10 development properties. The average age of our operating properties is about seven years, which suggests minimal renovation and upkeep costs in the foreseeable future. Also encouraging is the fact that real estate investment trusts (REITs) are exempt from the government ruling on income trusts that takes effect in 2011. Calloway is restructuring its operations with the intent of meeting the government guidelines by year-end.

A WEALTH OF
TALENT
With its breadth of experience, Calloway’s executive group has both the knowledge and the commitment to keep the REIT performing at an optimum level.
The full Calloway team has the skills and experience to provide a full suite of real estate services – ranging from asset management and property management to acquisitions, leasing and development.
Experienced, knowledgeable
management and a skilled,
professional staff share the
goal of performing at the
highest level. Together,
103 talented employees
make up one of Calloway’s
key underlying strengths.From left to right: Rudy Gobin, Anthony Facchini, Mario Calabrese, Simon Nyilassy, Bart Munn, Steve Liew, Robert Piccinin

10 CALLOWAY REIT 2009 Annual Report
President’s Message
SIMON NYILASSY President and Chief Executive Officer
Funds From Operations ($ per unit)
1.67 1.671.57
1.751.81
05 06 0907 08
Finally, as Calloway REIT moves forward, quality assets, quality tenants and quality relationships will always be the foundation of its success. They will always be the Trust’s underlying strength and the reason for its ability to achieve steadily growing income over time. Even as Calloway actively explores growth opportunities in the days ahead, new opportunities will be assessed by their ability to contribute to this core strength. It is the nucleus of the Trust’s commitment to deliver the best possible results to loyal Unitholders, valued tenants and their hard-working Canadian customers.

DEPENDABLE
RETURNSFor our Unitholders, value means a dependable
stream of income that grows steadily over time.
With its proven record of success, Calloway
remains confident it can continue to deliver.
1.471.37
1.52 1.55 1.55
05 06 07 08 09
Distributions ($ per unit)
2009 Net Operating Income
$294 Million
2009 Funds From Operations
$162 Million
2009 Annual Distributions
$1.55 per unit
2009 Revenues
$447 Million

12 CALLOWAY REIT 2009 Annual Report
PROPERTY
PORTFOLIOCalloway’s portfolio includes 117 high-quality operating properties and 10 development properties located across Canada in major urban centres.
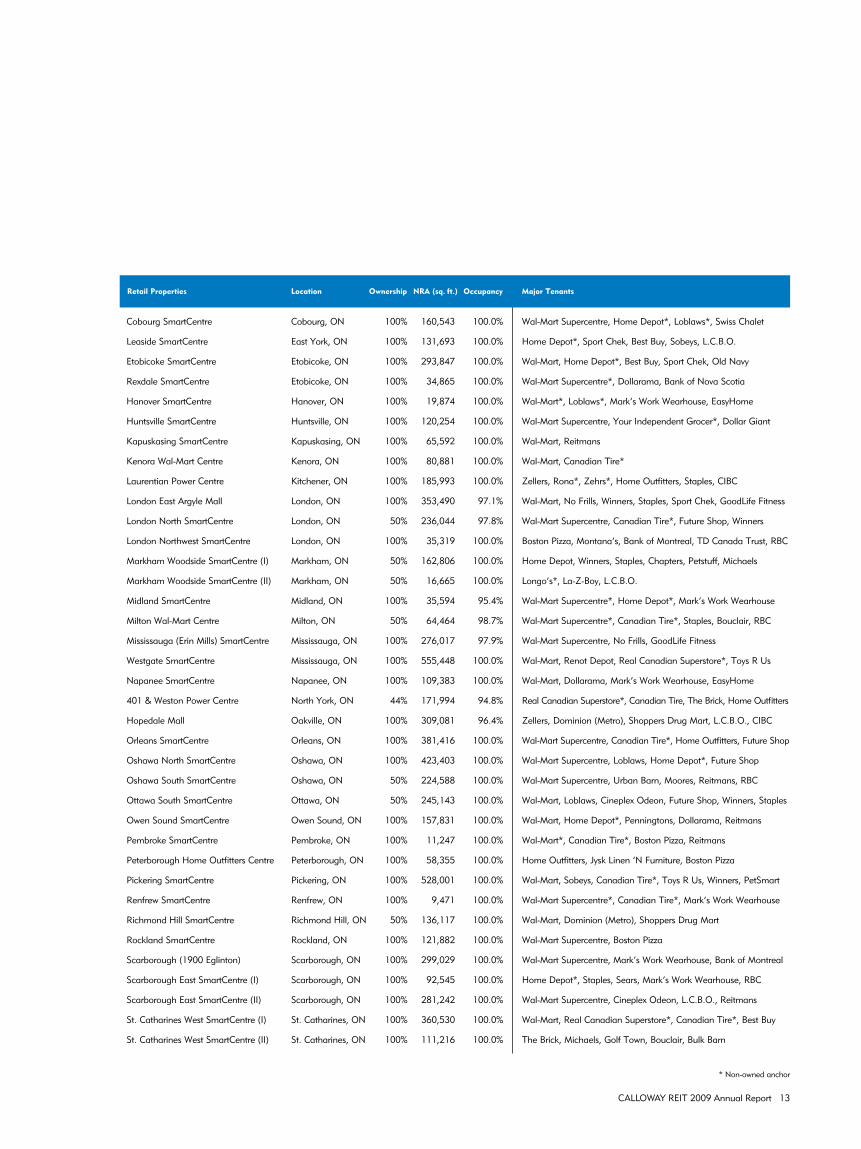
Retail Properties Location Ownership NRA (sq. ft. ) Occupancy Major Tenants
Courtenay SmartCentre Courtenay, BC 100% 243,372 100.0% Wal-Mart, Winners, Staples, Future Shop, Petland, Sport Mart, RBC
Cranbrook SmartCentre Cranbrook, BC 100% 136,626 100.0% Wal-Mart, Real Canadian Superstore*, Home Hardware*
Kamloops SmartCentre Kamloops, BC 100% 217,252 100.0% Wal-Mart, Michaels, Lordco Auto Parts, Pier 1 Imports
Langley SmartCentre Langley, BC 100% 327,092 98.3% Wal-Mart, Home Depot*, Save-on-Foods*, Home Outfitters
New Westminster SmartCentre New Westminster, BC 100% 382,577 97.1% Wal-Mart, Home Outfitters, Best Buy, Tommy Hilfiger
Penticton Power Centre Penticton, BC 100% 201,948 100.0% Zellers, Staples, Winners, TD Canada Trust
Prince George SmartCentre Prince George, BC 100% 254,074 98.1% Wal-Mart, Home Depot*, Canadian Tire*, Michaels, Petland, RBC
Surrey West SmartCentre Surrey, BC 100% 183,298 97.2% Wal-Mart, Dollar Giant, Sleep Country, Reitmans
Vernon SmartCentre Vernon, BC 100% 249,183 100.0% Wal-Mart Supercentre, Rona*, Future Shop, Value Village
Calgary Southeast SmartCentre Calgary, AB 100% 215,301 100.0% Wal-Mart, London Drugs, Mark’s Work Wearhouse, Reitmans
Crowchild Corner Calgary, AB 100% 23,377 87.0% Re/Max, Respiratory Homecare Solutions Inc.
Edmonton Northeast SmartCentre Edmonton, AB 100% 227,059 99.4% Wal-Mart, Michaels, Mark’s Work Wearhouse, Moores, Reitmans
Lethbridge SmartCentre Lethbridge, AB 100% 337,436 92.0% Wal-Mart Supercentre, Home Depot*, Ashley Furniture, Moores
St. Albert SmartCentre St. Albert, AB 100% 249,669 100.0% Wal-Mart Supercentre, Save-on-Foods*, Totem*, Sleep Country
Regina East SmartCentre Regina, SK 100% 370,755 100.0% Wal-Mart, Real Canadian Superstore*, Rona*, HomeSense
Regina North SmartCentre Regina, SK 100% 226,521 100.0% Wal-Mart, IGA, Mark’s Work Wearhouse, TD Canada Trust
Saskatoon South SmartCentre Saskatoon, SK 100% 337,135 100.0% Wal-Mart, Home Depot*, HomeSense, The Brick, Ashley Furniture
Kenaston Common SmartCentre Winnipeg, MB 100% 220,323 100.0% Rona, Costco*, Indigo Books, Golf Town, Petland, HSBC, RBC
Winnipeg Southwest SmartCentre Winnipeg, MB 100% 491,154 100.0% Wal-Mart, Home Depot*, Safeway, Home Outfitters, HomeSense
Winnipeg West SmartCentre Winnipeg, MB 100% 287,706 100.0% Wal-Mart, Canadian Tire*, IGA, Winners, Shoppers Drug Mart
Ancaster SmartCentre Ancaster, ON 100% 235,807 100.0% Wal-Mart Supercentre, Canadian Tire*, Future Shop, Dollar Giant
Aurora North SmartCentre Aurora, ON 50% 239,257 100.0% Wal-Mart Supercentre, Rona, Best Buy, TD Canada Trust
Aurora SmartCentre Aurora, ON 100% 50,463 100.0% Canadian Tire*, Winners, Bank of Nova Scotia, Blockbuster
Barrie North SmartCentre Barrie, ON 100% 201,697 100.0% Wal-Mart, Zehrs*, Old Navy, Bonnie Togs, Addition-Elle, Reitmans
Barrie South SmartCentre Barrie, ON 100% 369,577 100.0% Wal-Mart, Sobeys, Winners, Michaels, PetSmart, La-Z-Boy
Bolton SmartCentre Bolton, ON 100% 235,434 99.1% Wal-Mart Supercentre, Real Canadian Superstore*, L.C.B.O.
Bramport SmartCentre Brampton, ON 100% 115,302 100.0% Loblaws*, L.C.B.O., Dollarama, Swiss Chalet, Bank of Montreal
Brampton East SmartCentre (I) Brampton, ON 100% 35,777 100.0% Rona*, Canadian Tire*, The Beer Store, Kelsey’s
Brampton East SmartCentre (II) Brampton, ON 100% 358,432 99.2% Wal-Mart Supercentre, The Brick, Winners, Staples
Brampton North SmartCentre Brampton, ON 100% 41,535 97.0% Fortinos*, Shoppers Drug Mart
Brockville SmartCentre Brockville, ON 100% 108,605 100.0% Wal-Mart Supercentre*, Real Canadian Superstore*, Home Depot*
Burlington North SmartCentre Burlington, ON 100% 176,483 100.0% Wal-Mart Supercentre, Reitmans, Moores, Bank of Nova Scotia
Burlington Staples SmartCentre Burlington, ON 100% 134,238 100.0% Home Depot*, Future Shop, Staples, Bad Boy Furniture, Sears
Cambridge SmartCentre (I) Cambridge, ON 100% 626,873 93.2% Wal-Mart Supercentre, Reno Depot, Canadian Tire*, Staples
Cambridge SmartCentre (II) Cambridge, ON 100% 32,068 74.9% Home Depot*, 2001 Audio Video, Henry’s Photography
Carleton Place SmartCentre Carleton Place, ON 100% 148,607 100.0% Wal-Mart Supercentre, Dollarama, Mark’s Work Wearhouse
Chatham SmartCentre Chatham, ON 50% 139,838 100.0% Wal-Mart Supercentre, Zehrs*, Winners, Mark’s Work Wearhouse
* Non-owned anchor
CALLOWAY REIT 2009 Annual Report 13
Cobourg SmartCentre Cobourg, ON 100% 160,543 100.0% Wal-Mart Supercentre, Home Depot*, Loblaws*, Swiss Chalet
Leaside SmartCentre East York, ON 100% 131,693 100.0% Home Depot*, Sport Chek, Best Buy, Sobeys, L.C.B.O.
Etobicoke SmartCentre Etobicoke, ON 100% 293,847 100.0% Wal-Mart, Home Depot*, Best Buy, Sport Chek, Old Navy
Rexdale SmartCentre Etobicoke, ON 100% 34,865 100.0% Wal-Mart Supercentre*, Dollarama, Bank of Nova Scotia
Hanover SmartCentre Hanover, ON 100% 19,874 100.0% Wal-Mart*, Loblaws*, Mark’s Work Wearhouse, EasyHome
Huntsville SmartCentre Huntsville, ON 100% 120,254 100.0% Wal-Mart Supercentre, Your Independent Grocer*, Dollar Giant
Kapuskasing SmartCentre Kapuskasing, ON 100% 65,592 100.0% Wal-Mart, Reitmans
Kenora Wal-Mart Centre Kenora, ON 100% 80,881 100.0% Wal-Mart, Canadian Tire*
Laurentian Power Centre Kitchener, ON 100% 185,993 100.0% Zellers, Rona*, Zehrs*, Home Outfitters, Staples, CIBC
London East Argyle Mall London, ON 100% 353,490 97.1% Wal-Mart, No Frills, Winners, Staples, Sport Chek, GoodLife Fitness
London North SmartCentre London, ON 50% 236,044 97.8% Wal-Mart Supercentre, Canadian Tire*, Future Shop, Winners
London Northwest SmartCentre London, ON 100% 35,319 100.0% Boston Pizza, Montana’s, Bank of Montreal, TD Canada Trust, RBC
Markham Woodside SmartCentre (I) Markham, ON 50% 162,806 100.0% Home Depot, Winners, Staples, Chapters, Petstuff, Michaels
Markham Woodside SmartCentre (II) Markham, ON 50% 16,665 100.0% Longo’s*, La-Z-Boy, L.C.B.O.
Midland SmartCentre Midland, ON 100% 35,594 95.4% Wal-Mart Supercentre*, Home Depot*, Mark’s Work Wearhouse
Milton Wal-Mart Centre Milton, ON 50% 64,464 98.7% Wal-Mart Supercentre*, Canadian Tire*, Staples, Bouclair, RBC
Mississauga (Erin Mills) SmartCentre Mississauga, ON 100% 276,017 97.9% Wal-Mart Supercentre, No Frills, GoodLife Fitness
Westgate SmartCentre Mississauga, ON 100% 555,448 100.0% Wal-Mart, Renot Depot, Real Canadian Superstore*, Toys R Us
Napanee SmartCentre Napanee, ON 100% 109,383 100.0% Wal-Mart, Dollarama, Mark’s Work Wearhouse, EasyHome
401 & Weston Power Centre North York, ON 44% 171,994 94.8% Real Canadian Superstore*, Canadian Tire, The Brick, Home Outfitters
Hopedale Mall Oakville, ON 100% 309,081 96.4% Zellers, Dominion (Metro), Shoppers Drug Mart, L.C.B.O., CIBC
Orleans SmartCentre Orleans, ON 100% 381,416 100.0% Wal-Mart Supercentre, Canadian Tire*, Home Outfitters, Future Shop
Oshawa North SmartCentre Oshawa, ON 100% 423,403 100.0% Wal-Mart Supercentre, Loblaws, Home Depot*, Future Shop
Oshawa South SmartCentre Oshawa, ON 50% 224,588 100.0% Wal-Mart Supercentre, Urban Barn, Moores, Reitmans, RBC
Ottawa South SmartCentre Ottawa, ON 50% 245,143 100.0% Wal-Mart, Loblaws, Cineplex Odeon, Future Shop, Winners, Staples
Owen Sound SmartCentre Owen Sound, ON 100% 157,831 100.0% Wal-Mart, Home Depot*, Penningtons, Dollarama, Reitmans
Pembroke SmartCentre Pembroke, ON 100% 11,247 100.0% Wal-Mart*, Canadian Tire*, Boston Pizza, Reitmans
Peterborough Home Outfitters Centre Peterborough, ON 100% 58,355 100.0% Home Outfitters, Jysk Linen ‘N Furniture, Boston Pizza
Pickering SmartCentre Pickering, ON 100% 528,001 100.0% Wal-Mart, Sobeys, Canadian Tire*, Toys R Us, Winners, PetSmart
Renfrew SmartCentre Renfrew, ON 100% 9,471 100.0% Wal-Mart Supercentre*, Canadian Tire*, Mark’s Work Wearhouse
Richmond Hill SmartCentre Richmond Hill, ON 50% 136,117 100.0% Wal-Mart, Dominion (Metro), Shoppers Drug Mart
Rockland SmartCentre Rockland, ON 100% 121,882 100.0% Wal-Mart Supercentre, Boston Pizza
Scarborough (1900 Eglinton) Scarborough, ON 100% 299,029 100.0% Wal-Mart Supercentre, Mark’s Work Wearhouse, Bank of Montreal
Scarborough East SmartCentre (I) Scarborough, ON 100% 92,545 100.0% Home Depot*, Staples, Sears, Mark’s Work Wearhouse, RBC
Scarborough East SmartCentre (II) Scarborough, ON 100% 281,242 100.0% Wal-Mart Supercentre, Cineplex Odeon, L.C.B.O., Reitmans
St. Catharines West SmartCentre (I) St. Catharines, ON 100% 360,530 100.0% Wal-Mart, Real Canadian Superstore*, Canadian Tire*, Best Buy
St. Catharines West SmartCentre (II) St. Catharines, ON 100% 111,216 100.0% The Brick, Michaels, Golf Town, Bouclair, Bulk Barn
* Non-owned anchor
Retail Properties Location Ownership NRA (sq. ft. ) Occupancy Major Tenants

14 CALLOWAY REIT 2009 Annual Report
Property Portfolio
St. Thomas SmartCentre St. Thomas, ON 100% 202,721 100.0% Wal-Mart Supercentre, Real Canadian Superstore*, Canadian Tire*
Stouffville SmartCentre Stouffville, ON 100% 147,834 100.0% Wal-Mart Supercentre*, Canadian Tire, Winners, Staples
Toronto Stockyards SmartCentre Toronto, ON 100% 8,550 100.0% Wal-Mart*, Bank of Montreal, Citifinancial
Westside Mall Toronto, ON 100% 144,377 100.0% Canadian Tire, Price Chopper, Shoppers Drug Mart, CIBC
400 & 7 Power Centre Vaughan, ON 100% 237,992 100.0% The Brick, Home Depot*, Staples, Value Village, GoodLife Fitness
Rutherford Village Shopping Centre Vaughan, ON 100% 104,036 95.6% Sobeys, Pharma Plus, TD Canada Trust
Vaughan SmartCentre Vaughan, ON 100% 269,755 100.0% Wal-Mart Supercentre, Future Shop, Home Outfitters
Welland SmartCentre Welland, ON 100% 203,824 100.0% Wal-Mart, Canadian Tire*, Mark’s Work Wearhouse, Dollar Giant
Whitby North SmartCentre Whitby, ON 100% 231,695 100.0% Wal-Mart, Real Canadian Superstore*, L.C.B.O., TD Canada Trust
Whitby Northeast SmartCentre Whitby, ON 100% 26,949 100.0% Boston Pizza, Bell World, RBC
Windsor South SmartCentre Windsor, ON 100% 230,356 97.0% Wal-Mart, Part Source, Dollarama, Super Pet, Moores, CIBC
Woodbridge SmartCentre Woodbridge, ON 50% 215,255 89.4% Canadian Tire*, Fortinos*, Best Buy, Toys R Us, Chapters
Woodstock SmartCentre Woodstock, ON 100% 216,281 100.0% Wal-Mart, Canadian Tire*, Staples, Mark’s Work Wearhouse
Drummondville SmartCentre Drummondville, QC 100% 51,186 72.5% Wal-Mart*, Loblaws*, Mark’s Work Wearhouse, Reitmans, CIBC
Hull SmartCentre Hull, QC 50% 147,658 100.0% Wal-Mart, Rona*, Famous Players*, Super C*, Winners, Staples
Kirkland SmartCentre Kirkland, QC 100% 207,216 100.0% Wal-Mart, The Brick
Laval West SmartCentre Laval, QC 100% 558,073 100.0% Wal-Mart, Reno Depot, Canadian Tire*, IGA*, Home Outfitters
Magog SmartCentre Magog, QC 100% 101,854 100.0% Wal-Mart, Canadian Tire*
Mascouche SmartCentre Mascouche, QC 100% 364,153 100.0% Wal-Mart, Rona*, IGA, Home Outfitters, Winners, Staples, Bouclair
Montreal (Decarie) SmartCentre Montreal, QC 50% 112,383 100.0% Wal-Mart, Mark’s Work Wearhouse, Pier 1 Imports, Addition-Elle
Montreal North SmartCentre Montreal, QC 100% 257,204 100.0% Wal-Mart, IGA, Winners, Dollarama, Mark’s Work Wearhouse
Place Bourassa Mall Montreal, QC 100% 276,206 100.0% Zellers, Super C, Pharmaprix, Bouclair, L’Aubainerie, SAQ, RBC
Rimouski SmartCentre Rimouski, QC 100% 216,273 98.3% Wal-Mart, Tanguay*, Super C*, Future Shop, Mark’s Work Wearhouse
Saint-Constant SmartCentre Saint-Constant, QC 100% 303,731 100.0% Wal-Mart, Home Depot*, Super C, L’Aubainerie Concept Mode
Saint-Jean SmartCentre Saint-Jean, QC 100% 195,929 100.0% Wal-Mart, Maxi*, Mark’s Work Wearhouse, TD Canada Trust
Saint-Jerome SmartCentre Saint-Jerome, QC 100% 119,756 100.0% Wal-Mart*, Home Depot*, IGA, Bouclair, Dollarama, TD Canada Trust
Sherbrooke SmartCentre Sherbrooke, QC 100% 205,185 100.0% Wal-Mart, Home Depot*, Canadian Tire*, Mark’s Work Wearhouse
Valleyfield SmartCentre Valleyfield, QC 100% 161,236 100.0% Wal-Mart, Dollarama, SAQ, Reitmans,
Victoriaville SmartCentre Victoriaville, QC 100% 23,214 100.0% Wal-Mart*, Home Depot*, Maxi*
Saint John SmartCentre Saint John, NB 100% 271,084 100.0% Wal-Mart, Kent*, Canadian Tire*, Winners, Future Shop, Sport Chek
Bridgewater SmartCentre Bridgewater, NS 100% 31,996 93.6% Wal-Mart*, Home Depot*, Canadian Tire*, Boston Pizza, Reitmans
Halifax Bayers Lake Centre Halifax, NS 100% 155,306 92.0% Zellers*, Atlantic Superstore*, Future Shop, Winners, Reitmans
New Minas SmartCentre New Minas, NS 100% 45,561 95.5% Wal-Mart*, Sport Chek, Mark’s Work Wearhouse, Bulk Barn
Truro SmartCentre Truro, NS 100% 123,571 100.0% Wal-Mart, Kent*, Stitches, Penningtons
Charlottetown SmartCentre Charlottetown, PE 100% 188,924 100.0% Wal-Mart, Canadian Tire*, Home Depot*, Sobeys*, Michaels
Corner Brook SmartCentre Corner Brook, NL 100% 178,980 100.0% Wal-Mart, Canadian Tire*, Dominion (Loblaw)*, Staples, Bulk Barn
Gander SmartCentre Gander, NL 100% 25,235 91.8% Wal-Mart*, Penningtons, EasyHome, Bank of Nova Scotia
* Non-owned anchor
Retail Properties Location Ownership NRA (sq. ft. ) Occupancy Major Tenants

CALLOWAY REIT 2009 Annual Report 15
Mount Pearl SmartCentre Mount Pearl, NL 100% 248,669 98.9% Wal-Mart, Canadian Tire*, Dominion (Loblaw)*, Staples, Reitmans
Pearlgate Shopping Centre Mount Pearl, NL 100% 42,893 93.2% Shoppers Drug Mart, TD Canada Trust
St. John’s Central SmartCentre St. John’s, NL 100% 109,870 85.2% Wal-Mart*, Home Depot*, Canadian Tire*, IGA, Moores
St. John’s East SmartCentre St. John’s, NL 100% 364,210 100.0% Wal-Mart, Dominion (Loblaw)*, Winners, Staples, Future Shop
115 Total Retail Properties 22,620,891
* Non-owned anchor1 Currently in the development phase
Airtech Centre Richmond, BC 100% 111,484 100.0% MTU Maintenance
British Colonial Building Toronto, ON 100% 17,428 100.0% Navigator Limited, Irish Embassy Pubs Inc.
2 Total Industrial/Office Properties 128,916
Quesnel SmartCentre Quesnel, BC 100% 89,498 Wal-Mart*
Salmon Arm SmartCentre Salmon Arm, BC 50% 198,019 Wal-Mart1
Burlington (Appleby) SmartCentre Burlington, ON 100% 162,724
Dunnville SmartCentre Dunnville, ON 100% 105,304
Etobicoke (Index) SmartCentre Etobicoke, ON 100% 171,435
Fort Erie SmartCentre Fort Erie, ON 100% 36,455 Wal-Mart*, No Frills*
Halton Hills SmartCentre Halton Hills, ON 100% 466,025
Innisfil SmartCentre Innisfil, ON 50% 178,475
Mississauga (Dixie and Dundas) Centre Mississauga, ON 100% 207,325
Fredericton North SmartCentre Fredericton, NB 100% 51,075 Wal-Mart*, Canadian Tire*, Kent*
10 Total Retail Development Lands 1,666,335
Retail Properties Location Ownership NRA (sq. ft. ) Occupancy Major Tenants
Industrial/Office Properties Location Ownership NRA (sq. ft. ) Occupancy Major Tenants
Retail Development Lands Location Ownership NRA (sq. ft. ) Major Tenants

16 CALLOWAY REIT 2009 Annual Report
FINANCIALS
Management’s Discussion and Analysis of Results of Operations and Financial Condition 17
Management’s Responsibility for Financial Reporting 50
Auditors’ Report 51
Consolidated Balance Sheets 52
Consolidated Statements of Income and Comprehensive Income 53
Consolidated Statements of Equity 54
Consolidated Statements of Cash Flows 55
Notes to Consolidated Financial Statements 56
Corporate Information 84
CORPORATE
OVERVIEWCalloway REIT is the dominant owner of large-format
unenclosed retail properties in Canada, with total assets
of approximately $4.2 billion. Through the ownership and
development of premium retail properties, it is creating
exceptional places for Canadians to shop. Home to leading
national retailers, these properties comprise a total of
22.8 million square feet. Calloway continues to create
value for its Unitholders, its tenants and hard-working
Canadian consumers.

CALLOWAY REIT 2009 Annual Report 17
MANAGEMENT’S DISCUSSION AND
ANALYSIS OF RESULTS OF OPERATIONS
AND FINANCIAL CONDITION
For the year ended December 31, 2009
This Management’s Discussion and Analysis (“MD&A”) sets out Calloway Real Estate Investment Trust’s (“Calloway” or the “Trust”) strategies and provides an analysis of the financial performance and financial condition for the year ended December 31, 2009, significant risks facing the business and management’s outlook for 2010.
This MD&A should be read in conjunction with Calloway’s audited consolidated financial statements for the year ended December 31, 2009, and the notes contained therein. Such consolidated financial statements have been prepared in accordance with Canadian generally accepted accounting principles (“Canadian GAAP”) using Calloway’s reporting currency, the Canadian dollar.
This MD&A is dated February 24, 2010, which is the date of the press release announcing Calloway’s results for the year ended December 31, 2009. Disclosure contained in this MD&A is current to that date, unless otherwise noted.
Readers are cautioned that certain terms used such as “Funds from Operations (FFO)”, “Adjusted Funds from Operations (AFFO)”, “Distributable Income (DI)”, “Net Operating Income (NOI)”, “Gross Book Value”, “Enterprise Value”, “Payout Ratio”, “Interest Coverage” and any related per Unit amounts used by management to measure, compare and explain the operating results and financial performance of Calloway are not recognized terms under Canadian GAAP and therefore should not be construed as alternatives to net income or cash flow from operating activities calculated in accordance with Canadian GAAP. These terms are defined in this MD&A and reconciled to the audited consolidated financial statements of Calloway for the year ended December 31, 2009. Such terms do not have a standardized meaning prescribed by Canadian GAAP and may not be comparable to similarly titled measures presented by other publicly traded entities. See “Other Measures of Performance”, “Net Operating Income” and “Debt”.
Certain statements in this MD&A are forward-looking statements that reflect management’s expectations regarding Calloway’s future growth, results of operations, performance and business prospects and opportunities as outlined under the headings “Business Overview and Strategic Direction” and “Outlook”. More specifically, certain statements contained in this MD&A, including statements related to Calloway’s maintenance of productive capacity, estimated future development plans and costs, view of term mortgage renewals including rates and upfinancing amounts, timing of future payments of obligations, intentions to secure additional financing and potential financing sources, vacancy and leasing assumptions, and statements that contain words such as “could”, “should”, “can”, “anticipate”, “expect”, “believe”, “will”, “may” and similar expressions and statements relating to matters that are not historical facts, constitute “forward-looking statements”. These forward-looking statements are presented for the purpose of assisting Calloway’s Unitholders and financial analysts in understanding Calloway’s operating environment and may not be appropriate for other purposes. Such forward-looking statements reflect management’s current beliefs and are based on information currently available to management. However, such forward-looking statements involve significant risks and uncertainties, including those discussed under the heading “Risks and Uncertainties” and elsewhere in this MD&A. A number of factors could cause actual results to differ materially from the results discussed in the forward-looking statements. Although the forward-looking statements contained in this MD&A are based on what management believes to be reasonable assumptions, including those discussed under the heading “Outlook” and elsewhere in this MD&A, Calloway cannot assure investors that actual results will be consistent with these forward-looking statements. The forward-looking statements contained herein are expressly qualified in their entirety by this cautionary statement. These forward-looking statements are made as at the date of this MD&A and Calloway assumes no obligation to update or revise them to reflect new events or circumstances unless otherwise required by applicable securities legislation.
Prior year results have been reclassified to conform to the presentation adopted in the current year.
All amounts in the MD&A are in thousands of Canadian dollars, except where otherwise stated. Per Unit amounts are on a diluted basis, except where otherwise stated.
Additional information relating to Calloway, including Calloway’s Annual Information Form for the year ended December 31, 2009, can be found at www.sedar.com.

Management’s Discussion and Analysis of Results of Operations and Financial Condition
Business Overview and Strategic DirectionCalloway is an unincorporated open-ended mutual fund trust governed by the laws of the Province of Alberta. The Units, 6.0% convertible debentures, 6.65% convertible debentures and 5.75% convertible debentures of Calloway are listed and publicly traded on the Toronto Stock Exchange (TSX) under the symbols “CWT.UN”, “CWT.DB”, “CWT.DB.A” and “CWT.DB.B”, respectively.
Calloway’s vision is to create exceptional places to shop.
Calloway’s purpose is to own and manage dominant shopping centres that provide our retailers a platform to reach their customers through convenient locations, intelligent designs and a desirable tenant mix.
Calloway’s shopping centres focus on value-oriented retailers and include the strongest national and regional names, as well as strong neighbourhood merchants. It is expected that Wal-Mart will continue to be the dominant anchor tenant in the portfolio and that its presence will continue to attract other retailers and consumers.
As at December 31, 2009, Calloway owned 125 shopping centres, one office building and one industrial building, with total gross leasable area of 22.8 million square feet, located in communities across Canada. Generally, Calloway’s centres are conveniently located close to major highways, which, along with the anchor stores, provide significant draws to the Calloway portfolio, attracting both value-oriented consumers and retailers. Calloway acquired the right, for a ten-year term commencing in 2007, to use the “SmartCentres” brand, which represents a family-and-value-oriented shopping experience.
AcquisitionsSubject to the availability of acquisition opportunities and Calloway’s maintenance of productive capacity, Calloway intends to grow distributions, in part, through the accretive acquisitions of properties. The current environment for acquisitions is very competitive with limited availability; however, the cost of capital relative to the return available on acquisitions is such that accretive acquisitions can be negotiated. The Trust will continue to monitor the property and capital markets and explore acquisition opportunities as they arise.
Developments and EarnoutsCalloway Developments and Earnouts continue to be a significant component of Calloway’s strategic plan. As at December 31, 2009, the Trust has approximately 5.1 million square feet of potential gross leasable area that could be developed. Assuming Calloway continues to successfully manage the development of leasable area and raise the capital required for such development, the Trust plans to develop approximately 2.5 million square feet of this gross leasable area internally (“Calloway Developments”), with the balance of the space to be acquired upon completion of development and lease to third parties by SmartCentres and other vendors (“Earnouts”).
Earnouts occur where the vendors retain responsibility for managing certain developments on behalf of the Trust for additional proceeds calculated based on a predetermined, or formula-based, capitalization rate, net of land and development costs incurred by the Trust. Calloway is responsible for managing the completion of the Calloway Developments.
Professional ManagementThrough professional management of the portfolio, Calloway intends to ensure its properties portray an image that will continue to attract consumers as well as provide preferred locations for its tenants. Well-managed properties enhance the shopping experience and ensure customers continue to visit the centres. Professional management of the portfolio has contributed to a continuing high occupancy level of over 98.9% at December 31, 2009 (December 31, 2008 – 99.2%).
Financial and Operational Highlights in 2009Calloway continued its growth through acquisitions and Earnouts in 2009. During the year, it focused on managing the operation and development of existing properties and raising the capital required for future growth of the business. Highlights for the year include the following:• Maintained portfolio occupancy above 98% level.• Completed development and Earnout and lease-up of 775,490 square feet of leasable area for $186.5 million, providing an
unleveraged yield of 7.3%.• Negotiated new term financing of $265.8 million.• Issued $50 million in new Trust Units.• Closed on a new two-year $160 million operating facility.• Issued $225 million in unsecured debentures.• Issued $60 million convertible unsecured debentures and $40 million Trust Units in January 2010.
18 CALLOWAY REIT 2009 Annual Report

Selected consolidated information:
(in thousands of dollars, except per Unit and other non-financial data) 2009 2008 2007
Operational InformationNumber of properties1 127 129 133Gross leasable area (in thousands of sq. ft.) 22,750 21,879 20,174Future estimated development area (in thousands of sq ft.) 5,144 5,583 6,400Occupancy 98.9% 99.2% 99.3%Average lease term to maturity 9.1 years 9.7 years 9.8 yearsNet rental rate (per occupied sq. ft.) $13.91 $13.71 $13.40Net rental rate excluding anchors (per occupied sq. ft.)2 $19.30 $18.87 $18.12
Financial InformationReal estate assets 4,153,289 4,102,156 3,741,701Total assets 4,236,839 4,194,387 3,893,732Debt 2,726,698 2,619,797 2,298,690Debt to gross book value3 55.3% 54.3% 55.2%Interest coverage4 2.0X 2.1X 2.1XEquity (book value) 1,372,617 1,436,887 1,428,760Revenue 461,592 436,578 381,306Income from continuing operations 23,584 37,623 26,835Net operating income (NOI)5 294,300 274,580 246,214Net income 23,286 89,648 30,495Cash provided by operating activities 142,785 144,069 160,872Funds from operations (FFO)6 162,013 170,277 160,836Adjusted funds from operations (AFFO)6 152,363 159,575 152,460Distributions declared 151,075 145,948 139,167Units outstanding7 99,365,444 95,077,675 92,147,428Weighted average – basic 97,091,861 93,867,699 91,182,978Weighted average – diluted8 97,091,861 93,867,699 91,543,465
Per Unit Information (Basic/Diluted)Income from continuing operations $0.24/$0.24 $0.40/$0.40 $0.29/$0.29Net income $0.24/$0.24 $0.95/$0.95 $0.33/$0.33Funds from operations (FFO)6 $1.67/$1.67 $1.81/$1.81 $1.76/$1.75Adjusted funds from operations (AFFO)6 $1.57/$1.57 $1.70/$1.70 $1.67/$1.66Distributions $1.55 $1.55 $1.52Payout ratio9 98.6% 91.2% 91.4%
1 In the first quarter of 2009, the Trust merged three existing properties with other adjacent existing properties.2 Anchors are defined as tenants within a property with leasable area greater than 30,000 square feet.3 Defined as debt (excluding convertible debentures) divided by total assets plus accumulated amortization of income properties.4 Defined as net income plus amortization and interest expense less gain (loss) on sale of income properties divided by interest expense plus capitalized interest.5 Defined as rentals from income properties less property operating costs.6 See “Other Measures of Performance” for a reconciliation of these measures to the nearest financial statement measure.7 Total Units outstanding includes LP Units and Trust Units.8 The diluted weighted average does not include unvested options on Earnouts.9 Payout ratio is calculated as distributions per Unit divided by adjusted funds from operations per Unit.
Real Estate AssetsAs at December 31, 2009, real estate assets totalled $4,153.3 million, an increase of $51.1 million during the year. Real estate assets comprise income properties ($3,537.5 million), properties under development ($365.1 million), mortgages and loan receivables ($245.4 million) and deferred leasing costs ($5.3 million). The portfolio consists of 22.8 million square feet of built gross leasable area, 5.1 million square feet of future potential gross leasable area in 127 properties and the option to acquire 50.0% to 100.0% interests (2.3 million square feet) in 13 income properties upon their completion pursuant to the terms of mezzanine loans. The portfolio is located across Canada with assets in each of the ten provinces. The Trust targets major urban centres and shopping centres that are dominant in their trade area. By selecting well-located centres, Calloway attracts quality tenants at market rental rates.
CALLOWAY REIT 2009 Annual Report 19

Management’s Discussion and Analysis of Results of Operations and Financial Condition
Income Properties and Properties Under Development
2009 2008 2009 2008 Properties Properties Income Income Under Under(in thousands of dollars) Properties Properties Development Development
Balance – beginning of year 3,450,554 3,155,676 381,835 401,750Add: Assets from (to) held-for-sale 9,120 (94,355) – (40)
Balance – beginning of year 3,459,674 3,061,321 381,835 401,710
Developments and Earnouts completed on existing properties – costs transferred – – (85,286) (115,081)Developments and Earnouts completed on existing properties – costs plus Earnout fees 186,494 222,894 – –Acquisition of properties under development – – 14,285 18,604Acquisition of income properties 40,814 272,128 – –Development costs incurred – – 51,336 78,516Adjustment for undeveloped land obligation – – (12,145) –Disposition of properties under development – – (1,358) –Write-down of properties under development – – – (1,914)Transfer from income properties1 (16,383) – 16,383 –Building, equipment and tenant improvements on existing properties 4,793 3,134 – –Increase in accumulated amortization (137,893) (108,923) – –
Net additions 77,825 389,233 (16,785) (19,875)
Balance – End of year 3,537,499 3,450,554 365,050 381,835
1 One of the income properties (Dixie) was capitalized and transferred to properties under development in the first quarter of 2009.
20 CALLOWAY REIT 2009 Annual Report
Growth in Real Estate Assets ($ in millions)
3,289.7
2,424.9
4,102.2
05 06 07 08
4,153.3
09
3,746.8
as of December 31
122
96
133129
05 06 07 08
127
09
Number of Properties
OperatingDevelopment
117119119
107
86
101014
15
10

Acquisitions of Income PropertiesAcquisitions – 2009On August 31, 2009, the Trust completed the acquisition from SmartCentres of a 50% leasehold interest in an income property (272,595 square feet) in Richmond Hill, Ontario, for $40,814 pursuant to an existing agreement signed in 2007. The purchase price was satisfied by the proceeds received from an existing mortgage receivable of $20,756, the assumption of an existing first mortgage totalling $17,917 and the balance in cash, adjusted for other working capital amounts.
Acquisitions – 2008During 2008, the Trust acquired 1.4 million square feet of retail space in six retail properties from a joint venture between SmartCentres and Wal-Mart Canada Realty Inc. for $272.1 million, which was satisfied by the issuance of Class B Series 3 LP Units with a value of $15.1 million, the assumption of $14.1 million non-interest-bearing mortgages provided by vendors and the balance in cash.
Dispositions of Income PropertiesThere was no disposal of income property in 2009. During 2008, Calloway’s Investment Committee approved the sale of twelve income properties. Of those properties, nine income properties (795,693 square feet) were sold during 2008 for gross proceeds of $162.5 million, resulting in a gain on sale of $48.1 million. As at June 2009, management of Calloway decided to cease the sale of the three remaining operating properties (Pembroke, New Minas, Crowchild) previously held for sale as at December 31, 2008, due to a change in economic conditions. The three properties were removed from the list of discontinued properties.
Maintenance of Productive CapacityThe main focus in a discussion of capital expenditures is to differentiate between those costs incurred to achieve the Trust’s longer-term goals to produce increased cash flows and Unit distributions and those costs incurred to maintain the quality of the Trust’s cash flow.
Acquisitions of income properties and the development of existing income properties (Earnouts and developments) are the two main areas of capital expenditures that are associated with increasing the productive capacity of the Trust. In addition, there are capital expenditures incurred on existing income properties to maintain the productive capacity of the Trust (“sustaining capital expenditures”).
Sustaining capital expenditures and leasing costs are funded from operating cash flow and, as such, are deducted from FFO in order to estimate a sustainable amount (AFFO) that can be distributed to Unitholders. Sustaining capital expenditures are those of a capital nature that are not considered to add to productive capacity and are not recoverable from tenants. These costs are incurred at irregular amounts over time. Leasing costs, which include tenant allowances and leasing commissions, vary with the timing of renewals, vacancies, tenant mix and the health of the retail market. Leasing costs are generally lower for renewals of existing tenants compared to new leases.
The following is a discussion and analysis of capital expenditures of a maintenance nature (sustaining capital expenditures and leasing costs), as acquisitions and developments will be discussed elsewhere in the MD&A.
Sustaining capital expenditures totalling $1.6 million and leasing costs (tenant allowances and leasing commissions) of $4.6 million included in building, equipment, tenant allowances and deferred leasing costs on existing properties were incurred during the year ended December 31, 2009. Since Calloway’s income properties are relatively new and in good condition, management anticipates only modest increases for each of 2010 and 2011, and thus they are not expected to have an impact on the Trust’s ability to pay distributions at its current level. The large increase in tenant allowances in 2009 over the previous years was mainly due to leasing of vacant spaces as a result of bankruptcies of large tenants earlier in the year.
(in thousands of dollars, except per Unit amounts) 2009 2008 2007
Expenditures on deferred leasing costs per Consolidated Statements of Cash Flows 1,708 1,517 2,297Leasing costs for first-time tenants1 (212) (298) (1,537)
Leasing commissions 1,496 1,219 760Tenant allowances2 3,152 1,289 1,464
Total leasing costs 4,648 2,508 2,224Sustaining capital expenditures 1,641 1,845 930
6,289 4,353 3,154
Per Unit – diluted 0.065 0.046 0.034
1 Expenditures for first-time tenants are by their nature initial investments and not a cost of maintaining productive capacity.2 For the purposes of the AFFO calculations, these amounts are considered leasing costs.
CALLOWAY REIT 2009 Annual Report 21

Management’s Discussion and Analysis of Results of Operations and Financial Condition
Calloway Developments and Earnouts Completed on Existing PropertiesDuring 2009, $186.5 million of Earnouts and Calloway Developments transferred to income properties were completed, as follows:
2009 2008
Area Investment Yield Area Investment Yield(in millions of dollars) (sq. ft.) $ % (sq. ft.) $ %
Earnouts 640,814 158.0 7.0 820,500 193.4 6.8Calloway Developments 134,676 28.5 9.0 98,218 29.5 10.2
775,490 186.5 7.3 918,718 222.9 7.1
On January 29, 2010, the Trust completed the purchase of Earnouts totalling 160,424 square feet of development space from SmartCentres and other vendors for $11.9 million paid in cash.
Properties Under DevelopmentAs at December 31, 2009, properties under development totalled $365.1 million compared to $381.8 million at December 31, 2008. The net decrease of $16.7 million is after the transfer to income properties of the cost of 12 new buildings from Calloway Developments for $28.9 million and the cost of completed Earnouts of $56.4 million.
Properties under development as at December 31, 2009, comprised the following:
(in thousands of dollars) 2009 2008
Earnouts subject to option agreements1 117,878 159,587Calloway Developments subject to option agreements2 97,140 116,853Other Calloway Developments 150,032 105,395
Properties under development – end of year 365,050 381,835
1 Earnout development costs during the development period are paid by the Trust and funded through interest-bearing development loans provided by the vendors to the Trust. Upon completion of the development and the commencement of lease payments by a tenant, the Earnouts will be acquired from the vendors based on predetermined or formula capitalization rates ranging from 6.00% to 10.0%, net of land and development costs incurred. SmartCentres has contractual options to acquire Trust and LP Units upon completion of Earnout Developments as shown in note 11(b) of the consolidated financial statements for the year ended December 31, 2009. In January 2009, the Trust and SmartCentres agreed in principle to amend certain development management agreements pertaining to the Earnouts of eleven properties that currently have a floating capital-ization rate determined by reference to the ten-year Government of Canada bond rate. The proposed amendments are to include a fixed floor capitalization rate ranging from 6.00% to 7.50%.
2 SmartCentres also has the right for a period of five years, plus a five-year renewal, to subscribe for up to 5,250,000 Class B Series 1 and Series 3 LP Units at a price of $20.10 per Unit, upon the completion and rental of additional space in certain Calloway Developments, as shown in note 11(b) of the consolidated financial statements for the year ended December 31, 2009.
The total future Earnouts and developments of 5.1 million square feet includes 2.3 million square feet of properties held for future development and 2.8 million square feet under active development. The following table summarizes the estimated investment in properties under active development; it is expected the costs will be spent over the next five years:
Future Gross Costs Development Investment1 Incurred Costs Total Area (in thousands of dollars, except for area) $ $ $ (sq. ft.)
Earnouts 492,016 105,523 386,493 1,801,276Calloway Developments 241,163 82,197 158,966 993,565
Total2 733,179 187,720 545,459 2,794,841
1 Adjustments to future development are based on management’s estimates at December 31, 2009. Adjustments include acquisition of lands for development and site plan changes due to items such as, but not limited to, certification of areas, intensification of allowable density, tenant requirements, changes in tenant rents, successful property rezoning and parking requirements.
2 On completion, these projects will add 2.8 million square feet of gross leasable area to Calloway’s portfolio.
Approximately 64.5% of the properties under active development, representing 1.8 million square feet and an investment of $492.0 million, are a commitment to purchase from SmartCentres and third parties once space has been leased and built and the tenant is in occupancy and paying rent. It is management’s intention to finance the cost of construction through interim financing or operating facilities and, once rental revenue is realized, long-term financing will be negotiated. The remaining 1.0 million square feet of future space will be developed as Calloway leases space and finances the construction costs.
22 CALLOWAY REIT 2009 Annual Report

During the year ended December 31, 2009, the future properties under development pipeline decreased by 438,990 square feet. The change is summarized as follows:
Total Area (sq. ft.)
Future properties under development pipeline – Beginning of the year 5,583,264
Add: Acquisition of development land 178,475 Transfer of income property to property under development 207,325 Adjustment to projects densities 114,367Less: Disposition of development land (163,667) Completion of Earnout and development during the year (775,490)
Net adjustment (438,990)
Future properties under development pipeline – End of the year 5,144,274
The economic slowdown experienced during the end of 2008 and 2009 has had an impact on the timing of both Earnouts and Calloway Developments as tenants delay their expansion plans. As such, management has reviewed its developments and has identified certain properties where there are no immediate plans to commence any such developments. Management will evaluate development plans on these properties as they arise; however, any potential investment in development of such properties does not currently form part of Calloway’s immediate capital planning activities.
The following table shows properties designated for future development:
Costs Estimated Total Incurred1 Potential Area (in thousands of dollars, except for area) $ (sq. ft.)
Total 177,330 2,349,433
1 Part of the $365,050 of properties under development as disclosed in the consolidated financial statements as at December 31, 2009.
Mortgages, Loans and Notes Receivable
(in thousands of dollars) 2009 2008
Mortgages receivable 173,410 221,420Loans receivable 69,374 41,595Notes receivable 2,608 2,590
245,392 265,605
Mortgages ReceivableIn addition to direct property acquisitions, Calloway provides mezzanine financing to developers on terms that include an option to acquire an interest in the mortgaged property upon substantial completion. As at December 31, 2009, the Trust has total commitments of $280.1 million to fund mortgages receivable under its mezzanine loan program. Each mortgage has an option entitling the Trust to acquire a 50% to 100% interest in the property upon substantial completion at an agreed-upon formula.
As at December 31, 2009, mortgages totalling $132.4 million, secured by first, second or third charges on the properties, have been advanced to SmartCentres. During the year ended December 31, 2009, including monthly interest accruals and payments, $20.0 million was advanced. The mortgages are interest only with rates that range from 6.3% to 9%. The mortgages mature on various dates from 2010 to 2018, with options to extend under certain conditions.
Mortgages to other borrowers, totalling $41.0 million, were outstanding at the 2009 year-end. The mortgages are interest only with rates that range from 7.5% to 10.0%, are secured by first and second charges and mature on various dates from 2012 to 2015.
As at December 31, 2009, the Trust has funded $173.4 million of the total commitment at a weighted average interest rate of 7.46% per annum. Assuming that developments are completed as anticipated, and assuming that borrowers repay their mortgages in accordance with the terms of the agreements governing such mortgages, expected repayments are as follows:
CALLOWAY REIT 2009 Annual Report 23

Management’s Discussion and Analysis of Results of Operations and Financial Condition
Principal Mortgages Repayments(in thousands of dollars) # $
2010 1 11,4312011 2 12,2522012 2 26,2362013 2 14,9312014 2 71,3182015 2 13,6222017 1 9,0322018 1 14,588
13 173,410
Loans ReceivablePursuant to development agreements with SmartCentres and Hopewell Development Corporation, the Trust has advanced secured loans to fund the cost of improvements on 17 of Calloway’s properties. As at December 31, 2009, loans receivable totalling $64.2 million remain outstanding. The loans bear interest at rates that approximate the prime rate of a Canadian chartered bank plus rates ranging from 0.50% to 1.25% and are repayable upon completion and the commencement of rental payments. During 2009, the Trust advanced $54.9 million against 17 properties offset by repayments of $30.5 million on eight properties.
Loans receivable of $5.1 million have been provided pursuant to agreements with other unrelated parties. The loans bear interest at 5.20% to 5.50% and mature on various dates from 2012 and 2015. For the year ended December 31, 2009, $nil has been funded, offset by repayments of $0.13 million.
Notes ReceivableThe Trust owns a $2.6 million share of secured demand notes provided to SmartCentres, bearing interest at 9.0%.
Amounts Receivable, Prepaid Expenses and DepositsAs at December 31, 2009, amounts receivable, prepaid expenses and deposits totalled $53.6 million, a $0.6 million increase during the year. This increase is primarily due to straight-line rents receivable ($4.2 million) offset by a decrease in tenant receivables ($2.5 million) and the reduction of other receivables, prepaid expenses and deposits ($1.1 million). See note 9(a) in the consolidated financial statements for the year ended December 31, 2009, for further discussion and analysis of tenant receivables.
Amounts receivable, prepaid expenses and deposits consist of the following:
(in thousands of dollars) 2009 2008
Amounts receivable Tenant receivables – net 10,087 12,601 Other tenant receivables 7,505 7,466 Straight-line rent receivable 27,755 23,591 Other receivables 4,465 5,041
49,812 48,699
Prepaid expenses and deposits Prepaid expenses and other 3,432 3,847 Deposits 405 488
3,837 4,335
53,649 53,034
24 CALLOWAY REIT 2009 Annual Report

DebtAs at December 31, 2009, indebtedness totalling $2,726.7 million was outstanding, compared to $2,619.8 million as at December 31, 2008.
(in thousands of dollars) 2009 2008
Term debt Term mortgages 1,860,574 1,716,479 Unsecured debentures 521,452 450,000
2,382,026 2,166,479Development loans 144,323 178,896Operating and acquisition facilities 92,000 165,500Convertible debentures 123,769 122,520Deferred financing costs (15,420) (13,598)
Total 2,726,698 2,619,797
Calloway’s Declaration of Trust limits Calloway’s indebtedness to a maximum of 60% of gross book value, excluding convertible debentures, and 65% including convertible debentures. Gross book value is defined as total assets plus accumulated amortization of income properties. Total indebtedness (excluding convertible debentures) as a percentage of gross book value was 55.3% as at December 31, 2009, and 54.3% as at December 31, 2008. Total indebtedness (including convertible debentures) as a percentage of gross book value was 57.9% as at December 31, 2009, and 57.0% as at December 31, 2008.
Term DebtTerm Mortgages As at December 31, 2009, term mortgages have increased to $1,860.6 million compared to $1,716.5 million at December 31, 2008.
(in thousands of dollars) 2009 2008
Balance – beginning of year 1,716,479 1,443,254Borrowings 265,756 337,412Assumed on the acquisition of properties 17,917 –Scheduled amortization (43,379) (37,503)Repayment on maturity (91,626) –Acquisition date fair value adjustment (4,573) (5,026)Reclassified to discontinued operations – (21,658)
Balance – end of year 1,860,574 1,716,479
The term mortgages payable bear interest at a weighted average contractual interest rate of 5.90% (December 31, 2008 – 5.88%) and mature on various dates from 2010 to 2026. Including acquisition date fair value adjustments, the effective weighted average interest rate on term mortgages is 5.84% (December 31, 2008 – 5.81%). The weighted average years to maturity, including the timing for payments of principal amortization and debt maturing, is 7.4 years (December 31, 2008 – 7.2 years).
During 2009, the Trust received $265.8 million in new mortgages with an average term of 4.6 years and weighted average interest rate of 5.7%.
On January 14, 2010, the Trust entered into a five-year term mortgage totalling $16,500, bearing interest at 5.62% and secured by a specific income property.
On January 18, 2010, the Trust entered into a term mortgage totalling $20,000 bearing interest at 6.69%, maturing in 2018 and secured by a specific income property.
The Trust continues to have access to the term debt market due to its strong tenant base and high occupancy levels at mortgage loan levels ranging from 60% to 65% loan to value. Term debt maturities remain low for the next several years with $24 million (three mortgages) maturing in 2010 with a weighted average interest rate of 6.16%.
CALLOWAY REIT 2009 Annual Report 25

Management’s Discussion and Analysis of Results of Operations and Financial Condition
Future principal payments as a percentage of term debt are as follows:
Payments of Debt Weighted Principal Maturing Average(in thousands of dollars) Amortization During Year Total Total Interest RateTerm Facilities $ $ $ % %
2010 48,695 24,039 72,734 3.95 6.162011 50,310 83,265 133,575 7.25 6.222012 50,730 84,182 134,912 7.32 5.462013 48,010 232,950 280,960 15.24 6.192014 45,052 219,181 264,233 14.34 5.92Thereafter 234,762 722,093 956,855 51.90 5.80
Total 477,559 1,365,710 1,843,269 100.00 5.90Acquisition date fair value adjustment 17,305
1,860,574
The debt maturing by type of lender is as follows:
Life Insurance Conduit Pension (in thousands of dollars) Companies Loans Banks Funds TotalTerm Facilities $ $ $ $ $
2010 3,794 20,245 – – 24,0392011 50,413 11,131 – 21,721 83,2652012 70,965 – 13,217 – 84,1822013 93,471 23,846 73,666 41,967 232,9502014 – 72,497 131,392 15,292 219,181Thereafter 355,587 219,074 82,342 65,090 722,093
Total 574,230 346,793 300,617 144,070 1,365,710
Unsecured DebenturesIssued and outstanding as at December 31, 2009:
(in thousands of dollars) 2009 2008
Series A senior unsecured, due September 22, 2010, bearing interest at 4.51% per annum, payable semi-annually on September 22 and March 22;
issued on September 22, 2005 46,452 200,000
Series B senior unsecured, due October 12, 2016, bearing interest at 5.37% per annum, payable semi-annually on October 12 and April 12;
issued on October 12, 2006 250,000 250,000
Series C senior unsecured, due April 14, 2014, bearing interest at 10.25% per annum, payable semi-annually on April 14 and October 14;
issued on April 13, 2009 150,000 –
Series D senior unsecured, due June 30, 2014, bearing interest at 7.95% per annum, payable semi-annually on June 30 and December 30;
issued on June 30, 2009 75,000 –
521,452 450,000
Dominion Bond Rating Services (DBRS) provides credit ratings of debt securities for commercial issuers, which indicate the risk associated with a borrower’s capabilities to fulfill its obligations. An investment grade rating must exceed “BB,” with the highest rating being “AAA”. The Trust’s debentures are rated “BBB” with a stable trend as at December 31, 2009.
On April 13, 2009, the Trust issued $150.0 million (net proceeds including issuance costs – $148.9 million) of 10.25% Series C senior unsecured debentures due on April 14, 2014, with semi-annual payments due on April 14 and October 14 each year. The proceeds from the sale of the debentures together with $4.6 million from existing operating facilities were used to repay $153.5 million of the Trust’s Series A 4.51% senior unsecured debentures due September 22, 2010.
26 CALLOWAY REIT 2009 Annual Report

On June 30, 2009, the Trust issued $75.0 million (net proceeds including issuance costs – $74.3 million) of 7.95% Series D senior unsecured debentures due on June 30, 2014, with semi-annual payments due on June 30 and December 30 each year. The proceeds from the sale of the debenture were used to pay down the Trust’s operating facilities.
Development LoansDevelopment loans totalling $144.3 million (December 31, 2008 – $178.9 million) are outstanding as at December 31, 2009, of which $119.4 million (December 31, 2008 – $128.7 million) is interest-bearing and $24.9 million (December 31, 2008 – $50.2 million) is non-interest-bearing.
Interest-Bearing LoansThe vendor of certain properties, a joint venture between SmartCentres and Wal-Mart Canada Realty Inc., agreed to finance the costs associated with the construction and lease-up of undeveloped lands for certain assets. As at December 31, 2009, development loans totalling $17.8 million have been advanced to Calloway from that joint venture under the agreements (December 31, 2008 – $18.9 million). These loans bear variable interest rates at the banker’s acceptance rate (“BA”) plus 2% and are secured by first mortgages over specific income properties and properties under development and general assignment of leases. The loans are due the earlier of various dates in 2010 through 2014 or the date building construction is completed and the tenant is in occupancy and paying rent.
Calloway has also borrowed from third-party lenders to finance construction and leasing costs of various other properties. Development loans totalling $101.6 million as at December 31, 2009 (December 31, 2008 – $109.8 million) bear variable interest rates as follows: BA rate plus 2.0% to 2.5% on $81.0 million, prime plus 0.75% on $4.5 million and prime plus 0.5% on the remaining $16.1 million. These loans are secured by first and second mortgages registered on income properties and a general assignment of leases.
Non-Interest-Bearing LoansAs at December 31, 2009, a joint venture between SmartCentres and Wal-Mart Canada Realty Inc. has provided $25.0 million (December 31, 2008 – $50.2 million) in non-interest-bearing loans to finance certain land acquisition costs. An imputed annual cost has been calculated at rates ranging from 4.03% to 5.16%, and the loans are secured by first mortgages over specific income properties and development properties and a general assignment of leases and are due the earlier of various dates in 2010 through 2014 or the date building construction is completed and the tenant is in occupancy and paying rent.
Operating FacilitiesDuring the year ended December 31, 2009, the Trust negotiated a new operating facility to replace two existing operating facilities of $100 million and $160 million. This revolving operating facility totalling $160 million bears interest at a variable interest rate based on prime plus 2.25% or BA plus 3.25%, is secured by first charges over specific income properties and first general assignments of leases and insurance and expires on September 30, 2011. The reduced loan amount is a result of changes in underwriting criteria and one property being removed from the security pool and financed using term debt.
During the first quarter of 2009, the Trust entered into a one-year senior secured revolving operating facility for $105 million, with an option to extend for a further six months. The option to renew was not exercised as Calloway no longer required this operating line.
Convertible DebenturesOriginally issued at $55.0 million, the 6.0% convertible unsecured subordinated debentures are due June 30, 2014. The debentures are convertible at the holders’ option into Trust Units at $17.00 per Unit. The convertible debentures are redeemable at the option of Calloway in cash or Units on or after June 30, 2010. During 2009, debenture holders elected to convert $13 thousand into Trust Units. As at December 31, 2009, 6.0% convertible debentures outstanding totalled $4.8 million at face value.
Originally issued at $125.0 million, the 6.65% convertible unsecured subordinated debentures are due June 30, 2013. The debentures are convertible at the holders’ option at any time into Trust Units at $25.25 per Unit. The convertible debentures are redeemable at the option of Calloway in cash or Units on or after June 30, 2011. During 2009, debenture holders did not convert any amounts into Trust Units. As at December 31, 2009, 6.65% convertible debentures outstanding totalled $125.0 million at face value.
On January 5, 2010, the Trust issued $60 million of 5.75% convertible unsecured subordinated debentures with a conversion price of $25.75 per unit and due on June 30, 2017.
CALLOWAY REIT 2009 Annual Report 27

Management’s Discussion and Analysis of Results of Operations and Financial Condition
Financial CovenantsThe Trust’s various credit facilities provide first charge security interests on most of the properties in its portfolio of income-producing properties to various lenders. These credit facilities contain numerous terms and covenants that limit the discretion of management with respect to certain business matters. These covenants place restrictions on, among other things, the ability of the Trust to create liens or other encumbrances, to pay distributions on its Units or make certain other payments, investments, loans and guarantees and to sell or otherwise dispose of assets and merge or consolidate with another entity. In addition, the credit facilities contain a number of financial covenants that require the Trust to meet certain financial ratios and financial condition tests. For example, certain of the Trust’s loans require specific loan to value and debt service coverage ratios, which must be maintained by the Trust. A failure to comply with the obligations in the credit facilities could result in a default, which if not cured or waived, could result in a reduction or termination of distributions by the Trust and permit acceleration of the relevant indebtedness. If the indebtedness under the credit facilities were to be accelerated, there can be no assurance that the assets of the Trust would be sufficient to repay in full that indebtedness. For the year ended December 31, 2009, the Trust was in compliance with the terms and covenants of all its credit facilities.
Financial InstrumentsThe Trust has classified as loans and receivables its cash and cash equivalents, mortgages and loans receivable, financial assets included in amounts receivable, and deposits, and its debt and financial liabilities included in accounts payable and accrued liabilities as other financial liabilities. Both loans and receivables and other financial liabilities are initially measured at fair value and subsequently measured at amortized cost using the effective interest method. These financial instruments are used in the normal course of business.
The Trust’s amounts receivable, deposits, and accounts payable and accrued liabilities are carried at cost, which approximates their fair value because of the short period to receipt or payment of cash. The fair value of the convertible and unsecured debentures is based on their market price. The fair values of other financial instruments are estimated based on discounted future cash flows using discounted rates that reflect current market conditions for instruments with similar terms and risks. Such fair value estimates are not necessarily indicative of the amounts the Trust might pay or receive in actual market transactions.
The Trust is exposed to interest rate and financing risks and credit risks on certain of its financial instruments (see note 21 in the consolidated financial statements for the year ended December 31, 2009, for further discussion).
Unitholders’ Equity
(in thousands of dollars) 2009 2008
Unitholders’ equity – beginning of year 1,436,887 1,428,760Issuance of Units, net of issuance cost 63,506 55,162Conversion of debentures, net of financing cost 13 551Fair value of options issued – 1,684Equity component of convertible debentures issued – 7,030Net income for the year 23,286 89,648Distributions for the year (151,075) (145,948)
Unitholders’ equity – end of year 1,372,617 1,436,887
As at December 31, 2009, Unitholders’ equity totalled $1,372.6 million (December 31, 2008 – $1,436.9 million), including $7.2 million pertaining to the allocation of the equity component of convertible debentures. As at December 31, 2009, Unit equity totalled $1,814.8 million and Units outstanding, including Class B LP Units, Class D LP Units and Class B LPII Units of subsidiary partnerships, totalled 99,365,444. During the year ended December 31, 2009, the Trust issued 4,267,839 Trust Units and 19,930 Class B and Class D Units.
During the year ended December 31, 2009, holders of $0.01 million face value of convertible debentures elected to convert and received 764 Trust Units. These conversions increased the Trust’s capital by $0.01 million.
28 CALLOWAY REIT 2009 Annual Report

During the year ended December 31, 2009, the Trust issued $63.5 million in Units as follows:
LP Units Trust Units Class B/Class D Total Units 2009(in thousands of dollars, except per Unit amounts) # # # $
New issuance 3,226,000 – 3,226,000 50,003Earnout options exercised 32,489 19,930 52,419 937Distribution reinvestment plan (DRIP) 969,090 – 969,090 12,837Debentures converted 764 – 764 13DUP Units converted into Trust Units 39,496 – 39,496 –
Total 4,267,839 19,930 4,287,769 63,790
Deferred Unit plan 1,877Unit issuance costs (2,148)
Total change in Unit equity 63,519
On January 5, 2010, the Trust issued 2.1 million Trust Units at a price of $19.05 per unit for gross proceeds of $40.0 million (net $38.4 million).
Distributions declared by the Trust totalled $151.1 million during the year ended December 31, 2009 (December 31, 2008 – $145.9 million) or $1.55 per Unit (December 31, 2008 – $1.55 per Unit). The Trust paid $138.6 million in cash and the balance by issuing 969,090 Trust Units under the distribution reinvestment plan. The Unitholders approved an amendment to the Declaration of Trust at their annual meeting of the Unitholders on May 7, 2009, to remove the requirement to distribute its taxable income and to provide Trustees with the discretion to make further amendments to accommodate the impact of IFRS. The implementation of this change at this time will ensure the Trust continues to account for its issued and outstanding Trust Units and distributions paid as part of Unitholders’ equity. Without this change, under IFRS, the Trust Units would have been classified as a liability with all future distributions treated as interest expense.
Distributions to Unitholders in 2009, as compared to 2008, were as follows:
(in thousands of dollars) 2009 2008
Distributions to Unitholders 151,075 145,948Distributions reinvested through DRIP (12,452) (18,614)
Net cash outflow from distributions to Unitholders 138,623 127,334
DRIP as a percentage of distributions to Unitholders 8.2% 12.8%
Capital Resources and LiquidityAs at December 31, 2009, the Trust has the following capital resources available:
(in thousands of dollars)
Cash and cash equivalents 27,486Unused operating facilities 143,806
Total capital resources at December 31, 2009 171,292
On the assumption that occupancy levels remain strong and on the assumption that it will be able to obtain financing on reasonable terms, the Trust anticipates meeting all current and future obligations. Management expects to finance future acquisitions, including committed Earnouts, mezzanine loans, development and maturing debt from: (i) existing cash balances; (ii) a mix of mortgage debt secured by income properties, operating facilities, issuance of equity and convertible/unsecured debentures; and (iii) repayments of mortgages receivable and the sale of non-core assets. Cash flow generated from operating activities is the source of liquidity to service debt (except maturing debt), sustaining capital expenditures, leasing costs and unit distributions.
As at December 31, 2009, the Trust increased its capital resources by $89.0 million compared to December 31, 2008. This net increase in cash position is after funds obtained from new term mortgages ($265.8 million) were invested into further Earnouts, developments and mortgages and used to repay maturing debt.
CALLOWAY REIT 2009 Annual Report 29

Management’s Discussion and Analysis of Results of Operations and Financial Condition
The Trust manages its cash flow from operating activities by maintaining a target debt level. The debt to gross book value, as defined in the Declaration of Trust, at December 31, 2009, is 55.3%, excluding convertible debentures. Including the capital resources at December 31, 2009, the Trust could invest an additional $100.2 million in new investments and remain at the mid-point of the Trust’s target debt to gross book value range of 55% to 60%.
Future obligations, excluding the development pipeline, total $2,847.9 million as identified in the following schedule. Other than contractual maturity dates, the timing of payment of these obligations is management’s best estimate based on assumptions with respect to the timing of leasing, construction completion, occupancy and Earnout dates at December 31, 2009.
(in thousands of dollars) Total 2010 2011 2012 2013 2014 Thereafter
Mortgages payable 1,843,269 72,734 133,575 134,912 280,960 264,233 956,855Revolving operating facilities (secured)1 92,000 33,000 59,000 – – – –Unsecured debentures 521,452 46,452 – – – 225,000 250,000Construction loans2 101,601 95,930 5,671 – – – –Related-party loan 42,722 16,339 18,484 7,899 – – –Convertible debentures 129,815 – – – 125,000 4,815 –Mortgage receivable advances3 106,725 25,517 36,294 30,550 7,711 2,972 3,681Development obligations 10,286 10,286 – – – – –
2,847,870 300,258 253,024 173,361 413,671 497,020 1,210,536
1 The Trust expects the revolving operating facility to be renewed and extended as required.2 $101.6 million represents construction loans on certain properties under development from various bank lenders, which typically have a maturity of one year. These loans are
reviewed annually by the lenders and are renewed and extended as required from time to time to coincide with the progress of the development.3 Mortgages receivable of $173.4 million at December 31, 2009, and further commitments of $106.7 million mature over a period extending to 2018 if the Trust does not exer-
cise its option to acquire the income properties. Refer also to “Mortgages Receivable” section for timing of principal repayments.
It is management’s intention to refinance maturing term debt at amounts equal to, or greater than, those amounts due, based on increased revenues and amortized debt levels on the pledged assets.
The following summarizes maturities for existing term mortgages: Debt Maturing Current Loan to Mortgages During Year Base Rent Value(in thousands of dollars) # $ $ %1
2010 3 24,039 5,019 372011 4 83,265 12,236 532012 5 84,182 13,955 472013 13 232,950 40,954 442014 11 219,181 32,928 51Thereafter 54 722,093 171,427 33
Total 90 1,365,710 276,519 38
1 Assuming a 7.5% capitalization rate (“Cap Rate”) and 3% property management fee.
Potential upfinancing on maturing term debt of $24.0 million in 2010 and $83.3 million in 2011 is as follows:
(in thousands of dollars) 2010 2011
Cap Rate Cap Rate Cap Rate Cap Rate Cap Rate Cap RateLoan to Value 7.0% 7.5% 8.0% 7.0% 7.5% 8.0%
55% 14,210 11,600 9,429 9,992 3,775 (1,665)60% 17,687 14,905 12,471 18,470 11,688 5,75365% 21,164 18,151 15,514 26,948 19,601 13,172
Management anticipates the 6.00% unsecured subordinated convertible debentures will convert into equity prior to their maturity based on the assumption that the trading value of Calloway Units will exceed the conversion price, and the 6.65% and 5.75% unsecured subordinated convertible debentures will not be converted. The development loan repayments, mortgage receivable advances and development obligations will be funded by additional term mortgages, net proceeds on the sale of non-core assets, existing cash or operating lines, the issuance of convertible and unsecured debentures, and equity units, if necessary.
30 CALLOWAY REIT 2009 Annual Report

Calloway’s potential development pipeline of $1,190.5 million consists of $646.1 million in Earnouts and $544.4 million in developments. Costs totalling $365.1 million have been incurred to date (including $43.3 million of non-cash development comprising future land obligations and value of Earnout options) with a further $868.7 million still to be funded. The future funding includes $528.2 million for Earnouts that will be paid once a lease has been executed, the space built and the tenant is in occupancy paying rent. The remaining $340.5 million of development will proceed once Calloway has an executed lease and financing in place. Management expects this pipeline to be developed over the next three to five years.
Potential Future Pipeline:
(in thousands of dollars) Total Funded Balance to Fund
Earnouts 646,082 117,878 528,204Calloway Developments 544,393 203,904 340,489Non-cash development cost 43,268 43,268 –
Sub-total 1,233,743 365,050 868,693Less: Non-cash development cost (43,268) (43,268) –
Aggregate pipeline 1,190,475 321,782 868,693
The following schedule includes committed obligations for 2010 and 2011 (which are included in the potential future pipeline noted above) as at December 31, 2009:
Committed Pipeline:
(in thousands of dollars) Total Funded Balance to Fund
Committed pipeline for the year 2010 Balance – Beginning of the year 112,089 30,459 81,630 Changes during the year 42,478 18,085 24,393
Balance – end of the year 154,567 48,544 106,023
Committed pipeline for the year 2011 Balance – beginning of the year 24,817 7,015 17,802 Changes during the year 30,163 12,946 17,217
Balance – end of the year 54,980 19,961 35,019
Total committed pipeline 209,547 68,505 141,042
Potential financing sources for committed Earnouts and Calloway Developments and other commitments based on completing Earnouts, maintaining existing tenants at current or higher rental rates and obtaining financing on acceptable terms are as follows:
(in thousands of dollars) 2010 2011 Total
Uses: Committed Earnouts and Calloway Developments 106,023 35,019 141,042 Amortization of mortgage principal 48,695 50,310 99,005 Mezzanine loan advances 25,517 36,294 61,811 Repayment of maturing revolving credit facility2 33,000 – 33,000 Unsecured debentures 46,452 – 46,452
259,687 121,623 381,310
Sources: Existing cash and operating facilities1 159,532 11,760 171,292 Less: Availability of maturing revolving credit facility2 (72,000) – (72,000) Equity and convertible debenture issuance in January 96,155 – 96,155 Construction financing 6,000 3,000 9,000 Up-financing of maturing mortgages 15,000 12,000 27,000 Financing of unencumbered assets3 36,000 83,863 119,863 Dividend Reinvestment Plan and Earnout Options 19,000 11,000 30,000
259,687 121,623 381,310
1 Includes cash and unused balances from all existing operating facilities.2 The $105 million revolving credit facility matured in January 2010, $72 million is included in existing operating facility and $33 million was repaid at maturity.3 Includes mortgages closed in January 2010 for St. Catharines ($16 million) and Oshawa North ($20 million). There is an additional estimated $100 million of potential
up-financing based on the value of certain unencumbered assets in the portfolio.
CALLOWAY REIT 2009 Annual Report 31

Management’s Discussion and Analysis of Results of Operations and Financial Condition
Results of OperationsCalloway’s real estate portfolio has grown through acquisitions, completed developments and Earnouts during the course of the past year. As a result, there are increases in operating results for the year ended December 31, 2009, compared to the year ended December 31, 2008.
Rentals from income properties for 2009 totalled $447.0 million, a $31.5 million or 7.6% increase over 2008. Base rent increased by $21.2 million or 7.3% primarily due to acquisitions and Earnouts that occurred during 2008 and 2009. Property operating costs recovered increased by $10.2 million or 8.2% due to the related increases in recoverable costs with the growth in the portfolio. Non-recoverable operating costs of $5.3 million incurred during 2009 include prepaid land rent ($2.9 million), bad debts ($1.1 million) and other non-recoverable costs including operating expenses relating to vacant units maintenance and re-leasing ($1.3 million). The Trust recovered 94.5% of total recoverable expenses this year compared to the 95.8% in the prior year. The decrease is mainly a result of higher vacancy. NOI as a percentage of rentals from income properties has decreased by 0.3% due to the decrease in the property operating cost recoveries and the increase in non-recoverable expenses.
In comparison to 2008, NOI increased by $19.7 million, primarily as a result of the growth of the portfolio due to Earnouts and completed development.
(in thousands of dollars) 2009 2008
Base rent 309,708 288,541Property operating cost recoveries 134,431 124,211Administration fee recoveries 2,857 2,723
Rentals from income properties 446,996 415,475
Recoverable costs 142,267 129,632Property management administrative costs 4,301 5,252Management fees 796 788Non-recoverable costs 5,332 5,223
Total property-specific costs 152,696 140,895
Net operating income 294,300 274,580
NOI as a percentage of rentals from income properties 65.8% 66.1%
Rentals from income properties account for 96.8% of revenues for the year ended December 31, 2009, with 71.8% of the portfolio located in Ontario and Quebec, primarily in the Greater Toronto and Montreal areas. The balance of the portfolio is located across Canada.
The five largest tenants account for 40.6% of portfolio revenue as follows:1
RevenuesTenants %
Wal-Mart2 26.4Canadian Tire/Mark’s Work Wearhouse 4.0HBC 3.6Best Buy/Future Shop 3.5Reitmans Group of Companies 3.1
1 Annualized December 31, 2009.2 Calloway has a total of 72 Wal-Marts under lease, of which 23 are SuperCentres. An additional nine expansions are expected to be completed by the end of 2010. The Trust has
19 centres with Wal-Mart as shadow anchors, of which six are SuperCentres.
32 CALLOWAY REIT 2009 Annual Report
Gross Revenue by Province
1. Ontario 58%
2. Quebec 14% 3. British Columbia 10% 4. Manitoba 5% 5. Saskatchewan 4%
6. Newfoundland and Labrador 3%
7. Alberta 3% 8. Nova Scotia 1% 9. New Brunswick 1%
10. Prince Edward Island 1%2
3
4
56 7 8910
1

Net Operating IncomeNOI from continuing operations is defined as rentals from income properties less property operating costs. NOI from acquisitions, Earnouts and development activities highlights the impact each component has on NOI. Straight-lining of rent and other adjustments have been excluded from NOI attributed to same properties, acquisitions, Earnouts and development activities in the table below.
The same properties’ NOI for 2009 remains unchanged from the prior year. Vacancy expenses including rental loss and recovery shortfalls as a result of bankruptcies that occurred in early 2009 were offset by step rents and new leasing at favourable rates. The same property NOI is expected to improve in 2010 as vacant space leased up in the fourth quarter of 2009 contributes to the results. In addition, NOI before adjustments increased 8.6% to $292.8 million from $269.5 million in the previous year. The increase was primarily due to acquisitions ($9.1 million), Earnouts from SmartCentres and developments ($14.3 million) made during 2009. Included in lease termination fees and other adjustments in 2008 is rental revenue from a property totalling $1.2 million, which is capitalized to properties under development in 2009. Management’s estimate of the annual property run-rate NOI (excluding the impact of straight-line rent and other adjustments) at December 31, 2009, is $301.8 million. “Same properties” in the chart below refer to those income properties that were owned by the Trust on January 1, 2008, and throughout 2008 and 2009.
(in thousands of dollars)NOI 2009 2008
Same properties 249,019 249,1542008 acquisitions 18,385 10,1742009 acquisitions 850 –Earnouts and developments 24,510 10,191
NOI before adjustments 292,764 269,519Land rent (2,704) (3,153)Lease termination and other adjustments 194 2,393Straight-lining of rents 4,046 5,821
NOI 294,300 274,580
Leasing Activities and ExpiriesLeasing ActivitiesThe recovery of consumer confidence that started in the second half of 2009 is projected to continue into 2010. In the Canadian economy, the threat of bankruptcies was one of the top issues that dominated 2009. Relatively speaking, Canadian retailers have weathered the storm well. Within the Calloway portfolio, a few bankruptcies were experienced, totalling 260,747 square feet, which represented 1.1% of the portfolio. The majority occurred in the first half of 2009 in the home furnishing sector of the retail market. This trend was in line with what other major landlords have been reporting. With these positive signs of recovery, Calloway’s portfolio is in a position to continue to improve and grow into 2010.
The Trust continues to work towards reducing its vacancy and retaining existing tenants. During the year 2009, the Trust was successful in these areas. In 2009, the Trust’s vacancy consistently dropped quarter after quarter to end the year at 250,507 square feet, representing a total vacancy of 1.1% of the portfolio. This is a substantial reduction given Calloway’s vacancy was at an all-time high of 379,142 square feet as reported in the first quarter of 2009. The vacancy levels at the end of 2009 represent levels experienced prior to the downturn in the economy. In addition to the reduction, the Trust completed an additional 66,048 square feet of forward lease commitments. Calloway is committed to further reducing vacancy levels in 2010 and securing quality tenants to further strengthen its centres.
2009 Lease ExpiriesTenant retention was very important to the Trust over 2009. Calloway achieved a retention rate of 90% of all tenant leases expiring in 2009. A total of 460,756 square feet of the 511,511 square feet of leases expiring in 2009 have been renewed with an average increase in rental rate of over 7.5%. Calloway’s goal for 2010 is to continue to maintain a high level of retention and to replace weaker tenants with those that are reflective of the quality of its centres.
CALLOWAY REIT 2009 Annual Report 33

Management’s Discussion and Analysis of Results of Operations and Financial Condition
The following table shows lease expiries for the total portfolio:
Annualized Average Rent Area Area Base Rent per sq. ft.1Year of Expiry (sq. ft.) % $000s $
Month-to-month 24,956 0.1% 392 15.692010 440,851 1.9% 7,170 16.262011 1,054,343 4.6% 17,550 16.652012 1,011,545 4.5% 18,481 18.272013 1,651,004 7.3% 33,194 20.112014 1,415,383 6.2% 25,638 18.112015 1,311,450 5.8% 22,610 17.24Beyond 15,589,768 68.5% 187,908 12.05Vacant 250,507 1.1% – –
Total 22,749,807 100.0% 312,943 13.91
1 The average rent per square foot excludes vacant space of 250,507 square feet.
The following table shows lease expiries for the portfolio, excluding anchor tenants:1
Annualized Average Rent Area Area Base Rent per sq. ft.2Year of Expiry (sq. ft.) % $000s $
Month-to-month 24,956 0.1% 392 15.692010 440,851 1.9% 7,170 16.262011 784,934 3.5% 14,197 18.092012 963,766 4.2% 18,006 18.682013 1,339,697 5.9% 27,223 20.322014 1,157,497 5.1% 22,761 19.662015 985,977 4.3% 19,057 19.33Beyond 3,541,922 15.6% 69,477 19.62Vacant 197,750 0.9% – –
Total 9,437,350 41.5% 178,283 19.30
1 An anchor tenant is defined as any tenant with leasable area greater than 30,000 square feet.2 The average rent per square foot excludes vacant space of 197,750 square feet.
In addition to the modest lease expiries providing downside protection during this economic slowdown, assuming no early tenant vacancies, there is also potential for rental increases on these lease maturities as follows:
Net Rents Contractual Market Additional(in thousands of dollars) Area Area Expiring Rents1 Rents2 Rent3 Year of Expiry (sq. ft.) % $ $ $ $
Month-to-month 24,956 0.1% 392 119 348 752010 440,851 1.9% 7,170 3,469 4,216 5152011 1,054,343 4.6% 17,550 6,041 12,439 930Vacant 250,507 1.1% – – 4,229 4,229
Total 1,770,657 7.7% 25,112 9,629 21,232 5,749
1 Leases at maturity with option to renew at a predetermined rate.2 Lease renewals at estimated market rent.3 Additional rent is calculated based on the difference between market and contractual rents less net rent expiring on those spaces.
Interest and Other IncomeInterest income of $14.6 million for the year ended December 31, 2009, has decreased by $6.5 million over the prior year. This decrease is due to the Trust’s decreased investment in mezzanine mortgage loans during 2009. Bank interest has declined by $0.6 million in 2009 over the prior year due to lower bank balances.
(in thousands of dollars) 2009 2008
Mortgage and loan interest 14,034 19,986Bank interest 327 890Note receivable interest 235 227
Interest income 14,596 21,103
34 CALLOWAY REIT 2009 Annual Report

Interest ExpenseInterest costs incurred during 2009 totalled $153.7 million, net of the $4.6 million amortization of acquisition date fair value adjustments. Interest capitalized to properties under development totalled $13.6 million, and the balance of $140.1 million was expensed. The increase in interest expense of $15.7 million in 2009 over 2008 is a result of:
The $150.0 million Series C 10.25% senior unsecured debentures issued on April 13, 2009, used to repay $153.5 million of the Series A 4.51% senior unsecured debentures, increased interest expense by $6.7 million in 2009 ($8.7 million annualized).
The $75.0 million Series D 7.95% senior unsecured debentures issued on June 19, 2009, used to repay $75.0 million of operating facility lines that were due, increased interest expense by $3.0 million in 2009 ($6.0 million annualized).
Amortization of accretion on $125 million 6.65% convertible debenture issued on May 2, 2008, totalled $1.3 million.
Interest expenses and amortization of deferred financing costs on new term financing and non-revolving operating facilities ($4.8 million).
(in thousands of dollars) 2009 2008
Interest at contract rate 150,950 137,334Acquisition date fair value adjustment (4,573) (5,026)Amortization of accretion on 6.65% convertible debentures 1,262 –Amortization of deferred financing costs 6,041 4,631
153,680 136,939Less: Capitalized interest (13,607) (12,611)
Interest expense 140,073 124,328
Weighted average interest rate (inclusive of acquisition date fair value adjustment) 5.8% 5.8%
AmortizationAmortization of $135.8 million for the year ended December 31, 2009, has increased by $12.5 million over 2008. This increase is primarily due to the higher write-off of tenant improvements and intangible assets related to tenant bankruptcies during 2009 ($7.7 million) and additional amortization expenses ($4.8 million) resulting from the growth of Calloway’s portfolio in 2008 and 2009.
(in thousands of dollars) 2009 2008
Income properties Tangible assets 84,608 73,835 Intangible assets 50,644 49,051Deferred leasing costs 576 448
135,828 123,334
General and AdministrativeDuring the year ended December 31, 2009, total general and administrative costs before allocations to property operating costs and capitalization decreased by $1.6 million over 2008, due to the downsizing and outsourcing to SmartCentres of the administration of development activities. Costs allocated to property operations have decreased by $1 million, primarily as a result of internal restructuring of resources and the decrease in the number of properties in the portfolio. The net general and administrative expenses have increased by $0.8 million, due to appraisals and other professional fees related to IFRS and due to reduced costs capitalized to properties under development resulting from reduced volume of development in 2009 compared to 2008 offset by reduced development salaries.
(in thousands of dollars) 2009 2008
Salaries and benefits 11,887 13,541Professional fees 2,579 1,974Public company costs 1,098 957Rent and occupancy 1,516 1,488Other 1,523 2,292
18,603 20,252Less: Allocated to property operating costs (8,588) (9,566)Less: Capitalized to properties under development (604) (2,096)
General and administrative costs 9,411 8,590
As a percentage of revenue 2.0% 2.0%
CALLOWAY REIT 2009 Annual Report 35

Management’s Discussion and Analysis of Results of Operations and Financial Condition
Results From Operations – Fourth QuarterNet income for the quarter ended December 31, 2009, decreased $9.0 million from the same quarter of 2008. The decrease is a result of higher interest expense ($5.3 million), lower mezzanine loan interest revenue ($2.0 million) and the gain on sale of income properties in 2008 ($4.0 million), partially offset by the rental revenue increase due to growth of the portfolio ($2.3 million). The fourth quarter gross margin for 2009 (defined as rentals from income properties less property operating costs) is 1.9% lower than the gross margin in the quarter ended December 31, 2008, primarily due to an increase in common area maintenance and tax recovery shortfall due to vacancies and adjustments for prior billings.
Three Months Three Months Ended Ended December 31, December 31,(in thousands of dollars) 2009 2008
Revenues Rentals from income properties 116,214 109,604 Interest and other income 3,860 5,825
120,074 115,429
Expenses Property operating costs 41,243 36,814 Interest 38,323 33,029 Amortization 30,946 30,877 General and administrative 2,089 2,138 Write-down of properties under development – 95
112,601 102,953
Income from continuing operations 7,473 12,476Income (loss) from discontinued operations (16) 3,947
Net income for the period 7,457 16,423
NOI as a percentage of rentals from income properties 64.5% 66.4%
Net Operating Income – Fourth QuarterFor the quarter ended December 31, 2009, the same properties’ NOI decreased by 0.72% over the same period of the prior year due primarily to rental revenue loss and lower recoveries as a result of higher vacancy compared to the same quarter in 2008. NOI before adjustments in the fourth quarter of 2009 increased 4.7% to $74.9 million from $71.5 million in the same period in the previous year. The increase was primarily due to acquisitions ($0.6 million), Earnouts from SmartCentres and developments ($3.2 million) made during 2008 and 2009, offset by increased vacancies ($0.5 million). Included in lease termination and other adjustments in the prior year is rental revenue from a property totalling $0.3 million, which was capitalized to properties under development in 2009. “Same properties” in the chart below refer to those income properties that were owned by the Trust on October 1, 2008, and throughout the rest of 2008 and 2009.
Three Months Three Months Ended Ended(in thousands of dollars) December 31, December 31,NOI 2009 2008
Same properties 70,548 71,0572009 acquisitions 633 –Earnouts and developments 3,701 487
NOI before adjustments 74,882 71,544Land rent (831) (847)Lease termination and other adjustments 81 902Straight-lining of rents 839 1,191
NOI 74,971 72,790
Other Measures of PerformanceThe following are measures sometimes used by Canadian real estate income trusts (REITs) as indicators of financial performance. Management uses these measures to analyze operating performance. As one of the factors that may be considered relevant by prospective investors is the cash distributed by the Trust relative to the price of the Units, management believes these measures are a useful supplemental measure that may assist prospective investors in assessing an investment in Units. The Trust considers the following measures to be meaningful additional measures of cash flow performance as they more clearly measure normalized and stabilized cash flow as opposed to cash flow from operating activities calculated in accordance with Canadian GAAP, which reflects seasonal fluctuations in working capital and other items. Calloway analyzes its cash distributions against these measures to assess the
36 CALLOWAY REIT 2009 Annual Report

stability of the monthly cash distributions to Unitholders. As these measures are not standardized as prescribed by Canadian GAAP, they may not be comparable to similar measures presented by other trusts. These measures are not intended to represent operating profits for the period nor should they be viewed as an alternative to net income, cash flow from operating activities or other measures of financial performance calculated in accordance with Canadian GAAP. The calculations are derived from the consolidated financial statements for the year ended December 31, 2009, do not include any assumptions, do not include any forward-looking information and are consistent with prior reporting periods.
Adjusted Funds From Operations (AFFO)Since FFO does not consider capital transactions, AFFO is presented herein as an alternative measure of determining available cash flow. AFFO is not defined by Canadian GAAP. AFFO for the three months ended December 31, 2009, totalled $35.8 million (December 31, 2008 – $41.6 million), and the payout ratio totalled 107.6% (December 31, 2008 – 88.9%). AFFO for the year ended December 31, 2009, totalled $152.4 million (2008 – $159.6 million), and the payout ratio totalled 98.6% (2008 – 91.2%). Calloway targets a payout ratio of approximately 95% of AFFO.
In comparison to the same quarter of the prior year, AFFO decreased by $5.8 million in the fourth quarter of 2009, primarily due to a decrease in mezzanine loan interest revenue ($2.0 million), an increase in interest expense ($4.0 million) and leasing costs to fill vacant space ($1.9 million), partially offset by an increase in NOI ($2.1 million).
In comparison to the prior year, AFFO decreased ($7.2 million) in the fourth quarter of 2009 primarily due to a decrease in mezzanine loan interest revenue ($6.6 million), an increase in interest and finance expense ($12.5 million) and leasing costs to fill vacant space ($1.9 million), partially offset by an increase in NOI ($13.8 million).
Funds From Operations (FFO)While FFO is not defined by Canadian GAAP, it is a non-Canadian GAAP financial measure of operating performance widely used by the real estate industry. The Real Property Association of Canada (REALpac) recommends that FFO be determined by reconciling from net income, whereas the Trust starts the reconciliation from cash provided from operating activities. FFO for the three months ended December 31, 2009, totalled $40.1 million (three months ended December 31, 2008 – $44.7 million), and the payout ratio totalled 96.0% (three months ended December 31, 2008 – 83.0%). FFO for the year ended December 31, 2009, totalled $162.0 million (2008 – $170.3 million), and the payout ratio totalled 92.8% (2008 – 85.7%). See AFFO section for the reason FFO has decreased and payout ratio has increased.
Distributable Income (DI)DI has historically been used as an indicator of financial performance in the REIT industry. The calculation of DI is not comparable from REIT to REIT, and the differences in methodology can be significant. DI for the three months ended December 31, 2009, totalled $38.3 million (three months ended December 31, 2008 – $42.1 million), and the payout ratio totalled 100.4% (three months ended December 31, 2008 – 87.7%). DI for the year ended December 31, 2009, totalled $154.1 million (2008 – $158.9 million), and the payout ratio totalled 97.5% (2008 – 91.6%). See AFFO section for the reason DI has decreased and the payout ratio has increased.
For the year ended December 31, 2009, AFFO, FFO and DI are computed as follows:
(in thousands of dollars, except per Unit amounts) AFFO FFO DI
Cash provided by operating activities 142,785 142,785 142,785Capital lease obligation interest (63) (63) (63)Deferred Unit compensation expense (642) (642) (642)Expenditures on deferred leasing costs 1,708 1,708 1,708Changes in other non-cash operating items 16,908 16,908 16,908Amortization of: Deferred financing costs (6,041) (6,041) (6,041) Deferred leasing costs (576) – (576) Acquisition date fair value adjustment 4,573 4,573 – Accretion on Convertible Debentures – (1,262) –Straight-lining of rents – 4,047 –Sustaining capital expenditures (1,641) – –Leasing costs (4,648) – –
152,363 162,013 154,079
Per Unit – basic/diluted1 $1.569/$1.569 $1.669/$1.669 $1.587/$1.587Payout ratio 98.6% 92.8% 97.5%
CALLOWAY REIT 2009 Annual Report 37

Management’s Discussion and Analysis of Results of Operations and Financial Condition
For the year ended December 31, 2008, AFFO, FFO and DI are computed as follows:
(in thousands of dollars, except per Unit amounts) AFFO FFO DI
Cash provided by operating activities 144,069 144,069 144,069Capital lease obligation interest (57) (57) (57)Deferred Unit compensation expense (683) (683) (683)Expenditures on deferred leasing costs 1,517 1,517 1,517Changes in other non-cash operating items 19,135 19,135 19,135Amortization of: Deferred financing costs (4,631) (4,631) (4,631) Deferred leasing costs (448) – (448) Acquisition date fair value adjustment 5,026 5,026 –Straight-lining of rents – 5,901 –Sustaining capital expenditures (1,845) – –Leasing costs (2,508) – –
159,575 170,277 158,902
Per Unit – basic/diluted1 $1.700/$1.697 $1.814/$1.807 $1.693/$1.690Payout ratio 91.2% 85.7% 91.6%
1 Diluted AFFO, FFO and DI per Unit are adjusted for the dilutive effect of the Convertible Debentures, which are not dilutive for net income purposes. To calculate diluted AFFO, FFO and DI per Unit for the years ended December 31, 2009 and 2008, Convertible Debenture interest of $8,622 and $5,838 and amortization of accretion on Convertible Debentures of $1,262 and $nil (FFO only) are added back to net income, and 5,234,425 Units and 3,600,465 Units are added back to the weighted average Units outstanding, respectively.
For the three months ended December 31, 2009, AFFO, FFO and DI are computed as follows:
(in thousands of dollars, except per Unit amounts) AFFO FFO DI
Cash provided by operating activities 36,749 36,749 36,749Capital lease obligation interest (17) (17) (17)Deferred Unit compensation expense (165) (165) (165)Expenditures on deferred leasing costs 438 438 438Changes in other non-cash operating items 3,023 3,023 3,023Amortization of – – – Deferred financing costs (1,524) (1,524) (1,524) Deferred leasing costs (162) – (162) Acquisition date fair value adjustment 1,125 1,125 – Accretion on Convertible Debentures – (325) –Straight-lining of rents – 840 –Sustaining capital expenditures (1,089) – –Leasing costs (2,593) – –
35,785 40,144 38,342
Per Unit – basic/diluted1 $0.360/$0.360 $0.403/$0.403 $0.385/$0.385Payout ratio 107.6% 96.0% 100.4%
For the three months ended December 31, 2008, AFFO, FFO and DI are computed as follows:
(in thousands of dollars, except per Unit amounts) AFFO FFO DI
Cash provided by operating activities 50,631 50,631 50,631Capital lease obligation interest (15) (15) (15)Deferred Unit compensation expense (312) (312) (312)Expenditures on deferred leasing costs 512 512 512Changes in other non-cash operating items (7,516) (7,516) (7,516)Amortization of income properties Deferred financing costs (1,040) (1,040) (1,040) Deferred leasing costs (128) – (128) Acquisition date fair value adjustment 1,222 1,222 –Straight-lining of rents – 1,193 –Sustaining capital expenditures (44) – –Leasing costs (1,742) – –
41,568 44,675 42,132
Per Unit – basic/diluted1 $0.437/$0.435 $0.470/$0.466 $0.443/$0.441Payout ratio 88.9% 83.0% 87.7%
1 Diluted AFFO, FFO and DI per Unit are adjusted for the dilutive effect of the Convertible Debentures, which are not dilutive for net income purposes. To calculate diluted AFFO, FFO and DI per Unit for the three months ended December 31, 2009 and 2008, Convertible Debenture interest of $2,133 and $2,143 and amortization of accretion on Convertible Debentures of $325 and $nil (FFO only) are added back to net income, and 5,234,037 Units and 5,234,566 Units are added back to the weighted average Units outstanding, respectively.
38 CALLOWAY REIT 2009 Annual Report

Distributable Cash
In any given period, the distributions declared may differ from cash provided by operating activities primarily due to seasonal fluctuations in non-cash operating items (amounts receivable, prepaid expenses, deposits, accounts payable and accrued liabilities). These seasonal or short-term fluctuations are funded, if necessary, by the revolving operating facilities. In addition, the distributions declared include a component funded by the DRIP. Management also anticipates that distributions declared would in the foreseeable future continue to exceed net income, as net income includes amortization, and distributions are determined based on non-GAAP cash flow measures, which include consideration of the maintenance of productive capacity.
For the year ended December 31, 2009, distributions declared exceeded cash provided by operating activities by $8.3 million. This shortfall was sufficiently financed by the DRIP. Distributions declared exceeded net income by $127.8 million for the year ended December 31, 2009. This difference mainly comprises amortization ($144.6 million) offset by other non-cash components of net income ($16.8 million).
Management determines the Trust’s Unit cash distribution rate by, among other considerations, its assessment of cash flow as determined using certain non-GAAP measures. As such, management feels the cash distributions are not an economic return of capital, but a distribution of sustainable cash flow from operations. Management targets a payout ratio of approximately 95.0% of AFFO, which allows for any unforeseen expenditures for the maintenance of productive capacity. Based on current facts and assumptions, management does not anticipate cash distributions will be reduced or suspended in the foreseeable future. The AFFO payout ratio for the year ended December 31, 2009, was 98.6% (December 31, 2008 – 91.2%, 2007 – 91.4%).
(in thousands of dollars) 2009 2008 2007
Cash provided by operating activities 142,785 144,069 160,872Net income 23,286 89,648 30,495Distributions declared 151,075 145,948 139,167Distributions paid 137,684 126,380 120,809AFFO 152,361 159,575 152,460Surplus (shortfall) of cash provided by operating activities over distributions declared (8,290) (1,879) 21,705Surplus of cash provided by operating activities over distributions paid 5,101 17,689 40,063Surplus (shortfall) of cash provided by operating activities over AFFO (9,576) (15,506) 8,412Shortfall of net income over distributions declared (127,789) (56,300) (108,672)
Quarterly InformationRevenue from continuing operations has increased over the past eight quarters because of acquisitions and Earnout transactions at various times during 2008 through 2009.
Income from continuing operations fluctuated over the past eight quarters, aside from the large number of acquisitions and Earnouts, for the following reasons:• The quarter ended December 31, 2009, includes amortization of accretion on 6.65% Convertible Debentures of $1.3 million.• The quarter ended September 30, 2009, includes the write-offs of $1.4 million of tenant improvements and intangible assets due
to tenant vacancies.• The quarter ended June 30, 2009, includes the write-offs of $2.5 million of tenant improvements and intangible assets due to
tenant vacancies.• The quarter ended March 31, 2009, includes the write-offs of $8.8 million of tenant improvements and intangible assets due to
tenant vacancies.• The quarter ended June 30, 2008, includes a write-down of properties under development of $1.7 million.
Net income has fluctuated over the past eight quarters for the same reasons as indicated above. In addition, the quarters ended March 31, 2008, June 30, 2008, September 30, 2008 and December 31, 2008, include gains of $19.1 million, $18.6 million, $6.8 million and $3.7 million, respectively, on the sale of income properties.
Cash provided by operating activities has fluctuated over the past eight quarters primarily due to seasonal changes in non-cash operating items.
CALLOWAY REIT 2009 Annual Report 39

Management’s Discussion and Analysis of Results of Operations and Financial Condition
QUARTERLY INFORMATION
(in thousands of dollars, except per Unit and Unit amounts)
December 31, September 30, June 30, March 31, December 31, September 30, June 30, March 31, 2009 2009 2009 2009 2008 2008 2008 2008
Revenues 120,074 113,377 111,040 117,100 115,428 110,237 104,643 106,270
Income from continuing operations 7,473 6,810 6,961 2,340 12,475 9,380 5,624 10,143
Per Unit Basic $0.075 $0.070 $0.073 $0.025 $0.131 $0.099 $0.060 $0.110 Diluted1 $0.075 $0.070 $0.073 $0.025 $0.131 $0.099 $0.060 $0.110
Net income 7,457 6,735 6,759 2,335 16,423 16,603 25,398 31,224
Per Unit Basic $0.075 $0.069 $0.070 $0.024 $0.173 $0.175 $0.273 $0.338 Diluted1 $0.075 $0.069 $0.070 $0.024 $0.173 $0.175 $0.273 $0.338
Funds from operations2 40,144 39,303 40,634 41,932 44,675 42,838 40,023 42,741
Per Unit Basic $0.403 $0.403 $0.424 $0.439 $0.470 $0.453 $0.430 $0.462 Diluted3 $0.403 $0.403 $0.424 $0.439 $0.466 $0.451 $0.429 $0.462
Distributable income 38,342 36,836 38,805 40,096 42,132 40,038 37,090 39,642
Per Unit Basic $0.385 $0.378 $0.405 $0.420 $0.443 $0.423 $0.399 $0.429 Diluted3 $0.385 $0.378 $0.405 $0.420 $0.441 $0.423 $0.399 $0.428
Adjusted funds from operations 35,785 37,405 39,175 39,998 41,568 39,931 37,716 40,360
Per Unit Basic $0.360 $0.384 $0.408 $0.419 $0.437 $0.422 $0.405 $0.437 Diluted3 $0.360 $0.384 $0.408 $0.419 $0.435 $0.422 $0.405 $0.436
Cash provided by operating activities 36,749 37,065 34,503 34,468 50,631 36,776 33,651 23,011
Distributions declared 38,636 38,107 37,226 37,106 36,903 36,821 36,262 35,962
Units outstanding4 99,365,444 99,130,611 95,743,541 95,442,771 95,077,675 94,818,597 94,066,590 92,529,796
Weighted average Units outstanding Basic 99,511,965 97,408,149 95,900,244 95,499,518 95,153,901 94,566,806 93,019,898 92,426,435 Diluted 99,511,965 97,408,149 95,900,244 95,499,518 95,153,901 94,566,806 93,094,407 92,426,435
Total assets 4,236,839 4,236,803 4,203,243 4,175,556 4,194,387 4,217,373 4,210,768 3,930,190
Total debt 2,726,698 2,682,760 2,675,566 2,627,677 2,619,797 2,611,941 2,598,168 2,325,327
1 Diluted income from continuing operations and net income per Unit are calculated using the weighted average number of Units outstanding for the respective quarters.2 Restated for amortization of accretion on Convertible Debentures recorded in the quarter ended December 31, 2009.3 Diluted FFO, DI and AFFO per Unit are adjusted for the dilutive effect of the Convertible Debentures, which are not dilutive for net income purposes.4 Unit outstanding balance does not include the vested deferred Unit plan.
40 CALLOWAY REIT 2009 Annual Report

Related PartiesCalloway has identified three parties, all Trustees, that meet the definition of related party. A limited liability partnership, of which a Trustee is a principal, received $1.0 million for legal services rendered during the year ended December 31, 2009, and the Trust has loans outstanding for $6.3 million to a corporation of which the second Trustee is President.
SmartCentres, whose owner is also a Trustee, is the most significant related party. Calloway has entered into contracts and other arrangements with SmartCentres for the following:
(in thousands of dollars) 2009 2008
Acquisition of land and properties 55,099 287,901Mortgages advanced to SmartCentres during the year 19,950 36,266Equity issued to SmartCentres during the year 937 31,403Amounts receivable at year-end 5,157 6,058Amounts payable at year-end 8,854 10,505Accrued development obligation at year-end 35,836 33,220
Paid to/payable to SmartCentres Fees: Leasing/development 3,358 3,228 Legal, marketing and other administrative costs 1,044 2,058 Acquisition fees – – Rent and operating costs 1,078 975 Interest 526 1,000
Paid by/payable by SmartCentres Opportunity fees/head lease rents 5,963 6,513 Interest income 10,706 16,393 Management fees 1,326 886
SmartCentres owns 23.9% of the aggregate issued and outstanding Trust Units and special voting Units of Calloway. A July 2005 agreement preserves SmartCentres’ voting rights at a minimum of 25% for a period of five years, which may be extended for an additional five years under certain circumstances. The ownership would increase to 31.8% if SmartCentres exercised all remaining options to purchase Units pursuant to existing development and exchange agreements. Calloway has entered into agreements with SmartCentres to borrow funds from SmartCentres and to finance various development projects. In addition, the Trust has entered into property management, leasing, development and exchange agreements, and co-ownership agreements with SmartCentres.
The financial implication of these agreements is disclosed in notes 1, 3, 4, 5, 6, 9, 10, 11, 17, 18, 22 and 23 of the consolidated financial statements for the year ended December 31, 2009.
Future Income TaxesThe Trust is taxed as a mutual fund trust for Canadian income tax purposes. In accordance with the Declaration of Trust, distributions to Unitholders are declared at the discretion of the Trustees. The Trust endeavours to declare distributions in each taxation year in such an amount as is necessary to ensure the Trust will not be subject to tax on its net income and net capital gains under Part I of the Income Tax Act (Canada) (the “Tax Act”).
Pursuant to the recent amendments to the Tax Act, the taxation regime applicable to specified investment flow-through trusts or partnerships (“SIFTs”) and investors in SIFTs has been altered. If Calloway were to become subject to these new rules (the “SIFT Rules”), it generally would be taxed in a manner similar to corporations on income from business carried on in Canada by Calloway and on income (other than taxable dividends) or capital gains from non-portfolio properties (as defined in the Tax Act), at a combined federal/provincial tax rate similar to that of a corporation. In general, distributions paid as returns of capital will not be subject to this tax. The SIFT Rules are applicable beginning with the 2007 taxation year of a trust unless the trust would have been a “SIFT trust” (as defined in the Tax Act) on October 31, 2006, if the definition had been in force and applied to the trust on that date (the “Existing Trust Exemption”). For trusts that meet the Existing Trust Exemption, including Calloway, the SIFT Rules will apply commencing in the 2011 taxation year, assuming compliance with the “normal growth” guidelines issued by the Department of Finance (Canada) on December 15, 2006, as amended from time to time (the “Normal Growth Guidelines”). The SIFT Rules are not applicable to a real estate investment trust that meets certain specified criteria relating to the nature of its revenue and investments (the “REIT Exemption”). Calloway intends to qualify for the REIT Exemption prior to 2011.
CALLOWAY REIT 2009 Annual Report 41

Management’s Discussion and Analysis of Results of Operations and Financial Condition
As the Trust does not meet the REIT Exemption as at December 31, 2009, a future income tax asset in the amount of $6,288 has been recorded as at December 31, 2009, based on the temporary differences that are expected to reverse on or after January 1, 2011, reduced by a valuation allowance of $6,288 to a net balance of $nil, as the tax asset is not more likely than not to be realized given that Calloway intends to meet the REIT Exemption by January 1, 2011. The measurement of the future income tax asset as at the consolidated balance sheet date required management to make estimates and assumptions, including estimates and assumptions regarding the timing of when temporary differences are expected to reverse and regarding future allocations of taxable income between the various partners of the limited partnerships under the control of the Trust. Actual results could differ from those estimates.
It is the Trust’s current intention to restructure its business affairs and/or discontinue certain of its activities, if necessary, by January 1, 2011 in order to qualify for the REIT Exemption.
There are a few issues that need resolution to qualify for the REIT Exemption; however, the most significant issue relates to the mortgages receivable that the Trust provided pursuant to agreements to related and third parties for use in acquiring and developing properties. Since under the SIFT rules, REITs cannot make loans to certain entities, except under limited circumstances, the Trust will not qualify for the REIT Exemption if it continues to hold these loans. As a result, the Trust along with its tax consultants has considered various options to resolve the issue. These options include: (i) purchase the development lands and settle the related loans, (ii) settle the loans with the subject parties and (iii) structure these loans in such a manner that these loans will allow the subject parties to develop the land and allow the Trust to meet the REIT Exemption test. The option selected to restructure will depend on the particulars of each loan with the consent of the mortgagees.
Disclosure Controls and Procedures and Internal Controls Over Financial Reporting – National Instrument 52-109 ComplianceDisclosure Controls and ProceduresCalloway’s Chief Executive Officer and Chief Financial Officer have designed, or caused to be designed under their direct supervision, Calloway’s disclosure controls and procedures (as defined by National Instrument 52-109 – Certification of Disclosure in Issuers’ Annual and Interim Filings, adopted by the Canadian Securities Administrators) to provide reasonable assurance that: (i) material information relating to Calloway, including its consolidated subsidiaries, is made known to them by others within those entities, particularly during the period in which the annual filings are being prepared; and (ii) material information required to be disclosed in the annual filings is recorded, processed, summarized and reported on a timely basis. Further, they have evaluated, or caused to be evaluated under their direct supervision, the effectiveness of Calloway’s disclosure controls and procedures at December 31, 2009, and concluded they were effective.
Internal Control Over Financial ReportingCalloway’s Chief Executive Officer and Chief Financial Officer have also designed, or caused to be designed under their direct supervision, Calloway’s internal control over financial reporting to provide reasonable assurance regarding the reliability of financial reporting and the preparation of consolidated financial statements for external purposes in accordance with Canadian GAAP. Further, using the criteria established in Internal Control – Integrated Framework published by the Committee of Sponsoring Organizations of the Treadway Commission, they have evaluated, or caused to be evaluated under their direct supervision, the effectiveness of Calloway’s internal control over financial reporting at December 31, 2009, and concluded it was effective.
Changes in Internal Controls Over Financial ReportingNo changes were made to the design of Calloway’s internal control over financial reporting during the year ended December 31, 2009, that have materially affected, or are reasonably likely to materially affect, its internal control over financial reporting.
Inherent LimitationsNotwithstanding the foregoing, because of its inherent limitations a control system can provide only reasonable assurance that the objectives of the control system are met and may not prevent or detect misstatements. Management’s estimates may be incorrect, or assumptions about future events may be incorrect, resulting in varying results. In addition, management has attempted to minimize the likelihood of fraud. However, any control system can be circumvented through collusion and illegal acts.
42 CALLOWAY REIT 2009 Annual Report

Critical Accounting EstimatesIn preparing the Trust’s consolidated financial statements and accompanying notes, it is necessary for management to make estimates, assumptions and judgments that affect the reported amounts of assets and liabilities, the disclosure of contingent assets and liabilities, and the reported amounts of revenue and expenses during the year. The significant items requiring estimates are outlined below.
Impairment in Value of AssetsUnder Canadian GAAP, management is required to write-down to fair value any long-lived asset or financial asset that is determined to have been impaired. The Trust’s long-lived assets consist of certain real estate assets (income properties, properties under development, mortgages and loans receivable).
The fair value of the income properties and properties under development is dependent upon future cash flows over the holding period. The review of anticipated cash flows involves assumptions of estimated occupancy, rental rates and residual value. In addition to reviewing anticipated cash flows, management assesses changes in business climates and other factors that may affect the ultimate value of the property. These assumptions may not ultimately be achieved. In the event these factors result in a carrying value that exceeds the sum of the undiscounted cash flows expected to result from the direct use and eventual disposition of the property, an impairment would be recognized.
The fair value of the mortgages and loans receivable depends upon the financial stability of the borrower and the economic value of the underlying security.
For the year ended December 31, 2009, the Trust determined there were no impairments.
AmortizationThe Trust records amortization on its income properties on a straight-line basis. Under this method, amortization is charged to income on a straight-line basis over the remaining estimated useful life of the property. A significant portion of the acquisition cost of each property is allocated to building. The allocation of the acquisition cost to building and the determination of the useful life are based on management’s estimates. In the event the allocation to building is inappropriate or the estimated useful life of the building proves incorrect, the computation of amortization will not be appropriately reflected over future periods.
Property AcquisitionsFor acquisitions subsequent to September 12, 2003, in accordance with the Canadian Institute of Chartered Accountants (CICA) Handbook Sections 1581 and 3064, and giving consideration to the requirements of EIC Abstracts 137 and 140 of the CICA, management is required to perform many procedures that are subject to estimation judgment.
Future Tax ProvisionsThe measurement of the future income tax asset as at the consolidated balance sheet date required management to make estimates and assumptions, including estimates and assumptions regarding the timing of when temporary differences are expected to reverse and regarding future allocations of taxable income between the various partners of the limited partnerships under the control of the Trust. Actual results could differ from those estimates.
Fair Value of Earnout Options GrantedEarnout options were issued at the time of certain acquisitions. The options were valued at their estimated fair market value based on a Black-Scholes calculation using certain assumptions with respect to the volatility of the underlying Trust Unit price, the risk-free interest rate, the anticipated expected life of the options and the expected Unit distribution rate.
Accounting PoliciesImplementation of New Accounting Policies – 2009Emerging Issues Committee (EIC 173) Abstract, Credit Risk and the “Fair Value of Financial Assets and Financial Liabilities”, considers whether an entity’s own credit risk and the credit risk of the counter party should be taken into account in determining the fair value of financial assets and financial liabilities, including derivative instruments, for presentation and disclosure purposes. Adoption of EIC 173 had no material impact on these consolidated financial statements.
In 2008, the Canadian Institute of Chartered Accountants (CICA) amended CICA Handbook Section 1000, “Financial Statement Concepts” and issued CICA Handbook Section 3064, “Goodwill and Intangible Assets”, which replaces CICA Handbook Section 3062, “Goodwill and Other Intangible Assets” and CICA Handbook Section 3450, “Research and Development Costs”. CICA Handbook Section 3064 establishes standards for the recognition, measurement and disclosure of goodwill and intangible assets. The objective of these changes are to: (i) reinforce the principles-based approach to the recognition of assets in accordance with the
CALLOWAY REIT 2009 Annual Report 43

Management’s Discussion and Analysis of Results of Operations and Financial Condition
revised definition of what an asset is and when an asset should be recognized and (ii) to eliminate the current practice of recognizing assets that do not meet the definition and recognition criteria. Under these changes, effective January 1, 2009, the deferral and matching of operating expenses over future revenues is, with some exceptions, no longer appropriate. The adoption of this standard had no material impact on the Trust’s consolidated financial statements.
Future Changes in Accounting PoliciesIn January 2009, the CICA issued Handbook Section 1582, “Business Combinations”, Section 1601, “Consolidations”, and Section 1602, “Non-controlling Interests”. These sections replace the former CICA Handbook Section 1581, “Business Combinations” and Section 1600, “Consolidated Financial Statements”, and establish a new section for accounting for a non-controlling interest in a subsidiary.
Section 1582 establishes standards for the accounting for a business combination. It provides the Canadian equivalent to International Financial Reporting Standard IFRS 3, “Business Combinations” (January 2008). The section applies prospectively to business combinations for which the acquisition date is on or after the beginning of the first annual reporting period on or after January 1, 2011.
Section 1601 establishes standards for the preparation of consolidated financial statements.
Section 1602 establishes standards for accounting for a non-controlling interest in a subsidiary in consolidated financial statements subsequent to a business combination. It is equivalent to the corresponding provisions of IFRS IAS 27, “Consolidated and Separate Financial Statements” (January 2008).
Section 1601 and Section 1602 apply to interim and annual consolidated financial statements relating to fiscal years beginning on or after January 1, 2011.
Earlier adoption of these sections is permitted as of the beginning of a fiscal year. All three sections must be adopted concurrently. As at December 31, 2009, the Trust did not adopt these sections. The Trust is currently evaluating the impact of the adoption of these sections.
International Financial Reporting Standards (IFRS)In January 2006, the CICA Accounting Standards Board (“AcSB”) adopted a strategic plan for the direction of accounting standards in Canada. In February 2008, the AcSB confirmed it will require publicly accountable enterprises to adopt IFRS, as issued by the International Accounting Standards Board (IASB), for interim and annual financial statements relating to fiscal years beginning on or after January 1, 2011, with comparative figures presented on the same basis. Calloway will present its first IFRS consolidated financial statements in the first quarter of 2011.
The transition to IFRS will have a significant impact on the Trust’s financial reporting, business processes, information system, disclosure controls and procedures and internal controls over financial reporting. The Trust has completed an initial diagnostic impact assessment and has identified IFRS versus current Canadian GAAP differences but continues to assess the implication of such differences to its financial reporting. The Trust is in the process of quantifying the impact that the future adoption of IFRS will have on its consolidated financial statements and operating performance.
A significant component of the work plan includes performing a detailed impact analysis and implementation plan for individual standards, including the selection of IFRS accounting policies and transition elections that may be applicable, and quantification of the impact of IFRS on the Trust’s consolidated financial statements. Based on management’s assessment, there are a number of significant IFRS differences that will potentially have an impact on the Trust’s consolidated financial statements and related processes and controls. In addition, there are a number of proposed and continuing projects of the IASB that may have an impact on the Trust. Management will monitor any changes that arise to determine whether they will have any impact on the Trust. The Trust will continue to invest in training and resources through the transition process to facilitate a timely conversion. Additional information will be provided as the Trust moves toward 2011.
Impact of Adoption of IFRSIFRS is premised on a conceptual framework similar to Canadian GAAP; however, significant differences exist in certain matters of recognition, measurement, presentation and disclosure. The significant IFRS differences that are expected to have an impact on the Trust’s consolidated financial statements include the following:
44 CALLOWAY REIT 2009 Annual Report

Investment PropertyIFRS defines investment property as a property (land or a building, or part of a building, or both) held by the owner or by the lessee under a finance lease to earn rentals or for capital appreciation or both.
Under Canadian GAAP, the Trust measures its investment properties using the historical cost model and recognizes various tangible and intangible assets related to the investment property. Under IFRS, after the initial recognition, the Trust will have a choice of whether to measure the investment properties using the historical cost model or the fair value model.• If the fair value model is selected, investment properties will be carried on the consolidated balance sheet at their fair values, and
changes in fair value each period will be recorded in the consolidated statement of income. Under the fair value model, acquired lease intangible assets (i.e., in-place leases, customer relationships) are recognized as an integral part of the value of investment properties and are not presented separately on the consolidated balance sheet. No depreciation related to investment properties is recognized under the fair value model.
• The cost model is generally consistent with Canadian GAAP. Under the cost model for depreciation purposes, investment property will be broken down into significant components including land, building structures, significant improvements and facilities of the building, amounts relating to in-place leases, and other components. If the cost model is selected, the Trust will be required to disclose the fair value of investment properties in the notes to the consolidated financial statements in each reporting period.
• There is a third option available under IFRS 1 that allows an entity to initially measure investment properties upon transition to IFRS at fair value as deemed cost and subsequently measure using the cost model (see IFRS 1 discussion below).
The Trust has substantially completed the design of its investment property valuation process and has commenced implementation.
The Trust anticipates that the policy for accounting for investment properties will be made in the first quarter of 2010.
Properties Under DevelopmentProperties under development are treated under the investment property standard. Under IFRS, administrative and other general overheads cannot be capitalized and any incidental operating income cannot be recognized. Capitalization of interest costs directly attributable to, and an allocation of borrowing costs on general debt that relate to, an asset under construction is required under IFRS.
ImpairmentUnder Canadian GAAP, impairment is recognized if the undiscounted future cash flows of the investment property are lower than its carrying value.
Under IFRS, an entity is required to recognize an impairment change if the recoverable amount, determined as the higher of the estimated fair value less costs to sell or value-in-use, is less than its carrying value. Value-in-use is defined as the discounted present value of estimated future cash flows expected to arise from the planned use of an asset and from its disposal at the end of its useful life.
Under IFRS, recognition of impairments would likely be more frequent. IFRS allows impairment losses to be reversed if there is an increase in value; however, the increase cannot exceed cost less accumulated amortization (the net book value). The reversal of impairment loss is not allowed under Canadian GAAP.
LeasesCanadian GAAP and IFRS both require that tenant allowances be recorded as a reduction to rental revenue over the term of the lease. Currently, tenant improvements and certain other leasing costs are capitalized and amortized through amortization expense by the Trust. Under IFRS, portions of such costs are likely to be considered leasing incentives and will be amortized as a reduction of rental revenue over the term of the lease.
Leasing commissions will continue to be deferred on the consolidated balance sheet, but under IFRS they form a component of investment property.
Business CombinationsIFRS and current Canadian GAAP require the acquisition method of accounting for all business combinations; however, significant differences exist between the two standards. IFRS prohibits the capitalization of transaction costs; these costs are to be expensed as incurred, whereas Canadian GAAP allows the capitalization of these costs. All elements of consideration granted (i.e., Units and Earnout options) including contingent consideration are recorded at fair value at the consummation of the acquisition. To the extent there is a fluctuation in value of consideration between the date the terms of the acquisition are agreed to and the date of consummation, this could lead to recognition of negative goodwill in the consolidated statement of income rather than applied on a pro rata basis to reduce the fair value of assets acquired as required under Canadian GAAP, or the recognition of goodwill.
CALLOWAY REIT 2009 Annual Report 45

Management’s Discussion and Analysis of Results of Operations and Financial Condition
There continues to be discussion internationally as to whether the purchase of an investment property is a purchase of a business or a purchase of an asset. As noted, transaction costs are expensed for business acquisitions; however, they are generally capitalized for purchases of an asset. Under the fair value model, any transaction costs capitalized to the purchase of an asset would effectively be written off as part of the period-end adjustment of investment properties to fair value.
Equity – Trust UnitsUnder IFRS and its interpretation by the Canadian accounting profession, the Trust Units meet the definition of a liability rather than equity as currently presented under Canadian GAAP. IFRS states that a liability arises where a financial instrument contains a contractual obligation to deliver cash or another financial asset to another entity. As the Trust Units are redeemable at the option of the holder, Trust Units meet the definition of a liability. Notwithstanding they meet the definition of a liability, special provisions under IFRS will permit the Trust Units to be presented as equity provided they are the most subordinated class of instruments, there are no other contractual obligations to deliver cash or another financial asset and certain other conditions are met. A mandatory requirement to distribute taxable income constitutes a contractual obligation to deliver cash and would have resulted in Trust Units being presented as a liability with future distributions treated as interest expense for purposes of IFRS.
The Unitholders approved an amendment to the Declaration of Trust at their annual meeting on May 7, 2009, to remove the requirement to distribute its taxable income. This change was reflected in the Declaration of Trust dated September 14, 2009. Accordingly, notwithstanding the Trust Units meet the definition of a liability as a result of their redemption feature, Calloway believes it has met the conditions under IFRS that will permit Trust Units to be presented as equity and distributions on Trust Units will continue to be presented as a reduction in the statement of equity.
Equity – LP UnitsUnder Canadian GAAP, Calloway’s LP Units are presented as equity in the consolidated balance sheet. However, under IFRS, the LP Units, in their current form, would likely be presented as a liability at fair value with changes in fair value recorded in income and distributions would be classified as interest expense. A similar situation was present for Trust Units that was rectified by amendment of the Declaration of Trust (as discussed above). However, the issue related to LP Units is more complex. The Canadian accounting profession has not reached a conclusion as to what actions need to be taken, if any, to allow the LP Units to be presented as equity under IFRS. This is an industry-wide issue, and amendments will be made to the LP agreements, where possible, once the accounting profession reaches a consensus, assuming a consensus can be reached.
A similar issue may require Earnout Options, deferred units and the conversion feature of Convertible Debentures to also be presented as a liability at fair value with changes in fair value recorded in income.
IFRS 1 – First-Time Adoption of International Financial Reporting StandardsAt adoption of IFRS, an entity is required to apply IFRS 1, which provides guidance to entities on financial reporting options available under IFRS on adoption and provides a suitable starting point for accounting under IFRS. In general, IFRS 1 requires an entity to retrospectively apply the IFRS standards that are in place at the reporting date. However, IFRS 1 grants a first-time adopter exemptions and exceptions to retrospective application of certain IFRS standards. The following are the optional exemptions available under IFRS 1 that may be significant to the Trust:
• Business CombinationsThe Trust may elect not to apply the IFRS business combinations standard retrospectively for business combinations that occurred before the transition date (i.e., January 1, 2010). However, if the Trust chooses to restate any business combination that occurred prior to the transition date, it will have to restate all business combinations from the date selected. The Trust does not expect to elect this option (i.e., the business combination standard will apply prospectively from January 1, 2010).
• Fair Value or Revaluation as Deemed CostUnder IFRS 1 the Trust may elect to measure an item of property, plant and equipment and investment properties (under the cost model) as at the transition date at its then fair value and use the fair value as its deemed cost at that date. Fair value as deemed cost would become the new cost amount for the qualifying assets at transition. This is a one-time election available at the transition date only, after which the cost model will be applied.
46 CALLOWAY REIT 2009 Annual Report

Income TaxesUnder the current IFRS income tax standard, it would initially appear that real estate investment trusts in Canada will be required to recognize deferred income taxes, even if the REIT Exemption is met under the SIFT Rules. This is an industry-wide issue under ongoing discussion.
Classified Balance SheetUnder Canadian GAAP, the Trust presents a non-classified balance sheet. The Trust is evaluating whether this continues to be appropriate under IFRS or whether a classified balance sheet is appropriate.
As the Trust progresses through its work plan, there may be other areas identified that will have an impact on the consolidated financial statements of the Trust. Changes to current international accounting standards, if any, may result as proposed and continuing projects of the IASB are finalized, and such changes may also have an impact on the consolidated financial statements of the Trust.
As at the 2009 year-end, the Trust has identified the significant differences between Canadian GAAP and IFRS that impact the Trust’s consolidated financial statements. The Trust is in the process of assessing the impact and designing solutions to address the differences, focusing on those differences that may require changes to its financial systems or that are more complex or time-consuming to resolve. Appropriate resources have been secured to complete the transition on a timely basis. The Trust has started to quantify the impact that the future adoption of IFRS will have on its consolidated financial statements and operating performance measures, including externally imposed measures. Additional information will be provided as the Trust completes quantification and finalizes the impact on its consolidated financial statements.
Risks and UncertaintiesReal Property Ownership RiskAll real property investments are subject to elements of risk. General economic conditions, local real estate markets, supply and demand for leased premises, competition from other available premises and various other factors affect such investments.
Real estate has a high fixed cost associated with ownership, and income lost due to declining rental rates or increased vacancies cannot easily be minimized through cost reduction. Through well-located, well-designed and professionally managed properties, management seeks to reduce this risk. Management believes prime locations will attract high-quality retailers with excellent covenants and will enable the Trust to maintain economic rents and high occupancy. By maintaining the property at the highest standard through professional management practices, management seeks to increase tenant loyalty.
Development RiskDevelopment risk arises from the possibility that developed space will not be leased or that the costs of development will exceed original estimates, resulting in an uneconomic return from the leasing of such developments. Calloway mitigates this risk by not commencing construction of any development until sufficient lease-up has occurred and by entering into fixed-price contracts for development costs.
Interest and Financing RiskIn the low interest rate environment that the Canadian economy has experienced in recent years, leverage has enabled the Trust to enhance its return to Unitholders. A reversal of this trend, however, can significantly affect the business’s ability to meet its financial obligations. In order to minimize this risk, Calloway’s policy is to negotiate fixed-rate term debt with staggered maturities on the portfolio and match average lease maturity to average debt maturity. Derivative financial instruments may be utilized by the Trust in the management of its interest rate exposure. The Trust’s policy is not to utilize derivative financial instruments for trading or speculative purposes. In addition, the Declaration of Trust restricts total indebtedness permitted on the portfolio.
Interest rate changes will also affect the Trust’s development portfolio. Calloway has entered into development agreements that obligate the Trust to acquire up to approximately 2.6 million square feet of additional income properties at a cost determined by capitalizing the rental income at predetermined rates. Subject to the ability to obtain financing on acceptable terms, the Trust will finance these acquisitions by issuing additional debt and equity. Changes in interest rates will have an impact on the return from these acquisitions and, should the rate exceed the capitalization rate used, could result in a purchase being non-accretive. This risk is mitigated as management has certain rights of approval over the developments.
CALLOWAY REIT 2009 Annual Report 47

48 CALLOWAY REIT 2009 Annual Report
Management’s Discussion and Analysis of Results of Operations and Financial Condition
Operating facilities and development loans exist that are priced at a risk premium over short-term rates. Changes in short-term interest rates will have an impact on the cost of funds. In addition, there is a risk the lenders will not refinance on maturity. By restricting the amount of variable interest rate debt and the short-term debt, the Trust has minimized the impact on financial performance.
During 2007, access to long-term financing was negatively affected by both sub-prime mortgages and the asset-backed commercial paper markets. Mortgage lenders are prepared to finance on a secured basis at lower debt ratios and at significantly higher cost. The all-in cost of debt has not increased significantly as a result of lower bond yields. Due to the quality and location of Calloway’s real estate, management is confident that it will be able to meet its financial requirement in 2010. Calloway issued $225.0 million unsecured debentures during the quarter ended June 30, 2009, and raised $50.0 million in new equity during the quarter ended September 30, 2009, which addresses the previous concern pertaining to the refinancing of $200.0 million (now $46.5 million) in unsecured debentures maturing in September 2010. In addition, on January 5, 2010, the Trust issued $60.0 million of 5.75% convertible unsecured subordinated debentures and 2.1 million Units at a price of $19.05 per unit to raise, in aggregate, gross proceeds of approximately $100.0 million ($96.2 million net proceeds). The proceeds were used to repay outstanding bank operating facilities.
Credit RiskCredit risk arises from the possibility that tenants may experience financial difficulty and be unable to fulfill their lease commitments. The Trust mitigates this risk of credit loss by reviewing tenants’ covenants, ensuring its tenant mix is diversified and limiting its exposure to any one tenant, except Wal-Mart Canada Corp. Further risks arise in the event that borrowers may default on the repayment of amounts owing to the Trust. The Trust endeavours to ensure adequate security has been provided in support of mortgages and loans receivable.
Environmental RiskAs an owner and manager of real property, the Trust is subject to various laws relating to environmental matters. These laws impose liability for the cost of removal and remediation of certain hazardous materials released or deposited on properties owned by the Trust or on adjacent properties. As required by the Declaration of Trust and in accordance with best management practices, Phase 1 audits are completed on all properties prior to acquisition. Further investigation is conducted if Phase 1 tests indicate a potential problem. The Trust has operating policies to monitor and manage risk. In addition, the standard lease requires compliance with environmental laws and regulations and restricts tenants from carrying on environmentally hazardous activities or having environmentally hazardous substances on site. The Trust has obtained environmental insurance on certain assets to further manage risk.
Capital RequirementsCalloway accesses the capital markets from time to time through the issuance of debt, equity or equity-related securities. If Calloway were unable to raise additional funds or renew existing maturing debt on favourable terms, then acquisition or development activities could be curtailed, asset sales accelerated and property-specific financing, purchase and development agreements renegotiated, and monthly cash distributions reduced or suspended. However, Calloway anticipates accessing the capital markets on favourable terms due to its high occupancy levels and low lease maturities, combined with strong national tenants in prime retail locations.
Tax Rules for Income TrustsPursuant to the SIFT Rules, a SIFT will be subject to tax in respect of certain distributions at a rate that is substantially equivalent to the general tax rate applicable to a Canadian corporation. The SIFT Rules provide that a trust that would have been a SIFT trust on October 31, 2006, if the definition of “SIFT trust” had been in force on that date (an “Existing Trust”) and applied to Calloway on that date, will become subject to the tax on distributions commencing with the 2011 taxation year. However, the SIFT Rules also provide that an Existing Trust will become subject to this tax prior to the 2011 taxation year if its equity capital increases beyond certain limits measured against the market capitalization of the Existing Trust as determined under the Normal Growth Guidelines published by the Department of Finance (Canada).
The REIT Exemption, in its current form, does not fully accommodate the current business structures used by many Canadian REITs, and contains a number of technical tests that many Canadian REITs, including Calloway, may find difficult to satisfy. The SIFT Rules will apply to an Existing Trust (other than REITs that qualify for the REIT Exemption) commencing with the earlier of the Existing Trust’s 2011 taxation year or the first taxation year of the Existing Trust in which it exceeds the Normal Growth Guidelines. Accordingly, unless the REIT Exemption is applicable to Calloway, the SIFT Rules could have an impact on the level of cash distributions that would otherwise be made by Calloway and the taxation of such distributions to holders of Units.

CALLOWAY REIT 2009 Annual Report 49
Based on the legislation as it is now enacted, it would appear that Calloway, as currently structured, does not qualify for the REIT Exemption. Subject to the Normal Growth Guidelines discussed above, the SIFT Rules will apply to Calloway commencing in 2011. It is Calloway’s current intention to restructure its business affairs and/or discontinue certain of its activities, if necessary, by January 1, 2011, in order to qualify for the REIT Exemption. However, no assurance can be given that Calloway will qualify for the REIT Exemption.
OutlookDemand by investors for investments, such as the Trust’s Units and debentures, with appropriate risk-weighted yields persists. As a result, the cost of capital continues to improve for issuers with strong business models. Cost of debt will most likely remain at current spreads with any change in pricing predicated on bond movements. The cost of equity should continue to improve over the medium term as operating results continue to support valuations of such securities and the underlying assets.
Canadian retailers faired well over the 2009 Christmas season. The retailers had reduced inventory and had discounted early to avoid holding much inventory as they went into 2010. Management believes there will be limited tenant failures in the Calloway portfolio. This belief is due to the value-oriented focus of our retailers and the financial strength of our tenants and their diversified mix. Management acknowledges that challenges will persist for those retailers offering discretionary goods and services.
A number of significant shopping centre acquisitions have been completed in recent months that serve as benchmarks to vendors and purchasers of retail properties. Management expects the quantity of properties listed for sale to improve during 2010 with reasonable pricing expectations from both parties. Development activity, however, will remain limited as retailers wait for consumer demand to improve, which is not likely to occur until improvement is seen in employment.

MANAGEMENT’S RESPONSIBILITY
FOR FINANCIAL REPORTING
The Annual Report, including consolidated financial statements, is the responsibility of the management of Calloway Real Estate Investment Trust. The financial statements have been prepared in accordance with the recommendations of the Canadian Institute of Chartered Accountants. Financial information contained elsewhere in this report is consistent with information contained in the consolidated financial statements.
Management maintains a system of internal controls that provides reasonable assurance that the assets of Calloway Real Estate Investment Trust are safeguarded and that facilitates the preparation of relevant, timely and reliable financial information thatreflects, where necessary, management’s best estimates and judgments based on informed knowledge of the facts.
The Board of Trustees is responsible for ensuring that management fulfills its responsibility and for final approval of the consolidated financial statements. The Board has appointed an Audit Committee comprising three Trustees to approve, monitor, evaluate, advise or make recommendations on matters affecting the external audit, the financial reporting and the accounting controls, policies and practices of Calloway Real Estate Investment Trust under its terms of reference.
The Audit Committee meets at least four times per year with management and with the independent auditors to satisfy itself that they are properly discharging their responsibilities. The consolidated financial statements and the Management Discussion and Analysis have been reviewed by the Audit Committee and approved by the Board of Trustees.
PricewaterhouseCoopers LLP, the independent auditors, have audited the consolidated financial statement in accordance with Canadian generally accepted accounting principles and have read Management’s Discussion and Analysis. Their auditors’ report is set forth.
Simon Nyilassy Bart Munn President and Chief Executive Officer Chief Financial Officer
50 CALLOWAY REIT 2009 Annual Report

AUDITORS’ REPORT
February 24, 2010
To the Unitholders of Calloway Real Estate Investment TrustWe have audited the consolidated balance sheets of Calloway Real Estate Investment Trust (“the Trust”) as at December 31, 2009 and 2008 and the consolidated statements of income and comprehensive income, equity and cash flows for the years then ended. These financial statements are the responsibility of the Trust’s management. Our responsibility is to express an opinion on these financial statements based on our audits.
We conducted our audits in accordance with Canadian generally accepted auditing standards. Those standards require that we plan and perform an audit to obtain reasonable assurance whether the financial statements are free of material misstatement. An audit includes examining, on a test basis, evidence supporting the amounts and disclosures in the financial statements. An audit also includes assessing the accounting principles used and significant estimates made by management, as well as evaluating the overall financial statement presentation.
In our opinion, these consolidated financial statements present fairly, in all material respects, the financial position of the Trust as at December 31, 2009 and 2008 and the results of its operations and its cash flows for the years then ended in accordance with Canadian generally accepted accounting principles.
Chartered Accountants, Licensed Public AccountantsToronto, Ontario
CALLOWAY REIT 2009 Annual Report 51

CONSOLIDATED FINANCIAL STATEMENTS
CONSOLIDATED BALANCE SHEETS As at December 31, 2009 and December 31, 2008
(in thousands of dollars) 2009 2008
AssetsReal estate assets Income properties (note 4) Tangible assets 3,123,204 3,003,186 Prepaid land rent 150,573 154,903 Intangible assets 263,722 292,465Properties under development (note 5) 365,050 381,835Mortgages and loans receivable (note 6) 245,392 265,605Deferred leasing costs (note 7) 5,348 4,162
4,153,289 4,102,156 Deferred financing costs (note 8) 2,415 1,768Amounts receivable, prepaid expenses and deposits (note 9(a)) 53,649 53,034Cash and cash equivalents 27,486 24,386Assets held for sale (note 20) – 13,043
4,236,839 4,194,387
Liabilities Debt (note 10) 2,726,698 2,619,797Accounts payable and accrued liabilities (note 9(b)) 137,524 136,260Liabilities related to assets held for sale (note 20) – 1,443
2,864,222 2,757,500Equity 1,372,617 1,436,887
4,236,839 4,194,387
Commitments and contingencies (note 22)
The accompanying notes are an integral part of these consolidated financial statements.
Approved by the Board of Trustees
Simon Nyilassy Al MawaniTrustee Trustee
52 CALLOWAY REIT 2009 Annual Report

CALLOWAY REIT 2009 Annual Report 53
CONSOLIDATED STATEMENTS OF INCOME AND COMPREHENSIVE INCOME Years ended December 31, 2009 and 2008
(in thousands of dollars, except per Unit amounts) 2009 2008
Revenues Rentals from income properties (note 12) 446,996 415,475Interest income 14,596 21,103
461,592 436,578
Expenses Property operating costs 152,696 140,895Interest (note 10(g)) 140,073 124,328Amortization (note 13) 135,828 123,334General and administrative 9,411 8,590Write-down of properties under development (note 5) – 1,808
438,008 398,955
Income from continuing operations 23,584 37,623(Loss) income from discontinued operations (note 20) (298) 52,025
Net income and comprehensive income for the year 23,286 89,648
Income per unit (note 15) Basic and diluted Continuing operations 0.24 0.40 Discontinued operations – 0.55
Net income 0.24 0.95
The accompanying notes are an integral part of these consolidated financial statements.

54 CALLOWAY REIT 2009 Annual Report
Consolidated Financial Statements
CONSOLIDATED STATEMENTS OF EQUITY Years ended December 31, 2009 and 2008
Equity Unit Component of Equity Convertible Cumulative Cumulative(in thousands of dollars) (note 11) Debentures Net Income Distributions Total
Equity – January 1, 2008 1,693,903 215 102,543 (367,901) 1,428,760Issuance of units 55,162 – – – 55,162Fair value of Earnout Options issued (note 3) 1,684 – – – 1,684Issuance of Convertible Debentures (note 10(f)) – 7,030 – – 7,030Conversion of Convertible Debentures 574 (23) – – 551Net income for the year – – 89,648 – 89,648Distributions for the year (note 11(g)) – – – (145,948) (145,948)
Equity – December 31, 2008 1,751,323 7,222 192,191 (513,849) 1,436,887Issuance of units (note 11(f)) 63,506 – – – 63,506Conversion of Convertible Debentures 13 – – – 13Net income for the year – – 23,286 – 23,286Distributions for the year (note 11(g)) – – – (151,075) (151,075)
Equity – December 31, 2009 1,814,842 7,222 215,477 (664,924) 1,372,617
The accompanying notes are an integral part of these consolidated financial statements.

CALLOWAY REIT 2009 Annual Report 55
CONSOLIDATED STATEMENTS OF CASH FLOWS Years ended December 31, 2009 and 2008
(in thousands of dollars) 2009 2008
Cash provided by (used in)Operating activities Net income for the year 23,286 89,648Add (deduct): Items not affecting cash Amortization 135,828 123,334 Amortization of deferred financing costs 6,041 4,631 Amortization of prepaid land rent 2,705 3,153 Amortization included in discontinued operations – 481 Capital lease obligation interest 63 57 Straight-line rent adjustments (4,047) (5,901) Deferred unit compensation expense 642 683 Amortization of acquisition date fair value adjustment on assumed debt (4,573) (5,026) Amortization of accretion on convertible debentures 1,262 – Loss (gain) on sale of income properties included in discontinued operations 194 (48,147) Write-down of properties under development – 1,808
161,401 164,721Expenditures on deferred leasing costs (1,708) (1,517)Changes in other non-cash operating items (note 9(c)) (16,908) (19,135)
142,785 144,069
Financing activities Proceeds from issuance of unsecured debentures and convertible debentures – net of issuance costs 223,196 120,507Repayment of unsecured debentures (153,548) –Proceeds from revolving acquisition and operating facilities, net of repayments (73,500) (19,350)Repayments of non-revolving senior interim credit facility – (100,000)Proceeds from term mortgages 265,756 337,412Term mortgages and other net debt repayments (142,944) (67,750)Proceeds from issuance of units – net of issue costs 47,855 4,529Distributions paid (137,685) (126,380)Expenditures on financing costs (7,147) (7,351)
21,983 141,617
Investing activities Acquisitions of income properties and properties under development (note 3) (91,730) (348,512)Additions to income properties (4,793) (3,134)Additions to properties under development (68,187) (48,397)Advances of mortgages and loans receivable (66,079) (88,007)Repayments of mortgages and loans receivable 67,695 96,041Deposits 83 1,036Net proceeds on sale of properties under development 1,343 –Net proceeds on sale of income properties included in discontinued operations – 109,553Bond forward contract settlement – (1,934)
(161,668) (283,354)
Increase in cash and cash equivalents during the year 3,100 2,332Cash and cash equivalents – beginning of year 24,386 22,054
Cash and cash equivalents – end of year 27,486 24,386
Supplemental cash flow information (note 16)
The accompanying notes are an integral part of these consolidated financial statements.

56 CALLOWAY REIT 2009 Annual Report
Notes to Consolidated Financial Statements
NOTES TO CONSOLIDATED FINANCIAL STATEMENTS December 31, 2009 and 2008(in thousands of dollars, except Unit and per Unit amounts)
1. Organization Calloway Real Estate Investment Trust (the Trust) is an unincorporated open-ended mutual fund trust governed by the laws of the Province of Alberta created under a declaration of trust, dated December 4, 2001, subsequently amended and last restated on September 14, 2009 (the Declaration of Trust).
At December 31, 2009, the SmartCentres Group of Companies (SmartCentres), owned by Mitchell Goldhar, owned approximately 23.9% (December 31, 2008 – 24.8%) of the issued and outstanding units of the Trust (see note 17).
2. Summary of significant accounting policiesBasis of presentationThe Trust’s accounting policies and its standards of financial disclosure are in accordance with Canadian generally accepted accounting principles (GAAP). The preparation of consolidated financial statements in conformity with GAAP requires management to make estimates and assumptions that affect the reported amounts of assets and liabilities and the disclosure of contingent assets and liabilities at the date of the consolidated financial statements and the reported amounts of revenues and expenses during the reporting period. Actual results could differ from those estimates.
Implementation of new accounting policies – 2009Emerging Issues Committee (EIC 173) Abstract, “Credit Risk and the Fair Value of Financial Assets and Financial Liabilities”, considers whether an entity’s own credit risk and the credit risk of the counter party should be taken into account in determining the fair value of financial assets and financial liabilities, including derivative instruments, for presentation and disclosure purposes. Adoption of EIC 173 had no material impact on these consolidated financial statements.
In 2008, the Canadian Institute of Chartered Accountants (CICA) amended CICA Handbook Section 1000, “Financial Statement Concepts” and issued CICA Handbook Section 3064, “Goodwill and Intangible Assets”, which replaces CICA Handbook Section 3062, “Goodwill and Other Intangible Assets” and CICA Handbook Section 3450, “Research and Development Costs”. CICA Handbook Section 3064 establishes standards for the recognition, measurement and disclosure of goodwill and intangible assets. The objectives of these changes are to: (i) reinforce the principles-based approach to the recognition of assets in accordance with the revised definition of what an asset is and when an asset should be recognized and (ii) to eliminate the current practice of recognizing assets that do not meet the definition and recognition criteria. Under these changes, effective January 1, 2009, the deferral and matching of operating expenses over future revenues is, with some exceptions, no longer appropriate. The adoption of this standard had no material impact on the Trust’s consolidated financial statements.
Future changes in accounting policiesIn January 2009, the CICA issued Handbook Section 1582, “Business Combinations”, Section 1601, “Consolidations”, and Section 1602, “Non-controlling Interests”. These sections replace the former CICA Handbook Section 1581, “Business Combinations” and Section 1600, “Consolidated Financial Statements” and establish a new section for accounting for a non-controlling interest in a subsidiary.
Section 1582 establishes standards for the accounting for a business combination. It provides the Canadian equivalent to International Financial Reporting Standards IFRS 3, “Business Combinations” (January 2008). The section applies prospectively to business combinations for which the acquisition date is on or after the beginning of the first annual reporting period on or after January 1, 2011.
Section 1601 establishes standards for the preparation of consolidated financial statements.
Section 1602 establishes standards for accounting for a non-controlling interest in a subsidiary in consolidated financial statements subsequent to a business combination. It is equivalent to the corresponding provisions of International Financial Reporting Standard IAS 27, “Consolidated and Separate Financial Statements” (January 2008).
Section 1601 and Section 1602 apply to interim and annual consolidated financial statements relating to fiscal years beginning on or after January 1, 2011.

CALLOWAY REIT 2009 Annual Report 57
Earlier adoption of these sections is permitted as of the beginning of a fiscal year. All three sections must be adopted concurrently. As at December 31, 2009, the Trust did not adopt these sections. The Trust is currently evaluating the impact of the adoption of these sections.
International Financial Reporting StandardsIn January 2006, the CICA Accounting Standards Board (AcSB) adopted a strategic plan for the direction of accounting standards in Canada. As part of that plan, accounting standards for public companies would be required to converge with International Financial Reporting Standards (IFRS) for fiscal years beginning on or after January 1, 2011, with comparative figures presented on the same basis. In February 2008, the AcSB confirmed the effective date of the initial adoption of IFRS.
While the conceptual framework underlying IFRS is similar to Canadian GAAP, there are several significant differences. While the adoption of IFRS will not have a material impact on the reported cash flows of the Trust, it is expected that it will have a material impact on the Trust’s consolidated balance sheets and consolidated statements of income and comprehensive income. The Trust has performed an assessment of the expected impact of IFRS on its consolidated financial statements and has identified potentially significant accounting policy and presentation changes that may impact the presentation and measurement of income properties, proportionate consolidation of joint ventures, balance sheet classification of unit equity, accounting for leases, accounting for income taxes and presentation of a classified balance sheet. A more detailed discussion of the Trust’s IFRS transition plan and significant impact areas can be found in the Management’s Discussion and Analysis.
Principles of consolidationThe consolidated financial statements include the accounts of the Trust and its subsidiaries, together with its proportionate share of the assets, liabilities, revenue and expenses of all co-ownerships in which it participates.
The Trust follows the requirements of CICA Accounting Guideline 15, “Consolidation of Variable Interest Entities” (AcG-15), which provides guidance for applying the principles in CICA Handbook Section 1590, “Subsidiaries”, to those entities defined as Variable Interest Entities (VIEs). This standard considers a VIE to be an entity in which either: (i) the equity at risk is not sufficient to permit it to finance its activities without additional subordinated financial support from other parties; or (ii) equity investors lack either voting control, an obligation to absorb expected losses or the right to receive expected residual returns. AcG-15 requires consolidation of VIEs by the primary beneficiary. The primary beneficiary is defined as the party who has exposure to the majority of a VIE’s expected losses and/or expected residual returns. The Trust has determined that it is not the primary beneficiary of any VIEs.
Exchangeable securitiesThe Trust has applied the recommendations of the Emerging Issues Committee (EIC) of the CICA, who issued an abstract of Issues Discussed No. 151, Exchangeable Securities Issued by Subsidiaries of Income Trusts (EIC-151), which provides guidance on the presentation of exchangeable securities issued by a subsidiary of an income trust. In order to be presented as equity, the exchangeable securities must have distributions that are economically equivalent to distributions on units issued directly by the income trust and the exchangeable securities must also ultimately be exchanged for units of the income trust; otherwise the exchangeable securities would be presented as either a liability or non-controlling interest. The Trust has determined that it is appropriate to present its exchangeable securities as equity.
Real estate assetsa) Income properties Income properties are carried at cost less accumulated amortization, less impairment charges, if any. Cost includes initial
acquisition costs, improvements, other direct costs and capitalized development costs. In accordance with EIC-137, Recognition of Customer Relationship Intangible Assets Acquired in a Business Combination, and EIC-140, Accounting for Operating Leases Acquired in Either an Asset Acquisition or a Business Combination, the cost of income property acquisitions initiated on or after September 12, 2003, is allocated to tangible and intangible assets based on their respective fair market values. Tangible assets include land, buildings, tenant improvements and equipment. The fair value of buildings is determined using an income-based valuation approach referred to as the “as if vacant” approach. Intangible assets include the value of in-place leases, the value of above and below market leases and the value of tenant relationships, if any. For income property acquisitions initiated before September 12, 2003, the cost of income properties was allocated to land and buildings based on their respective fair values.
58 CALLOWAY REIT 2009 Annual Report
Notes to Consolidated Financial Statements
The Trust records amortization expense on a straight-line basis over the assets’ estimated useful lives as follows:
Buildings 40 yearsBuildings under land leases or capital leases lesser of 40 years and term of respective leaseTenant improvements term of respective leaseEquipment 5 yearsValue of in-place leases term of respective leaseValue of tenant relationships term of respective lease plus renewal periods as applicable
The Trust amortizes the value of the above and below market leases on a straight-line basis over the term of the respective lease as an adjustment to rentals from income properties.
b) Properties under development Properties under development are stated at cost less impairment charges, if any. Cost includes initial acquisition costs,
other direct costs of development and construction, allocation of directly attributable general and administrative expenses, property taxes, interest on both specific and general debt, and incidental operating revenues and expenses during the period of development. Certain properties under development are subject to development management agreements (see note 5(a)).
c) Impairment of income properties and properties under development The Trust uses a two-step process for determining when an impairment of income properties and properties under development
should be recognized in the consolidated financial statements. If events or circumstances indicate the carrying value of a property may be impaired, a recoverability analysis is performed based on estimated undiscounted future cash flows to be generated from property operations and its projected disposition. If the analysis indicates that the carrying value is not recoverable from future cash flows, the property is written down to estimated fair value and an impairment charge is recognized.
d) Properties held-for-sale and discontinued operations A property is classified by the Trust as held-for-sale on the consolidated balance sheets at the point in time when it is available
for immediate sale, management has committed to a plan to sell the asset and is actively locating a buyer for the asset at a sales price that is reasonable in relation to the current fair value of the asset, and the sale is probable and expected to be completed within a one-year period. Properties held-for-sale are stated at the lower of cost and fair value less selling costs. No further amortization is recorded on these properties once classified as held-for-sale. A property that is subsequently reclassified to held and in use is measured at the lower of: (i) its carrying amount before it was classified as held-for-sale, adjusted for any amortization expense that would have been recognized had it been continuously classified as held and in use; and (ii) its estimated fair value at the date of the subsequent decision not to sell. The results of operations associated with properties disposed of, or classified as held for sale, are reported separately as income from discontinued operations when the Trust will have no continuing involvement with the ongoing cash flow of the assets.
e) Deferred leasing costs Deferred leasing costs include leasing commissions and other leasing costs. These costs are deferred and amortized on a straight-line
basis over the terms of the respective lease.
f ) Impairment of mortgages and loans receivable Mortgages and loans receivable are classified as impaired when, in the opinion of management, there is reasonable doubt as to
the timely collection of principal and interest. The carrying amount of a mortgage or loan receivable that is classified as impaired is reduced to its estimated realizable amount.
Financial instruments – recognition and measurementFinancial instruments must be classified into one of the following five categories: held-for-trading, held-to-maturity, loans and receivables, available-for-sale financial assets, or other financial liabilities. Initially, all financial assets and financial liabilities are recorded on the consolidated balance sheet at fair value. After initial recognition, financial instruments are measured at their fair values, except for held-to-maturity investments, loans and receivables and other financial liabilities, which are measured at amortized cost. The effective interest related to financial assets and liabilities measured at amortized cost and the gain or loss arising from the change in the fair value of financial assets or liabilities classified as held-for-trading are included in net income for the period in which they arise. Available-for-sale financial instruments are measured at fair value with gains and losses recognized in other comprehensive income until the financial asset is derecognized and all cumulative gains or losses are then recognized in net income.

CALLOWAY REIT 2009 Annual Report 59
i) Financial assets and liabilities The Trust has classified as loans and receivables its cash and cash equivalents, mortgages and loans receivable, financial assets
included in amounts receivable and deposits. These are initially measured at fair value and subsequently measured at amortized cost using the effective interest method. Debt and financial liabilities included in accounts payable and accrued liabilities are classified as other financial liabilities, which are initially measured at fair value and subsequently measured at amortized cost, using the effective interest method.
ii) Financing costs Financing costs include commitment fees, underwriting costs and legal costs associated with the acquisition or issuance of
financial assets or liabilities.
Financing costs relating to term mortgages, non-revolving credit facilities and debentures are accounted for as part of the respective liability’s carrying value at inception and amortized to interest expense using the effective interest method. Financing costs incurred to establish revolving credit facilities are deferred as a separate asset on the consolidated balance sheet and amortized on a straight-line basis over the term of the facilities. In the event that any debt is terminated, any associated unamortized financing costs are expensed immediately. Upon conversion of convertible debt into Trust Units, a portion of the associated unamortized financing costs is charged to equity. Financing costs relating to financial assets are expensed immediately.
iii) Derivative instruments Derivative financial instruments may be utilized by the Trust in the management of its interest rate exposure. The Trust’s policy
is not to utilize derivative instruments for trading or speculative purposes. Derivative instruments and certain non-financial derivative instruments are measured at fair value with changes in fair value recognized in the consolidated statements of income and comprehensive income. Derivative instruments may be embedded in other financial instruments and other contracts. Embedded derivative instruments are accounted for as separate derivative instruments when their economic characteristics and risks are not closely related to those of the host contract; the terms of the embedded derivative instruments are the same as those of a stand-alone derivative; and the combined contract is not classified as held for trading. Embedded derivative instruments are measured at fair value with changes in fair value recognized in the consolidated statements of income and comprehensive income.
iv) Fair value of financial instruments The fair value of a financial instrument is the amount of consideration that would be agreed upon in an arm’s-length transaction
between knowledgeable, willing parties who are under no compulsion to act; i.e., the fair value of consideration given or received. In certain circumstances, however, the fair value may be based on other observable current market transactions in the same instrument, without modification or on a valuation technique using market-based inputs. The carrying value of the Trust’s financial assets included in amounts receivable, deposits, cash and cash equivalents and financial liabilities included in accounts payable and accrued liabilities approximates their fair value because of the short period to receipt or payment of cash. The fair value of the convertible debentures and unsecured debentures is based on their market price. The fair values of mortgages and loans receivable, term mortgages, development loans and credit facilities are estimated based on discounted future cash flows using discounted rates that reflect current market conditions for instruments with similar terms and risks. Such fair value estimates are not necessarily indicative of the amounts the Trust might pay or receive in actual market transactions.
Cash and cash equivalentsCash and cash equivalents are comprised of cash and include short-term investments with original maturities of three months or less. At December 31, 2009, cash and cash equivalents include the Trust’s proportionate share of cash balances of joint ventures of $2,076 (December 31, 2008 – $3,684).
Convertible debenturesUpon issuance, convertible debentures are separated into their debt and equity components. These components are measured based on their respective estimated fair values at the date of issuance of the convertible debentures. The fair value of the debt component is estimated based on the present value of future interest and principal payments due under the terms of the convertible debentures using a discounted rate for similar debt instruments without a conversion feature. The value assigned to the equity component is the estimated fair value ascribed to the holders’ option to convert the convertible debentures into units. The difference between the fair value of the debt component of the convertible debentures and their face value at issuance is recognized as interest expense using the effective interest method.

60 CALLOWAY REIT 2009 Annual Report
Notes to Consolidated Financial Statements
Unit-based compensationa) Unit options issued to non-employees on acquisitions (the Earnout Options) The Earnout Options are described in note 11(b). In connection with certain acquisitions and the associated development
agreements, the Trust may grant options to acquire units of the Trust or Calloway Limited Partnership (LP) to SmartCentres or other vendors. These options are exercisable, at strike prices determined on the date of grant, upon the completion and rental of additional space on acquired properties. These options are measured at fair value at the date of grant using a Black-Scholes option pricing model and are included in determining the cost of the acquisition.
b) Deferred unit plan The deferred unit plan is described in note 11(c). Deferred units granted to trustees and executives in respect of their Trustee
fees or bonuses are considered to be in respect of past services and are recognized in compensation expense upon grant. Deferred units granted relating to amounts matched by the Trust are considered to be in respect of future services and are recognized in compensation expense on a straight-line basis over the vesting period. Compensation cost is measured based on the market price of the Trust’s units on the date of grant of the deferred units. The deferred units earn additional deferred units for the distributions that would otherwise have been paid on the deferred units as if they instead had been issued as Trust Units on the date of grant. No additional compensation cost is recorded for these additional deferred units issued. Deferred units that have vested, but for which the corresponding Trust Units have not been issued and where the ultimate issuance of such Trust Units is simply a matter of the passage of time, are considered to be outstanding units from the date of vesting for basic income per unit calculations.
Revenue recognitionRentals from income properties include rents from tenants under leases, property tax and operating cost recoveries, percentage participation rents, lease cancellation fees, parking income and incidental income. Rents from tenants may include free rent periods and rental increases over the term of the lease and are recognized in revenue on a straight-line basis over the term of the lease. The difference between revenue recognized and the cash received is included in amounts receivable as straight-line rent receivable and is considered collectible. Recoveries from tenants are recognized as revenue in the period in which the applicable costs are incurred. Percentage participation rents are recognized after the minimum sales level has been achieved with each lease. Lease cancellation fees are recognized as revenue when the tenant foregoes the rights and obligations from the use of the space. Other income is recorded in the period it is earned.
For properties under development, rentals from individual units in income properties are recognized in the consolidated statements of income and comprehensive income commencing upon the earlier of attaining a break-even point in cash flow after debt servicing or the expiration of a reasonable period of time following substantial completion determined at the time of approval of the project. Prior to the income property under development meeting these criteria, revenues net of expenses are recorded as a reduction of capitalized costs.
Income per Unit calculationsBasic income per unit is calculated by dividing income by the weighted average number of units outstanding for the year including vested deferred units. The calculation of income per unit on a diluted basis considers the potential exercise or conversion of outstanding Earnout Options and unvested deferred units using the treasury stock method and Convertible Debentures using the “if-converted” method, in all cases when dilutive.
Income taxesThe Trust uses the liability method of accounting for future income taxes. The net future income tax liability or asset represents the cumulative amount of tax applicable to the temporary differences between the carrying amount of assets and liabilities and their carrying amounts for tax purposes. A future income tax asset, including the benefit of tax losses available to be carried forward to future years for tax purposes, is recognized if it is more likely than not to be realized; otherwise a valuation allowance is recognized. Future income taxes are measured at the tax rates expected to apply in the future when temporary differences reverse and tax losses are utilized. Changes to future income taxes relating to changes in tax rates are recognized in income in the period when the tax rate change is substantively enacted.
Comparative figuresCertain of the comparative figures have been reclassified to conform to the current year’s financial statement presentation.

CALLOWAY REIT 2009 Annual Report 61
3. AcquisitionsAcquisitions completed during the year ended December 31, 2009
a) On August 31, 2009, the Trust completed the acquisition from SmartCentres of a 50% leasehold interest in an income property (272,595 square feet) in Richmond Hill, Ontario, for $40,814 pursuant to an existing agreement signed in 2007. The purchase price was satisfied by the proceeds received from an existing mortgage receivable of $20,756, the assumption of an existing first mortgage totalling $17,917 and the balance in cash, adjusted for other working capital amounts.
b) On April 30, 2009, the Trust completed the acquisition from SmartCentres of a 50% co-ownership interest in an 86.6 acre development property in Innisfil, Ontario, for a purchase price totalling $14,285, which was paid with proceeds received from an existing mortgage receivable of $14,075, adjusted for other working capital amounts.
c) During the year ended December 31, 2009, pursuant to development management agreements referred to in note 5(a), the Trust completed the purchase of Earnouts totalling 640,814 square feet of development space from SmartCentres and other vendors for $140,496. The purchase price was satisfied through the issuance of 32,489 Trust Units and 19,930 Class B Series 1 and Series 3 LP Units for combined consideration of $937 and the balance in cash, adjusted for other working capital amounts.
Consideration for the assets acquired during the year ended December 31, 2009, is summarized as follows:
Acquisitions Earnouts Total
Cash 2,351 89,379 91,730Proceeds received from an existing mortgage receivable 34,831 – 34,831Mortgages payable assumed at fair value 17,917 – 17,917Class B LP Units issued – 401 401Trust Units issued – 536 536Accounts payable and accrued liabilities assumed and repayment of loans receivable – 50,180 50,180
55,099 140,496 195,595
The allocation of the purchase price of the acquisitions during the year ended December 31, 2009, to the assets acquired is summarized as follows:
Acquisitions Earnouts Total
Income properties Tangible assets Land1 – 9,635 9,635 Buildings 24,235 95,274 119,509 Tenant improvements 691 8,180 8,871
24,926 113,089 138,015
Prepaid land rent1 11,849 9,963 21,812
Intangible assets In-place leases 3,601 15,273 18,874 Above market leases 56 – 56 Tenant relationships 382 2,171 2,553
4,039 17,444 21,483
40,814 140,496 181,310Properties under development 14,285 – 14,285
55,099 140,496 195,595
1 The allocation of the purchase price of Earnouts in the above table does not include the cost of previously acquired freehold land and leasehold land in the amount of $12,276 and $3,219, respectively.
As at December 31, 2009, the allocation of the purchase price to fair values of assets acquired and liabilities assumed for acquisitions was finalized. Income from the acquired properties is included in the consolidated statements of income and comprehensive income from the date of acquisition.
62 CALLOWAY REIT 2009 Annual Report
Notes to Consolidated Financial Statements
Acquisitions completed during the year ended December 31, 2008a) On February 15, 2008, the Trust completed the acquisition of a 4.98 acre development property in London, Ontario, for a
purchase price totalling $1,057 paid in cash, adjusted for other working capital items.
b) On June 13, 2008, the Trust completed the acquisition of freehold and leasehold 100% interests in six properties from a joint venture between SmartCentres and Wal-Mart Canada Realty Inc. As at the closing date, the six properties comprised approximately 1,414,547 net square feet of leased area, and included lands with potential for future development of approximately 305,378 net square feet. In connection with the acquisition, the Trust entered into long-term development management agreements with SmartCentres. The purchase price of the properties was $287,891 (including properties under development of $15,763), adjusted for costs of acquisition and working capital amounts. Of this purchase price, approximately $29,834 relates to 40% of one property (60% was a freehold acquisition) in which the Trust acquired leasehold interests and prepaid its entire lease obligations. The purchase price was satisfied by the assumption of non-interest-bearing mortgages provided by the vendors totalling $14,079, the issuance of 707,173 Class B Series 3 LP Units with a value of $15,062 (see note 11(a) for a description of Class B Series 3 LP Units) to SmartCentres resulting from the exercise of 707,173 Earnout Options previously issued, the issuance of 750,000 new Earnout Options to SmartCentres in exchange for 750,000 Earnout Options previously issued, and the balance in cash. In connection with this acquisition, on September 30, 2008, the Trust entered into an agreement with SmartCentres whereby all July 2005 Earnout Options to acquire Class B LP Units that have vested as at December 31, 2008 (estimated to be approximately 1,088,000 Earnout Options) must be exercised by June 30, 2009, with an extension to September 30, 2009, under certain circumstances. In addition, further July 2005 Earnout Options to acquire Class B LP Units (estimated to be approximately 2,757,000 Earnout Options) that have not vested as at December 31, 2008, must be exercised within 60 days of completion and rental of additional space on specific properties. The Class B Series 3 LP Units were valued at a price of $21.30 per unit, which was the approximate fair market value of Trust Units on the date the substantive terms of the acquisition were agreed-upon and announced. Earnout Options were valued at their estimated combined fair market value of $1,684 based on a Black-Scholes calculation using the following assumptions: average volatility ranging from 21.5% to 30.4% on the underlying Trust Units; an exercise price of $20.10 per unit; a risk-free interest rate ranging from 2.13% to 3.60%; a weighted average expected life of one year; and an expected distribution rate on the Trust Units ranging from 7.27% to 8.30%.
c) On June 26, 2008, the Trust completed the acquisition of a development property in Brockville, Ontario, for a purchase price of $1,141 paid in cash, adjusted for other working capital amounts.
d) On November 17, 2008, the Trust completed the acquisition of a 1.12 acre development property in Toronto, Ontario, for a purchase price of $642 paid in cash, adjusted for other working capital amounts.
e) During the year ended December 31, 2008, pursuant to development management agreements referred to in note 5(a), the Trust completed the purchase of Earnouts totalling 820,500 square feet of development space from SmartCentres and other vendors for $189,945. The purchase price was satisfied through the issuance of 691,756 Trust Units and 244,115 Class B Series 1 LP Units for combined consideration of $14,656 and the balance in cash, adjusted for other working capital amounts.
Consideration for the assets acquired during the year ended December 31, 2008, is summarized as follows:
Acquisitions Earnouts Total
Cash 259,657 88,855 348,512Mortgages assumed at fair value 14,079 – 14,079Accounts payable and accrued liabilities assumed, and repayment of loans receivable 249 86,434 86,683Class B LP Units issued 15,062 4,906 19,968Trust Units issued – 9,750 9,750Earnout Options issued 1,684 – 1,684
290,731 189,945 480,676

CALLOWAY REIT 2009 Annual Report 63
The allocation of the purchase price of the acquisitions during the year ended December 31, 2008, to the assets acquired is summarized as follows:
Acquisitions Earnouts Total
Income properties Tangible assets Land1 91,289 7,187 98,476 Buildings 141,064 131,532 272,596 Tenant improvements 5,363 8,651 14,014
237,716 147,370 385,086
Prepaid land rent1 8,150 20,303 28,453
Intangible assets In-place leases 25,187 19,794 44,981 Above market leases 314 – 314 Below market leases (764) – (764) Tenant relationships 1,525 2,478 4,003
26,262 22,272 48,534
272,128 189,945 462,073Properties under development 18,603 – 18,603
290,731 189,945 480,676
1 T he allocation of the purchase price of Earnouts in the above table does not include the cost of previously acquired freehold land and leasehold land in the amount of $15,389 and $24,868, respectively.
As at December 31, 2008, the allocation of the purchase price to fair values of assets acquired and liabilities assumed for acquisitions was finalized. Income from the acquired properties is included in the consolidated statements of income and comprehensive income from the date of acquisition.
4. Income propertiesIncome properties consist of the following:
2009 2008
Accumulated Accumulated Cost Amortization Net Cost Amortization Net
Tangible assets Land 898,356 – 898,356 881,167 – 881,167 Buildings 2,330,399 218,505 2,111,894 2,157,199 159,861 1,997,338 Tenant improvements 190,925 78,440 112,485 201,077 76,938 124,139 Equipment 935 466 469 911 369 542
3,420,615 297,411 3,123,204 3,240,354 237,168 3,003,186
Prepaid land rent 160,827 10,254 150,573 162,452 7,549 154,903
Intangible assets In-place leases 396,008 154,820 241,188 422,388 152,628 269,760 Above market leases 536 152 384 556 85 471 Below market leases (2,355) (1,122) (1,233) (2,436) (823) (1,613) Tenant relationships 32,250 8,867 23,383 30,701 6,854 23,847
426,439 162,717 263,722 451,209 158,744 292,465
Total income properties 4,007,881 470,382 3,537,499 3,854,015 403,461 3,450,554
a) Capital leases As at December 31, 2009, 14 (December 31, 2008 – 13) income properties with a cost of $685,753 (December 31, 2008 –
$609,655) and a net book value of $608,734 (December 31, 2008 – $547,253) are subject to capital leases, summarized as follows: • Three of the leasehold interests commenced in 2005 under the terms of 35-year leases with SmartCentres. SmartCentres
has the right to terminate the leases after ten years on payment to the Trust of the market value of a 35-year leasehold interest in the properties at that time and also has the right to terminate the leases at any time in the event any third party acquires 20% of the aggregate of the Trust Units and special voting units by payment to the Trust of the unamortized balance of any prepaid lease cost. The Trust does not have a purchase option under these three leases.

64 CALLOWAY REIT 2009 Annual Report
Notes to Consolidated Financial Statements
• Of the ten (December 31, 2008 – nine) leasehold interests that commenced in 2006 through 2009, four are under the terms of 80-year leases with SmartCentres and six are under the terms of 49-year leases with SmartCentres. The Trust has separate options to purchase each of these ten leasehold interests at the end of the respective leases at prices that are not considered to be bargain prices.
• The Trust prepaid its entire lease obligations for these 13 leasehold interests in the amount of $641,731 (December 31, 2008 – $565,543), including prepaid land rent of $160,827 (December 31, 2008 – $162,452); upon the completion and rental of additional space, the Trust prepaid its entire lease obligations relating to build-out costs of $44,327 (year ended December 31, 2008 – $66,481). There are no bargain purchase options at the end of the lease terms for these 13 leasehold interests and, accordingly, the portion of the prepaid lease obligation attributable to land has been classified as prepaid land rent. Amortization of prepaid land rent is included in property operating costs in the consolidated statements of income and comprehensive income.
• One leasehold interest commenced in 2003 under the terms of a 35-year lease with SmartCentres. The lease requires a $10,000 payment at the end of the lease term in 2038 to exercise a purchase option, which is considered to be a bargain purchase option. The Trust prepaid its entire lease obligation for this property of $44,022 (December 31, 2008 – $44,112). This purchase option due at the end of the lease has been included in accounts payable, net of imputed interest at 9.18% of $9,284 (December 31, 2008 – $9,347), in the amount of $716 (December 31, 2008 – $653) (see note 9(b)). As the purchase option is considered to be a bargain purchase option, the portion of the prepaid lease obligation attributable to land has been classified as land.
b) Other During the year ended December 31, 2009, unamortized tenant improvements and intangible assets relating to space that was
vacated by tenants during the period before the expiry of their lease terms, totalling $12,922 (December 31, 2008 – $3,442), were charged to amortization expense.
5. Properties under developmentProperties under development consist of the following:
2009 2008
Properties under development subject to development management agreements (a) 117,878 159,587Properties under development not subject to development management agreements (b) 247,172 222,248
365,050 381,835
For the year ended December 31, 2009, general and administrative expenses of $604 (December 31, 2008 – $2,096) were capitalized to properties under development.
During 2008, the Trust recorded an asset impairment loss of $1,808 related to a property under development not subject to development management agreements. This property was the subject of Aboriginal land claims with the outcome undeterminable at that time. As a result, the Trust had written down the carrying amount to its estimated fair value.
a) Properties under development subject to development management agreements These properties under development (including certain leasehold properties) are subject to various development management
agreements with SmartCentres, Wal-Mart Canada Realty Inc., Hopewell, and the other vendors of the properties. Pursuant to the development management agreements, the vendors assume responsibility for managing the development of the land on behalf of the Trust and are granted the right for a period of two to ten years to earn an Earnout fee. Upon the completion and rental of additional space on these properties, the Trust is obligated to pay the Earnout fee and to purchase the additional developments, at a total price calculated by a formula using the net operating rents and predetermined negotiated capitalization rates, on the date rent becomes payable on the additional space (Gross Cost). For additional space completed on land with a carrying value of $76,584 (December 31, 2008 – $84,776), the fixed predetermined negotiated capitalization rates range from 6.00% to 10.00% during the five-year period of the respective development acquisition agreements. For additional space completed on land with a carrying value of $41,294 (December 31, 2008 – $74,811), the predetermined negotiated capitalization rates are fixed for each contract for either the first 1, 2, 3 or 4 years, ranging from 6.00% to 8.00%, and then are determined by reference to the ten-year Government of Canada bond rate at the time of completion plus a fixed predetermined negotiated spread ranging from 2.00% to 3.90% for the remaining term of the ten-year period of the respective development management agreements subject to a maximum capitalization rate ranging from 6.60% to 9.50%. The Earnout fee is calculated as the Gross Cost less the associated land and development costs incurred by the Trust.

CALLOWAY REIT 2009 Annual Report 65
For certain of these properties under development, SmartCentres and other unrelated parties have been granted Earnout Options that give them the right, at their option, to receive up to 40% of the Earnout fee for one of the agreements and up to 30% to 40% of the Gross Cost for the remaining agreements in Trust Units, Class B LP Units or Class D LP Units, at predetermined option strike prices, for developments completed pursuant to the development management agreements, subject to a maximum number of units. For the year ended December 31, 2009, the Trust completed 640,814 square feet (December 31, 2008 – 820,500 square feet) of retail space with a Gross Cost of $81,323 (December 31, 2008 – $110,873) exclusive of cost of land previously acquired, and Earnout fees paid to the vendors of $59,173 (December 31, 2008 – $79,072). SmartCentres elected to receive $536 (December 31, 2008 – $9,750) in Trust Units and $401 (December 31, 2008 – $4,906) in Class B Series 1 and Series 3 LP Units. The vendors have provided non-interest-bearing loans for the initial land acquisition costs and interest-bearing loans to finance additional costs of development (notes 10(c) and 10(b), respectively).
b) Properties under development not subject to development management agreements These properties under development are being developed directly by the Trust. SmartCentres and the other vendors have been
granted Earnout Options that give them the right, at their option, to acquire Class B Series 1 LP Units, at predetermined option strike prices, on the completion and rental by the Trust of additional space on certain of these properties under development, subject to a maximum number of units (note 11(b)). During the year ended December 31, 2009, the Trust completed the development and leasing of certain income properties on property under development not subject to development management agreements. Costs in respect of land of $6,283 (December 31, 2008 – $8,420), buildings of $20,031 (December 31, 2008 – $19,034) and tenant improvements of $2,629 (December 31, 2008 – $1,853) have been reclassified from properties under development to income properties. For the year ended December 31, 2009, nil (December 31, 2008 – 218,089) Earnout Options were exercised on the completion and rental of additional space resulting in the issuance of nil (December 31, 2008 – 198,523) Class B Series 1 LP Units and nil (December 31, 2008 – 19,566) Class D Series 1 LP Units with a total value of $nil (December 31, 2008 – $4,385). In addition, during the year ended December 31, 2009, nil (December 31, 2008 – 10,055) Earnout Options were exercised for nil (December 31, 2008 – 10,055) Trust Units with a value of $nil (December 31, 2008 – $203).
6. Mortgages and loans receivableMortgages and loans receivable consist of the following:
2009 2008
Mortgages receivable (a) 173,410 221,420Loans and notes receivable (b), (c) and (d) 71,982 44,185
245,392 265,605
a) Mortgages receivable of $132,425 (December 31, 2008 – $183,182) and $40,985 (December 31, 2008 – $38,238) have been provided pursuant to agreements with SmartCentres and other unrelated parties, respectively, in which the Trust will lend up to $280,135 (December 31, 2008 – $365,096) for use in acquiring and developing thirteen (December 31, 2008 – seventeen) properties in Ontario, Quebec and British Columbia. Interest on these mortgages accrues monthly at 6.35% to 10% (December 31, 2008 – 6.35% to 10%) and is added to the outstanding principal up to a predetermined maximum accrual after which it is payable in cash monthly. A further $46,702 may be accrued on the various mortgages receivable before cash interest must be paid. The principal and unpaid interest amounts are due at the maturity of the mortgages at various dates between 2010 and 2018 (one to ten years from the initial advance). The mortgages are secured by either a first, second or third charge on properties, assignments of rents and leases, and general security agreements. In addition, other SmartCentres affiliated companies have provided limited indemnities and guarantees on certain of the mortgages receivable. For the year ended December 31, 2009, $23,853 (December 31, 2008 – $46,625) has been funded including accrued interest of $12,694 (December 31, 2008 – $18,580), offset by repayments of $71,863 (December 31, 2008 – $31,982).
The following provides further details on these mortgages receivable: • For mortgages totalling $149,791 (December 31, 2008 – $192,212), the Trust has an option to acquire a 50% (eight
properties) to 100% (three properties) interest in the eleven properties (December 31, 2008 – fifteen) upon substantial completion at an agreed-upon formula using the net operating rents and a capitalization rate based on the ten-year Government of Canada bond rate at the time of completion plus a fixed predetermined negotiated spread ranging from 2.15% to 3.00% within a specified range as follows. Should the capitalization rate exceed the upper limit (ranging from 7.40% to 10.00%), the owner is not obligated to sell, with one exception, when the owner is obligated to sell, as there is

66 CALLOWAY REIT 2009 Annual Report
Notes to Consolidated Financial Statements
no upper limit. Should the capitalization rate be less than the lower limit, then the lower limit (ranging from 6.25% to 7.65%) is deemed to be the capitalization rate, with five exceptions, where no lower limit exists.
• The Trust has two (December 31, 2008 – one) agreements to loan SmartCentres up to $15,000 and $26,825, maturing in October 2017 and August 2018, for SmartCentres to use in acquiring and developing two properties in which the Trust has the other 50% co-ownership interest. The Trust has advanced $23,619 (December 31, 2008 – $8,316) on these mortgages as at December 31, 2009.
• During the year, an existing mortgage in the amount of $20,756 (December 31, 2008 – $20,892) with SmartCentres was repaid in connection with the acquisition of a 50% leasehold interest in the related income property (see note 3(a)).
b) Loans receivable of $57,921 (December 31, 2008 – $28,479) and $6,316 (December 31, 2008 – $11,389) have been provided pursuant to development management agreements with SmartCentres and Hopewell, respectively (note 5). The loans bear interest at rates that approximate the prime rate of a Canadian chartered bank plus rates ranging from 0.50% to 1.25% (December 31, 2008 – 0.50% to 1.25%). The loans receivable, including interest, are repayable at the completion and rental of the properties under development. SmartCentres and Hopewell have not provided any security in regard to the loans; however, the loan agreements stipulate that the proceeds of the loans are to be used to fund improvements to properties owned by the Trust. For the year ended December 31, 2009, $54,902 (December 31, 2008 – $56,645) has been funded, offset by repayments of $30,533 (December 31, 2008 – $63,434).
c) As at December 31, 2009, notes receivable of $2,608 (December 31, 2008 – $2,590) have been granted to SmartCentres. These secured demand notes bear interest at 9.00% per annum. During the year ended December 31, 2009, $18 (December 31, 2008 – $111) has been funded.
d) Loans receivable of $5,137 (December 31, 2008 – $1,727) have been provided pursuant to agreements with other unrelated parties. The loans bear interest at rates of 5.20% to 5.50%, mature in 2012 and 2015 and are secured by either first or second charges on properties, assignments of rents and leases, and general security agreements. For the year ended December 31, 2009, $nil (December 31, 2008 – $1,767) has been funded, offset by repayments of $130 (December 31, 2008 – $40). During the year, a loan receivable was reclassified from assets held for sale ($3,540) (see note 20).
The estimated fair values of the mortgages, loans and notes receivable based on current market rates for mortgages, loans and notes receivable with similar terms and risks are as follows:
2009 2008
Mortgages receivable 171,375 211,073Loans and notes receivable 71,982 44,185
243,357 255,258
An assessment of impairment on mortgages and loans receivable is made on a quarterly basis. The full outstanding amount of mortgages and loans receivable as at December 31, 2009, is neither impaired nor past due and there are no indications as of December 31, 2009, that the borrowers will not meet their payment obligations.
7. Deferred leasing costsDeferred leasing costs consist of the following:
2009 2008
Accumulated Accumulated Cost Amortization Net Cost Amortization Net
Leasing commissions and other leasing costs 7,287 1,939 5,348 5,513 1,351 4,162
8. Deferred financing costsDeferred financing costs that relate to revolving operating and acquisition facilities consist of the following:
2009 2008
Accumulated Accumulated Cost Amortization Net Cost Amortization Net
Deferred financing costs 5,039 2,624 2,415 3,533 1,765 1,768
Amortization of deferred financing costs is included in interest expense (note 10(g)).

CALLOWAY REIT 2009 Annual Report 67
9. Working capitala) Amounts receivable, prepaid expenses and deposits Amounts receivable, prepaid expenses and deposits consist of the following:
2009 2008
Amounts receivable Tenant receivables – net 10,087 12,601 Other tenant receivables 7,505 7,466 Straight-line rent receivable 27,755 23,591Other receivables 4,465 5,041
49,812 48,699
Prepaid expenses and deposits Prepaid expenses and other 3,432 3,847 Deposits 405 488
3,837 4,335
53,649 53,034
Tenant receivablesThe Trust determines that impairment exists when there is objective evidence that the Trust will not be able to collect all amounts due. Significant financial difficulties, bankruptcy or financial reorganization are considered indicators of tenant receivable impairment. The carrying amount of tenant receivables is reduced through the use of an allowance account and a loss is recorded in the consolidated statements of income and comprehensive income within “Property operating costs.” When a tenant receivable is uncollectible, it is written off against the allowance for bad debts account for tenant receivables. Subsequent recoveries of tenant receivables previously written off are credited against “Property operating costs” in the consolidated statements of income and comprehensive income.
The reconciliation of changes in the allowance for bad debts on tenant receivables is as follows:
2009 2008
Balance, January 1 2,029 1,394Additional allowance recognized as expense 2,334 1,274Reversal of previous allowances (1,024) (396)Tenant receivables written off during the year (923) (243)
Balance, December 31 2,416 2,029
The total additional allowance of $1,310 (December 31, 2008 – $878) net of reversals of $1,024 (December 31, 2008 – $396) relates to allowances for specific tenant receivable impairments. Amounts written off totalling $923 (December 31, 2008 – $243) relate to uncollectible amounts from specific tenants that have vacated their premises or where there is a settlement of a specific amount.
Tenant receivables representing rental payments from tenants are due at the beginning of each month. Annual common area maintenance (CAM) and property taxes are considered past due 60 days after billing. The decrease in net tenant receivables over December 31, 2008, is primarily due to additional collections of old balances and uncollectible accounts written off at year-end.
Tenant receivables less than 90 days old total $2,710 (December 31, 2008 – $5,925). The tenant receivable amounts older than 90 days totalling $7,377 (December 31, 2008 – $6,676), net of bad debt allowances of $2,416 (December 31, 2008 – $2,029) and credits of $nil (December 31, 2008 – $428), primarily pertain to CAM and property tax queries. Of the amounts over 90 days old, $580 has been collected subsequent to the year-end. The remaining amounts totalling $6,797 are at various stages of the collection process and are considered by management to be fully collectible and not impaired.
Other tenant receivables totalling $7,505 (December 31, 2008 – $7,466) pertain to unbilled CAM and property tax recoveries and chargebacks, property taxes recoverable from municipalities and insurance claims. These amounts are considered current and collectible and are at various stages of the billing and collection process.
Other receivablesOther receivables consist primarily of accrued interest and related-party receivables. As at December 31, 2009, other receivables are neither past due nor impaired and there are no indications as of December 31, 2009, that the debtors will not meet their payment obligations.
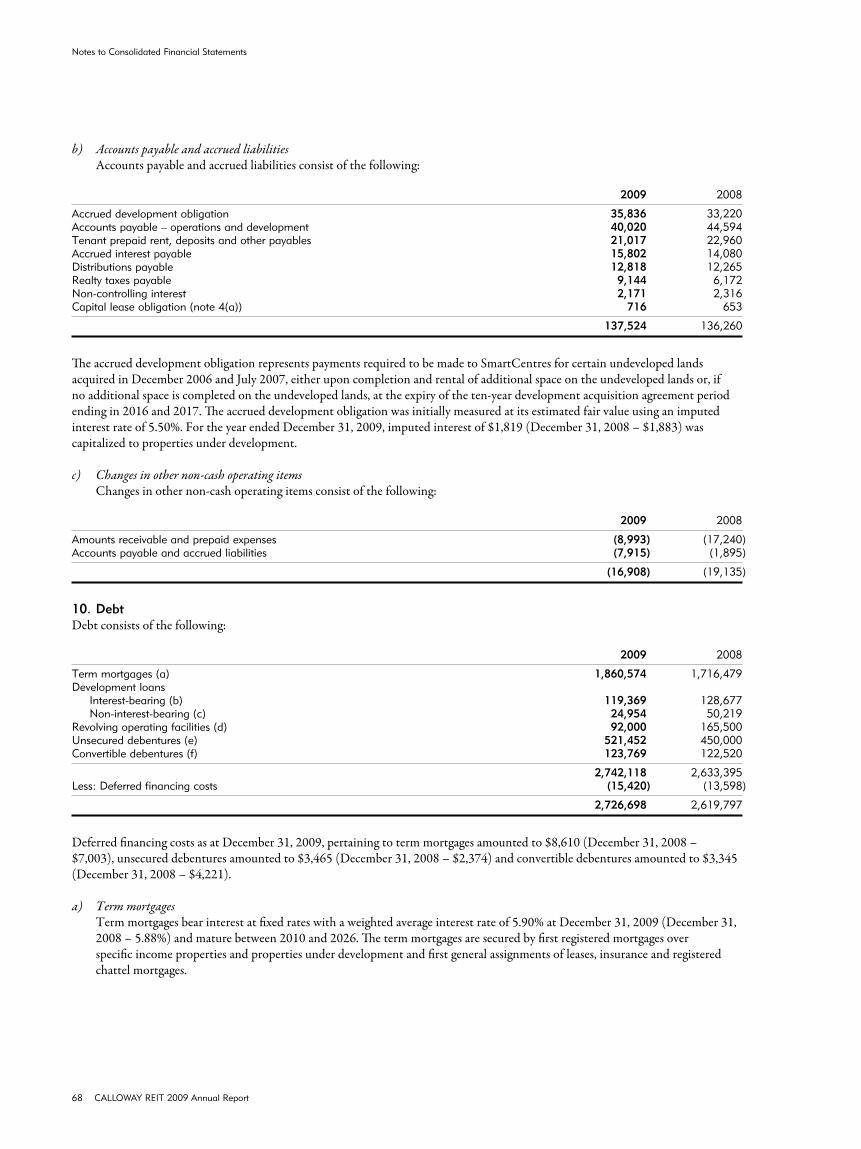
68 CALLOWAY REIT 2009 Annual Report
Notes to Consolidated Financial Statements
b) Accounts payable and accrued liabilities Accounts payable and accrued liabilities consist of the following:
2009 2008
Accrued development obligation 35,836 33,220Accounts payable – operations and development 40,020 44,594Tenant prepaid rent, deposits and other payables 21,017 22,960Accrued interest payable 15,802 14,080Distributions payable 12,818 12,265Realty taxes payable 9,144 6,172Non-controlling interest 2,171 2,316Capital lease obligation (note 4(a)) 716 653
137,524 136,260
The accrued development obligation represents payments required to be made to SmartCentres for certain undeveloped lands acquired in December 2006 and July 2007, either upon completion and rental of additional space on the undeveloped lands or, if no additional space is completed on the undeveloped lands, at the expiry of the ten-year development acquisition agreement period ending in 2016 and 2017. The accrued development obligation was initially measured at its estimated fair value using an imputed interest rate of 5.50%. For the year ended December 31, 2009, imputed interest of $1,819 (December 31, 2008 – $1,883) was capitalized to properties under development.
c) Changes in other non-cash operating items Changes in other non-cash operating items consist of the following:
2009 2008
Amounts receivable and prepaid expenses (8,993) (17,240)Accounts payable and accrued liabilities (7,915) (1,895)
(16,908) (19,135)
10. DebtDebt consists of the following:
2009 2008
Term mortgages (a) 1,860,574 1,716,479Development loans Interest-bearing (b) 119,369 128,677 Non-interest-bearing (c) 24,954 50,219Revolving operating facilities (d) 92,000 165,500Unsecured debentures (e) 521,452 450,000Convertible debentures (f) 123,769 122,520
2,742,118 2,633,395Less: Deferred financing costs (15,420) (13,598)
2,726,698 2,619,797
Deferred financing costs as at December 31, 2009, pertaining to term mortgages amounted to $8,610 (December 31, 2008 – $7,003), unsecured debentures amounted to $3,465 (December 31, 2008 – $2,374) and convertible debentures amounted to $3,345 (December 31, 2008 – $4,221).
a) Term mortgages Term mortgages bear interest at fixed rates with a weighted average interest rate of 5.90% at December 31, 2009 (December 31,
2008 – 5.88%) and mature between 2010 and 2026. The term mortgages are secured by first registered mortgages over specific income properties and properties under development and first general assignments of leases, insurance and registered chattel mortgages.

CALLOWAY REIT 2009 Annual Report 69
Principal repayment requirements for term mortgages are as follows:
Lump Sum Instalment Payments Payments at Maturity Total
2010 48,695 24,039 72,7342011 50,310 83,265 133,5752012 50,730 84,182 134,9122013 48,010 232,950 280,9602014 45,052 219,181 264,233Thereafter 234,762 722,093 956,855
477,559 1,365,710 1,843,269
Acquisition date fair value adjustment 17,305
1,860,574
b) Interest-bearing development loans Interest-bearing development loans total $119,369 (December 31, 2008 – $128,677) and are detailed as follows: • Development loans totalling $101,601 (December 31, 2008 – $109,766) bear a variable interest rate of prime plus 0.50%
to 0.75% on $20,606 (December 31, 2008 – $43,303) and bankers’ acceptance rates plus 2.00% to 2.50% on $80,995 (December 31, 2008 – $66,463), due on demand, are secured by first and second registered mortgages over specific income properties and first general assignments of leases and insurance and are subject to review annually.
• Development loans totalling $17,768 (December 31, 2008 – $18,911) have been provided by a joint venture between SmartCentres and Wal-Mart Canada Realty Inc. to finance additional costs of developments (note 5(a)). They bear variable interest rates at the bankers’ acceptance rates plus 2.00%, are secured by first mortgages over specific income properties and income properties under development and first general assignments of leases, and are due the earlier of various dates between 2010 and 2014 or the date building construction is completed and the tenant is in occupancy and paying rent.
c) Non-interest-bearing development loans Non-interest-bearing development loans have been provided by a joint venture between SmartCentres and Wal-Mart Canada
Realty Inc. to finance initial land acquisition costs (note 5(a)). These loans were initially measured at their estimated fair value using imputed interest rates ranging from 4.03% to 5.16%, are secured by first mortgages over specific income properties and properties under development and first general assignments of leases, and are due the earlier of various dates in 2010 through 2014 and the date building construction is completed and the tenant is in occupancy and paying rent. During the year ended December 31, 2009, imputed interest of $1,123 (December 31, 2008 – $1,408) was capitalized to properties under development.
d) Revolving operating facilities The first revolving operating facility, with $59,000 outstanding (December 31, 2008 – $45,500), bears interest at a variable
interest rate based on bank prime plus 2.25% or banker’s acceptance rates plus 3.25%, is secured by first charges over specific income properties and first general assignments of leases and insurance and expires on September 30, 2011. The line was renewed and increased by $60,000 in September 2009 as additional properties were added to the security pool.
A second revolving operating facility, with $nil outstanding (December 31, 2008 – $120,000) secured by first charges over
specific income properties and first general assignments of leases and insurance was repaid at its maturity in August 2009.
A third revolving operating facility, with $33,000 outstanding (December 31, 2008 – $nil), with an available credit limit of $105,000, bears interest at a variable rate based on bank prime plus 2.00% or banker’s acceptance rates plus 3.00%, is secured by first charges over specific income properties and a first general assignment of leases and insurance, and matures on January 29, 2010, with an option to extend for a further six months with an increase in the interest rate of 0.25%.
2009 2008
First revolving operating facility 160,000 100,000Second revolving operating facility – 160,000Third revolving operating facility 105,000 –
Total available operating facilities 265,000 260,000Lines of credit – outstanding (92,000) (165,500)Letters of credit – outstanding (29,194) (36,583)
Remaining unused operating facilities 143,806 57,917

70 CALLOWAY REIT 2009 Annual Report
Notes to Consolidated Financial Statements
As at January 29, 2010, the remaining unused operating facilities decreased to $130,806 as the balances of the operating facilities were repaid and the third operating facility was not renewed.
e) Unsecured debentures
2009 2008
Series A senior unsecured, due September 22, 2010, bearing interest at 4.51% per annum, payable semi-annually on September 22 and March 22 46,452 200,000
Series B senior unsecured, due October 12, 2016, bearing interest at 5.37% per annum, payable semi-annually on October 12 and April 12 250,000 250,000
Series C senior unsecured, due April 14, 2014, bearing interest at 10.25% per annum, payable semi-annually on April 14 and October 14 150,000 –
Series D senior unsecured, due June 30, 2014, bearing interest at 7.95% per annum, payable semi-annually on June 30 and December 30 75,000 –
521,452 450,000
On April 13, 2009, the Trust issued $150,000 (net proceeds including issuance costs – $148,946) of 10.25% Series C unsecured debentures due on April 14, 2014, with semi-annual payments due on April and October 14 each year. The proceeds from the sale of the debenture together with $4,602 from existing operating facilities were used to repay $153,548 of the Trust’s Series A 4.51% unsecured debentures due on September 22, 2010.
On June 30, 2009, the Trust issued $75,000 (net proceeds including issuance costs – $74,250) of 7.95% Series D unsecured debentures due on June 30, 2014, with semi-annual payments due on June 30 and December 30 each year. The proceeds from the sale of the debenture were used to pay down the Trust’s operating facilities.
Dominion Bond Rating Services (DBRS) provides credit ratings of debt securities for commercial issuers, which indicate the risk associated with a borrower’s capabilities to fulfill its obligations. An investment grade rating must exceed “BB,” with the highest rating being “AAA”. The Trust’s debentures are rated “BBB” with a stable trend as at December 31, 2009.
f ) Convertible debentures On May 14, 2004, the Trust issued $55,000 of 6.00% convertible unsecured subordinated debentures (the 6.00% Convertible
Debentures) due June 30, 2014. The 6.00% Convertible Debentures are convertible at the holder’s option at any time into Trust Units at $17.00 per unit and are redeemable at the option of the Trust on or after June 28, 2010. The 6.00% Convertible Debentures were divided into their liability and equity components, measured at their respective fair values at time of issue. For the year ended December 31, 2009, $13 of the face value of the 6.00% Convertible Debentures (December 31, 2008 – $591) was converted into Trust Units (note 11(e)). At December 31, 2009, $4,815 of the face value of the 6.00% Convertible Debentures was outstanding (December 31, 2008 – $4,828).
On May 2, 2008, the Trust issued $125,000 of 6.65% convertible unsecured subordinated debentures (the 6.65% Convertible Debentures, and collectively, with the 6.00% Convertible Debentures: the Convertible Debentures) due June 30, 2013. The 6.65% Convertible Debentures are convertible at the holder’s option at any time into Trust Units at $25.25 per unit and are redeemable at the option of the Trust on or after June 30, 2011. The 6.65% Convertible Debentures were divided into their liability and equity components, measured at their respective fair values at the time of issue. For the year ended December 31, 2009, $nil of the face value of the 6.65% Convertible Debentures (December 31, 2008 – $nil) was converted into Trust Units. At December 31, 2009, $125,000 of the face value of the 6.65% Convertible Debentures was outstanding (December 31, 2008 – $125,000).
2009 2008
6.65% convertible unsecured subordinated debentures 118,954 117,6926.00% convertible unsecured subordinated debentures 4,815 4,828
123,769 122,520

CALLOWAY REIT 2009 Annual Report 71
g) Interest expense Interest expense consists of the following:
2009 2008
Interest at stated rate 150,950 137,334Amortization of acquisition date fair value adjustments (4,573) (5,026)Amortization of accretion on Convertible Debentures 1,262 –Amortization of deferred financing costs 6,041 4,631
153,680 136,939Less: Interest capitalized to properties under development (13,607) (12,611)
Interest expense 140,073 124,328
h) Fair values The estimated fair value of debt is approximately as follows:
2009 2008
Term mortgages 1,806,285 1,686,091Development loans 144,323 178,896Revolving operating facilities 92,000 165,500Unsecured debentures 543,430 392,182Convertible Debentures 134,178 106,796
2,720,216 2,529,465
11. Unit equityThe following presents the number of units issued and outstanding and the related carrying value of unit equity, for the years ended December 31, 2009, and December 31, 2008:
Number of Units Issued and Outstanding Carrying Amount
Class B and Class B and Trust Class D Class B Trust Trust Class D Class B Total Units LP Units LP II Units Units Units LP Units LP II Units Units $ $ $ $
(Table A) (Table B)
Balance – January 1, 2008 76,918,203 14,472,700 756,525 92,147,428 1,366,740 309,385 17,778 1,693,903Earnout Options exercised (b) 701,811 462,204 – 1,164,015 9,952 9,290 – 19,242Units issued for properties acquired (note 3) – 707,173 – 707,173 – 15,063 – 15,063Fair value of Earnout Options issued (note 3) – – – – – 1,684 – 1,684Deferred Unit Plan (c) – – – – 1,699 – – 1,699Distribution Reinvestment Plan (d) 1,024,298 – – 1,024,298 19,190 – – 19,190Debentures converted (e) 34,761 – – 34,761 574 – – 574LP Units converted to Trust Units 34,130 (34,130) – – 1,570 (1,570) – –Unit issuance costs – – – – (32) – – (32)
Balance – December 31, 2008 78,713,203 15,607,947 756,525 95,077,675 1,399,693 333,852 17,778 1,751,323Earnout Options exercised (b) 32,489 19,930 – 52,419 536 401 – 937Deferred Unit Plan (c) – – – – 1,877 – – 1,877Deferred Units exchanged for Trust Units (c) 39,496 – – 39,496 – – – –Distribution Reinvestment Plan (d) 969,090 – – 969,090 12,837 – – 12,837Units issued for cash (f) 3,226,000 – – 3,226,000 50,003 – – 50,003Debentures converted (e) 764 – – 764 13 – – 13Unit issuance costs – – – – (2,148) – – (2,148)
Balance – December 31, 2009 82,981,042 15,627,877 756,525 99,365,444 1,462,811 334,253 17,778 1,814,842

72 CALLOWAY REIT 2009 Annual Report
Notes to Consolidated Financial Statements
TABLE A: NUMBER OF UNITS ISSUED AND OUTSTANDING
Class B Class B Class B Class D Class D Series 1 Series 2 Series 3 Series 1 Series 2 Total LP Units LP Units LP Units LP Units LP Units Units
Balance – January 1, 2008 13,338,104 789,444 – 311,022 34,130 14,472,700Earnout Options exercised 442,638 – – 19,566 – 462,204Units issued for properties acquired – – 707,173 – – 707,173LP Units converted to Trust Units – – – – (34,130) (34,130)
Balance – December 31, 2008 13,780,742 789,444 707,173 330,588 – 15,607,947Earnout Options exercised 13,587 – 6,343 – – 19,930
Balance – December 31, 2009 13,794,329 789,444 713,516 330,588 – 15,627,877
TABLE B: CARRYING AMOUNT
Class B Class B Class B Class D Class D Series 1 Series 2 Series 3 Series 1 Series 2 Trust LP Units LP Units LP Units LP Units LP Units Units $ $ $ $ $ $
Balance – January 1, 2008 273,592 28,049 – 6,174 1,570 309,385Earnout Options exercised 8,897 – – 393 – 9,290Units issued for properties acquired – – 15,063 – – 15,063Fair value of Earnout Options issued 1,207 – 477 – – 1,684LP Units converted to Trust Units – – – – (1,570) (1,570)
Balance – December 31, 2008 283,696 28,049 15,540 6,567 – 333,852Earnout Options exercised 273 – 128 – – 401
Balance – December 31, 2009 283,969 28,049 15,668 6,567 – 334,253
a) Authorized units i) Trust Units The Trust is authorized to issue an unlimited number of voting Trust Units (Trust Units), each of which represents an
equal undivided interest in the Trust. All Trust Units outstanding from time to time shall be entitled to participate pro rata in any distributions by the Trust and, in the event of termination or windup of the Trust, in the net assets of the Trust. All Trust Units shall rank among themselves equally and rateably without discrimination, preference or priority. Unitholders are entitled to require the Trust to redeem all or any part of their Trust Units at prices determined and payable in accordance with the conditions provided for in the Declaration of Trust. A maximum amount of $50 may be redeemed in total in any one month unless otherwise waived by the Board of Trustees.
In accordance with the Declaration of Trust, distributions to Unitholders are declared at the discretion of the Trustees. The Trust endeavours to declare distributions in each taxation year in such an amount as is necessary to ensure that the Trust will not be subject to tax on its net income and net capital gains under Part I of the Income Tax Act (Canada).
The Trust is authorized to issue an unlimited number of special voting units that will be used to provide voting rights to holders of all series of Class B LP Units, all series of Class D LP Units, and Class B LP II Units, which are exchangeable into Trust Units. Special voting units are not entitled to any interest or share in the distributions or net assets of the Trust. Each special voting unit entitles the holder to the number of votes at any meeting of Unitholders of the Trust, which is equal to the number of Trust Units into which the exchangeable security is exchangeable or convertible. Special voting units are cancelled on the issuance of Trust Units on exercise, conversion or cancellation of the corresponding exchangeable securities. At December 31, 2009, there were 16,384,402 (December 31, 2008 – 16,364,472) special voting units outstanding. There is no value assigned to the special voting units.
ii) Calloway Limited Partnership Units Calloway Limited Partnership (LP) was formed on June 15, 2005, and commenced activity on July 8, 2005.
An unlimited number of any series of Class A LP Units, Class B LP Units, Class C LP Units, Class D LP Units, Class E LP Units and Class F LP Units may be issued by the LP. Class A LP partners have twenty votes for each Class A LP Unit held, Class B LP and Class D LP partners have one vote for each Class B LP Unit or Class D LP Unit held, respectively, and Class C LP, Class E LP and Class F LP partners have no votes at meetings of the LP. The LP is under the control of the Trust.

CALLOWAY REIT 2009 Annual Report 73
The Class A LP Units are entitled to all distributable cash of the LP after the required distributions on the other classes of units have been paid. At December 31, 2009, there were 3,114,131 (December 31, 2008 – 3,114,131) Class A LP Units outstanding. All Class A LP Units are owned indirectly by the Trust and have been eliminated on consolidation.
The Class B LP Units and the Class D LP Units are non-transferable, except under limited certain circumstances, but are exchangeable into an equal number of Trust Units at the holder’s option. During the year, nil (December 31, 2008 – 34,130) Class D Series 2 LP Units were exchanged for nil (December 31, 2008 – 34,130) Trust Units. The exchange was valued at a pro rata carrying amount of the LP Units. Holders of Class B LP Units and Class D LP Units are entitled to receive distributions equivalent to the distributions on Trust Units. Each Class B LP Unit and Class D LP Unit is entitled to one special voting unit, which will entitle the holder to receive notice of, attend and vote at all meetings of the Trust. The Class B LP Units and the Class D LP Units are considered to be economically equivalent to Trust Units and, accordingly, have been presented as equity in these consolidated financial statements.
The Class C LP Units and Class E LP Units are entitled to receive 0.01% of any distributions of the LP and have nominal value assigned in the consolidated financial statements. At the holder’s option, and upon the completion and rental of additional space on specific properties and payment of a specific predetermined amount per unit, the Class C Series 1 and Series 2 LP Units, the Class C Series 3 LP Units, and the Class E Series 1 LP Units are exchangeable into Class B LP Units, Class F Series 3 LP Units, and Class D Series 1 LP Units, respectively, and the Class E Series 2 LP Units are exchangeable into Class F Series 2 LP Units (the Class C LP Units and Class E LP Units are effectively included in the Earnout Options – see note 11(b)). Upon exercise of the Earnout Options relating to the LP, the corresponding Class C LP Units and Class E LP Units are cancelled.
At December 31, 2009, there were 6,209,512 (December 31, 2008 – 6,223,097) Class C Series 1 LP Units, 3,350,000 (December 31, 2008 – 3,350,000) Class C Series 2 LP Units, 743,657 (December 31, 2008 – 750,000) Class C Series 3 LP Units, 16,704 (December 31, 2008 – 16,704) Class E Series 1 LP Units and 800,000 (December 31, 2008 – 800,000) Class E Series 2 LP Units outstanding.
The Class F LP Units are entitled to receive a preferred return determined at the time of issue based on the bid-side yield on the ten-year Government of Canada Bond plus 135 basis points. There are certain redemption privileges at the option of each of the partnership and the Unitholder. The redemption price is $100 per unit. No Class F LP Units were outstanding as at December 31, 2009 or December 31, 2008. Upon issuance, the Class F LP Units would be recorded as a liability in the consolidated financial statements.
iii) Calloway Limited Partnership II Units Calloway Limited Partnership II (LP II) was formed on February 6, 2006, and commenced activity on May 29, 2006.
An unlimited number of Class A LP II Units and Class B LP II Units may be issued by the LP II. Class A LP II partners have five votes for each Class A LP II Unit held and Class B LP II partners have one vote for each Class B LP II Unit held. The LP II is under the control of the Trust.
The Class A LP II Units are entitled to all distributable cash of the LP II after the required distributions on the Class B LP II Units have been paid. At December 31, 2009, there were 200,001 (December 31, 2008 – 200,001) Class A LP II Units outstanding. The Class A LP II Units are owned indirectly by the Trust and have been eliminated on consolidation.
The Class B LP II Units are non-transferable, except under limited certain circumstances, but are exchangeable into an equal number of Trust Units at the holder’s option. Holders of Class B LP II Units are entitled to receive distributions equivalent to the distributions on Trust Units. Each Class B LP II Unit is entitled to one special voting unit, which will entitle the holder to receive notice of, attend and vote at all meetings of the Trust. The Class B LP II Units are considered to be economically equivalent to Trust Units and, accordingly, have been presented as equity in these consolidated financial statements.
b) Earnout Options As part of the consideration paid for certain income property acquisitions, the Trust has granted options in connection with
the development management agreements (note 5(a)) and in connection with properties under development not subject to development management agreements (note 5(b)). Upon completion and rental of additional space on specific properties and payment of the relevant option strike prices, the Earnout Options vest and the holder may elect to exercise the options and receive Trust Units, Class B LP Units or Class D LP Units, as applicable. The option strike prices were based on the market price of Trust Units on the date the substantive terms were agreed upon and announced.

74 CALLOWAY REIT 2009 Annual Report
Notes to Consolidated Financial Statements
The following presents the number of units granted, exercised and outstanding for the years ended December 31, 2009, and December 31, 2008:
Options Options Options Options Outstanding at Expired Exercised Outstanding at Proceeds January 1, During During December 31, During Strike Price 2009 2009 2009 2009 2009 $ # # # # $
Options to acquire Trust Units October 2003 10.00 12,688 – – 12,688 –October 2003 10.50 475,576 – (12,110) 463,466 127February 2004 14.00 442,007 – – 442,007 –May 2004 15.25 1 – – 1 –November 2004 17.80 5,212 – – 5,212 –March 2005 19.60 142,663 – – 142,663 –July 2005 20.10 1,225,606 – (20,379) 1,205,227 409December 2006 29.55 to 30.55 551,416 – – 551,416 –July 2007 29.55 to 33.00 1,348,223 – – 1,348,223 –
4,203,392 – (32,489) 4,170,903 536
Options to acquire Class B LP Units and Class D LP Units1
July 20052,3 20.10 5,489,801 (1,301,031) (13,587) 4,175,183 273December 2006 29.55 to 30.55 2,550,000 – – 2,550,000 –July 2007 29.55 to 33.00 1,600,000 – – 1,600,000 –June 2008 20.10 750,000 – (6,343) 743,657 128
10,389,801 (1,301,031) (19,930) 9,068,840 401
Total Earnout Options 14,593,193 (1,301,031) (52,419) 13,239,743 937
1 Each option is represented by a corresponding Class C LP Unit or Class E LP Unit.2 Includes 56,859 of vested options at December 31, 2009.3 Earnout Options of 1,301,031 expired during the year.
Options Options Options Options Outstanding at Exchanged or Exercised Outstanding at Proceeds January 1, Expired During During December 31, During Strike Price 2008 2008 2008 2008 2008 $ # # # # $
Options to acquire Trust Units October 2003 10.00 12,688 – – 12,688 –October 2003 10.50 846,103 – (370,527) 475,576 3,891February 2004 14.00 530,010 – (88,003) 442,007 1,232May 2004 15.25 1 – – 1 –November 2004 17.80 31,657 – (26,445) 5,212 471March 2005 19.60 142,663 – – 142,663 –July 2005 20.10 1,442,442 – (216,836) 1,225,606 4,358December 2006 29.55 to 30.55 551,416 – – 551,416 –July 2007 29.55 to 33.00 1,348,223 – – 1,348,223 –
4,905,203 – (701,811) 4,203,392 9,952
Options to acquire Class B LP Units and Class D LP Units1
July 20052,3,4 20.10 7,504,155 (844,977) (1,169,377) 5,489,801 23,506December 2006 29.55 to 30.55 2,550,000 – – 2,550,000 –July 2007 29.55 to 33.00 1,600,000 – – 1,600,000 –June 20083 20.10 – 750,000 – 750,000 –
11,654,155 (94,977) (1,169,377) 10,389,801 23,506
Total Earnout Options 16,559,358 (94,977) (1,871,188) 14,593,193 33,458
1 Each option is represented by a corresponding Class C LP Unit or Class E LP Unit.2 Includes 1,117,032 of vested options as at December 31, 2008. On September 30, 2008, the Trust entered into an agreement with SmartCentres whereby all the July 2005
Earnout Options to acquire Class B LP Units that have vested as at December 31, 2008, must be exercised by June 30, 2009, with an extension to September 30, 2009, under certain circumstances. The remaining July 2005 Earnout Options to acquire Class B LP Units that have not vested as at December 31, 2008, must be exercised within 60 days of completion and rental of additional space on specific properties.
3 Includes 750,000 Earnout Options exchanged in connection with the June 13, 2008, acquisitions as described in note 3.4 Earnout Options of 94,977 expired during the year.

CALLOWAY REIT 2009 Annual Report 75
c) Deferred unit plan During 2005, the Trust implemented a deferred unit plan (amended May 16, 2006). During 2007, the plan was amended for
administrative purposes to provide that Trustees, officers and employees be granted such deferred units at the beginning of the following fiscal year as opposed to on a quarterly basis. The plan entitles Trustees and officers, at the participant’s option, to receive deferred units in consideration for Trustee fees or executive bonuses with the Trust matching the number of units received. The deferred units in respect of Trustee fees or executive bonuses effectively vest immediately, and the matching deferred units vest 50% on the third anniversary and 25% on each of the fourth and fifth anniversaries, subject to provisions for earlier vesting in certain events. The deferred units earn additional deferred units for the distributions that would otherwise have been paid on the deferred units (i.e., had they instead been issued as Trust Units on the date of grant). Once vested, participants are entitled to receive an equivalent number of Trust Units for the vested deferred units and the corresponding additional deferred units.
During the year ended December 31, 2009, Trustees, officers and employees elected to receive 148,746 (2008 – 86,834) deferred units in consideration for Trustee fees and bonuses amounting to $1,236 (2008 – $1,016).
During the year ended December 31, 2009, the Trust recorded compensation expense, in respect of the matching deferred units granted by the Trust, of $641 (2008 – $683).
The status of the outstanding deferred units for the years ended December 31, 2009, and December 31, 2008, is as follows:
Outstanding Vested Non-Vested
Balance – January 1, 2008 192,268 134,652 57,616Granted during the year 86,834 43,417 43,417Reinvested distributions 26,199 17,136 9,063Vested during the year – 16,212 (16,212)
Balance – December 31, 2008 305,301 211,417 93,884Granted during the year 148,746 74,373 74,373Reinvested distributions 53,315 33,611 19,704Vested during the year – 16,977 (16,977)Forfeited units during the year (8,988) – (8,988)Exchanged for Trust Units (39,496) (39,496) –
Balance – December 31, 2009 458,878 296,882 161,996
d) Distribution reinvestment plan The Trust enables holders of Trust Units to reinvest their cash distributions in additional units of the Trust at 97% of the
weighted average unit price over the ten trading days prior to the distribution. The 3% bonus amount is recorded as an additional distribution and reinvestment.
e) Convertible debentures During the year ended December 31, 2009, $13 (2008 – $591) of face value of the Convertible Debentures was converted into
764 (2008 – 34,761) Trust Units. The face value of the Convertible Debentures, net of a discount of $nil (2008 – $nil), plus a proportionate share of the equity component in the amount of $nil (2008 – $23), net of applicable unamortized deferred financing costs of $nil (2008 – $17), was added to Trust Unit capital.
f ) Units issued for cash During the year ended December 31, 2009, the Trust issued Trust Units for cash as follows:
Issued units Issue price Proceeds
August 25, 2009 3,226,000 15.50 50,003
Issue costs (2,148)
47,855

76 CALLOWAY REIT 2009 Annual Report
Notes to Consolidated Financial Statements
g ) Unit distributions The Unitholders approved an amendment to the Declaration of Trust at the annual meeting of the Unitholders on May 7, 2009,
to remove the requirement to distribute its taxable income. Pursuant to the Declaration of Trust effective September 14, 2009, the Trust endeavours to distribute annually such amount as is necessary to ensure that the Trust will not be subject to tax on its net income under Part I of the Income Tax Act (Canada). Unit distributions declared during the years ended December 31, 2009, and December 31, 2008 are as follows:
2009 2008
Trust Units 125,740 121,334Class B Series 1 LP Units 21,334 21,043Class B Series 2 LP Units 1,222 1,222Class B Series 3 LP Units 1,096 639Class D Series 1 LP Units 512 499Class D Series 2 LP Units – 40Class B LP II Units 1,171 1,171
151,075 145,948
12. Rentals from income propertiesRentals from income properties consist of the following:
2009 2008
Base rent 309,708 288,541Property operating costs recovered 137,288 126,934
446,996 415,475
13. Amortization expenseAmortization expense consists of the following:
2009 2008
Income properties Tangible assets 84,608 73,835 Intangible assets 50,644 49,051Deferred leasing costs 576 448
135,828 123,334
14. Future income taxesThe Trust is taxed as a mutual fund trust for Canadian income tax purposes. In accordance with the Declaration of Trust, distributions to Unitholders are declared at the discretion of the Trustees. The Trust endeavours to declare distributions in each taxation year in such an amount as is necessary to ensure that the Trust will not be subject to tax on its net income and net capital gains under Part I of the Income Tax Act (Canada) (the “Tax Act”).
Pursuant to the recent amendments to the Tax Act, the taxation regime applicable to specified investment flow-through trusts or partnerships (“SIFTs”) and investors in SIFTs has been altered. If Calloway were to become subject to these new rules (the “SIFT Rules”), it generally would be taxed in a manner similar to corporations on income from business carried on in Canada by Calloway and on income (other than taxable dividends) or capital gains from non-portfolio properties (as defined in the Tax Act), at a combined federal/provincial tax rate similar to that of a corporation. In general, distributions paid as returns of capital will not be subject to this tax. The SIFT Rules are applicable beginning with the 2007 taxation year of a trust unless the trust would have been a “SIFT Trust” (as defined in the Tax Act) on October 31, 2006, if the definition had been in force and applied to the trust on that date (the “Existing Trust Exemption”). For trusts that meet the Existing Trust Exemption, including Calloway, the SIFT Rules will apply commencing in the 2011 taxation year, assuming compliance with the “normal growth” guidelines issued by the Department of Finance (Canada) on December 15, 2006, as amended from time to time (the “Normal Growth Guidelines”). The SIFT Rules are not applicable to a real estate investment trust that meets certain specified criteria relating to the nature of its revenue and investments (the “REIT Exemption”). Calloway intends to qualify for the REIT Exemption prior to 2011.

CALLOWAY REIT 2009 Annual Report 77
As the Trust does not meet the REIT Exemption as at December 31, 2009, a future income tax asset in the amount of $6,288 has been recorded as at December 31, 2009, based on the temporary differences that are expected to reverse on or after January 1, 2011, reduced by a valuation allowance of $6,288 to a net balance of $nil, as the tax asset is not more likely than not to be realized given that Calloway intends to meet the REIT Exemption by January 1, 2011. The measurement of the future income tax asset as at the consolidated balance sheet date required management to make estimates and assumptions, including estimates and assumptions regarding the timing of when temporary differences are expected to reverse and regarding future allocations of taxable income between the various partners of the limited partnerships under the control of the Trust. Actual results could differ from those estimates.
As the Trust has not exceeded the Normal Growth Guidelines and the Trust is not currently taxable, no current income taxes have been recorded as at December 31, 2009, and for the year then ended.
The following reconciles the Trust’s tax provision calculated using the Canadian statutory tax rate to the provision for income taxes:
2009 2008
Income tax provision based on Canadian statutory tax rate of 32.46% (December 31, 2008 – 35.12%) 7,559 31,484Decrease in provision resulting from: Distributions deducted for current income tax purposes (7,559) (31,484)
Total income tax provision – –
15. Income per unitThe following table sets forth the weighted average number of units outstanding for income per unit purposes:
2009 2008
Trust Units 80,450,690 77,826,295Class B LP Units 15,277,960 14,753,780Class D LP Units 330,588 349,997Class B LP II Units 756,525 756,525Vested deferred units 276,098 181,102
Basic and diluted 97,091,861 93,867,699
The impact of the potential exercise of 13,182,884 (2008 – 13,476,161) unvested Earnout Options has not been included in the calculation of the weighted average diluted number of units outstanding because the conditions necessary for their issuance were not satisfied as at December 31, 2009, or December 31, 2008. The impact of the unvested deferred units, vested Earnout Options and the potential conversion of the Convertible Debentures into Trust Units as at December 31, 2009, and December 31, 2008, have not been included in the calculation of the diluted number of units outstanding, as they have been determined to be anti-dilutive.
16. Supplemental cash flow informationThe following summarizes supplemental cash flow information and non-cash transactions:
2009 2008
Interest paid 149,745 138,096Interest received 1,886 3,331Mortgages and other debt assumed on acquisitions 17,917 14,079Trust and Class B LP Units issued as consideration for acquisitions 937 29,718Earnout Options issued as consideration for acquisitions – 1,684Liabilities assumed on acquisitions, net of other assets 50,180 86,683Units issued under the Distribution Reinvestment Plan 12,837 19,190Units issued on conversion of debentures 13 551Mortgages assumed by purchasers on sale of income properties – 45,586Distributions payable at year-end 12,818 12,265Liabilities at year-end relating to additions to income properties and properties under development 20,228 24,925

78 CALLOWAY REIT 2009 Annual Report
Notes to Consolidated Financial Statements
17. Related party transactionsTransactions with related parties that are conducted in the normal course of operations have been recorded at the exchange amount. Monetary transactions, and non-monetary transactions that have commercial substance, with related parties that are not in the normal course of operations, but that result in a substantive change in the ownership interests of the item transferred and are supported by independent evidence, are recorded at the exchange amount.
As at December 31, 2009, SmartCentres, owned by Mitchell Goldhar, owned 11,291,118 Trust Units, 11,501,860 Class B Series 1 LP Units, 206,935 Class B Series 2 LP Units, and 713,516 Class B Series 3 LP Units, which represent in total approximately 23.9% of the issued and outstanding units. A July 2005 agreement preserves SmartCentres’ voting rights at a minimum of 25.0% for a period of five years commencing July 1, 2005, on the condition that SmartCentres’ owner, Mitchell Goldhar, remains a Trustee of the Trust and owns at least 15,000,000 Trust Units and Class B LP Units, collectively. This entitlement will extend for a further five-year term so long as SmartCentres sells in aggregate at least $800,000 of freehold assets to the Trust during the initial five-year period, and SmartCentres owns no less than the lesser of 20.0% of the outstanding units or 20,000,000 units and SmartCentres’ owner remains a Trustee of the Trust. SmartCentres has Earnout Options to acquire approximately 3,983,264 Trust Units and approximately 8,080,006 Class B Series 1, Class B Series 2 and Class B Series 3 LP Units. As at December 31, 2009, the ownership would increase to 31.8% if SmartCentres were to exercise all remaining Earnout Options. Pursuant to its rights under the Declaration of Trust, as at December 31, 2009, SmartCentres has appointed three Trustees out of nine.
The non-controlling interests, which are included in accounts payable and accrued liabilities, represent a 5.0% equity interest by SmartCentres in four consolidated income properties.
In addition to agreements and contracts with SmartCentres described elsewhere in these consolidated financial statements, the Trust has entered into the following agreements with SmartCentres:
1. The Management Agreement, under which the Trust has agreed to provide to SmartCentres certain limited property management services for a fee equal to 1% of net rental revenues of the managed properties, for a one-year term ending December 31, 2010. The Management Agreement automatically renews for subsequent one-year terms unless terminated by either SmartCentres or the Trust.
2. The Support Services Agreement, under which SmartCentres has agreed to provide to the Trust certain support services for a fee based on an allocation of the relevant costs of the support services incurred by SmartCentres for a one-year term ending December 31, 2010. The Support Services Agreement automatically renews for subsequent one-year terms unless terminated by either SmartCentres or the Trust. In addition, the Trust rents its office premises from SmartCentres for a term of five years to December 2011, with an option to extend for a further five years.
3. The Construction and Leasing Services Agreement, under which SmartCentres has agreed to provide to the Trust construction management services and leasing services. The construction management services are provided, at the discretion of the Trust, with respect to certain of the Trust’s properties under development for a fee equal to 3% of the construction costs incurred. Fees for leasing services, requested at the discretion of the Trust, are based on various rates, which approximate market rates, depending on the term and nature of the lease. The agreement continues in force until terminated by either SmartCentres or the Trust.
4. The Trademark Licence Agreement and Marketing Cost Sharing Agreement (collectively, the Licence Agreement), under which the Trust has licensed the use of the trademark “Smart!Centres” from SmartCentres for a ten-year term ending December 31, 2016. Under the Licence Agreement, the Trust will pay 50% of the costs incurred by SmartCentres in connection with branding and marketing the trademark together with the Trust’s proportionate share of signage costs. SmartCentres has the right to terminate the Licence Agreement at any time in the event any third party acquires 20.0% of the aggregate of the Trust Units and special voting units.

CALLOWAY REIT 2009 Annual Report 79
In addition to related party transactions and balances disclosed elsewhere in these consolidated financial statements, the following summarizes other related party transactions and balances with SmartCentres and other related parties:
2009 2008
Related party transactions and balances with SmartCentres Development fees and costs paid (capitalized to real estate assets) 3,358 3,228 Interest expense (capitalized to properties under development) 526 1,000 Interest income from mortgages and loans receivable 10,706 16,393 Opportunity fees, head lease rents and operating cost recoveries receivable: Included in rentals from income properties 1,344 1,597 Capitalized to properties under development 4,619 4,916 Management fee revenue pursuant to the Management Agreement (included in rentals from income properties) 1,326 886 Rent and operating costs payable (included in general and administration expenses, and property operating costs) 1,078 975 Legal and other administration services payable (included in general and administration expenses, and property operating costs) 891 1,721 Marketing cost sharing (included in property operating costs) 153 337 Amounts receivable at year-end 5,157 6,058 Accounts payable and accrued liabilities at year-end 8,854 10,505 Accrued development obligation at year-end 35,836 33,220
Other related party transactions and balances Legal fees paid to a legal firm in which a partner is a trustee: Included in general and administration expenses 295 38 Included in equity issuance costs 44 57 Included in deferred financing costs 533 350 Included in income properties and properties under development – 532 Included in gain on sale of income properties 174 279 Interest income from mortgages receivable 235 895 Opportunity fees received (capitalized to properties under development) 307 529 Amounts receivable at year-end 387 899 Accounts payable and accrued liabilities at year-end 13 – Acquisition holdback due to Hopewell at year-end 46 1,500
18. Co-ownership interestsThe following amounts, included in these consolidated financial statements, represent the Trust’s proportionate share in the financial position of 15 co-ownership interests as at December 31, 2009 (13 co-ownership interests as at December 31, 2008) and the results of operations and cash flows for the years ended December 31, 2009, and December 31, 2008:
2009 2008
Assets 457,025 396,503Liabilities 264,051 234,409
Revenues 43,298 39,806Expenses 41,373 37,688
Net income 1,925 2,118
Cash flow provided by operating activities 19,655 15,108Cash flow provided by financing activities 55,379 36,894Cash flow used in investing activities (76,641) (50,211)
Management believes the assets of the co-ownerships are sufficient for the purpose of satisfying the associated obligations of the co-ownerships. SmartCentres is the co-owner in four of the properties. The Trust’s interests in these co-ownerships range from 44.44% to 50.0%.
19. Segmented informationThe Trust owns, develops, manages and operates income properties located in Canada. In measuring performance, the Trust does not distinguish or group its operations on a geographical or any other basis and, accordingly, has a single reportable segment for disclosure purposes.
The Trust’s major tenant is Wal-Mart Canada Corp., accounting for 26.4% of the Trust’s annualized rental revenue as at December 31, 2009 (December 31, 2008 – 26.9%).

80 CALLOWAY REIT 2009 Annual Report
Notes to Consolidated Financial Statements
20. Assets held-for-sale, assets sold and discontinued operationsNine income properties (795,693 square feet) were sold during 2008 for gross proceeds of $162,518 resulting in a gain of $48,147. The purchasers assumed $45,586 of existing mortgages on the sale of six of the income properties.
The following tables set forth the balance sheets associated with the income properties classified as held-for-sale as at December 31, 2009 (nil income properties) and December 31, 2008 (three income properties) and the statements of income for properties sold for the years ended December 31, 2009 (nil income properties) and December 31, 2008 (nine income properties). During the year, the three properties that were designated as held-for-sale at December 31, 2008, no longer met the accounting criteria for held-for-sale classification and, accordingly, were reclassified to properties held and in use. As a result of classifying these properties to properties held and in use, amortization of $192 was recorded in the current year for amortization expense that would have been recognized in previous years had the properties been continuously classified as held and in use.
Balance Sheet 2009 2008
Assets Income properties – 9,096 Mortgages and loans receivable – 3,540 Deferred leasing costs – 54 Amounts receivable, prepaid expenses and deposits – 353
– 13,043
Liabilities Accounts payable and accrued liabilities – 1,443
Net investment in properties held for sale – 11,600
Statements of income 2009 2008
Rentals from income properties (37) 7,892 Interest – 65
(37) 7,957
Expenses Property operating costs 35 2,001 Interest 32 1,597 Amortization – 481
67 4,079
Income (loss) before gain on sale of income properties (104) 3,878Gain (loss) on sale of income properties (194) 48,147
Income (loss) from discontinued operations (298) 52,025
21. Risk management a) Financial risks The Trust’s activities expose it to a variety of financial risks including interest rate risk, credit risk and liquidity risk. The
Trust’s overall financial risk management focuses on the unpredictability of financial markets and seeks to minimize potential adverse effects on the Trust’s financial performance. The Trust may use derivative financial instruments to hedge certain risk exposures.
i) Interest rate risk The majority of the Trust’s debt is financed at fixed rates with maturities staggered over a number of years, thereby
mitigating its exposure to changes in interest rates and financing risks. At December 31, 2009, approximately 7.76% (2008 – 11.23%) of the Trust’s debt is financed at variable rates exposing the Trust to changes in interest rates on such debt.
The Trust analyzes its interest rate exposure on a regular basis. The Trust monitors the historical movement of ten-year Government of Canada Bonds for the past two years and performs a sensitivity analysis to show the possible impact on net income of an interest rate shift. The simulation is performed on a quarterly basis to ensure that the maximum loss potential is within the limit acceptable to management. Management runs the simulation only for interest-bearing development loans, revolving acquisition facility, revolving operating facility and non-revolving interim credit facility.

CALLOWAY REIT 2009 Annual Report 81
The Trust’s policy is to capitalize interest expense incurred relating to properties under development (December 31, 2009 – 9.01% of total interest costs). The sensitivity analysis below shows the maximum impact (net of estimated interest capitalized to properties under development) on net income of possible changes in interest rates on variable rate debt.
Interest Shift of
–0.50% –0.25% 0% +0.25% +0.50% $ $ $ $ $
Net income increase (decrease) 1,110 555 – (555) (1,110)
ii) Credit risk Credit risk arises from cash and cash equivalents as well as credit exposures with respect to tenant receivables and
mortgages and loans receivable (see notes 6 and 9(a)). Tenants may experience financial difficulty and become unable to fulfill their lease commitments. The Trust mitigates this risk of credit loss by reviewing tenants’ covenants, by ensuring its tenant mix is diversified and by limiting its exposure to any one tenant except Wal-Mart Canada Corp. Further risks arise in the event that borrowers of mortgages and loans receivable default on the repayment of amounts owing to the Trust. The Trust endeavours to ensure adequate security has been provided in support of mortgages and loans receivable. The Trust limits cash transactions to high credit quality financial institutions to minimize its credit risk from cash and cash equivalents.
iii) Liquidity risk Liquidity risk management implies maintaining sufficient cash and the availability of funding through an adequate
amount of committed credit facilities and the ability to lease out vacant units. Due to the dynamic nature of the underlying business, the Trust aims to maintain flexibility and opportunities in funding by keeping committed credit lines available, obtaining additional mortgages as the value of income-producing properties increases and issuing Convertible Debentures. In spite of the challenging capital market conditions, during the year ended December 31, 2009 and early 2010, the Trust has been able to renew and increase its operating facilities, raise additional term mortgage financing and issue unsecured debentures, Convertible Debentures and equity.
During 2010, term mortgages of $24,039 and unsecured debentures of $46,452 will mature. The key assumptions used in the Trust’s estimates of future cash flows when assessing liquidity risk are capital markets remaining liquid and no major bankruptcies of large tenants. In addition, subsequent to year-end, the Trust issued $60,000 of convertible unsecured subordinated debentures and 2,100,000 Trust Units at a price of $19.05 per unit to raise, in aggregate, gross proceeds of approximately $100,005 (see note 23). Management believes it has considered all reasonable facts and circumstances as of today in forming appropriate assumptions. However, as always, there is a risk significant changes in market conditions could alter the assumptions used.
The Trust’s liquidity position is monitored on a regular basis by management. A schedule of principal repayments on term mortgages and other debt maturities is disclosed in note 10.
b) Capital risk management The Trust’s primary objectives when managing capital are: • to safeguard the Trust’s ability to continue as a going concern, so that it can continue to provide returns for Unitholders; and • to ensure that the Trust has access to sufficient funds for acquisition (including Earnout) or development activities.
The Trust sets the amount of capital in proportion to risk. The Trust manages its capital structure and makes adjustments to it in light of changes in economic conditions and the risk characteristics of the underlying assets. In order to maintain or adjust the capital structure, the Trust may adjust the amount of distributions paid to Unitholders, issue new units and debt or sell assets to reduce debt or fund acquisition or development activities.
The Trust anticipates meeting all current and future obligations. Management expects to finance future acquisitions, mezzanine loans, development and maturing debt from: (i) existing cash balances; (ii) a mix of mortgage debt secured by income properties, operating facilities, issuance of equity and convertible/unsecured debentures; and (iii) the sale of non-core assets. Cash flow generated from operating activities is the source of liquidity to service debt (except maturing debt), sustaining capital expenditures, leasing costs and unit distributions.

82 CALLOWAY REIT 2009 Annual Report
Notes to Consolidated Financial Statements
The Trust monitors capital structure based on the following ratios: interest coverage ratio, debt service coverage ratio, payout ratio, debt to gross book value ratio, and variable debt over gross book value ratio. These ratios are used by the Trust to manage an acceptable level of leverage and are calculated in accordance with the terms of specific agreements with creditors and the Declaration of Trust and are not considered measures in accordance with GAAP; nor is there an equivalent GAAP measure. The Trust has defined capital as the aggregate amount of Unitholders’ equity and debt.
The Trust’s strategy is to maintain its interest coverage ratio at or above approximately two times, debt to gross book value ratio excluding Convertible Debentures between 55% to 60%, debt to gross book value ratio including Convertible Debentures between 60% to 65% and variable debt over gross book value ratio below 20%.
The Trust is required by its lenders to maintain its interest coverage ratio above 1.70 times, debt service coverage ratio above 1.35 times, debt to gross book value ratio, excluding convertible debentures, is not to exceed 60%, and the debt to gross book value ratio, including convertible debentures, is not to exceed 65%.
Interest coverage ratio is defined as earnings before interest, income taxes and amortization over interest expense. Debt service ratio is defined as earnings before interest, income taxes and amortization over interest expense and principal payments. Payout ratio is defined as unit distributions declared to Unitholders during the period over funds from operations. Debt to gross book value ratio is defined as mortgages and other debt payable over total consolidated assets of the Trust plus the amount of accumulated amortization relating to income properties. Variable debt over gross book value ratio is defined as debt with floating interest rates and debt having maturity of less than one year over total consolidated assets of the Trust plus the amount of accumulated amortization related to income properties.
Those ratios were as follows: December 31, December 31, Increase 2009 2008 (Decrease)
Interest coverage ratio 2.0X 2.1X (0.1)Debt service coverage ratio 1.5X 1.7X (0.2)Payout ratio (FFO) 92.8% 85.7% 7.1%Debt to gross book value ratio (excluding Convertible Debentures) 55.3% 54.3% 1.0%Debt to gross book value ratio (including Convertible Debentures) 57.9% 57.0% 0.9%Variable debt over gross book value ratio 4.5% 6.4% (1.9%)
The increase (decrease) in interest coverage ratio, debt service coverage ratio and debt to gross book value ratio and variable debt over gross book value ratio during 2009 resulted primarily from the increase in debt that occurred during the year and the associated increase in interest over the prior year.
In addition, the Trust is also required (reported quarterly) to maintain a minimum equity requirement by certain of its lenders of $1,500,000. This minimum equity amount is calculated based on initial equity plus an amount in respect of accumulated amortization. If the Trust does not meet all externally imposed ratios and the minimum equity requirements, then the related debt will become immediately due and payable unless the Trust is able to remedy the default or obtain a waiver from lenders. In 2009, the Trust met all the externally imposed ratios and the minimum equity requirements.
c) Environmental risk As an owner of real property, the Trust is subject to various federal, provincial and municipal laws relating to environmental
matters. Such laws provide a range of potential liability, including potentially significant penalties, and potential liability for the costs of removal or remediation of certain hazardous substances. The presence of such substances, if any, could adversely affect the Trust’s ability to sell or redevelop such real estate or to borrow using such real estate as collateral and, potentially, could also result in civil claims against the Trust. As required by the Declaration of Trust, and in accordance with best management practices, Phase 1 audits are completed on all properties prior to acquisition. Further investigation is conducted if Phase 1 tests indicate a potential problem. The Trust has operating policies to monitor and manage risk. In addition, the standard lease requires compliance with environmental laws and regulations, and restricts tenants from carrying on environmentally hazardous activities or having environmentally hazardous substances on site. The Trust has obtained environmental insurance on certain assets to further manage risk.
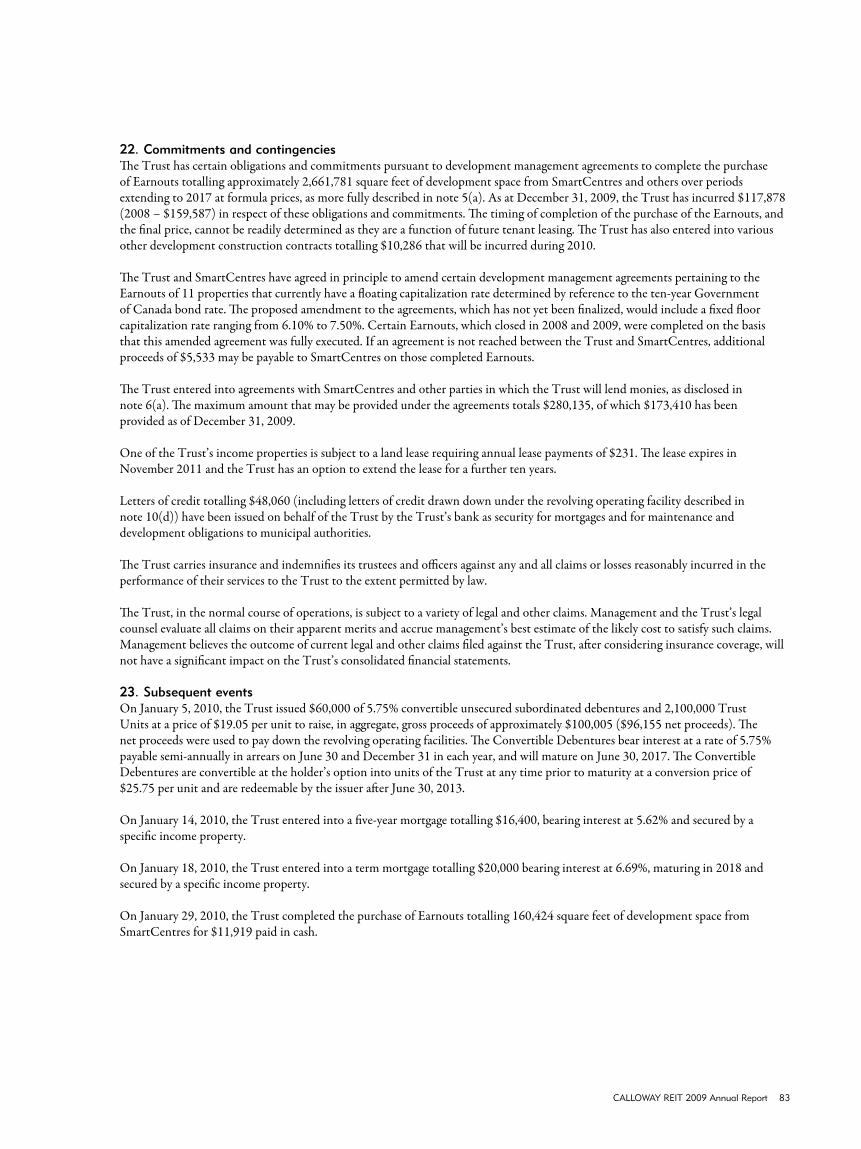
CALLOWAY REIT 2009 Annual Report 83
22. Commitments and contingenciesThe Trust has certain obligations and commitments pursuant to development management agreements to complete the purchase of Earnouts totalling approximately 2,661,781 square feet of development space from SmartCentres and others over periods extending to 2017 at formula prices, as more fully described in note 5(a). As at December 31, 2009, the Trust has incurred $117,878 (2008 – $159,587) in respect of these obligations and commitments. The timing of completion of the purchase of the Earnouts, and the final price, cannot be readily determined as they are a function of future tenant leasing. The Trust has also entered into various other development construction contracts totalling $10,286 that will be incurred during 2010.
The Trust and SmartCentres have agreed in principle to amend certain development management agreements pertaining to the Earnouts of 11 properties that currently have a floating capitalization rate determined by reference to the ten-year Government of Canada bond rate. The proposed amendment to the agreements, which has not yet been finalized, would include a fixed floor capitalization rate ranging from 6.10% to 7.50%. Certain Earnouts, which closed in 2008 and 2009, were completed on the basis that this amended agreement was fully executed. If an agreement is not reached between the Trust and SmartCentres, additional proceeds of $5,533 may be payable to SmartCentres on those completed Earnouts.
The Trust entered into agreements with SmartCentres and other parties in which the Trust will lend monies, as disclosed in note 6(a). The maximum amount that may be provided under the agreements totals $280,135, of which $173,410 has been provided as of December 31, 2009.
One of the Trust’s income properties is subject to a land lease requiring annual lease payments of $231. The lease expires in November 2011 and the Trust has an option to extend the lease for a further ten years.
Letters of credit totalling $48,060 (including letters of credit drawn down under the revolving operating facility described in note 10(d)) have been issued on behalf of the Trust by the Trust’s bank as security for mortgages and for maintenance and development obligations to municipal authorities.
The Trust carries insurance and indemnifies its trustees and officers against any and all claims or losses reasonably incurred in the performance of their services to the Trust to the extent permitted by law.
The Trust, in the normal course of operations, is subject to a variety of legal and other claims. Management and the Trust’s legal counsel evaluate all claims on their apparent merits and accrue management’s best estimate of the likely cost to satisfy such claims. Management believes the outcome of current legal and other claims filed against the Trust, after considering insurance coverage, will not have a significant impact on the Trust’s consolidated financial statements.
23. Subsequent eventsOn January 5, 2010, the Trust issued $60,000 of 5.75% convertible unsecured subordinated debentures and 2,100,000 Trust Units at a price of $19.05 per unit to raise, in aggregate, gross proceeds of approximately $100,005 ($96,155 net proceeds). The net proceeds were used to pay down the revolving operating facilities. The Convertible Debentures bear interest at a rate of 5.75% payable semi-annually in arrears on June 30 and December 31 in each year, and will mature on June 30, 2017. The Convertible Debentures are convertible at the holder’s option into units of the Trust at any time prior to maturity at a conversion price of $25.75 per unit and are redeemable by the issuer after June 30, 2013.
On January 14, 2010, the Trust entered into a five-year mortgage totalling $16,400, bearing interest at 5.62% and secured by a specific income property.
On January 18, 2010, the Trust entered into a term mortgage totalling $20,000 bearing interest at 6.69%, maturing in 2018 and secured by a specific income property.
On January 29, 2010, the Trust completed the purchase of Earnouts totalling 160,424 square feet of development space from SmartCentres for $11,919 paid in cash.

84 CALLOWAY REIT 2009 Annual Report
TRUSTEESSimon NyilassyPresident, Chief Executive OfficerCalloway Real Estate Investment Trust
David M. Calnan 3
Partner, Shea Nerland Calnan
Mitchell Goldhar 3
President, Chief Executive OfficerSmartCentres Group of Companies
Peter Forde 3
Chief Operating OfficerSmartCentres Group of Companies
Al Mawani 1
Managing PartnerExponent Capital Partners Inc.
Jamie M. McVicar 1, 2
Chief Financial OfficerDevonian Properties Ltd.
Kevin Pshebniski 2, 3
PresidentHopewell Development Corporation
J. Michael Storey 1, 3
PresidentExeter Financial Corporation
Michael Young 2
PrincipalQuadrant Capital Partners Inc.
1 Audit Committee2 Compensation and Corporate Governance Committee3 Investment Committee
SENIOR MANAGEMENTSimon NyilassyPresident, Chief Executive Officer
Bart MunnChief Financial Officer
Rudy GobinExecutive Vice President, Asset Management
BANKERSTD Bank Financial GroupBMO Capital MarketsRBC Capital MarketsCIBC World MarketsScotia Capital
AUDITORSPricewaterhouseCoopers LLPToronto, Ontario
LEGAL COUNSELShea Nerland CalnanCalgary, Alberta
REGISTRAR & TRANSFER AGENTComputershare Trust Company of CanadaToronto, Ontario
INVESTOR RELATIONSBart Munn, Chief Financial OfficerTel: 905.326.6400 Ext. 7631Fax: 905.326.6402TSX: CWT.UN
ANNUAL GENERAL MEETINGMay 6, 2010, at 10:30 a.m.St. Andrew’s Club & Conference CentreSt. Andrew’s Hall – 27th Floor150 King Street WestToronto, Ontario M5H 1J9
Des
ign:
Jum
p C
omm
unic
atio
ns In
c.
CORPORATE INFORMATION


700 Applewood Crescent, Suite 200, Vaughan, Ontario L4K 5X3
Tel: 905.326.6400 Fax: 905.326.0783
www.callowayreit.com


