Nuclear Instruments and Methods in Physics Research A 538 (2005) 778–789 Performance analysis of a digital positron lifetime spectrometer J. Nissila¨ 1 , K. Rytso¨la¨, R. Aavikko , A. Laakso, K. Saarinen, P. Hautoja¨rvi Laboratory of Physics, Helsinki University of Technology, P.O. Box 1100, FIN-02015 HUT, Espoo, Finland Received 14 October 2003; received in revised form 10 August 2004; accepted 10 August 2004 Available online 16 September 2004 Abstract A digital positron lifetime spectrometer has been set up and tested comprehensively. The system consists of a fast commercial digitizer connected to a computer, a simple coincidence circuit and software to extract the timing from the collected detector pulses. The digital system has the same time resolution as a conventional analog apparatus using the same detectors. The pulse processing part of the spectrometer is able to analyze and store in real-time several thousands of events per second, which is an order of magnitude more than the count rates in typical positron lifetime experiments. The data acquisition can handle small pulses, down to a few tens of millivolts, and its time-scale linearity and stability are very good. We discuss the advantages of timing with software, e.g. simple setup, use of different timing algorithms and possibility of an offline analysis of lifetime events. The idea is generally applicable to direct measurement of time intervals with picosecond accuracy. r 2004 Elsevier B.V. All rights reserved. PACS: 06.60.Jn; 07.35.Hd; 78.70.Bj; 07.85.Nc Keywords: Digital; Timing; Time spectroscopy; Positron annihilation; Fast digitizer 1. Introduction Digital data readout techniques applied to nuclear radiation detectors have recently become viable as a result of the development of fast analog- to-digital converters (ADC). An early conversion to digital form both simplifies the measurement setup and enables various corrections to the data with software. Digital data collection methods have already been used in both pulse-height (see, e.g. Ref. [1] and references therein) and time-interval spectroscopies [2–6]. In this work, we have set up and tested a digital positron lifetime spectrometer. Basically, the pulse processing part of the apparatus measures time intervals, from nanoseconds up to microseconds, with an accuracy of about 20 ps. Positron lifetime spectroscopy yields informa- tion, e.g. on open-volume type defects in solids. ARTICLE IN PRESS www.elsevier.com/locate/nima 0168-9002/$ - see front matter r 2004 Elsevier B.V. All rights reserved. doi:10.1016/j.nima.2004.08.102 Corresponding author. Tel.: +358-9-451-3143; fax: +358- 9-451-3116. E-mail address: [email protected].fi (R. Aavikko). 1 Present address: Centre for Metrology and Accreditation (MIKES), Electricity Group, Otakaari 7B, FIN-02150 Espoo, Finland.
Transcript
ARTICLE IN PRESS
0168-9002/$ - se
doi:10.1016/j.ni
Correspondi
9-451-3116.
E-mail addre1Present add
(MIKES), Elect
Finland.
Nuclear Instruments and Methods in Physics Research A 538 (2005) 778–789
www.elsevier.com/locate/nima
Performance analysis of a digital positron lifetime spectrometer
J. Nissila1, K. Rytsola, R. Aavikko, A. Laakso, K. Saarinen, P. Hautojarvi
Laboratory of Physics, Helsinki University of Technology, P.O. Box 1100, FIN-02015 HUT, Espoo, Finland
Received 14 October 2003; received in revised form 10 August 2004; accepted 10 August 2004
Available online 16 September 2004
Abstract
A digital positron lifetime spectrometer has been set up and tested comprehensively. The system consists of a fast
commercial digitizer connected to a computer, a simple coincidence circuit and software to extract the timing from the
collected detector pulses. The digital system has the same time resolution as a conventional analog apparatus using the
same detectors. The pulse processing part of the spectrometer is able to analyze and store in real-time several thousands
of events per second, which is an order of magnitude more than the count rates in typical positron lifetime experiments.
The data acquisition can handle small pulses, down to a few tens of millivolts, and its time-scale linearity and stability
are very good. We discuss the advantages of timing with software, e.g. simple setup, use of different timing algorithms
and possibility of an offline analysis of lifetime events. The idea is generally applicable to direct measurement of time
intervals with picosecond accuracy.
r 2004 Elsevier B.V. All rights reserved.
PACS: 06.60.Jn; 07.35.Hd; 78.70.Bj; 07.85.Nc
Keywords: Digital; Timing; Time spectroscopy; Positron annihilation; Fast digitizer
1. Introduction
Digital data readout techniques applied tonuclear radiation detectors have recently becomeviable as a result of the development of fast analog-to-digital converters (ADC). An early conversion to
e front matter r 2004 Elsevier B.V. All rights reserve
digital form both simplifies the measurement setupand enables various corrections to the data withsoftware. Digital data collection methods havealready been used in both pulse-height (see, e.g.Ref. [1] and references therein) and time-intervalspectroscopies [2–6]. In this work, we have set upand tested a digital positron lifetime spectrometer.Basically, the pulse processing part of the apparatusmeasures time intervals, from nanoseconds up tomicroseconds, with an accuracy of about 20ps.
Positron lifetime spectroscopy yields informa-tion, e.g. on open-volume type defects in solids.
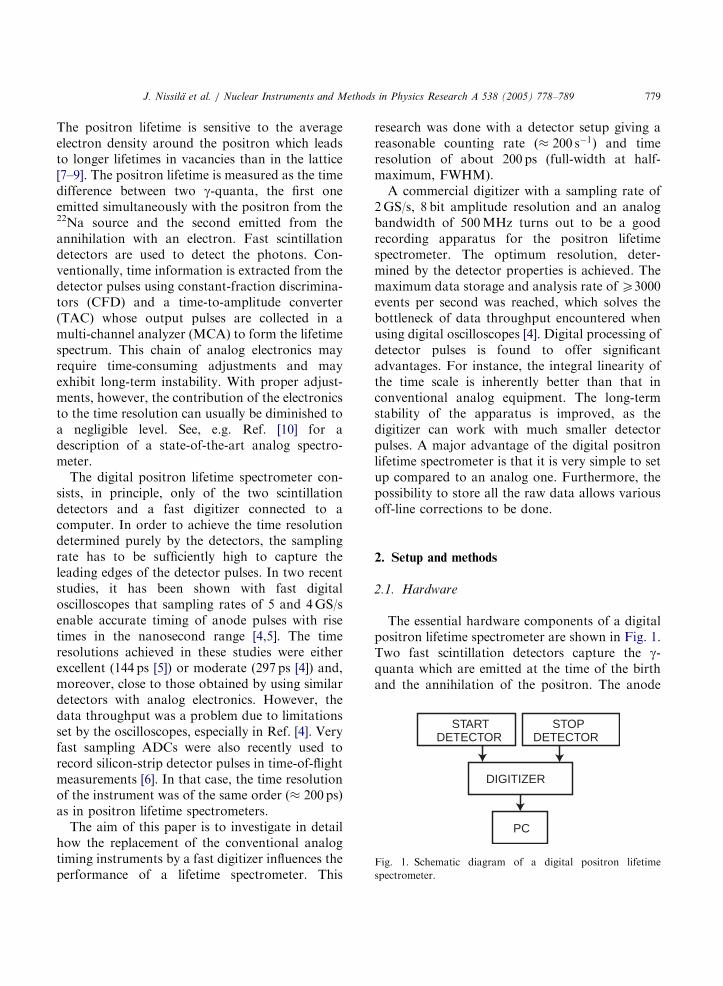
Fig. 1. Schematic diagram of a digital positron lifetime
spectrometer.
J. Nissila et al. / Nuclear Instruments and Methods in Physics Research A 538 (2005) 778–789 779
The positron lifetime is sensitive to the averageelectron density around the positron which leadsto longer lifetimes in vacancies than in the lattice[7–9]. The positron lifetime is measured as the timedifference between two g-quanta, the first oneemitted simultaneously with the positron from the22Na source and the second emitted from theannihilation with an electron. Fast scintillationdetectors are used to detect the photons. Con-ventionally, time information is extracted from thedetector pulses using constant-fraction discrimina-tors (CFD) and a time-to-amplitude converter(TAC) whose output pulses are collected in amulti-channel analyzer (MCA) to form the lifetimespectrum. This chain of analog electronics mayrequire time-consuming adjustments and mayexhibit long-term instability. With proper adjust-ments, however, the contribution of the electronicsto the time resolution can usually be diminished toa negligible level. See, e.g. Ref. [10] for adescription of a state-of-the-art analog spectro-meter.
The digital positron lifetime spectrometer con-sists, in principle, only of the two scintillationdetectors and a fast digitizer connected to acomputer. In order to achieve the time resolutiondetermined purely by the detectors, the samplingrate has to be sufficiently high to capture theleading edges of the detector pulses. In two recentstudies, it has been shown with fast digitaloscilloscopes that sampling rates of 5 and 4GS/senable accurate timing of anode pulses with risetimes in the nanosecond range [4,5]. The timeresolutions achieved in these studies were eitherexcellent (144 ps [5]) or moderate (297 ps [4]) and,moreover, close to those obtained by using similardetectors with analog electronics. However, thedata throughput was a problem due to limitationsset by the oscilloscopes, especially in Ref. [4]. Veryfast sampling ADCs were also recently used torecord silicon-strip detector pulses in time-of-flightmeasurements [6]. In that case, the time resolutionof the instrument was of the same order ( 200 ps)as in positron lifetime spectrometers.
The aim of this paper is to investigate in detailhow the replacement of the conventional analogtiming instruments by a fast digitizer influences theperformance of a lifetime spectrometer. This
research was done with a detector setup giving areasonable counting rate ( 200 s1) and timeresolution of about 200 ps (full-width at half-maximum, FWHM).
A commercial digitizer with a sampling rate of2GS/s, 8 bit amplitude resolution and an analogbandwidth of 500 MHz turns out to be a goodrecording apparatus for the positron lifetimespectrometer. The optimum resolution, deter-mined by the detector properties is achieved. Themaximum data storage and analysis rate of X3000events per second was reached, which solves thebottleneck of data throughput encountered whenusing digital oscilloscopes [4]. Digital processing ofdetector pulses is found to offer significantadvantages. For instance, the integral linearity ofthe time scale is inherently better than that inconventional analog equipment. The long-termstability of the apparatus is improved, as thedigitizer can work with much smaller detectorpulses. A major advantage of the digital positronlifetime spectrometer is that it is very simple to setup compared to an analog one. Furthermore, thepossibility to store all the raw data allows variousoff-line corrections to be done.
2. Setup and methods
2.1. Hardware
The essential hardware components of a digitalpositron lifetime spectrometer are shown in Fig. 1.Two fast scintillation detectors capture the g-quanta which are emitted at the time of the birthand the annihilation of the positron. The anode
ARTICLE IN PRESS
J. Nissila et al. / Nuclear Instruments and Methods in Physics Research A 538 (2005) 778–789780
pulses from the photomultiplier tubes (PMT) areled to a digitizer unit. The time information is thenanalyzed from the voltage sample sequences withsoftware.
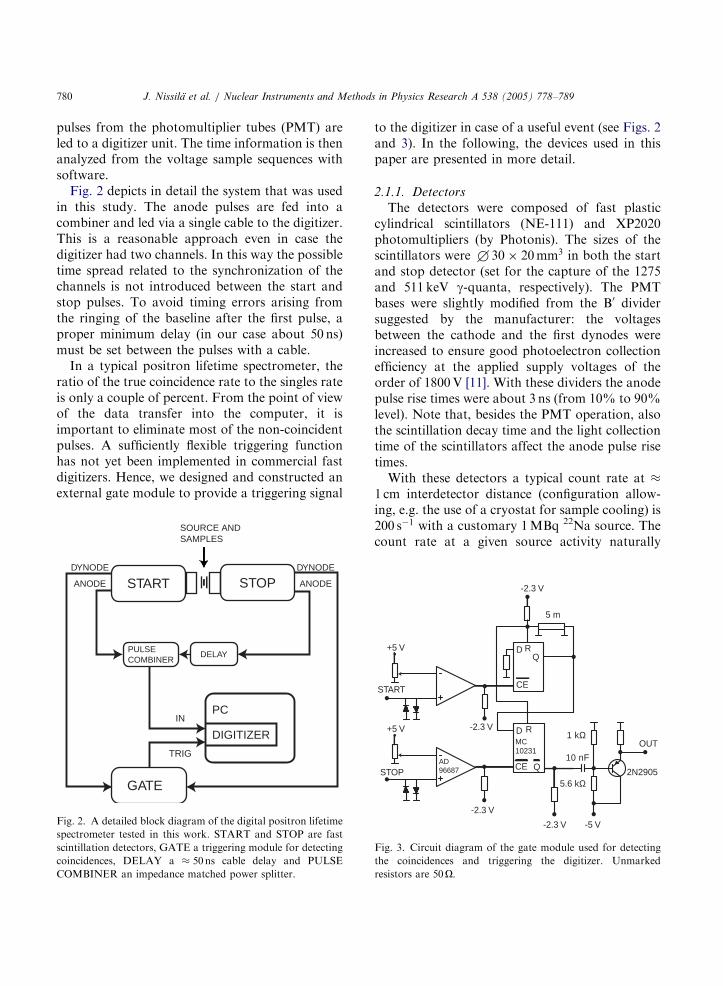
Fig. 2 depicts in detail the system that was usedin this study. The anode pulses are fed into acombiner and led via a single cable to the digitizer.This is a reasonable approach even in case thedigitizer had two channels. In this way the possibletime spread related to the synchronization of thechannels is not introduced between the start andstop pulses. To avoid timing errors arising fromthe ringing of the baseline after the first pulse, aproper minimum delay (in our case about 50 ns)must be set between the pulses with a cable.
In a typical positron lifetime spectrometer, theratio of the true coincidence rate to the singles rateis only a couple of percent. From the point of viewof the data transfer into the computer, it isimportant to eliminate most of the non-coincidentpulses. A sufficiently flexible triggering functionhas not yet been implemented in commercial fastdigitizers. Hence, we designed and constructed anexternal gate module to provide a triggering signal
START STOP
PULSECOMBINER
DELAY
ANODE
PC
DIGITIZER
SOURCE ANDSAMPLES
DYNODE DYNODE
ANODE
GATE
IN
TRIG
Fig. 2. A detailed block diagram of the digital positron lifetime
spectrometer tested in this work. START and STOP are fast
scintillation detectors, GATE a triggering module for detecting
coincidences, DELAY a 50ns cable delay and PULSE
COMBINER an impedance matched power splitter.
to the digitizer in case of a useful event (see Figs. 2and 3). In the following, the devices used in thispaper are presented in more detail.
2.1.1. Detectors
The detectors were composed of fast plasticcylindrical scintillators (NE-111) and XP2020photomultipliers (by Photonis). The sizes of thescintillators were +30 20mm3 in both the startand stop detector (set for the capture of the 1275and 511 keV g-quanta, respectively). The PMTbases were slightly modified from the B0 dividersuggested by the manufacturer: the voltagesbetween the cathode and the first dynodes wereincreased to ensure good photoelectron collectionefficiency at the applied supply voltages of theorder of 1800 V [11]. With these dividers the anodepulse rise times were about 3 ns (from 10% to 90%level). Note that, besides the PMT operation, alsothe scintillation decay time and the light collectiontime of the scintillators affect the anode pulse risetimes.
With these detectors a typical count rate at
1 cm interdetector distance (configuration allow-ing, e.g. the use of a cryostat for sample cooling) is200 s1 with a customary 1 MBq 22Na source. Thecount rate at a given source activity naturally
-5 V
OUT
-2.3 V
-2.3 V
D R
CE
Q
START
STOP
5 m
D R
Q
-2.3 V
+5 V
+5 V
CE
-2.3 V
2N2905
MC10231
AD96687
5.6 kΩ
1 kΩ
10 nF
Fig. 3. Circuit diagram of the gate module used for detecting
the coincidences and triggering the digitizer. Unmarked
resistors are 50O:
ARTICLE IN PRESS
-0.9
-0.6
-0.3
0.0
AM
PLI
TU
DE
(V
)
100500
TIME (ns)
DELAY + LIFETIME
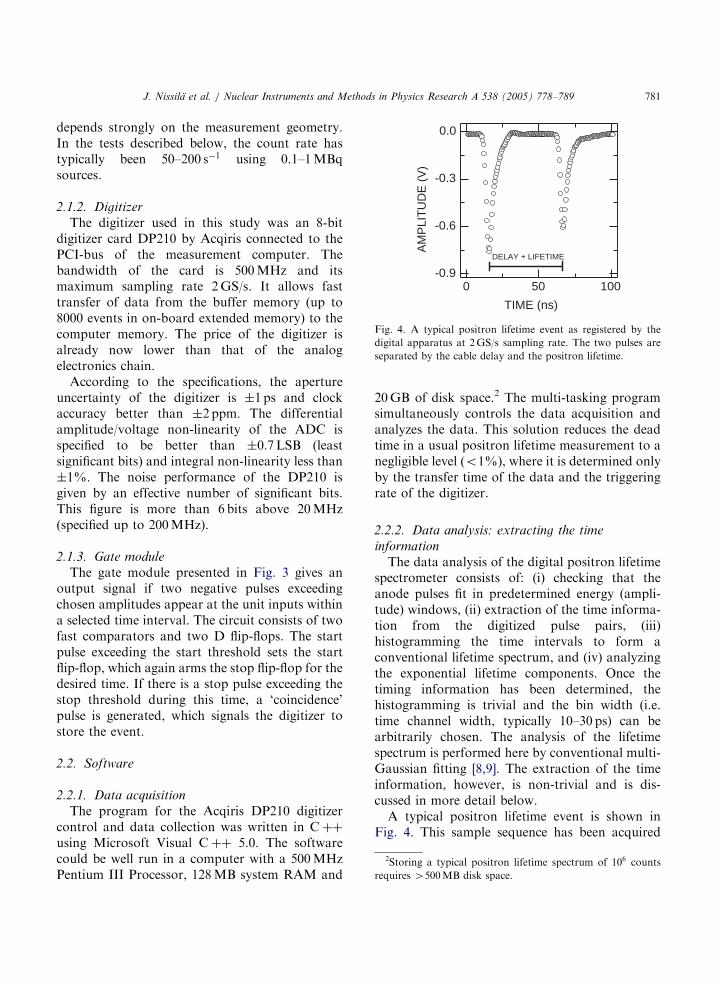
Fig. 4. A typical positron lifetime event as registered by the
digital apparatus at 2GS/s sampling rate. The two pulses are
separated by the cable delay and the positron lifetime.
2Storing a typical positron lifetime spectrum of 106 counts
requires 4500MB disk space.
J. Nissila et al. / Nuclear Instruments and Methods in Physics Research A 538 (2005) 778–789 781
depends strongly on the measurement geometry.In the tests described below, the count rate hastypically been 50–200 s1 using 0.1–1 MBqsources.
2.1.2. Digitizer
The digitizer used in this study was an 8-bitdigitizer card DP210 by Acqiris connected to thePCI-bus of the measurement computer. Thebandwidth of the card is 500 MHz and itsmaximum sampling rate 2GS/s. It allows fasttransfer of data from the buffer memory (up to8000 events in on-board extended memory) to thecomputer memory. The price of the digitizer isalready now lower than that of the analogelectronics chain.
According to the specifications, the apertureuncertainty of the digitizer is 1 ps and clockaccuracy better than 2 ppm: The differentialamplitude/voltage non-linearity of the ADC isspecified to be better than 0:7LSB (leastsignificant bits) and integral non-linearity less than1%: The noise performance of the DP210 isgiven by an effective number of significant bits.This figure is more than 6 bits above 20 MHz(specified up to 200 MHz).
2.1.3. Gate module
The gate module presented in Fig. 3 gives anoutput signal if two negative pulses exceedingchosen amplitudes appear at the unit inputs withina selected time interval. The circuit consists of twofast comparators and two D flip-flops. The startpulse exceeding the start threshold sets the startflip-flop, which again arms the stop flip-flop for thedesired time. If there is a stop pulse exceeding thestop threshold during this time, a ‘coincidence’pulse is generated, which signals the digitizer tostore the event.
2.2. Software
2.2.1. Data acquisition
The program for the Acqiris DP210 digitizercontrol and data collection was written in C þþ
using Microsoft Visual C þþ 5.0. The softwarecould be well run in a computer with a 500 MHzPentium III Processor, 128 MB system RAM and
20 GB of disk space.2 The multi-tasking programsimultaneously controls the data acquisition andanalyzes the data. This solution reduces the deadtime in a usual positron lifetime measurement to anegligible level (o1%), where it is determined onlyby the transfer time of the data and the triggeringrate of the digitizer.
2.2.2. Data analysis: extracting the time
information
The data analysis of the digital positron lifetimespectrometer consists of: (i) checking that theanode pulses fit in predetermined energy (ampli-tude) windows, (ii) extraction of the time informa-tion from the digitized pulse pairs, (iii)histogramming the time intervals to form aconventional lifetime spectrum, and (iv) analyzingthe exponential lifetime components. Once thetiming information has been determined, thehistogramming is trivial and the bin width (i.e.time channel width, typically 10–30 ps) can bearbitrarily chosen. The analysis of the lifetimespectrum is performed here by conventional multi-Gaussian fitting [8,9]. The extraction of the timeinformation, however, is non-trivial and is dis-cussed in more detail below.
A typical positron lifetime event is shown inFig. 4. This sample sequence has been acquired
ARTICLE IN PRESS
150
100
50AD
C V
ALU
E
BaF
150
100
50
0
20100-10
J. Nissila et al. / Nuclear Instruments and Methods in Physics Research A 538 (2005) 778–789782
with the Acqiris DP210 digitizer operating at asampling rate of 2GS/s. The first pulse originatesfrom the 1.275 MeV g-quantum and the secondfrom the 511 keV annihilation photon. Beforeextracting the time information from a pulse pair,one has to make sure that the pulses fit into theselected pulse-height (or energy) windows.
It is generally believed that the best timingalgorithm for scintillation detector pulses is con-stant fraction CF timing. The method wasdiscovered as a result of numerous leading-edge-timing measurements according to which themoment that represents the capture of the g-quantum with minimum time jitter is when thepulse crosses a certain constant fraction level f CF
of its full amplitude [12,13]. The optimum fractionis characteristic of the detectors, i.e. the scintillatorand the PMT types.
Not unexpectedly, we found that the bestmethod of obtaining the time information fromthe sampled pulses is CF timing. Other methodswhich were technically simpler but not making useof the CF principle were also tested. These,including algorithms based on determining thecenter of mass of the pulse, the peak position of amoving average over the pulse and the cross-correlation of the pulse with an average-shapedpulse, all resulted in time resolutions about25–35 ps worse than that obtained with CF timing.In the following, the CF procedures we used arediscussed in more detail.
The basic idea for finding the timing instant(and reducing the effect of noise) is to fit a curve tothe leading edge of the anode pulse and tocalculate the time corresponding to the desiredfraction from the fit. We tried three differentnumerical algorithms:
2
Plastic
fitting a Gaussian function,
0
-6 -4 -2 0
calculating a weighted moving average of thedata and interpolating the result with splines (aspresented in Ref. [5]) and
TIME (ns)
Fig. 5. Fast scintillation detector anode pulses with a plastic
and a BaF2 scintillator. The effect of the scintillation decay time
and the light collection time of the scintillators is visible in the
figure. The high voltage has been 1800V in both cases. The
solid lines depict Gaussian functions fitted to the leading edges.
fitting a smoothing spline.
The methods were compared by testing them witha single set of data.
A Gaussian was noticed to describe the leadingedge of a detector pulse rather well. As anexample, Fig. 5 presents pulses from detectors
with plastic and BaF2 scintillator, and correspond-ing Gaussian fits (BaF2 pulse is presented to showthat the 2GS/s sampling rate is sufficient tocapture its leading edge). We investigated thedependence of the time resolution on both thefitting range and the timing fraction. Best resultsconcerning the fitting range were obtained whenthe fit was applied to the range shown in Fig. 5. InFig. 6 we show the effect of the timing fraction onthe time resolution of the spectrometer. The curveswere obtained by varying the fraction in onedetector and by keeping the fraction constant inthe other. As seen, the optimum fraction is about25% with both detectors.
Cubic smoothing spline fitting is a method offitting a curve to a set of noisy data without usingprior knowledge on the functional form of thedata. It has recently been applied to reduce theeffect of noise in pulse-height spectroscopy [14].Full cubic splines are piecewise cubic polynomialswhich go exactly through the data points. In themethod of cubic smoothing splines, one searchesfor a piecewise cubic polynomial which attempts tominimize the residuals between the data and themodel while keeping the model function smootherthan with full cubic splines. The degree ofsmoothing is a variable parameter. The cubic
ARTICLE IN PRESS
240
235
230
225
220
FW
HM
(ps
)
100806040200
Start Stop
FRACTION (%)
Fig. 6. The time resolution of a test spectrometer as a function
of the fraction f CF used in the CF timing.
J. Nissila et al. / Nuclear Instruments and Methods in Physics Research A 538 (2005) 778–789 783
smoothing spline f pðtÞ is the piecewise cubicpolynomial f ðtÞ which minimizes the function
Sðf ðtÞ; yÞ ¼ pXN
i¼1
fyi f ðtiÞg2
þ ð1 pÞ
Z tN
t1
f 00ðtÞ2 dt; ð1Þ
where y is the sampled data and p is the parameterwhich determines the relative importance betweenminimizing the sum of the residuals and maximiz-ing the smoothness [15]. Lowering p leads intosmoothing of pulses somewhat similarly as in low-pass filtering (moving average), which has alsobeen used in a realization of a digital positronlifetime spectrometer [5].
We studied the time resolution obtained withcubic smoothing spline analysis by varying theparameter p, the range to which the smoothingspline was fitted, and the fraction f CF: The besttime resolution was obtained with p ¼ 0:3 andf CF ¼ 0:2; and it was a few picoseconds betterthan the best values obtained from Gauss fitting orthe method of a moving average followed withspline interpolation [5]. The similarity of theobtained resolutions and the results from thesimultaneous measurements with an analog set-
up (see Section 3.2.3) suggest that all threetiming algorithms are near the optimum for CFmethods.
The timing performance of the spectrometer andthe functioning of the analysis procedure aredemonstrated in Fig. 7. One is able to perceivethe time spread associated to the detectors whenthe pulse pairs are normalized and shifted so thatthe start pulses coincide.
3. Performance of the system
3.1. Data throughput
The DP210 digitizer with extended memory (16Mpoints) can store up to 8000 events at a time(maximum 2000 points per sweep). These data canbe transferred to computer main memory with asufficient rate. Recently, transfer rate measure-ments were made with a new computer with dualAMD Athlon MP 1900+ processors. In a test inwhich pulses were fed to the digitizer from a pulsegenerator, up to 30,000 unprocessed events persecond could be recorded to main memory. Thisrate is limited by the hardware. When performingan online analysis to the data, the computingpower of the processor limits the maximum rate oftrue analyzed events to 3000 s1 (using cubicsmoothing spline fitting). This rate is clearly highenough for routine positron lifetime measurements.
3.2. Time resolution
The most prominent performance characteristicof a positron lifetime spectrometer is, besides thecount rate, the time resolution. In analog systemsit is widely accepted that the electronics degradesthe total resolution only marginally, by around10 ps or less at the 200 ps level. In other words, theresolution of a spectrometer with properly opti-mized electronics is determined by the detectors. Ina digital spectrometer the ‘electronic resolution’ isinfluenced by several factors, e.g. the sampling rate(or the number of samples in the pulse), the noiseadded to the voltage pulse by the digitizer and theamplitude linearity of the digitizer. In this sectionwe investigate the role of these factors. In addition,
ARTICLE IN PRESS
J. Nissila et al. / Nuclear Instruments and Methods in Physics Research A 538 (2005) 778–789784
the method used to analyze the voltage pulse playsa role, as discussed in Section 2.2.2. All thefollowing data in this section are analyzed using
100
80
60
40
20
0
AM
PLI
TU
DE
(S
CA
LED
)
100755025
TIME (ns)
FRACTION (28%)
ZOOM AREA
100
80
60
40
20
0
AM
PLI
TU
DE
(S
CA
LED
)
2827262524
TIME (ns)
80
60
40
20
0
AM
PLI
TU
DE
(S
CA
LED
)
7675747372
TIME (ns)
100
(a)
(b)
(c)
the Gauss-fit procedure. Considering only theADC specifications given for the digitizer, it is byno means a priori clear that the time spreadcontribution of the digitizer would be competitivewith that obtained with analog instruments.
As a preliminary test, we measured the ‘electro-nic resolution’ (or actually its lower limit) of thedigital spectrometer with constant amplitudepulses divided in two unequal cable delays. Weobtained a value of about 20 ps, which corre-sponds to an effect of 1 or 2 ps on the totalresolution.
3.2.1. Effect of sampling rate and noise
The influence of sampling rate and noise on thetime resolution of the digital positron lifetimespectrometer was studied by using a 60Co source.It emits two simultaneous photons with energies1.17 and 1.33 MeV acting thereby as a nearly idealsource for resolution studies. To make the studymore comprehensive, we used also our previousdigital positron lifetime spectrometer setup basedon the Tektronix TDS 3052 oscilloscope [4] withthe data-analysis procedures presented in thepresent paper.
The detector conditions were kept constantduring the data-acquisition period. Data wereacquired at sampling rates 1 and 2 GS/s withDP210, and at 2.5 and 5GS/s with TDS 3052. Thetime resolution value (FWHM) obtained withDP210 was 204 ps at 1 GS/s and 201 ps at 2GS/s.For the TDS 3052, results were 208 ps at bothsampling rates.
Contrary to expectation, the time resolutionvalues obtained with TDS 3052 are, in spite of thelarger number of samples in the leading edge,slightly worse than those measured with DP210. Apotential explanation could be the larger amountof noise in the Tektronix data. A visual compar-ison of the pulses recorded with the two digitizersreveals that the noise level of TDS 3052 is about
Fig. 7. A timing demonstration. The pulse pairs are obtained
by measuring an ideal coincidence source (panel a). A Gaussian
fit has been used for timing. Pairs have been shifted and pulse
heights normalized so that the timing instants of start pulses
coincide (panel b). The time resolution can then be observed as
the jitter of the positions of normalized stop pulses (panel c).
ARTICLE IN PRESS
240
220
200
FW
HM
(ps
)
12010080STOP LL (ADC VALUE, LSB)
6744
6741
6738
PE
AK
PO
SIT
ION
(ps
)
FWHM PEAK POSITION
Fig. 8. Resolution function peak position (walk) and FWHM
as a function of the lower limit of a narrow (8 LSB) energy
window in stop detector. The horizontal range of the figure
corresponds to a 50% 22Na stop window. The lines are for
guiding the eye. The results are similar for the start detector.
J. Nissila et al. / Nuclear Instruments and Methods in Physics Research A 538 (2005) 778–789 785
two times that of DP210. No significant differencein the pulse shapes at least up to 1V level can beobserved. This comparison was done with pulsessampled at 2GS/s (DP210) and 2.5 GS/s (TDS3052).
To evaluate the effect of random noise in thedigitized pulses we added different amounts ofsimulated white noise with software to the datasampled with DP210 at 2GS/s. To quantify theresults, we calculated the average magnitude ofthe deviation between a voltage sample and the(Gaussian) fit. Without any extra noise added tothe pulse the average deviation was found to beabout 1.0 LSB. Adding noise so that the deviationequals 1.1 LSB results in a degradation of resolu-tion by 3 ps. Further, an average deviation of1.5 LSB leads to FWHM=221 ps, i.e. worseningof time resolution by 20 ps. This simulation clearlysuggests that the time resolution is sensitive torandom noise in the digitized pulse. This may wellexplain the poorer time resolution obtained fromthe data measured with TDS 3052.
To obtain a better understanding on theimportance of the number of points on the leadingedge, we manipulated the sample sequencescollected with DP 210 at the 2GS/s sampling rateto imitate acquisitions at 1 GS/s and at 667 MS/s.This was done simply by selecting every second orthird sample for 1 GS/s and 667 MS/s, respectively.The time analysis of these data results in aresolution about 3 ps at 1GS/s and 30 ps at667 MS/s worse than that obtained at 2GS/s.The third highest ‘hardwired’ sampling rate500 MS/s does not enable successful timing: atthis rate the resolution function splits into separateGaussian-like peaks. This result is easily under-standable since there are only two samples on theleading edge.
The small difference between the 1 and 2GS/sresolution results suggests that a further increasein the sampling rate at this noise level may not leadto significant enhancement in the resolution. Thus,with a digitizer whose noise properties are likethose of the Acqiris DP210, the minimum numberof samples on the leading edge required for a close-to-optimum timing is about four (1 GS/s). Eightsamples (2 GS/s) appear to give the full timeresolution in the present case.
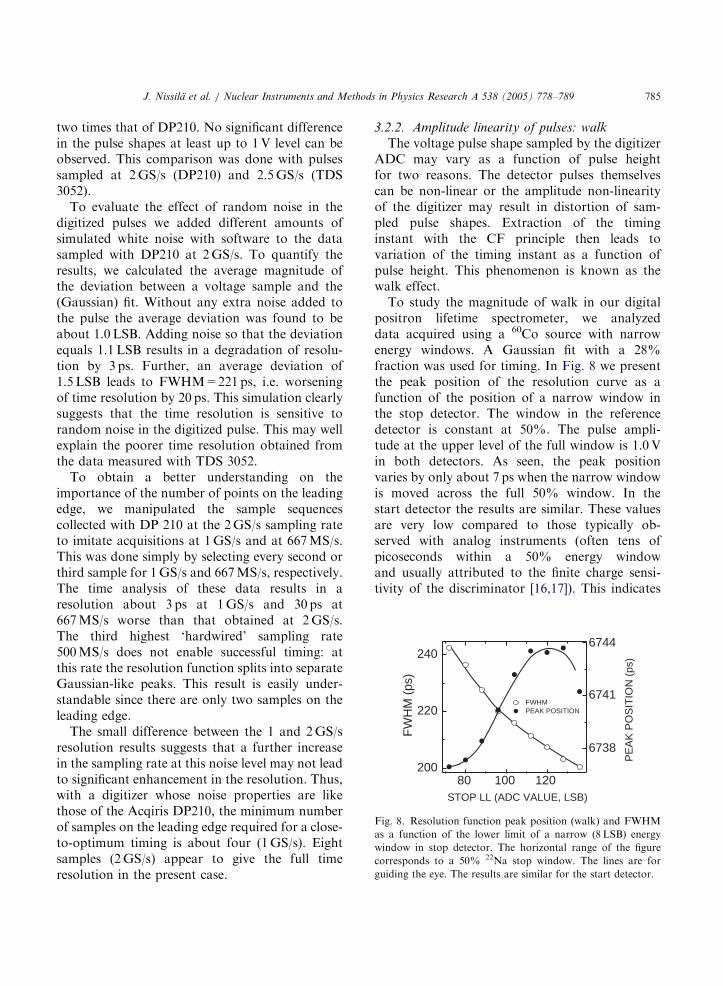
3.2.2. Amplitude linearity of pulses: walk
The voltage pulse shape sampled by the digitizerADC may vary as a function of pulse heightfor two reasons. The detector pulses themselvescan be non-linear or the amplitude non-linearityof the digitizer may result in distortion of sam-pled pulse shapes. Extraction of the timinginstant with the CF principle then leads tovariation of the timing instant as a function ofpulse height. This phenomenon is known as thewalk effect.
To study the magnitude of walk in our digitalpositron lifetime spectrometer, we analyzeddata acquired using a 60Co source with narrowenergy windows. A Gaussian fit with a 28%fraction was used for timing. In Fig. 8 we presentthe peak position of the resolution curve as afunction of the position of a narrow window inthe stop detector. The window in the referencedetector is constant at 50%. The pulse ampli-tude at the upper level of the full window is 1.0 Vin both detectors. As seen, the peak positionvaries by only about 7 ps when the narrow windowis moved across the full 50% window. In thestart detector the results are similar. These valuesare very low compared to those typically ob-served with analog instruments (often tens ofpicoseconds within a 50% energy windowand usually attributed to the finite charge sensi-tivity of the discriminator [16,17]). This indicates
ARTICLE IN PRESS
100
101
102
103
104
CO
UN
TS
-1000 -500 0 500 1000
TIME (ps)
DIGITAL ANALOG
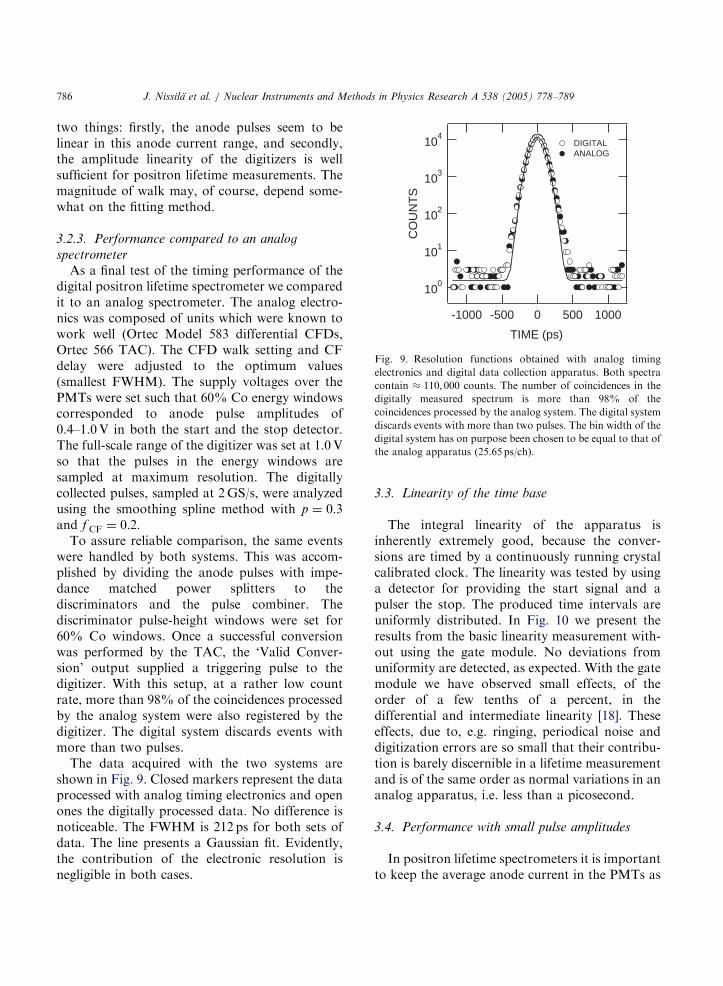
Fig. 9. Resolution functions obtained with analog timing
electronics and digital data collection apparatus. Both spectra
contain 110; 000 counts. The number of coincidences in the
digitally measured spectrum is more than 98% of the
coincidences processed by the analog system. The digital system
discards events with more than two pulses. The bin width of the
digital system has on purpose been chosen to be equal to that of
the analog apparatus (25.65 ps/ch).
J. Nissila et al. / Nuclear Instruments and Methods in Physics Research A 538 (2005) 778–789786
two things: firstly, the anode pulses seem to belinear in this anode current range, and secondly,the amplitude linearity of the digitizers is wellsufficient for positron lifetime measurements. Themagnitude of walk may, of course, depend some-what on the fitting method.
3.2.3. Performance compared to an analog
spectrometer
As a final test of the timing performance of thedigital positron lifetime spectrometer we comparedit to an analog spectrometer. The analog electro-nics was composed of units which were known towork well (Ortec Model 583 differential CFDs,Ortec 566 TAC). The CFD walk setting and CFdelay were adjusted to the optimum values(smallest FWHM). The supply voltages over thePMTs were set such that 60% Co energy windowscorresponded to anode pulse amplitudes of0.4–1.0V in both the start and the stop detector.The full-scale range of the digitizer was set at 1.0 Vso that the pulses in the energy windows aresampled at maximum resolution. The digitallycollected pulses, sampled at 2 GS/s, were analyzedusing the smoothing spline method with p ¼ 0:3and f CF ¼ 0:2:
To assure reliable comparison, the same eventswere handled by both systems. This was accom-plished by dividing the anode pulses with impe-dance matched power splitters to thediscriminators and the pulse combiner. Thediscriminator pulse-height windows were set for60% Co windows. Once a successful conversionwas performed by the TAC, the ‘Valid Conver-sion’ output supplied a triggering pulse to thedigitizer. With this setup, at a rather low countrate, more than 98% of the coincidences processedby the analog system were also registered by thedigitizer. The digital system discards events withmore than two pulses.
The data acquired with the two systems areshown in Fig. 9. Closed markers represent the dataprocessed with analog timing electronics and openones the digitally processed data. No difference isnoticeable. The FWHM is 212 ps for both sets ofdata. The line presents a Gaussian fit. Evidently,the contribution of the electronic resolution isnegligible in both cases.
3.3. Linearity of the time base
The integral linearity of the apparatus isinherently extremely good, because the conver-sions are timed by a continuously running crystalcalibrated clock. The linearity was tested by usinga detector for providing the start signal and apulser the stop. The produced time intervals areuniformly distributed. In Fig. 10 we present theresults from the basic linearity measurement with-out using the gate module. No deviations fromuniformity are detected, as expected. With the gatemodule we have observed small effects, of theorder of a few tenths of a percent, in thedifferential and intermediate linearity [18]. Theseeffects, due to, e.g. ringing, periodical noise anddigitization errors are so small that their contribu-tion is barely discernible in a lifetime measurementand is of the same order as normal variations in ananalog apparatus, i.e. less than a picosecond.
3.4. Performance with small pulse amplitudes
In positron lifetime spectrometers it is importantto keep the average anode current in the PMTs as
ARTICLE IN PRESS
280
260
240
220
FW
HM
(ps
)
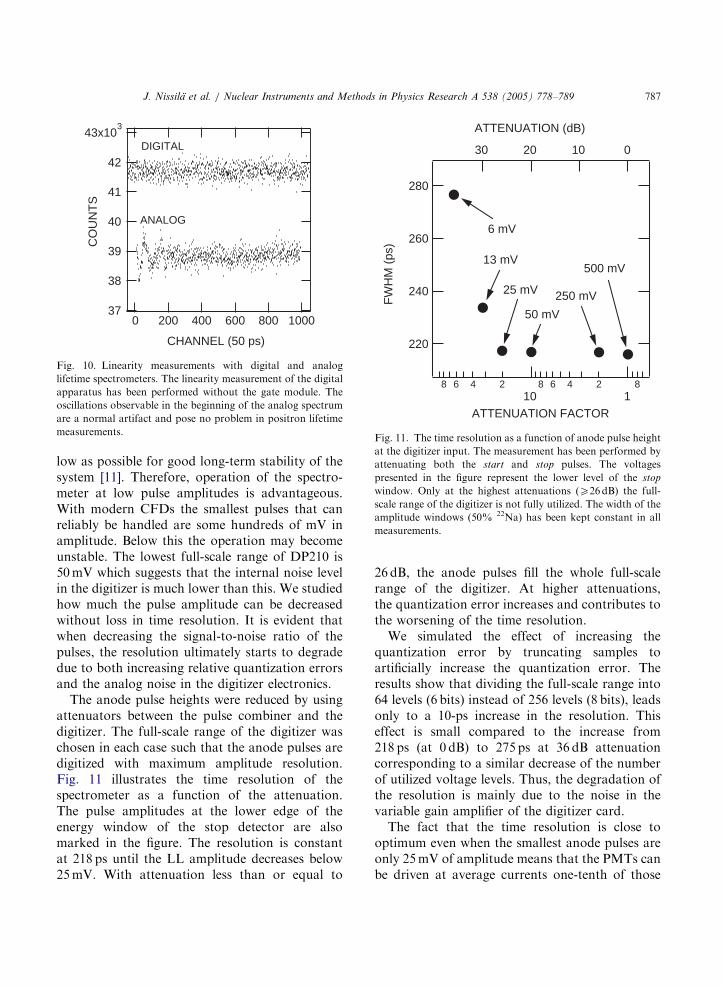
30 20 10 0
ATTENUATION (dB)
81
246810
2468
ATTENUATION FACTOR
6 mV
13 mV
25 mV
50 mV
500 mV
250 mV
Fig. 11. The time resolution as a function of anode pulse height
at the digitizer input. The measurement has been performed by
attenuating both the start and stop pulses. The voltages
presented in the figure represent the lower level of the stop
window. Only at the highest attenuations (X26 dB) the full-
scale range of the digitizer is not fully utilized. The width of the
amplitude windows (50% 22Na) has been kept constant in all
measurements.
43x103
42
41
40
39
38
37
CO
UN
TS
10008006004002000
CHANNEL (50 ps)
DIGITAL
ANALOG
Fig. 10. Linearity measurements with digital and analog
lifetime spectrometers. The linearity measurement of the digital
apparatus has been performed without the gate module. The
oscillations observable in the beginning of the analog spectrum
are a normal artifact and pose no problem in positron lifetime
measurements.
J. Nissila et al. / Nuclear Instruments and Methods in Physics Research A 538 (2005) 778–789 787
low as possible for good long-term stability of thesystem [11]. Therefore, operation of the spectro-meter at low pulse amplitudes is advantageous.With modern CFDs the smallest pulses that canreliably be handled are some hundreds of mV inamplitude. Below this the operation may becomeunstable. The lowest full-scale range of DP210 is50 mV which suggests that the internal noise levelin the digitizer is much lower than this. We studiedhow much the pulse amplitude can be decreasedwithout loss in time resolution. It is evident thatwhen decreasing the signal-to-noise ratio of thepulses, the resolution ultimately starts to degradedue to both increasing relative quantization errorsand the analog noise in the digitizer electronics.
The anode pulse heights were reduced by usingattenuators between the pulse combiner and thedigitizer. The full-scale range of the digitizer waschosen in each case such that the anode pulses aredigitized with maximum amplitude resolution.Fig. 11 illustrates the time resolution of thespectrometer as a function of the attenuation.The pulse amplitudes at the lower edge of theenergy window of the stop detector are alsomarked in the figure. The resolution is constantat 218 ps until the LL amplitude decreases below25 mV. With attenuation less than or equal to
26 dB, the anode pulses fill the whole full-scalerange of the digitizer. At higher attenuations,the quantization error increases and contributes tothe worsening of the time resolution.
We simulated the effect of increasing thequantization error by truncating samples toartificially increase the quantization error. Theresults show that dividing the full-scale range into64 levels (6 bits) instead of 256 levels (8 bits), leadsonly to a 10-ps increase in the resolution. Thiseffect is small compared to the increase from218 ps (at 0 dB) to 275 ps at 36 dB attenuationcorresponding to a similar decrease of the numberof utilized voltage levels. Thus, the degradation ofthe resolution is mainly due to the noise in thevariable gain amplifier of the digitizer card.
The fact that the time resolution is close tooptimum even when the smallest anode pulses areonly 25 mV of amplitude means that the PMTs canbe driven at average currents one-tenth of those
ARTICLE IN PRESS
1
102
103
104
CO
UN
TS
bulk Si5×10
5 counts
χ2 = 1.0
J. Nissila et al. / Nuclear Instruments and Methods in Physics Research A 538 (2005) 778–789788
usually required with analog CFDs (usable pulses4250mV). This decreases the degradation rateof the gain of the PMTs by the same factor,which again enhances the long-term stability ofthe spectrometer. When applying lower supplyvoltages over the PMTs, one just has to takecare that the voltages at the input electronoptics of the tubes are sufficiently high [11]. Thisusually means that one has to modify the voltagedivider chain from the suggestions given by themanufacturer.
100
10
200010000
TIME (ps)
Fig. 12. Positron lifetime spectrum measured in bulk Si. The
spectrum is source and background corrected. The average
positron lifetime from the fit is t ¼ 219ps and the time
resolution FWHM ¼ 220ps: A detector–source distance of a
few centimeters and a rather small number of counts explain the
exceptionally good fit at the beginning of the spectrum.
4. Other tests
4.1. Intermediate-term stability of the spectrometer
The stability of the digital positron lifetimespectrometer was investigated by collecting Co-spectra with about 2 105 counts each for 10days. An overall drift of about 10 ps in the centraof mass was observed. This magnitude is alsotypical of conventional analog spectrometers. Thisdrift can mostly be attributed to the variation ofthe transit time and gain of PMTs as a function oflaboratory temperature [19]. During the measure-ment the internal thermometer of the digitizer wasused to register the temperature, which varied byabout 2 1C. The correlation between the tempera-ture and the peak position is apparent. To reducethe effect of the drift, a normal software compen-sation is applicable, whereby the spectrum is savedin smaller parts and the drift is compensated byshifting the partial spectra into a fixed positionwith software.
4.2. Lifetime measurement
As a final test of the digital spectrometer wemeasured positron lifetime spectra in bulk Si(Fig. 12). After subtraction of the source compo-nents, a single exponential convoluted with aGaussian resolution function fits the data verywell. The fitted lifetime equals 219 ps in agreementwith previous experiments [7–9]. The time resolu-tion obtained from the fit is 220 ps (FWHM). Wehave already used the system in a positron lifetimestudy of the semi-insulating properties of SiC [20].
5. Conclusions
A fully operational digital positron lifetimespectrometer has been set up and its performanceinvestigated. The system is composed of two fastscintillation detectors, a pulse combiner, a trigger-ing unit and a digitizer connected to a computer.
The performance of the digital spectrometer wasstudied comprehensively by applying commonbasic tests used for characterizing a positronlifetime spectrometer. The results show that theperformance of the digital approach is equal to orbetter than that of the analog. The time resolutionof the system ( 200 ps) is similar to that achievedwith analog devices, and is primarily determinedby the scintillation detectors. The data processingand storage capacity achieved with the system,X3000 events per second, is sufficient for positronlifetime measurements. Compared to conventionalequipment, the linearity of the time scale wasfound to be good, as the conversions are timed bya continuously running crystal calibrated clock.We also demonstrate another important advan-tage—the possibility to use smaller pulses from the
ARTICLE IN PRESS
J. Nissila et al. / Nuclear Instruments and Methods in Physics Research A 538 (2005) 778–789 789
detectors, which slows down the aging of thePMTs. According to our tests the digitizer is ableto handle as small pulses as 25 mV withoutsignificant contribution to the time spread. Thequality of the digitizer is also demonstrated by thesmall amplitude walk, less than 10 ps in a 0.5–1 Vpulse-height window.
Various timing methods with software weretested and the best results were obtained with CFtiming. Software can also be implemented toperform offline corrections to compensate, e.g.residual amplitude walk and drifts in the spectrumposition, and to reject pile-up pulses. Thesepossibilities along with easy setup and goodstability represent significant advantages overconventional positron lifetime spectrometers.
Acknowledgements
We thank Prof. K. Kalliomaki for usefuldiscussions.
References
[1] P. Simoes, J. Martins, C. Correia, IEEE Trans. Nucl. Sci.
NS-43 (1996) 3.
[2] J.M. Los Arcos, E. Garcia-Torano, P. Olmos, J. Marin,
Nucl. Instr. and Meth. A 353 (1994).
[3] D.G. Cussans, H.F. Heath, Nucl. Instr. and Meth. A 362
(1995).
[4] K. Rytsola, J. Nissila, K. Kokkonen, A. Laakso,
R. Aavikko, K. Saarinen, Appl. Surf. Sci. 194 (2002) 260.
[5] H. Saito, Y. Nagashima, T. Kurihara, T. Hyodo, Nucl.
Instr. and Meth. A 487 (2002) 612.
[6] A. Codino, Nucl. Instr. and Meth. A 440 (2000) 191.
[7] A. Dupasquier, A.P. Mills jr. (Eds.), Positron Spectro-
scopy of Solids, IOS Press, Amsterdam, 1995.
[8] K. Saarinen, P. Hautojarvi, C. Corbel, in: M. Stavola
(Ed.), Identification of Defects in Semiconductors, Aca-
demic Press, New York, 1998.
[9] R. Krause-Rehberg, H.S. Leipner, Positron Annihilation
in Semiconductors, Springer, Heidelberg, 1999.
[10] F. Becvar, J. Cızek, L. Lestak, I. Novtny, I. Prochazka,
F. Sebesta, Nucl. Instr. and Meth. A 443 (2000) 557.
[11] J. Nissila, K. Rytsola, K. Saarinen, P. Hautojarvi, Nucl.
Instr. and Meth. A 481 (2002) 548.
[12] W.J. McDonald, D.A. Gedcke, Nucl. Instr. and Meth. 55
(1967) 1.
[13] D.A. Gedcke, W.J. McDonald, Nucl. Instr. and Meth. 55
(1967) 377.
[14] T. Kurahashi, H. Takahashi, M. Nakazawa, Nucl. Instr.
and Meth. A 422 (1999) 385.
[15] C. de Boor, A Practical Guide to Splines, Springer, Berlin,
1978.
[16] M.O. Bedwell, T.J. Paulus, IEEE Trans. Nucl. Sci. NS-26
(1979) 1.
[17] Model 583 Constant Fraction Differential Discriminator
Operating and Service Manual, EG&G Ortec, Oak Ridge,
TN, 1978.
[18] R. Aavikko, K. Rytsola, J. Nissila, Mater. Sci. Forum,
445–446 (2004) 462.
[19] J. Nissila, M. Karppinen, K. Rytsola, J. Oila, K. Saarinen,
P. Hautojarvi, Nucl. Instr. and Meth. A 466 (2001)
527.
[20] R. Aavikko, K. Saarinen, B. Magnusson, E. Janzen,
Clustering of vacancy defects in high-purity semi-insulat-


![1.1.2. Positron and Positronium Physicssundoc.bibliothek.uni-halle.de/diss-online/08/08H048/t2.pdf · [9], positron was the first antiparticle in physics. The first experimental evidence](https://static.documents.pub/doc/80x56/5f4d32f5f286726c13798e91/112-positron-and-positronium-9-positron-was-the-first-antiparticle-in-physics.jpg)


