CSIP Level 0:This document or digital media and the information contained in it is proprietary and confidential information of Philips and may not be reproduced, copied in whole or in part, adapted, modified, disclosed to others, or disseminated without the prior written permission of the Philips Legal Department. This document or digital media is intended to be (a.) used by customers and is licensed to them as part of their Philips equipment purchase or (b.) used to meet regulatory commitments as required by the FDA under 21 CFR 1020.30 (and any amendments to it) and other local regulatory requirements. Use of this document or digital media by unauthorized persons is strictly prohibited.
PerformanceBridge Quality v1.6.0 User Guide
D000579716 Revision B
Proprietary Notice: This document and the information contained in it is the proprietary and confidential information of Philips and may not be reproduced, copied in whole or in part, adapted, modified, disclosed to others, or disseminated without the prior written permission of the Philips Legal Department. Use of this document and the information contained in it is strictly reserved for current Philips personnel and Philips customers who have a current and valid license from Philips for use by the customer’s designated in-house service employee on equipment located at the customer’s designated site. Use of this document by unauthorized persons is strictly prohibited. Report violation of these requirements to the Philips Legal Department. This document must be returned to Philips when the user is no longer licensed and in any event upon Philips’ first written request.
Warranty Disclaimer: Philips provides this DOCUMENT without warranty of any kind, implied or expressed, including, but not limited to, the implied warranties of merchantability and fitness for a particular purpose.
Limitations of Liability: Philips has taken care to ensure the accuracy of this document. However, Philips assumes no liability for errors or omissions and reserves the right to make changes without further notice to any products herein to improve reliability, function, or design. Philips may make improvements or changes in the product(s) or program(s) described in this document at any time.
ATTENTION: THIS PAGE CONTAINS COPYRIGHTED MATERIALS THAT ARE CONFIDENTIAL AND/OR PROPRIETARY. ANY RELEASE OR DISTRIBUTION OF THIS MATERIAL, WITHOUT PERMISSION, IS A VIOLATION OF LAW.
2
User Guide User Guide
1 Product Information Philips Medical Systems Nederland B.V. Veenpluis 6 5684 PC Best The Netherlands
ATTENTION: THIS PAGE CONTAINS COPYRIGHTED MATERIALS THAT ARE CONFIDENTIAL AND/OR PROPRIETARY. ANY RELEASE OR DISTRIBUTION OF THIS MATERIAL, WITHOUT PERMISSION, IS A VIOLATION OF LAW.
3
TABLE OF CONTENTS
1 Product Information ............................................................................................ 2 2 Publication History .............................................................................................. 5 3 Introduction ........................................................................................................ 6
3.1 About PerformanceBridge Quality and Productivity ...................................... 6 3.2 Purpose and Intended Use of This Document ................................................ 6 3.3 Protecting Personal Information..................................................................... 6 3.4 Browser Compatibility .................................................................................... 7 3.5 Compliance...................................................................................................... 7 3.6 Accessing the Application ............................................................................... 7
4 Workflow ............................................................................................................ 8 4.1 Logging In ........................................................................................................ 8 4.2 Portal Page ...................................................................................................... 8 4.3 Logging Out .................................................................................................... 11 4.4 Navigating the User Interface ........................................................................ 12 4.5 User Tools ...................................................................................................... 14
4.5.1 Using the Dashboard .......................................................................... 14 4.5.2 Control................................................................................................ 15
4.5.2.1 Editing Displayed Data ........................................................... 15 4.5.3 Builder ................................................................................................ 20
4.5.4 Filters .................................................................................................. 23 4.5.4.1 Editing Displayed Data in Filters ............................................ 23 4.5.4.2 Date/Time Filter ..................................................................... 23 4.5.4.3 Smart Filtering ........................................................................ 24 4.5.4.4 Inclusive and Exclusive Filter Mode ....................................... 26
4.5.5 Autopreview Toggle ........................................................................... 27 4.5.6 Performance Warning ........................................................................ 28 4.5.7 Viewing Tabular View of Data ............................................................ 28 4.5.8 Using the Control Interface ............................................................... 30 4.5.9 Moving a KPI from Dashboard to Control .......................................... 31 4.5.10 Best Practices for the Application ...................................................... 31 4.5.11 Data Analysis ...................................................................................... 32
ATTENTION: THIS PAGE CONTAINS COPYRIGHTED MATERIALS THAT ARE CONFIDENTIAL AND/OR PROPRIETARY. ANY RELEASE OR DISTRIBUTION OF THIS MATERIAL, WITHOUT PERMISSION, IS A VIOLATION OF LAW.
ATTENTION: THIS PAGE CONTAINS COPYRIGHTED MATERIALS THAT ARE CONFIDENTIAL AND/OR PROPRIETARY. ANY RELEASE OR DISTRIBUTION OF THIS MATERIAL, WITHOUT PERMISSION, IS A VIOLATION OF LAW.
5
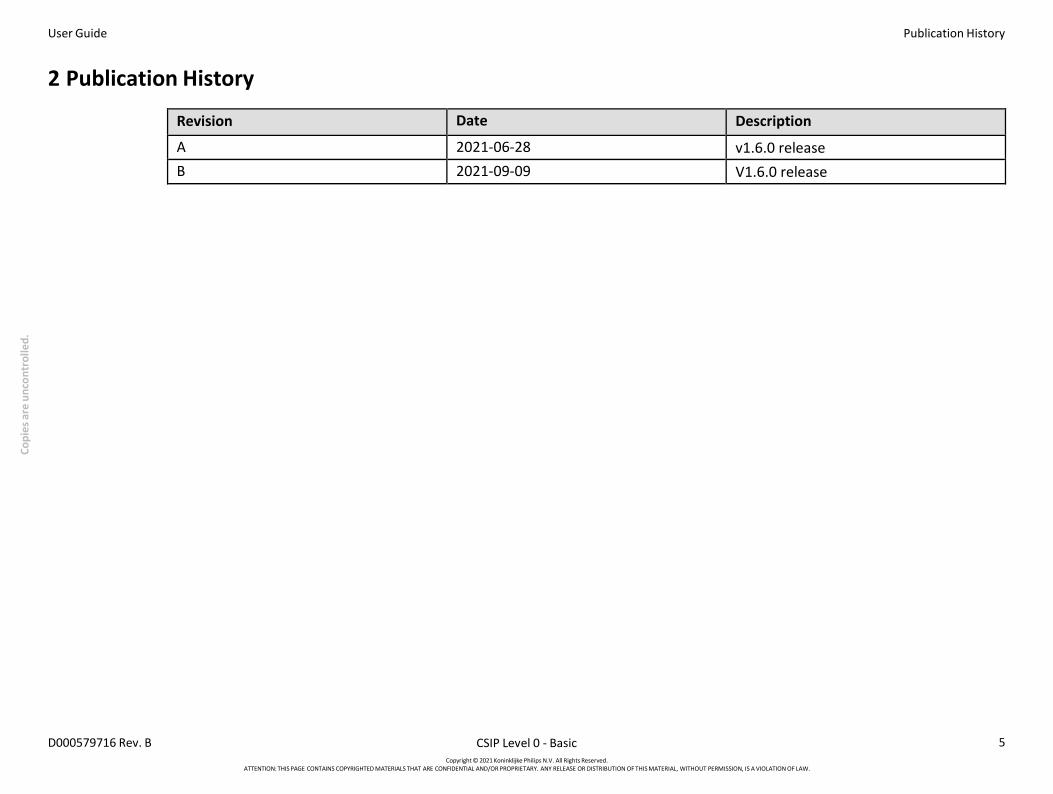
2 Publication History
Revision Date Description
A 2021-06-28 v1.6.0 release B 2021-09-09 V1.6.0 release
Copi
es a
re u
ncon
trol
led.
User Guide About PerformanceBridge Quality and Productivity
ATTENTION: THIS PAGE CONTAINS COPYRIGHTED MATERIALS THAT ARE CONFIDENTIAL AND/OR PROPRIETARY. ANY RELEASE OR DISTRIBUTION OF THIS MATERIAL, WITHOUT PERMISSION, IS A VIOLATION OF LAW.
6
IMPORTANT
This product is not for diagnostic, monitoring, or therapeutic purposes, or in any other manner for regular medical practice.
3 Introduction 3.1 About PerformanceBridge Quality and Productivity
Intended Use PerformanceBridge Quality and PerformanceBridge Productivity can be used to gain visibility into departmental workflow metrics and help to empower imaging leaders to make strategic short- and long-term decisions to improve operational and financial performance.
These two applications feature easy-to-understand dashboards with essential radiology department performance metrics around exam turnaround time, patient wait, staff performance, financials, and more.
3.2 Purpose and Intended Use of This Document This manual is intended for the front-line user of the PerformanceBridge Quality application.
3.3 Protecting Personal Information It is recommended that customers have policies and procedures for properly handling personal or sensitive information, ePHI (electronic Protected Health Information) and PHI (Protected Health Information), which will maintain the confidentiality, integrity, and availability of these types of data. Any organization using this product should implement the required protective means necessary to safeguard personal information consistent with each applicable country's law, code, and regulation; and consistent with their developed and maintained internal policies and procedures. While handling personal information is outside the scope of this document, in general, each organization is responsible for identifying: • Who has access to personal data, and under what conditions an individual has the authorization to use that data.
• What security controls are in place to protect personal and sensitive data.
• How the data is stored, and the conditions by which it is stored. • How the data is transmitted and the conditions under which that data is transmitted.
Protecting personal health information is a primary component of a security strategy. Personal and sensitive information should be protected according to the applicable laws, regulations, and directives, such as HIPAA, PIPEDA, and/or GDPR EU 2016/679.
ATTENTION: THIS PAGE CONTAINS COPYRIGHTED MATERIALS THAT ARE CONFIDENTIAL AND/OR PROPRIETARY. ANY RELEASE OR DISTRIBUTION OF THIS MATERIAL, WITHOUT PERMISSION, IS A VIOLATION OF LAW.
7
NOTE Internet Explorer browser will not be supported beyond PerformanceBridge version 4.0.
3.4 Browser Compatibility To make sure you have the best experience, use one of the two most recent versions of the following supported browsers:
• Chrome (>=87.x).
• Safari (>=10.x) Validated for use on the Apple iPad using the Safari browser.
• Firefox (>=80.x).
• iOS (iPad to access the application on view only mode).
• Internet Explorer (>=11).
The system relies on HTML5, CSS3, JavaScript, and other web standards. Each web browser may implement part or all of these standards. The system has also been tested and validated for use on Apple iPads using the Safari browser.
3.5 Compliance This software product complies with relevant international and national standards and laws. Information on compliance will be supplied on request by your local Philips Medical Systems Representative, or by the Manufacturer. This software product must be installed on appropriate IT equipment that complies with relevant international and national laws and standards on EMC (Electro-Magnetic Compatibility) and Electrical Safety. Such laws and standards define both the permissible electromagnetic emission levels from equipment and its required immunity to electromagnetic interference from external sources.
3.6 Accessing the Application The PerformanceBridge Application Suite is entirely web-based and located as a launchable link from your organization’s Philips PerformanceBridge Application Suite portal page.
ATTENTION: THIS PAGE CONTAINS COPYRIGHTED MATERIALS THAT ARE CONFIDENTIAL AND/OR PROPRIETARY. ANY RELEASE OR DISTRIBUTION OF THIS MATERIAL, WITHOUT PERMISSION, IS A VIOLATION OF LAW.
8
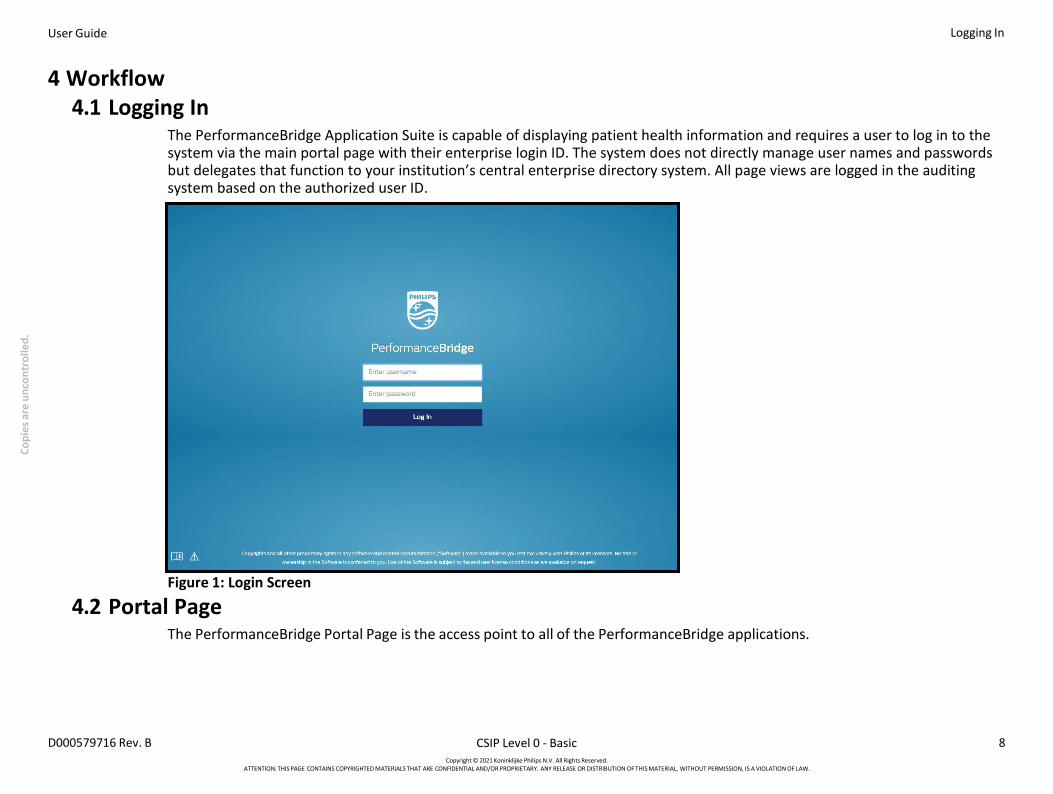
4 Workflow 4.1 Logging In
The PerformanceBridge Application Suite is capable of displaying patient health information and requires a user to log in to the system via the main portal page with their enterprise login ID. The system does not directly manage user names and passwords but delegates that function to your institution’s central enterprise directory system. All page views are logged in the auditing system based on the authorized user ID.
Figure 1: Login Screen
4.2 Portal Page The PerformanceBridge Portal Page is the access point to all of the PerformanceBridge applications.
ATTENTION: THIS PAGE CONTAINS COPYRIGHTED MATERIALS THAT ARE CONFIDENTIAL AND/OR PROPRIETARY. ANY RELEASE OR DISTRIBUTION OF THIS MATERIAL, WITHOUT PERMISSION, IS A VIOLATION OF LAW.
9
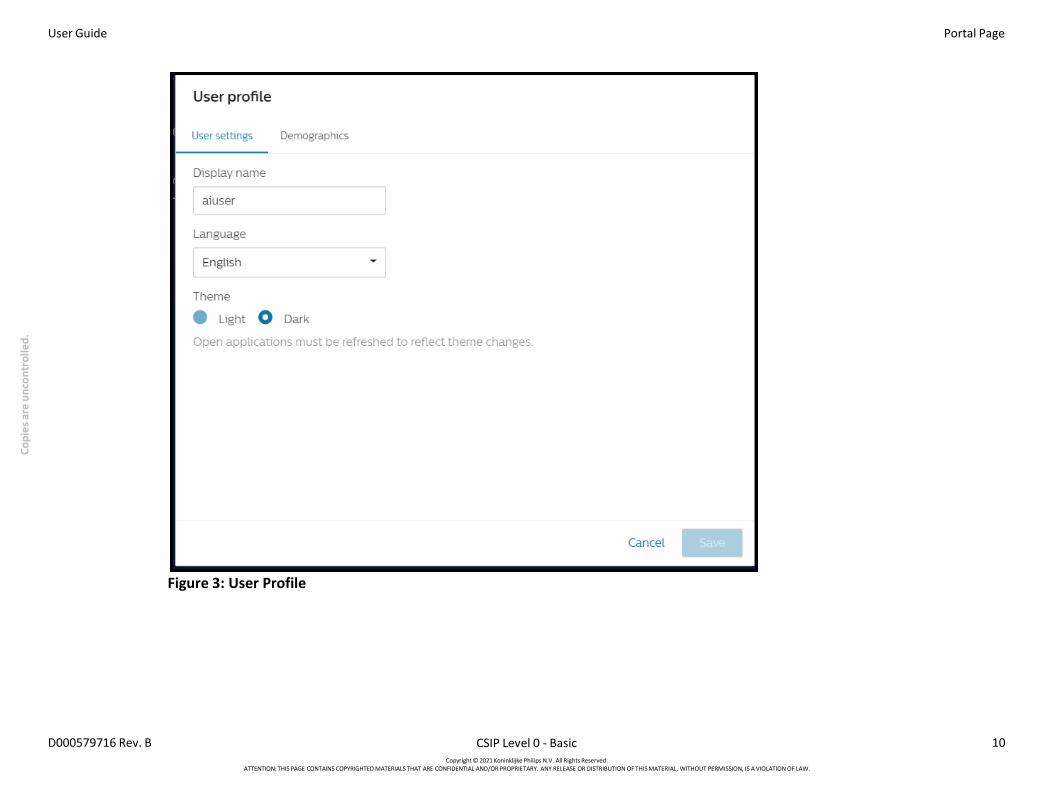
Figure 2: Portal Page (Representative Image)
The Portal Page also allows users to customize the settings for their individual profile, including Display name, Language, and Theme (light or dark). Co
ATTENTION: THIS PAGE CONTAINS COPYRIGHTED MATERIALS THAT ARE CONFIDENTIAL AND/OR PROPRIETARY. ANY RELEASE OR DISTRIBUTION OF THIS MATERIAL, WITHOUT PERMISSION, IS A VIOLATION OF LAW.
ATTENTION: THIS PAGE CONTAINS COPYRIGHTED MATERIALS THAT ARE CONFIDENTIAL AND/OR PROPRIETARY. ANY RELEASE OR DISTRIBUTION OF THIS MATERIAL, WITHOUT PERMISSION, IS A VIOLATION OF LAW.
ATTENTION: THIS PAGE CONTAINS COPYRIGHTED MATERIALS THAT ARE CONFIDENTIAL AND/OR PROPRIETARY. ANY RELEASE OR DISTRIBUTION OF THIS MATERIAL, WITHOUT PERMISSION, IS A VIOLATION OF LAW.
12
4.3 Logging Out 1. To log out, click the Username and Logout at the top-right of the screen.
Figure 5: Logout Screen
4.4 Navigating the User Interface The user interface is designed for smooth navigation between the different functions of the application. Once you have logged into the system, you are directed to the landing page with the navigation bar located at the top of the screen. The navigation bar is used to access the different sections of the application.
Figure 6: Navigation Bar The application menu is used to quickly switch from one application to another without having to navigate to the Portal Page
first. To access the application menu, click on the the application menu.
icon. To access the Portal Page, click on “Explore all apps” within
ATTENTION: THIS PAGE CONTAINS COPYRIGHTED MATERIALS THAT ARE CONFIDENTIAL AND/OR PROPRIETARY. ANY RELEASE OR DISTRIBUTION OF THIS MATERIAL, WITHOUT PERMISSION, IS A VIOLATION OF LAW.
ATTENTION: THIS PAGE CONTAINS COPYRIGHTED MATERIALS THAT ARE CONFIDENTIAL AND/OR PROPRIETARY. ANY RELEASE OR DISTRIBUTION OF THIS MATERIAL, WITHOUT PERMISSION, IS A VIOLATION OF LAW.
14
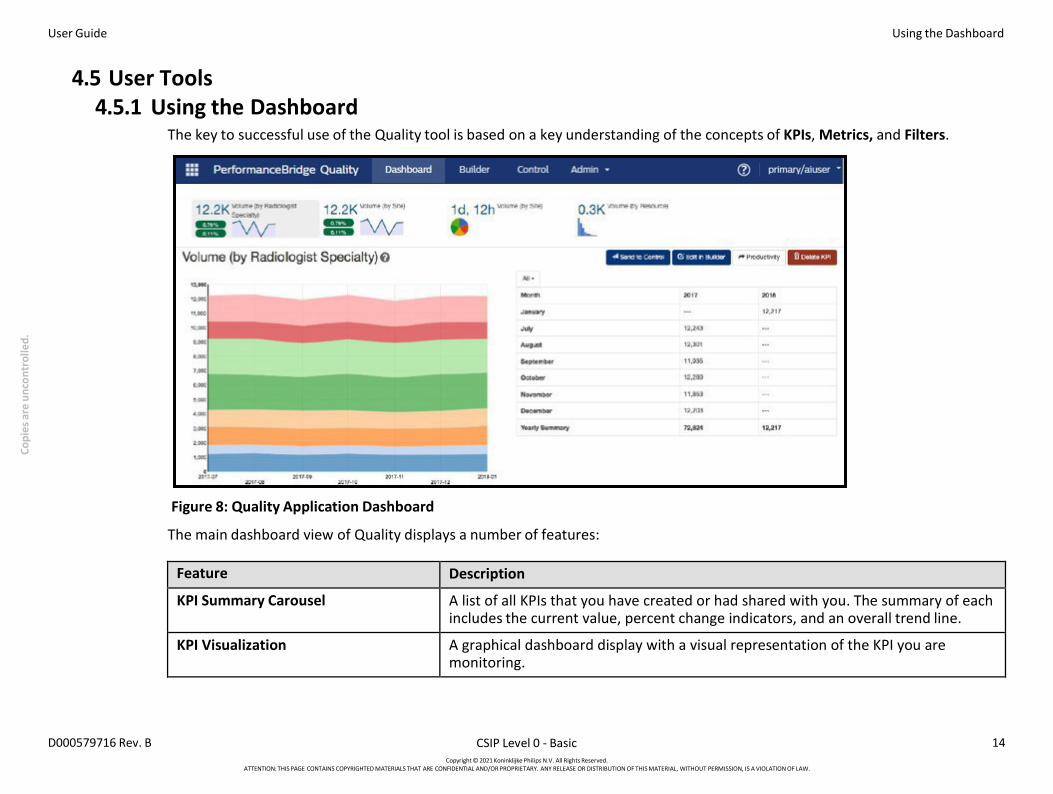
4.5 User Tools 4.5.1 Using the Dashboard
The key to successful use of the Quality tool is based on a key understanding of the concepts of KPIs, Metrics, and Filters.
Figure 8: Quality Application Dashboard
The main dashboard view of Quality displays a number of features:
Feature Description
KPI Summary Carousel A list of all KPIs that you have created or had shared with you. The summary of each includes the current value, percent change indicators, and an overall trend line.
KPI Visualization A graphical dashboard display with a visual representation of the KPI you are monitoring.
ATTENTION: THIS PAGE CONTAINS COPYRIGHTED MATERIALS THAT ARE CONFIDENTIAL AND/OR PROPRIETARY. ANY RELEASE OR DISTRIBUTION OF THIS MATERIAL, WITHOUT PERMISSION, IS A VIOLATION OF LAW.
15
Feature Description
KPI Table Supporting data values that make up the graphical view in an easy-to-see tabular view.
KPI Explanation A description of the KPI and all the filters that are part of it.
KPI Controls Actions you can take on your KPI (edit, send to control, and delete).
4.5.2 Control 4.5.2.1 Editing Displayed Data
There are various controls available in the application that allow you to customize the data displayed.
To have access to these controls, the Metrics must be enabled in the Admin Config Builder.
NOTE
Selecting any duration-based metric will allow you to visualize the data as an average or percentile. Selecting a volume-based metric will present the data as a sum across the Y-axis.
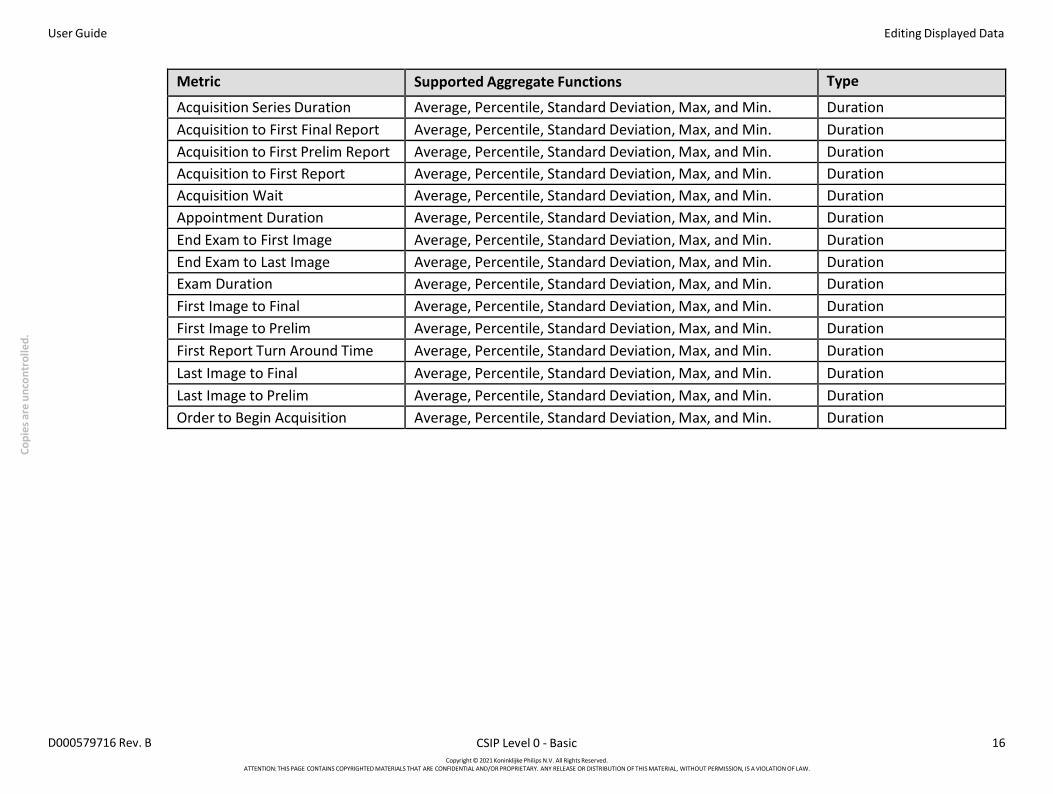
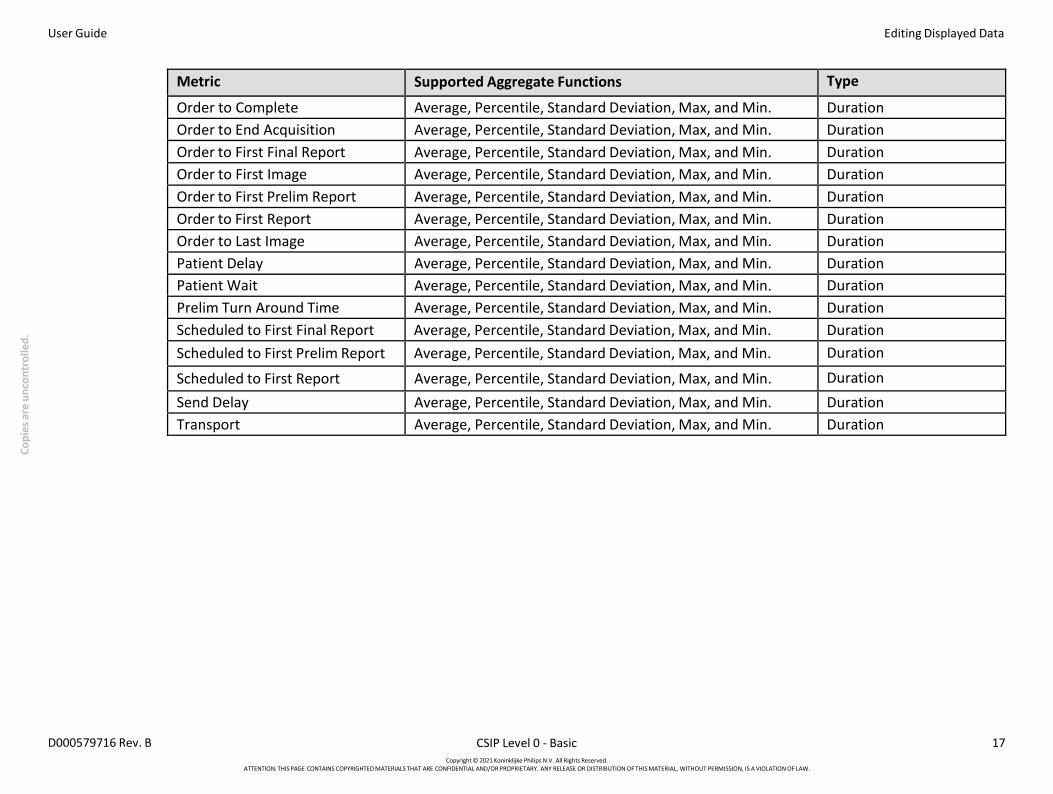
The table below details some of the supported aggregate time-based and non-duration based metrics allowed in the Productivity and Quality applications:
Metric Supported Aggregate Functions Type
Acquisition Duration Average, Percentile, Standard Deviation, Max, and Min. Duration
Access Wait Average, Percentile, Standard Deviation, Max, and Min. Duration Acquisition Delay Average, Percentile, Standard Deviation, Max, and Min. Duration Acquisition Interseries Delay Average, Percentile, Standard Deviation, Max, and Min. Duration Acquisition Ready Average, Percentile, Standard Deviation, Max, and Min. Duration
ATTENTION: THIS PAGE CONTAINS COPYRIGHTED MATERIALS THAT ARE CONFIDENTIAL AND/OR PROPRIETARY. ANY RELEASE OR DISTRIBUTION OF THIS MATERIAL, WITHOUT PERMISSION, IS A VIOLATION OF LAW.
16
Metric Supported Aggregate Functions Type
Acquisition Series Duration Average, Percentile, Standard Deviation, Max, and Min. Duration Acquisition to First Final Report Average, Percentile, Standard Deviation, Max, and Min. Duration Acquisition to First Prelim Report Average, Percentile, Standard Deviation, Max, and Min. Duration Acquisition to First Report Average, Percentile, Standard Deviation, Max, and Min. Duration Acquisition Wait Average, Percentile, Standard Deviation, Max, and Min. Duration Appointment Duration Average, Percentile, Standard Deviation, Max, and Min. Duration End Exam to First Image Average, Percentile, Standard Deviation, Max, and Min. Duration End Exam to Last Image Average, Percentile, Standard Deviation, Max, and Min. Duration Exam Duration Average, Percentile, Standard Deviation, Max, and Min. Duration First Image to Final Average, Percentile, Standard Deviation, Max, and Min. Duration First Image to Prelim Average, Percentile, Standard Deviation, Max, and Min. Duration First Report Turn Around Time Average, Percentile, Standard Deviation, Max, and Min. Duration Last Image to Final Average, Percentile, Standard Deviation, Max, and Min. Duration Last Image to Prelim Average, Percentile, Standard Deviation, Max, and Min. Duration Order to Begin Acquisition Average, Percentile, Standard Deviation, Max, and Min. Duration
ATTENTION: THIS PAGE CONTAINS COPYRIGHTED MATERIALS THAT ARE CONFIDENTIAL AND/OR PROPRIETARY. ANY RELEASE OR DISTRIBUTION OF THIS MATERIAL, WITHOUT PERMISSION, IS A VIOLATION OF LAW.
17
Metric Supported Aggregate Functions Type
Order to Complete Average, Percentile, Standard Deviation, Max, and Min. Duration Order to End Acquisition Average, Percentile, Standard Deviation, Max, and Min. Duration Order to First Final Report Average, Percentile, Standard Deviation, Max, and Min. Duration Order to First Image Average, Percentile, Standard Deviation, Max, and Min. Duration Order to First Prelim Report Average, Percentile, Standard Deviation, Max, and Min. Duration Order to First Report Average, Percentile, Standard Deviation, Max, and Min. Duration Order to Last Image Average, Percentile, Standard Deviation, Max, and Min. Duration Patient Delay Average, Percentile, Standard Deviation, Max, and Min. Duration Patient Wait Average, Percentile, Standard Deviation, Max, and Min. Duration Prelim Turn Around Time Average, Percentile, Standard Deviation, Max, and Min. Duration Scheduled to First Final Report Average, Percentile, Standard Deviation, Max, and Min. Duration Scheduled to First Prelim Report Average, Percentile, Standard Deviation, Max, and Min. Duration
Scheduled to First Report Average, Percentile, Standard Deviation, Max, and Min. Duration Send Delay Average, Percentile, Standard Deviation, Max, and Min. Duration Transport Average, Percentile, Standard Deviation, Max, and Min. Duration
ATTENTION: THIS PAGE CONTAINS COPYRIGHTED MATERIALS THAT ARE CONFIDENTIAL AND/OR PROPRIETARY. ANY RELEASE OR DISTRIBUTION OF THIS MATERIAL, WITHOUT PERMISSION, IS A VIOLATION OF LAW.
18
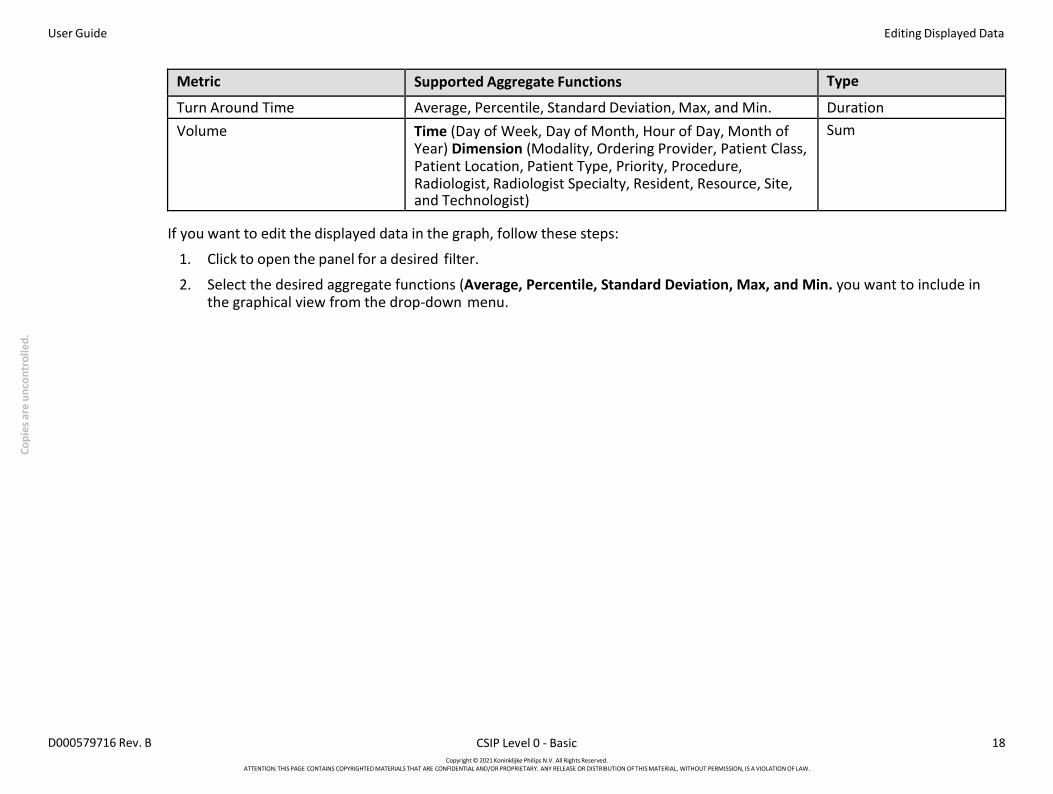
Metric Supported Aggregate Functions Type
Turn Around Time Average, Percentile, Standard Deviation, Max, and Min. Duration Volume Time (Day of Week, Day of Month, Hour of Day, Month of
If you want to edit the displayed data in the graph, follow these steps:
1. Click to open the panel for a desired filter.
2. Select the desired aggregate functions (Average, Percentile, Standard Deviation, Max, and Min. you want to include in the graphical view from the drop-down menu.
ATTENTION: THIS PAGE CONTAINS COPYRIGHTED MATERIALS THAT ARE CONFIDENTIAL AND/OR PROPRIETARY. ANY RELEASE OR DISTRIBUTION OF THIS MATERIAL, WITHOUT PERMISSION, IS A VIOLATION OF LAW.
ATTENTION: THIS PAGE CONTAINS COPYRIGHTED MATERIALS THAT ARE CONFIDENTIAL AND/OR PROPRIETARY. ANY RELEASE OR DISTRIBUTION OF THIS MATERIAL, WITHOUT PERMISSION, IS A VIOLATION OF LAW.
20
4.5.3 Builder 4.5.3.1 Builder Overview
The builder is where you create KPIs that can be saved to your dashboard and shared with others. Building a KPI has three stages:
1. Defining the Metric
2. Filtering the Data
3. Saving the KPI
It is important to note that the KPIs you build/execute/share will not calculate or include canceled exams; the exam must be performed.
ATTENTION: THIS PAGE CONTAINS COPYRIGHTED MATERIALS THAT ARE CONFIDENTIAL AND/OR PROPRIETARY. ANY RELEASE OR DISTRIBUTION OF THIS MATERIAL, WITHOUT PERMISSION, IS A VIOLATION OF LAW.
21
4.5.3.2 Defining the KPI To define the KPI, follow these steps:
1. Type a name for the KPI. If you do not name a KPI initially, a name is generated based on your other choices. This can be changed at any time.
2. Select a metric. Some metrics are based on a duration of time, such as ”turnaround time". These can aggregate as an average, percentile, standard deviation, min, or max.
3. Select a grouping (optional), which collects the metric values into different bins. This is useful for comparing a metric across a filter like site, specialty. etc.
4. Set a Grouped Result Limit (only when grouping). When using a grouping, this defines how many bins will be used for groupings before an ”other" bin will contain the remaining results to avoid cluttering the graph.
5. Select a graph type. You can select an area graph (default), a bar graph, a line graph, a multi-bar chart, or a pie chart.
6. Set upper and lower control limits (optional). Specify the expected lower and/or upper level for a metric. The expectation is that the metric should stay within the given limits. The control line(s) will be displayed on the graph.
7. Select a timestamp. The default is ”End Exam," but this control allows the user to choose which timestamp on the exam they would like to filter by. Please note that the timestamp selection affects the time component groupings.
8. Select a time unit by which to group the x-axis. The default is month, but year, week, day, and hour are also options.
9. Select a time range. By selecting a fixed time range, you’ll choose a time range fixed to static calendar dates (ex: Jan 2015-April 2015).
Figure 10: Quality Graph Controls
This KPI will never change from the date range. By selecting a relative time range, you will select a moving window time (ex: 5 months ago to 1 month ago).
ATTENTION: THIS PAGE CONTAINS COPYRIGHTED MATERIALS THAT ARE CONFIDENTIAL AND/OR PROPRIETARY. ANY RELEASE OR DISTRIBUTION OF THIS MATERIAL, WITHOUT PERMISSION, IS A VIOLATION OF LAW.
22
4.5.4 Filters 4.5.4.1 Editing Displayed Data in Filters
There are various filters available in the application that allow you to customize the data displayed in the tabular view.
Figure 11: Filter Example
If you want to edit the displayed data in the tabular view, follow these steps:
1. Click to open the panel for a desired filter.
2. Search for or select the data you want to include in the tabular view. If multiple data is available, you can also click Add All.
3. Use the inclusive/exclusive toggle button to show all data related to the selected filter, or all data that does not match the selected filter (see Inclusive and Exclusive Filter Mode).
4. To remove selected data in a filter, click the data in the list of already selected items or click Remove All.
ATTENTION: THIS PAGE CONTAINS COPYRIGHTED MATERIALS THAT ARE CONFIDENTIAL AND/OR PROPRIETARY. ANY RELEASE OR DISTRIBUTION OF THIS MATERIAL, WITHOUT PERMISSION, IS A VIOLATION OF LAW.
23
NOTE
The system uses a 24-hour clock, which cannot be changed.
4.5.4.2 Date/Time Filter The date/time filter is used to filter exams based upon the day of the week or time of day they were completed.
Figure 12: Date/Time Filter
To use the date/time filter, follow these steps:
1. Select the days of the week and the time range you would like the exam to fall between.
2. Click + to add the date/time filters.
4.5.4.3 Smart Filtering The default mode for filtering is called smart filtering, which is indicated by the green Smart toggle button in the Controls panel.
ATTENTION: THIS PAGE CONTAINS COPYRIGHTED MATERIALS THAT ARE CONFIDENTIAL AND/OR PROPRIETARY. ANY RELEASE OR DISTRIBUTION OF THIS MATERIAL, WITHOUT PERMISSION, IS A VIOLATION OF LAW.
24
This functionality allows filters to be selected only when there is data to support those filters and displays only the filter data that is available. After choosing a filter, it will further filter out filter options that do not have any data (as shown below):
Figure 14: Smart Filtering — Before (1) and After (2)
To disable smart filtering, click the green Smart toggle button. This changes the background color from green to red to indicate that smart filtering has been turned off.
ATTENTION: THIS PAGE CONTAINS COPYRIGHTED MATERIALS THAT ARE CONFIDENTIAL AND/OR PROPRIETARY. ANY RELEASE OR DISTRIBUTION OF THIS MATERIAL, WITHOUT PERMISSION, IS A VIOLATION OF LAW.
25
Figure 15: Smart Filtering Disabled
4.5.4.4 Inclusive and Exclusive Filter Mode By default, the filters are set to be included as indicated by the blue inclusive toggle. Clicking the exclusive toggle results in the exclusion of any exams with the specified modality with the specified filter selection. It also updates the Resources available to display those without the specified modality (see an example using the ‘CT’ modality below): Co
ATTENTION: THIS PAGE CONTAINS COPYRIGHTED MATERIALS THAT ARE CONFIDENTIAL AND/OR PROPRIETARY. ANY RELEASE OR DISTRIBUTION OF THIS MATERIAL, WITHOUT PERMISSION, IS A VIOLATION OF LAW.
26
Figure 16: Inclusive and Exclusive Filter Mode
4.5.5 Autopreview Toggle By default, each change to a filter or metric recalculates and redraws the results table and any open filters, which will be validated with smart filtering (if enabled). When making multiple changes quickly, these redraw/query waits can slow down advanced users. Because of this, there is an option to toggle off this functionality above the Control Interface.
The results of your filtered topic are displayed at the top in the Filter Summary. Configurable performance metrics for the filtered results are also included.
ATTENTION: THIS PAGE CONTAINS COPYRIGHTED MATERIALS THAT ARE CONFIDENTIAL AND/OR PROPRIETARY. ANY RELEASE OR DISTRIBUTION OF THIS MATERIAL, WITHOUT PERMISSION, IS A VIOLATION OF LAW.
27
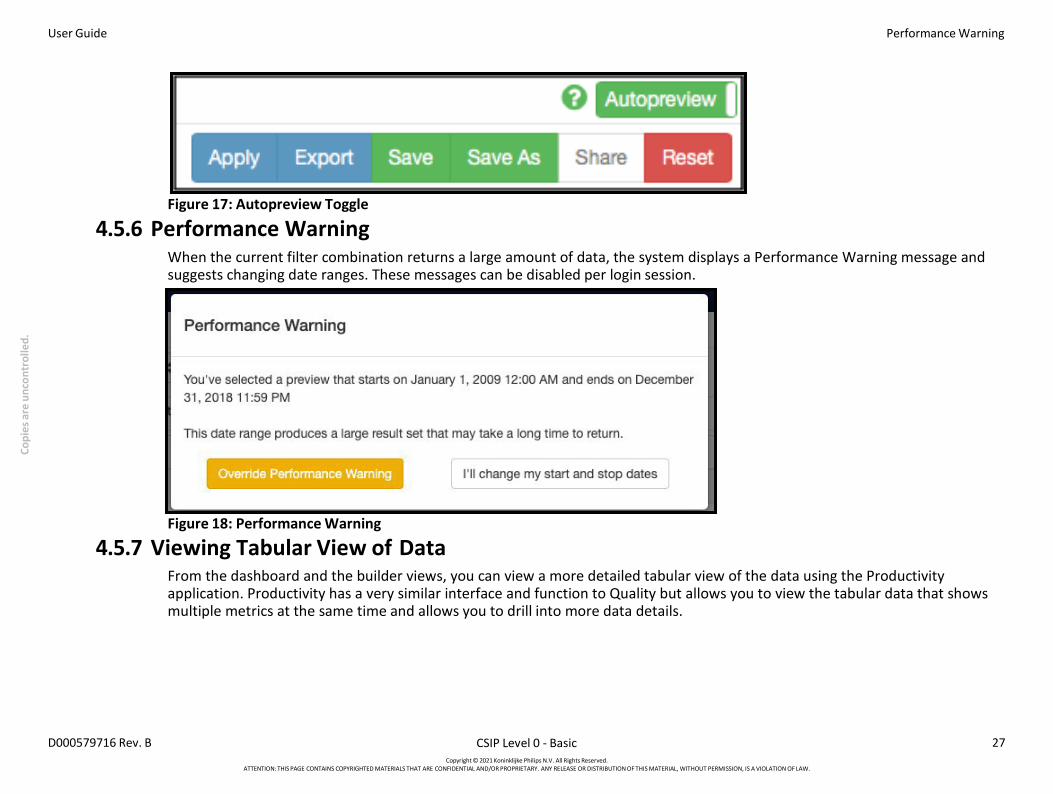
Figure 17: Autopreview Toggle
4.5.6 Performance Warning When the current filter combination returns a large amount of data, the system displays a Performance Warning message and suggests changing date ranges. These messages can be disabled per login session.
Figure 18: Performance Warning
4.5.7 Viewing Tabular View of Data From the dashboard and the builder views, you can view a more detailed tabular view of the data using the Productivity application. Productivity has a very similar interface and function to Quality but allows you to view the tabular data that shows multiple metrics at the same time and allows you to drill into more data details.
ATTENTION: THIS PAGE CONTAINS COPYRIGHTED MATERIALS THAT ARE CONFIDENTIAL AND/OR PROPRIETARY. ANY RELEASE OR DISTRIBUTION OF THIS MATERIAL, WITHOUT PERMISSION, IS A VIOLATION OF LAW.
ATTENTION: THIS PAGE CONTAINS COPYRIGHTED MATERIALS THAT ARE CONFIDENTIAL AND/OR PROPRIETARY. ANY RELEASE OR DISTRIBUTION OF THIS MATERIAL, WITHOUT PERMISSION, IS A VIOLATION OF LAW.
30
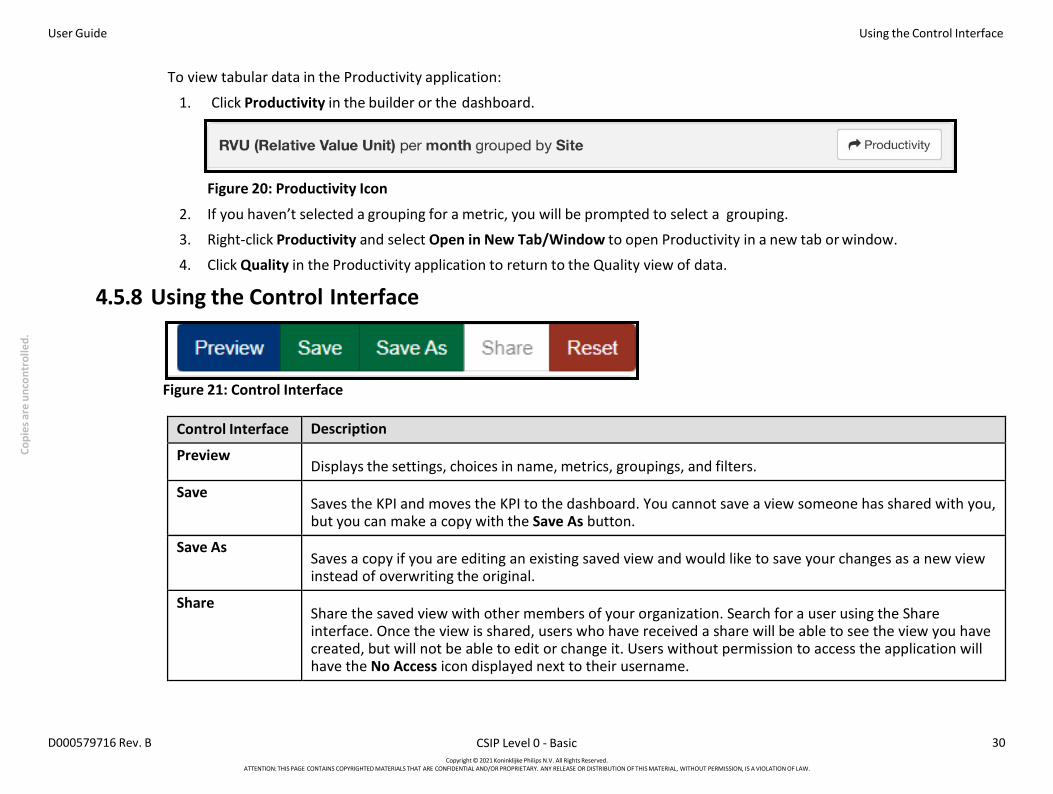
To view tabular data in the Productivity application:
1. Click Productivity in the builder or the dashboard.
Figure 20: Productivity Icon
2. If you haven’t selected a grouping for a metric, you will be prompted to select a grouping.
3. Right-click Productivity and select Open in New Tab/Window to open Productivity in a new tab or window.
4. Click Quality in the Productivity application to return to the Quality view of data.
4.5.8 Using the Control Interface
Figure 21: Control Interface
Control Interface Description
Preview Displays the settings, choices in name, metrics, groupings, and filters.
Save Saves the KPI and moves the KPI to the dashboard. You cannot save a view someone has shared with you, but you can make a copy with the Save As button.
Save As Saves a copy if you are editing an existing saved view and would like to save your changes as a new view instead of overwriting the original.
Share Share the saved view with other members of your organization. Search for a user using the Share interface. Once the view is shared, users who have received a share will be able to see the view you have created, but will not be able to edit or change it. Users without permission to access the application will have the No Access icon displayed next to their username.
ATTENTION: THIS PAGE CONTAINS COPYRIGHTED MATERIALS THAT ARE CONFIDENTIAL AND/OR PROPRIETARY. ANY RELEASE OR DISTRIBUTION OF THIS MATERIAL, WITHOUT PERMISSION, IS A VIOLATION OF LAW.
31
Reset Removes all choices in name, metric, groupings, and filters without saving (helpful if you want a clean start when building a new view). By default, the builder will retain the settings previously used unless you reset.
ATTENTION: THIS PAGE CONTAINS COPYRIGHTED MATERIALS THAT ARE CONFIDENTIAL AND/OR PROPRIETARY. ANY RELEASE OR DISTRIBUTION OF THIS MATERIAL, WITHOUT PERMISSION, IS A VIOLATION OF LAW.
32
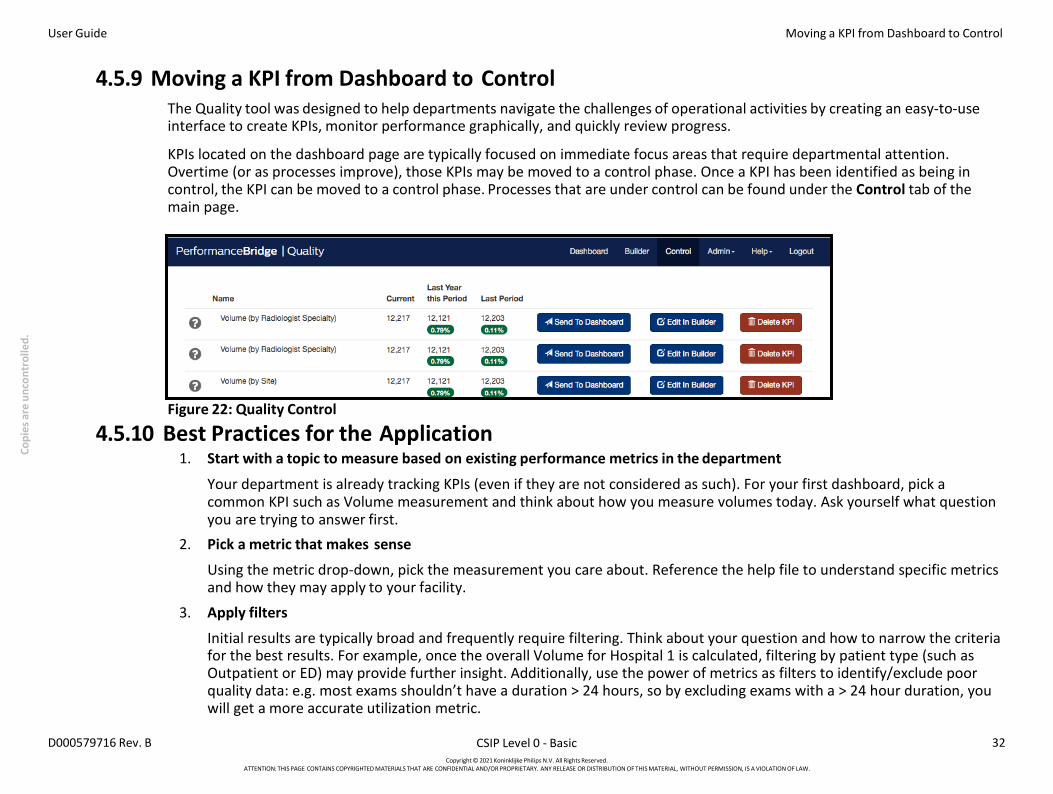
4.5.9 Moving a KPI from Dashboard to Control The Quality tool was designed to help departments navigate the challenges of operational activities by creating an easy-to-use interface to create KPIs, monitor performance graphically, and quickly review progress.
KPIs located on the dashboard page are typically focused on immediate focus areas that require departmental attention. Overtime (or as processes improve), those KPIs may be moved to a control phase. Once a KPI has been identified as being in control, the KPI can be moved to a control phase. Processes that are under control can be found under the Control tab of the main page.
Figure 22: Quality Control
4.5.10 Best Practices for the Application 1. Start with a topic to measure based on existing performance metrics in the department
Your department is already tracking KPIs (even if they are not considered as such). For your first dashboard, pick a common KPI such as Volume measurement and think about how you measure volumes today. Ask yourself what question you are trying to answer first.
2. Pick a metric that makes sense
Using the metric drop-down, pick the measurement you care about. Reference the help file to understand specific metrics and how they may apply to your facility.
3. Apply filters
Initial results are typically broad and frequently require filtering. Think about your question and how to narrow the criteria for the best results. For example, once the overall Volume for Hospital 1 is calculated, filtering by patient type (such as Outpatient or ED) may provide further insight. Additionally, use the power of metrics as filters to identify/exclude poor quality data: e.g. most exams shouldn’t have a duration > 24 hours, so by excluding exams with a > 24 hour duration, you will get a more accurate utilization metric.
ATTENTION: THIS PAGE CONTAINS COPYRIGHTED MATERIALS THAT ARE CONFIDENTIAL AND/OR PROPRIETARY. ANY RELEASE OR DISTRIBUTION OF THIS MATERIAL, WITHOUT PERMISSION, IS A VIOLATION OF LAW.
33
4. Focus and share KPIs designed for a specific role
Think of the audience for each dashboard created. Some dashboards are useful for operational teams (Patient Wait) or scheduling teams (Patient Access/Appointment wait). Other KPIs are useful for understanding productivity (Volume filtered by Technologist). Share KPIs directly with operational leaders to help them stay in regular touch with Quality improvement goals.
4.5.11 Data Analysis 4.5.11.1 Understanding Percentiles
For some metrics in the Quality and Productivity applications, users will be presented with an additional menu to provide options for further analysis, including Average and Percentile values. Application users can fine-tune their KPI monitors by using Percentile or Average to help qualify results.
Figure 23: Menu Options in Quality and Productivity
4.5.11.2 Percentile Analysis Percentile analysis is a statistical method used in the PerformanceBridge Quality and Productivity applications to help users understand where any result falls within a range of potential results in the dataset. For example, the 90th percentile of any metric (such as turn-around time) displays the value for which 90% of the data results are contained. Measuring performance metrics in this way can be very useful, as they provide insight into what is happening within the percentile that’s been selected. From the example, above, the 90th percentile calculation tells you what turn-around time is 90% of the time.
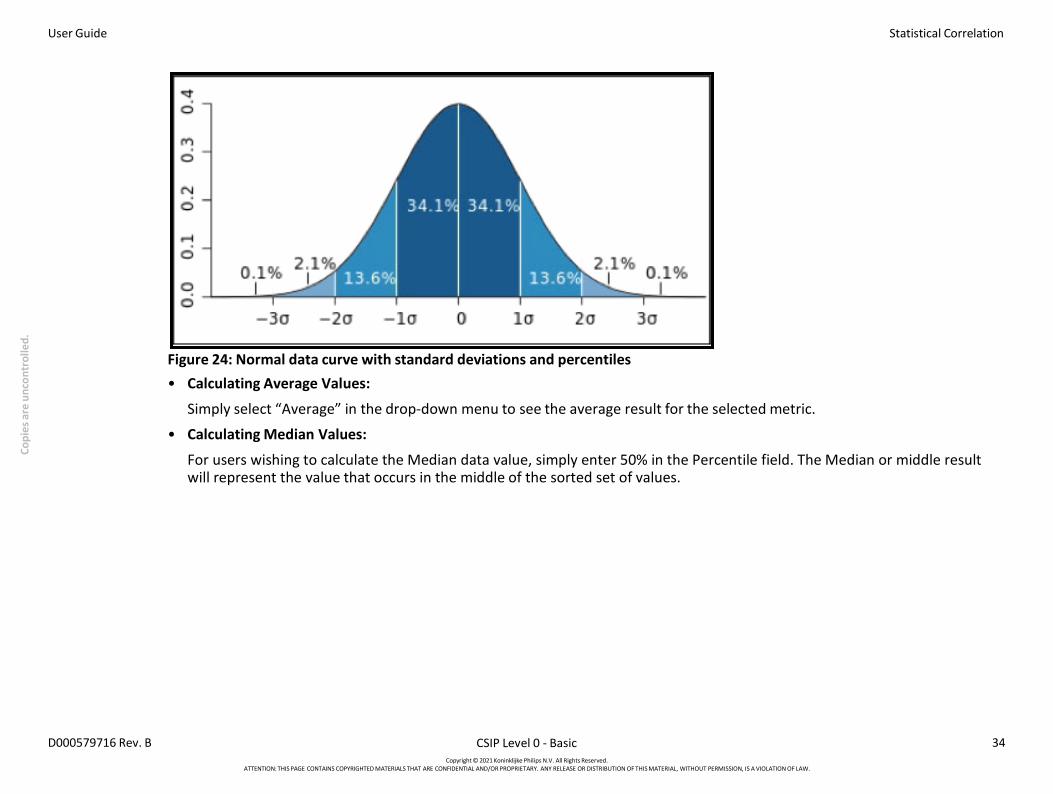
4.5.11.3 Statistical Correlation In general, percentiles can represent an area under a normal data curve, with values increasing from left to right. When considered this way, each fixed percentile can be represented as a standard deviation
ATTENTION: THIS PAGE CONTAINS COPYRIGHTED MATERIALS THAT ARE CONFIDENTIAL AND/OR PROPRIETARY. ANY RELEASE OR DISTRIBUTION OF THIS MATERIAL, WITHOUT PERMISSION, IS A VIOLATION OF LAW.
34
Figure 24: Normal data curve with standard deviations and percentiles • Calculating Average Values:
Simply select “Average” in the drop-down menu to see the average result for the selected metric.
• Calculating Median Values:
For users wishing to calculate the Median data value, simply enter 50% in the Percentile field. The Median or middle result will represent the value that occurs in the middle of the sorted set of values.
Copi
es a
re u
ncon
trol
led.
2021 Koninklijke Philips N.V.
All rights reserved. Reproduction or transmission in whole or in part, in any form or by any means, electronic, mechanical or otherwise, is prohibited without the prior written consent of the copyright owner.
www.philips.com/healthcare
PS0000572154 Revision A * June 2021 CSIP Level 0 - Basic