Performances of quantum cascade detectors Alexandre Delga a , Laetitia Doyennette a , Vincent Berger a , Mathieu Carras b,⇑ , Virginie Trinité b , Alexandru Nedelcu b a Univ Paris Diderot, Sorbonne Paris Cité, Laboratoire Matériaux et Phénomènes Quantiques, CNRS-UMR 7162, 10 rue Alice Domon et Léonie Duquet, 75205 Paris Cedex 13, France b Alcatel Thales III–V Lab, Campus Polytechnique, 1, Avenue Augustin Fresnel, 91767 Palaiseau, France article info Article history: Available online 28 December 2012 Keywords: Infrared photodetectors Noise Quantum cascade detectors abstract In this paper, we present an idealised model of quantum cascade detectors that calculates the highest performances reachable with actual technology. It is based on an ideal vision of the electronic behavior of the transport and a Fabry–Pérot approach for the light-coupling scheme. This simple but complete pic- ture of the device is a proficient tool to understand the detectors physics. In particular, the variation of the performances with regards to different parameters is carefully discussed and guidelines for the detector design are sketched out. This approach gives also some insight into the potentiality of quantum cascade detector technology. Ó 2013 Published by Elsevier B.V. 1. Introduction Intersubband detectors are known to be very interesting for infrared detection thanks to their high-speed operation and their design flexibility. Quantum Well Infrared Photodetectors (QWIPs) have grown on the market of infrared imaging thanks to their spe- cific advantages (uniformity, stability, cost) that allow them to compete with established technology such as HgCdTe focal plane arrays (FPAs) especially in the long wavelength infrared range (LWIR) [1]. The drawbacks of these photoconductive detectors are the low quantum efficiency, the dark current and noise that limit the operating temperature and the integration time. Quan- tum cascade detectors (QCDs) have been proposed several years ago as a photovoltaic alternative to QWIPs [2]. They present lower gain and lower noise than QWIPs, resulting in similar detectivities. Their ability to work with no dark current that saturates the read- out capacitor, enables longer integration times and higher operat- ing temperatures. QCDs have been successfully reported in differ- ent materials and can address the whole infrared spectrum from short to very long wavelength infrared range [3–7]. For expertise in infrared detection and focal plane arrays, a model of an ideal detector is a very useful tool to assess the poten- tiality of a technology, predict the maximum performances achiev- able by the devices and to highlight its limitations. It will help ruling on the technology’s relevance when prospecting for a given application. Furthermore, it draws out some general trends for the design rules of a good detector and helps to single out the critical points to work on for the improvement of the overall perfor- mances. The complexity of QWIP physics has prevented the deriva- tion of such a model until now, but models exist for HgCdTe or SLS (Type II superlattices structures) technologies [8,9]. This lack of ideal vision has placed QWIP technology in a worse position than other detector technologies as it can only presents actual perfor- mances but fails to predict its progression margins. In this paper, we will introduce a model of an ideal QCD with two objectives: to assess the highest performances reachable by QCDs and to give some insight into the design of the active struc- ture. All the performances up to the Noise Equivalent Temperature Difference (NETD) of the complete system can be calculated simply out of the user inputs: material, structure, scene and read-out inte- grated circuit (ROIC). The model relies on an ideal vision of the electronic behavior and a more realistic picture of the optical cou- pling scheme based on a Fabry–Pérot approach. The policy is to keep things as simple as possible, as long as all phenomena are properly taken into account and have few adjustable parameters. By comparing the model with experiments, we show the progress margins of this technology. This paper is organized as follow. Section 2 is dedicated to pres- ent the model of an ideal QCD. In Section 3, some guidelines are gi- ven for QCD design and in Section 4, specific applications are addressed and the potentiality of the QCD technology is discussed. 2. Model description In this part, we sketch out the main physical pictures that en- able the calculation of the performances. The whole infrared imag- ing system can be divided in different parts: the active structure where the photon to electron conversion occurs, the ROIC, the op- tics and the scene. The computation tool calculates all the figures 1350-4495/$ - see front matter Ó 2013 Published by Elsevier B.V. http://dx.doi.org/10.1016/j.infrared.2012.12.022 ⇑ Corresponding author. E-mail address: [email protected](M. Carras). Infrared Physics & Technology 59 (2013) 100–107 Contents lists available at SciVerse ScienceDirect Infrared Physics & Technology journal homepage: www.elsevier.com/locate/infrared
Transcript
Infrared Physics & Technology 59 (2013) 100–107
Contents lists available at SciVerse ScienceDirect
Alexandre Delga a, Laetitia Doyennette a, Vincent Berger a, Mathieu Carras b,⇑, Virginie Trinité b,Alexandru Nedelcu b
a Univ Paris Diderot, Sorbonne Paris Cité, Laboratoire Matériaux et Phénomènes Quantiques, CNRS-UMR 7162, 10 rue Alice Domon et Léonie Duquet, 75205 Paris Cedex 13, Franceb Alcatel Thales III–V Lab, Campus Polytechnique, 1, Avenue Augustin Fresnel, 91767 Palaiseau, France
In this paper, we present an idealised model of quantum cascade detectors that calculates the highestperformances reachable with actual technology. It is based on an ideal vision of the electronic behaviorof the transport and a Fabry–Pérot approach for the light-coupling scheme. This simple but complete pic-ture of the device is a proficient tool to understand the detectors physics. In particular, the variation of theperformances with regards to different parameters is carefully discussed and guidelines for the detectordesign are sketched out. This approach gives also some insight into the potentiality of quantum cascadedetector technology.
� 2013 Published by Elsevier B.V.
1. Introduction
Intersubband detectors are known to be very interesting forinfrared detection thanks to their high-speed operation and theirdesign flexibility. Quantum Well Infrared Photodetectors (QWIPs)have grown on the market of infrared imaging thanks to their spe-cific advantages (uniformity, stability, cost) that allow them tocompete with established technology such as HgCdTe focal planearrays (FPAs) especially in the long wavelength infrared range(LWIR) [1]. The drawbacks of these photoconductive detectorsare the low quantum efficiency, the dark current and noise thatlimit the operating temperature and the integration time. Quan-tum cascade detectors (QCDs) have been proposed several yearsago as a photovoltaic alternative to QWIPs [2]. They present lowergain and lower noise than QWIPs, resulting in similar detectivities.Their ability to work with no dark current that saturates the read-out capacitor, enables longer integration times and higher operat-ing temperatures. QCDs have been successfully reported in differ-ent materials and can address the whole infrared spectrum fromshort to very long wavelength infrared range [3–7].
For expertise in infrared detection and focal plane arrays, amodel of an ideal detector is a very useful tool to assess the poten-tiality of a technology, predict the maximum performances achiev-able by the devices and to highlight its limitations. It will helpruling on the technology’s relevance when prospecting for a givenapplication. Furthermore, it draws out some general trends for thedesign rules of a good detector and helps to single out the criticalpoints to work on for the improvement of the overall perfor-
mances. The complexity of QWIP physics has prevented the deriva-tion of such a model until now, but models exist for HgCdTe or SLS(Type II superlattices structures) technologies [8,9]. This lack ofideal vision has placed QWIP technology in a worse position thanother detector technologies as it can only presents actual perfor-mances but fails to predict its progression margins.
In this paper, we will introduce a model of an ideal QCD withtwo objectives: to assess the highest performances reachable byQCDs and to give some insight into the design of the active struc-ture. All the performances up to the Noise Equivalent TemperatureDifference (NETD) of the complete system can be calculated simplyout of the user inputs: material, structure, scene and read-out inte-grated circuit (ROIC). The model relies on an ideal vision of theelectronic behavior and a more realistic picture of the optical cou-pling scheme based on a Fabry–Pérot approach. The policy is tokeep things as simple as possible, as long as all phenomena areproperly taken into account and have few adjustable parameters.By comparing the model with experiments, we show the progressmargins of this technology.
This paper is organized as follow. Section 2 is dedicated to pres-ent the model of an ideal QCD. In Section 3, some guidelines are gi-ven for QCD design and in Section 4, specific applications areaddressed and the potentiality of the QCD technology is discussed.
2. Model description
In this part, we sketch out the main physical pictures that en-able the calculation of the performances. The whole infrared imag-ing system can be divided in different parts: the active structurewhere the photon to electron conversion occurs, the ROIC, the op-tics and the scene. The computation tool calculates all the figures
A. Delga et al. / Infrared Physics & Technology 59 (2013) 100–107 101
of merit associated to the infrared imager. A careful treatment isdevoted to the modeling of the active structure, since for the otherelements (ROIC, scene, optics, etc.), we include standard computa-tions in the program. The active region of a QCD consists in amultilayer structure surmounted by a metal grating responsiblefor the optical coupling. In the following part, we will presentthe idealized vision of electronic transport in the multilayerstructure and use a Fabry–Pérot picture to model the grating. Wewill detail how dark and optical currents are calculated, focusingon the quantum efficiency. Throughout this section, a lot ofparameters will be introduced. For an easy reading the main onesare presented in the text, the others are presented in the table ofAppendix A.
2.1. Electronic behavior
Fig. 1a shows the energy band profile and electronic levels ofone period of a QCD. This structure operates at 8.5 lm. It consistsof a Si-doped optically active quantum well (QW) whereelectrons in the fundamental level down (1A) are scattered tothe level up (7B) by photon absorption. The photoelectrons arethen extracted by resonant processes or LO phonon emissionthrough a quantum cascade (levels 7B–2B) and reach the funda-mental level 1B of the next period. Thanks to the effectiveness ofthe transport into the cascade, it is considered as thermalised[10,11]. A QCD structure can be robustly compared to a simpleSchottky diode where the down populated level is equivalent tothe reservoir of carriers, and the thermalised cascade is assimi-lated to the semiconductor depletion zone [11,13]. However inthis kind of structure, undesirable diagonal transitions betweenlevel 1A and the levels jB of the adjacent cascade can occurresulting in dark current leakages, as it has been experimentallydemonstrated in Refs. [12,13].
The electronic transport can be ideally modeled as shownFig. 1b, since it only occurs between confined states. The optical ac-tive well is supposed infinite; its thickness defines the energy dif-ference between levels up and down and the peak detectionwavelength k0. Photoelectrons in the up level are extracted to theadjacent cascade with an escape probability pe. In ideal cases,pe = 1. The cascade is considered perfectly thermalised and no diag-onal transition (leakage current) is possible from and to level down.The dark current follows the same path of the optical current. Thecurrent from up to down, Jup-down, is limited by LO phonon emissionand varies exponentially with bias. The population in the excitedstate up is described by a Maxwell–Boltzmann statistic. The cur-rent from down to up levels, Jdown-up, is considered constant andequal to the value of Jup-down at zero bias. Once the responsivity isknown, the photo-current Jphoto can be calculated as in Ref. [14].The noise spectral density is given taking a Poissonian contributionof all the currents [15,16]:
Fig. 1. (a) Band structure and wavefunctions of a QCD operating at 8.5 lm. One period is ccascade (6B–2B). (b) Picture of an ideal QCD with one infinite QW and no leakage curreprobability pe to the cascade is 1.
NSD ¼ 2ejJup�downj þ jJdown�upj þ jJphotoj
Np
Np is the number of periods of the structure and e is the electroniccharge.
2.2. Optical coupling scheme
In standard staring array geometry, incoming light under nor-mal incidence cannot be absorbed by QWs due to the selection rulefor intersubband absorption. A specific coupling scheme must beused to inject the light from the incident mode to cavity modesthat have a polarization in the z direction (growth direction). Themost common method is a metalized diffraction grating as shownin Fig. 2a [17]. The grating has the same periodicity as the wave-length in the material, k0/n, and couples the light to surface plas-mon polariton (SPP) modes that are present at the metal–dielectric interface, and travel parallel to the interface as illustratedin Fig. 2a. The SPP modes are injected by the surface currents ateach kink of the grating, so every k0/n in the x direction. Their spa-tial extension in the growth direction is given by Ez(z) = E0 exp(�z/-z0), where the distance z0 is the decay length of the plasmon. Thisquantity is considered homothetic with the wavelength z0 = neff(-q)�k0, the effective index neff(q) depends on the absorption intro-duced by the doping q.
This situation is formally equivalent to a Fabry–Pérot cavity,with a perfect backside mirror b and a front side mirror f as illus-trated Fig. 2b. Its Fresnel coefficients satisfy the energy conserva-tion condition: r2 + t2 = R + T = 1. The mirror f couples the incidentlight Ei to the cavity mode Ez(z) which plays the role of the SPPmode. After a reflection on the mirror f, the stationary conditionof the cavity field is
Epþ10 ¼ tEi þ r e�
12ðaLþbLÞ
k0n
� �ei2pn
kk0n Ep
0
� �:
We note a ¼ e�12ðaLþbLÞ
k0n the attenuation of the cavity field between
two reflections due to the linear absorption aL in QWs and the oh-mic losses bL in the metal. The dephasing term / ¼ 2p k0
k leads to thespectral acceptance of the cavity. Indeed, switching from wave-length k to pulsation x representation and expanding / aroundthe peak detection energy, we find that the amplification of the fieldin the cavity has the expected Lorentzian shape:
jE0j2
jEij2¼ t2
4p2rax2
0Dx2 þ x2
04p2
1raþ ra� 2� �� �
The amplification of the field in the cavity appears in the quan-tum efficiency g, defined as the ratio between the number of pho-ton absorbed by the active structure and the number of incidentphotons. It is equal to the energy absorption rate into the QWs di-vided by the incident flux for a surface unit Sx,y
omposed of eight QWs: the optically active one (1A–7B transition) and the quantumnt between the down level and the quantum cascade. In ideal cases, the extraction
Fig. 2. (a) Sketch of the optical injection of the light into the active region with QWs. On top of the structure, there is a metal diffraction grating. Ei is the incident field injectedin the growth direction and Ez is the electric field into the cavity. (b) Fabry–Pérot model of the light injection. The cavity is formed by two mirrors f(r, t) and b(1,0). The mirrorb is perfect and for the mirror f, r and t are the field reflection and transmission coefficients. L is the length of the cavity, a and b are the QW absorption and metal losses of thecavity.
102 A. Delga et al. / Infrared Physics & Technology 59 (2013) 100–107
g ¼R1
z¼012 ejEzj2dzaSxy
12 ejEij2 c
n Sxy
¼ z0na2cjE0j2
jEij2
With c the light velocity, n the optical index and e the permittiv-ity of the medium. The energy absorption rate a in the QWs is cal-culated with Fermi’s golden rule once the field extension in thecavity is known:
a ¼ 256he2
27p2ez0m�xx0
DEintra
DE2intra þ h2ðx0 �xÞ2
qeð�2Lc=z0Þ 1� eð�2NpLp=z0Þ
1� eð�2Lp=z0Þ
DEintra is the transition broadening due to intrasubband scattering,Lp (resp. Lc) the thickness of the period (resp. the top contact), andNp the number of periods. At last, the responsivity is given by:
RðkÞ ¼ epe
hxg
Np
Once the currents, noise spectral density and responsivity areknown, the other figure of merits (from detectivity to NETD) arecalculated using formulations in Ref. [14].
2.3. Numerical validation of the model
The parameters introduced above, and reported in Table A1, canbe divided in two types. The nominal parameters, such as the num-ber of periods Np or the doping amount q, can be freely chosen forthe design of the structure. The physical parameters, such as thefront side mirror Fresnel coefficient (r, t, R, T) or the intrasubbandbroadening DEintra, are calculated with more sophisticated models,see Appendix B for more details.
This model has been validated on experimental data from dif-ferent GaAs/AlGaAs QCD structures operating at 8.5 and 14.3 lm.Switching to other materials such as InGaAs/AlInAs is possible,provided that some parameters are adapted (effective mass, refrac-tive index, LO phonon energy, etc.).
Fig. 3a shows the comparison between experimental and calcu-lated responsivities for a QCD at 14.3 lm. A good agreement be-tween theory and experiment is obtained for a transmissionmirror equal to T = 0.3, ohmic losses with b = 3.71 � 1012 s�1, intra-subband broadening DEintra = 8 meV and an extraction probabilityof pe = 0.7. Let us notice that the extraction probability is not equalto 1 since the design of the structure is not perfect for the electronextraction [7]. Fig. 3b shows the comparison between theoreticaland experimental detectivities. It is indeed symptomatic of themain assumptions made in this model. Below the BLIP (backgroundlimited infrared performances) temperature, the agreement be-tween ideal model and experiment is quantitative. The experimen-tal detectivity starts to drop at lower temperature because
diagonal transitions with lower activation energies rule the darkcurrent, contrary to the ideal approach.
To conclude, this model of ideal QCD is quite simple but its out-put are in good agreement with experiment and it allows adescription of the QCD physics in a robust and trustworthy way.
3. Guidelines for QCD design: example of 8.5 lm imagery
Thanks to this model and computation tool, we are able to eval-uate the performances of a QCD and also to predict its behavior asfunction of the different parameters mentioned in Table A1. Amongall these parameters, some are imposed by the application (peakwavelength, temperature, optical flux), and others by the materialand device technology (Lp,Lc,DEintra). The main parameters thatgive a degree of freedom to optimize a QCD structure are the dop-ing q and the number of periods Np. These parameters influencethe performance of the device mainly through their impact onthe absorption rate a as well as the NSD.
In this section, we will, at first, focus on the quantum efficiencyand detectivity behavior for a QCD operating at 8.5 lm and 85 K.Then we will make a step forward to the complete imaging systemby investigating the integration time and NETD.
3.1. Quantum efficiency and detectivity
Fig. 4 shows the quantum efficiency (QE) as a function of thenumber of periods Np and the doping q, for a QCD with a peakdetection at k0 = 8.5 lm. These curves were calculated for anextraction probability pe of 1, that is the ideal case for the elec-tronic transport in a QCD. All the other parameters used in thecomputation are indicated in Table A1.
In a cavity configuration mediated by a diffraction grating, thereis an optimal regime for the coupling efficiency and the cavityabsorption. If the absorption is too small the incident light leavesthe cavity without being absorbed. This is the over-coupled regimewhere the QE increases with the absorption in the QWs. For toohigh absorption, the field is harder to couple in and no field ampli-fication occurs in the cavity. In this under-coupled regime, the QEsaturates. This behavior is shown in Fig. 4a where the QE increaseswith the doping and then saturates at a maximum value at higherdoping. Let us notice that this maximum value is not equal to 1 asit should be in perfect devices. Indeed, in this model, the opticalcoupling scheme is based on actual devices and not on an idealoptical injection.
With regards to the QE, the number of periods plays a similarrole as the doping. Np increases the overlap between the SPP fieldand the active structure and thus enhances the absorption. For a
Fig. 3. (a) Calculated and experimental responsivities of a QCD operating at 14.3 lm and at 25 K. The escape probability is chosen at 0.7 to be as close as possible to theexperimental responsivity value 82 mA/W. (b) Experimental and theoretical detectivities for different temperatures.
Fig. 4. Quantum efficiency as a function of the doping (a) and different numbers of periods (b).
Fig. 5. Detectivity as a function of the doping and for different numbers of periods.
A. Delga et al. / Infrared Physics & Technology 59 (2013) 100–107 103
too large number of periods, the under-coupled regime is reachedand the QE saturates as illustrated in Fig. 4b.
The optimal coupling regime can be reached for different con-figurations of doping and number of periods. However, furtherincreasing these parameters will not improve the QE while beingdetrimental to other figures of merit. In particular, the responsivitygoes with 1/Np, and the dark noise is proportional to the squareroot of the doping
ffiffiffiffiqp . In the end, the parameter to compare dif-ferent infrared photodetectors is the detectivity D⁄, which is the ra-tio between the spectral responsivity and the square root of thenoise spectral density (NSD): D�1 RðkÞffiffiffiffiffiffi
NSDp .
Fig. 5 shows the detectivity of the QCD as a function of the dop-ing and the number of periods.
For a fixed number of periods, in the under-coupled regime, theincrease of the QE with doping dominates in the detectivity. In theover-coupled regime, the QE is saturated and the detectivity de-creases as the NSD increases with doping. The maximum detectiv-ity is reached at a trade off value which is in this case,q = 4 � 1011 cm�2, for Np = 10 periods. Note that the QE has notreached its maximum value yet (see Fig. 4a).
Fig. 7 shows the detectivity for different temperatures. The BLIPtemperature is 75 K. Below this value, the NSD is limited by thephoton noise and is independent of temperature. The detectivity
drop at higher temperatures is caused by an exponential increaseof the dark noise.
104 A. Delga et al. / Infrared Physics & Technology 59 (2013) 100–107
In Ref. [18], Hofstetter et al. have performed the same kind ofanalysis on the variation of the detectivity for QCDs. Their ap-proach is based on the classical formula of responsivity and noiseused for QWIPs to give an insight of the detectivity behavior as afunction of the doping and the number of periods [14]. The maindifference with our model is that they consider a 45� injection in-stead of a diffraction grating. They show a similar variation of thedetectivity with regard to the doping and number of periods. Butthe trade off point giving the maximal detectivity is reached withmuch higher doping and number of periods because of the differ-ent light-coupling scheme. The Fabry–Pérot model introduced heregives more realistic optimal configurations.
3.2. Integration time and NETD
For infrared imaging, the detectivity D⁄ is not anymore the keyparameter to compare different photodetectors. It is rather thenoise equivalent temperature difference (NETD). This figure ofmerit includes not only the characteristics of the device but alsothe ones from the ROIC and the scene. We have computed theNETD for different ROICs and scenes and once again, the aim isto establish the parameters (doping and number of period) thatwill give the best NETD for a given ROIC or scene. The details to cal-culate the NETD are given in Ref. [14]. It is important to have inmind that the parameters giving the best detectivity for a detectorat a given operating wavelength and temperature would not benecessary the same for the best NETD. Indeed, the NETD is linkedto the scene conditions and the ROIC characteristics and not onlyto the intrinsic performances of the device. In this section, we willfocus on the integration time and the NETD.
The integration time is the time during which the signal is ac-quired by the detector. Since the signal-to-noise ratio is propor-tional to
ffiffiffiffiffiffiffisintp
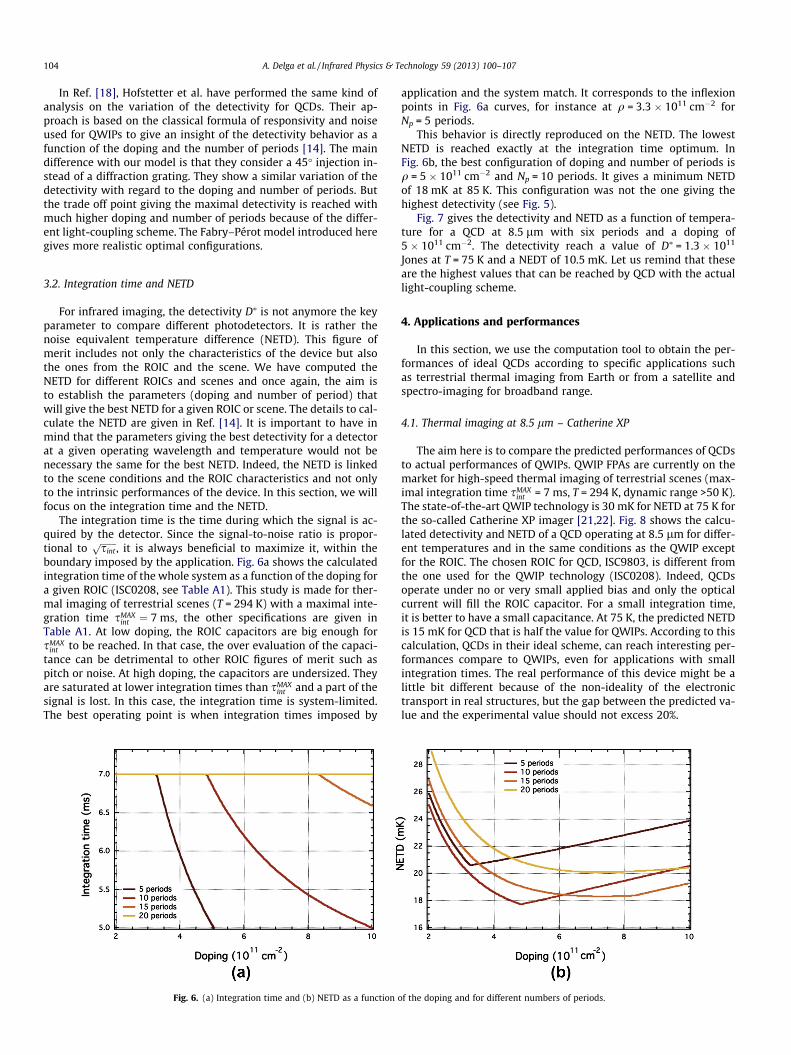
, it is always beneficial to maximize it, within theboundary imposed by the application. Fig. 6a shows the calculatedintegration time of the whole system as a function of the doping fora given ROIC (ISC0208, see Table A1). This study is made for ther-mal imaging of terrestrial scenes (T = 294 K) with a maximal inte-gration time sMAX
int ¼ 7 ms, the other specifications are given inTable A1. At low doping, the ROIC capacitors are big enough forsMAX
int to be reached. In that case, the over evaluation of the capaci-tance can be detrimental to other ROIC figures of merit such aspitch or noise. At high doping, the capacitors are undersized. Theyare saturated at lower integration times than sMAX
int and a part of thesignal is lost. In this case, the integration time is system-limited.The best operating point is when integration times imposed by
Fig. 6. (a) Integration time and (b) NETD as a function
application and the system match. It corresponds to the inflexionpoints in Fig. 6a curves, for instance at q = 3.3 � 1011 cm�2 forNp = 5 periods.
This behavior is directly reproduced on the NETD. The lowestNETD is reached exactly at the integration time optimum. InFig. 6b, the best configuration of doping and number of periods isq = 5 � 1011 cm�2 and Np = 10 periods. It gives a minimum NETDof 18 mK at 85 K. This configuration was not the one giving thehighest detectivity (see Fig. 5).
Fig. 7 gives the detectivity and NETD as a function of tempera-ture for a QCD at 8.5 lm with six periods and a doping of5 � 1011 cm�2. The detectivity reach a value of D⁄ = 1.3 � 1011
Jones at T = 75 K and a NEDT of 10.5 mK. Let us remind that theseare the highest values that can be reached by QCD with the actuallight-coupling scheme.
4. Applications and performances
In this section, we use the computation tool to obtain the per-formances of ideal QCDs according to specific applications suchas terrestrial thermal imaging from Earth or from a satellite andspectro-imaging for broadband range.
4.1. Thermal imaging at 8.5 lm – Catherine XP
The aim here is to compare the predicted performances of QCDsto actual performances of QWIPs. QWIP FPAs are currently on themarket for high-speed thermal imaging of terrestrial scenes (max-imal integration time sMAX
int = 7 ms, T = 294 K, dynamic range >50 K).The state-of-the-art QWIP technology is 30 mK for NETD at 75 K forthe so-called Catherine XP imager [21,22]. Fig. 8 shows the calcu-lated detectivity and NETD of a QCD operating at 8.5 lm for differ-ent temperatures and in the same conditions as the QWIP exceptfor the ROIC. The chosen ROIC for QCD, ISC9803, is different fromthe one used for the QWIP technology (ISC0208). Indeed, QCDsoperate under no or very small applied bias and only the opticalcurrent will fill the ROIC capacitor. For a small integration time,it is better to have a small capacitance. At 75 K, the predicted NETDis 15 mK for QCD that is half the value for QWIPs. According to thiscalculation, QCDs in their ideal scheme, can reach interesting per-formances compare to QWIPs, even for applications with smallintegration times. The real performance of this device might be alittle bit different because of the non-ideality of the electronictransport in real structures, but the gap between the predicted va-lue and the experimental value should not excess 20%.
of the doping and for different numbers of periods.
Fig. 7. Detectivity and NETD as a function of temperature for Np = 6 periodsstructure and a doping q = 5 � 1011 cm�2.
Fig. 9. Signal-to-noise ration for QCD operating at 12 and 14 lm for differenttemperatures. The number of periods of the structure is Np = 10 periods and thedoping q = 2 � 1011 cm�2.
A. Delga et al. / Infrared Physics & Technology 59 (2013) 100–107 105
4.2. Spectro-imaging (11–15 lm) – ESA project
Here, we give another example of the prediction power of thismodel by tackling the broadband (11–15 lm) spectro-imagingwith dispersive spectrometers. This is a space application fromthe European Space Agency (ESA). Further details on the contextof this project are given in Ref. [19,20]. We chose the dual pixelscheme described in Ref. [19], and not a broadband active layer.The main figure of merit is the signal-to-noise ratio (SNR) ofthe total system that must be superior to 700 at 50 K. Thanksto our model, we are able to calculate the SNR of a QCD operatingat 12 and 14 lm as a function of the temperature. The calculatedresults are reported in Fig. 9. Let us remind that these calculatedresults are the maximum values that can be reached for a QCDwith a diffraction grating since this is an ideal model. In Fig. 9,we see that the QCD at 14 lm does not reach the targeted goalof 700 at 50 K and the one at 12 lm is twice as high. Our predic-tion tool highlights that it may be not worth developing QCDs forthis specific application since QCD at 14 lm will never reachedthe asked goal.
Fig. 10. Calculated detectivity and NETD as a function of the temperature for QCDat 12 lm with a doping of q = 2.5 � 1011 cm�2 and Np = 10 periods.
4.3. Thermal infrared sensor (TIRS) – LandSat program
The thermal infrared sensor is an application addressed byNASA. The TIRS instrument is an infrared imager operating with
Fig. 8. Calculated detectivity and NETD as a function of the temperature for a QCDat 8.5 lm with a doping of q = 6.1011 cm�2 and Np = 10 periods.
two IR channels: 10.8 lm and 12 lm, dedicated to the geo-loca-tion of thermal image data. Further details are given in Ref.[23,24]. The FPA temperature has to be higher than 40 K andthe maximum NEDT is 200 mK. This kind of application is cur-rently targeted by QWIPs [23,24] but in this long integrationtime configuration, QCD technology is a very promising technol-ogy. Fig. 10 shows the calculated detectivity and NETD of a QCDoperating at 12 lm for this application. Only the data for 12 lmare shown since they are limiting. The chosen ROIC is ISC0208and the integration time is 10 ms. At 40 K, the QCD is in the BLIPregime, the NETD is 10 mK and the application requirements arelargely achieved. According to this calculation, we are able to saythat the FPA temperature could easily reach 55 K with the sameNETD and even at higher temperatures than 77 K, the NETD islower than the specification.
QCDs should also be a very good candidate for exoplanets pro-spection using the direct coronographic infrared imaging. The ESAdropped Darwin project and running METIS project actually needintegration times of the order of a thousand seconds. Theimpending question is whether the quantum efficiency will behigh enough and thermal noise sufficiently low to enable suchoperation.
Table A1Parameters used in the computation tool to model an ideal QCD.
Parameter Name Nature Unit Parameters for Section 3
Structurek0 (x0) Peak detection wavelength (pulsation) Nominal lm 8.5 lmLp Period thickness Nominal lm 528.5 ÅNp Number of periods Nominal Variableq Doping Nominal cm�2 Variablen Refractive index Nominal 3.3Lc Contact thickness Nominal lm 300 nm
ElectronicsT Detector temperature Nominal K 85 Kpe Escape probability Nominal 1DEintra Intrasubband broadening Physical eV 12 meVa (aL) Absorption rate in QWs Calculated s�1 (m�1)g Quantum efficiency Calculated Variable
Opticsr, t, R, T f mirror Fresnel coefficients Physical T = 0.45b (bL) Ohmic loss rate Physical s�1 (m�1) 3.71 � 1012 s�1
neff(q) Effective index for plasmon length Physicalz0 Plasmon length Calculated lm
ROIC ISC 0208CROIC Capacity Nominal Me� 18.5 Me�
BROIC Noise of the ROIC Nominal V 165 lVGROIC Gain of the ROIC Nominal V/e� 162.62 nV/e�
Spixel Pixel pitch Nominal lm � lm 23.5 lm � lm
Scenariok (x) Detection wavelength Nominal lm 8.5 lmFOV Field of view Nominal 1.6TBKG Background temperature (or flux) Nominal K 294 KTMAX Maximum temperature (or flux) Nominal K 343 KsMAX
intApplication limited integration time Nominal ms 7 ms
Fig. B.1. (Left) Map of the ratio of the electric fields |Ez|2/|Ei|2 for a QCD at 8.3 lm, as a function of quantum well position and wavelength. It is calculated for 30 periods and adoping amount of 5 � 1011 cm�2. The expected Lorentzian shape for spectral acceptance and the decreasing exponential for spatial distribution are shown. (Right) Reduceddecay length z0/k0, i.e. the effective index map of the SPP extension in the cavity, as a function of doping q and number of wells Np. The dependency over the number of wells isneglected in the calculation.
106 A. Delga et al. / Infrared Physics & Technology 59 (2013) 100–107
5. Conclusion
In this paper, we have presented a complete model to calculatethe performances of QCDs for infrared imaging applications. Thismodel is based on an ideal approach of the electronic transportin QCDs and a Fabry–Pérot picture of the light-coupling scheme.The latter properly takes into account the light injection througha metalized diffraction grating in quantum well focal plane array.This computation tool is very efficient to optimize the device andbalance the nominal parameters (active structure, ROIC) to reachthe best detectivity or NETD. Moreover, it enables to predict and
evaluate the potentialities of a QCD for specific applications. In par-ticular, QCDs are very promising for high-speed thermal imaging inthe 8–12 lm range and for atmosphere monitoring projects. Wehave to point out that the calculated performances given by thismodel are not the ultimate ones. For instance, there is a lot of roomfor improvement by optimizing the light-coupling scheme, usingsurface plasmon resonances in subwavelength metallic cavities[25–28]. The quantum efficiency being strongly enhanced, themain weakness of QCDs is taken care of, and with their advantages(speed, technological maturity, etc.), they are the best photodetec-tors to investigate plasmonics effects on.
A. Delga et al. / Infrared Physics & Technology 59 (2013) 100–107 107
Appendix A
See Table A1.
Appendix B
We use the matching mode method, to calculate the field distri-bution in the QCD cavity (see Fig. B.1a) in a infinite bi-dimensionalgeometry. The active layers are modeled as an homogeneous aniso-tropic medium by mean of an effective index. Such maps are calcu-lated for doping ranging from 1 to 10 � 1011 cm�2 and number ofperiods from 4 to 40.
A map (q, Np) of the SPP exponential decay z0 is obtained by fit-ting the field distribution at 8.3 lm. It is shown in Fig. B.1b. For asignificant number of periods (over 20), the SPP decay length isindependent of the number of period. For lower values, the impactof material different from the active layers (especially the uppercontact) is strong enough to modify the SPP length significantly.This variation is not taken into account in our model. Furthermorethe SPP decay length is supposed proportional to the peak detec-tion wavelength, z0 = neff(q) � k0. We extract the following parame-ters for neff(q) = 0.193exp(�q/5.79) + 0.09. Note that the value ofthe decay length is quite robust with the variation of the parame-ters impacting the effective index.
Two similar maps (q,Np) are constructed from the Lorentzian fitof the spectral acceptance of the cavity. The width of the Lorentz-ian gives access to the ohmic loss rate b in the metal, and theamplitude to the transmission T of the front side mirror. b controlsthe width of the Lorentzian for a zero doping in the active layer.We also check that the evolution of the Lorentzian width with dop-ing amount follows our calculation of the absorption rate in theQWs. Similarly we check that the transmission coefficient T ex-tracted from this calculation does not vary significantly over thewhole (q,Np) space. Typically we obtain b = ~37� ~112 s�1 andT = 0.4 with a relative variation of 5% and 10% respectively withinthe explored configurations.
The intrasubband broadening DEintra is calculated using themodel detailed in Ref. [20].
References
[1] V. Guériaux, N. Brière de l’Isle, A. Berurier, O. Huet, A. Manissadjian, H. Facoetti,X. Marcadet, M. Carras, V. Trinité, A. Nedelcu, Quantum Well InfraredPhotodetectors: present and future, Opt. Eng. 50 (6) (2011) 061013.
[2] L. Gendron, M. Carras, A. Huynh, V. Ortiz, C. Koeniguer, V. Berger, Quantumcascade photodetector, Appl. Phys. Lett. 85 (2004) 2824.
[3] L. Gendron, C. Koeniguer, V. Berger, X. Marcadet, High resistance narrow bandquantum cascade photodetectors, Appl. Phys. Lett. 86 (2005) 121116.
[4] F.R. Giorgetta, E. Baumann, D. Hofstetter, C. Manz, Q. Yang, K. Köhler, M. Graf,InGaAs/AlAsSb quantum cascade detectors operating in the near infrared, Appl.Phys. Lett. 91 (2007) 111115.
[5] F.R. Giorgetta, E. Baumann, M. Graf, L. Ajili, N. Hoyler, M. Giovannini, J. Faist, D.Hofstetter, P. Krötz, G. Sonnabend, 16.5 lm quantum cascade detector usingminiband transport, Appl. Phys. Lett. 90 (2007) 231111.
[6] A. Vardi, G. Bahir, F. Guillot, C. Bougerol, E. Monroy, S.E. Schacham, M.Tchernycheva, F.H. Julien, Near infrared quantum cascade detector in GaN/AlGaN/AlN heterostructures, Appl. Phys. Lett. 92 (2008) 011112.
[7] A. Buffaz, M. Carras, L. Doyennette, A. Nedelcu, X. Marcadet, V. Berger,Quantum cascade detectors for very long wave infrared detection, Appl. Phys.Lett. 96 (2010) 172101.
[8] D.L. Smith, C. Mailhiot, Proposal for strained type II superlattice infrareddetectors, J. Appl. Phys. 62 (1987) 2545.
[9] C.H. Grein, H. Cruz, M.E. Flatté, H. Ehrenreich, Theoretical performance of verylong wavelength InAs/InxGa1�xSb superlattice based infrared detectors, Appl.Phys. Lett. 65 (1994) 2530.
[10] C. Koeniguer, G. Dubois, A. Gomez, V. Berger, Electronic transport in quantumcascade structures at equilibrium, Phys. Rev. B 74 (2006) 235325.
[11] A. Buffaz, A. Gomez, M. Carras, L. Doyennette, V. Berger, The role of subbandoccupancy on electronic transport in quantum cascade detectors, Phys. Rev. B81 (2010) 075304.
[12] F.-R. Jasnot, N. Péré-Laperne, L.-A. de Vaulchier, Y. Guldner, F. Carosella, R.Ferreira, A. Buffaz, L. Doyennette, V. Berger, M. Carras, X. Marcadet,Photocurrent analysis of quantum cascade detectors by magnetotransport,Phys. Rev. B 82 (2010) 125447.
[13] A. Gomez, N. Péré-Laperne, L.-A. de Vaulchier, C. Koeniguer, A. Vasanelli, A.Nedelcu, X. Marcadet, Y. Guldner, V. Berger, Dark current analysis of quantumcascade detectors by magnetoresistance measurements, Phys. Rev. B 77 (2008)085307.
[14] H. Schneider, H.C. Liu, Quantum Well Infrared Photodetectors, Springer, Berlin,2006.
[15] A. Delga, L. Doyennette, V. Berger, M. Carras, V. Trinité, A. Nedelcu, Predictivecircuit model for noise in quantum cascade detectors, Appl. Phys. Lett. 99(2011) 252106.
[16] A. Delga, M. Carras, V. Trinité, V. Guériaux, L. Doyennette, A. Nedelcu, H.Schneider, V. Berger, Master equation approach of classical noise inintersubband detectors, Phys. Rev. B 85 (2012) 245414.
[17] J.Y. Andersson, L. Lundqvist, Grating-coupled quantum-well infrareddetectors: theory and performance, J. Appl. Phys. 71 (1992) 3600.
[18] D. Hofstetter, F.R. Giorgetta, E. Baumann, Q. Yang, C. Manz, K. Köhler, Mid-infrared quantum cascade detectors for applications in spectroscopy andpyrometry, Appl. Phys. B 100 (2010) 313.
[19] A. Nedelcu, Y. Creten, N. Brière de L’Isle, B. Okcan, V. Guériaux, A. Berurier, T.Bria, J.-P. Truffer, E. Costard, Enhanced broadband (11–15 lm) QWIP FPAs forspace applications, Proc. SPIE 7474 (2009) 747419.
[20] A. Nedelcu, V. Guériaux, A. Bazin, L. Dua, A. Berurier, E. Costard, P. Bois, X.Marcadet, Enhanced quantum well infrared photodetector focal plane arraysfor space applications, Infrared Phys. Technol. 52 (2009) 412.
[21] E. Costard, Ph. Bois, THALES long wave QWIP thermal imagers, Infrared Phys.Technol. 50 (2007) 260.
[22] E. Costard, A. Nedelcu, J.P. Truffer, O. Huet, L. Dua, J.A. Robo, X. Marcadet, N.Brière de l’Isle, H. Facoetti, P. Bois, QWIP status at thales, Infrared Phys.Technol. 52 353 (2009).
[23] M. Jhabvala, D. Reuter, K. Choi, C. Jhabvala, M. Sundaram, QWIP-based thermalinfrared sensor for the landsat data continuity mission, Infrared Phys. Technol.52 (2009) 424.
[24] D. Reuter, C. Richardson, J. Irons, R. Allen, M. Anderson, J. Budinoff, G.Casto, C. Coltharp, P. Finneran, B. Forsbacka, T. Hale, T. Jennings, M.Jhabvala, A. Lunsford, G. Magnuson, R. Mills, T. Morse, V. Otero, S.Rohrbach, R. Smith, T. Sullivan, Z. Tesfaye, K. Thome, G. Unger, P.Whitehouse, The thermal infrared sensor on the landsat data continuitymission, in: Geoscience and Remote Sensing Symposium (IGARSS), 2010IEEE International 754 (2010)..
[25] R. Stanley, Plasmonics in the mid-infrared, Nat. Photon. 6 (2012).[26] W. Wu, A. Bonakdar, H. Mohseni, Plasmonic enhanced quantum well
infrared photodetector with high detectivity, Appl. Phys. Lett. 96 (2010)161107.
[27] S.C. Lee, S. Krishna, S.R.J. Brueck, Quantum dot infrared photodetectorenhanced by surface plasma wave excitation, Opt. Express 23160 (2009).
[28] J. Le Perchec, Y. Desieres, N. Rochat, R. Espiau de Lamaestre, Subwavelengthoptical absorber with an integrated photon sorter, Appl. Phys. Lett. 100 (2012)113305.