A R E S E A RCH IN T O G L O BAL SU P PLY CH A INS 2010 - 2011 SUPPLY CHAIN MANAGEMENT AND THE EXECUTIVE AGENDA EXECUTIVE SUMMARY A PUBLICATION BY THE TRUECONOMY CONSULTING RESEARCH PROGRA M
w i t h o u t t h e e x p r e s s w r i t t e n p e r m i s s i o n o f Tr u E c o n o m y C o n s u l t i n g . 3
It is an honor to be given the opportunity to introduce this important study led by prof.
Simchi-Levi. Once colleagues at the mathematics faculty of MIT, we now have come to meet
each other in the important sphere of supply chains and sustainable development.
The link between the Social and Economic Council of the Netherlands and the issue of
sustainable development goes back some time. In 1993 we created a special committee on
sustainable development. Just recently our Council has unanimously adopted an advisory
report prepared by this committee. The premise of the report is that given the immense
sustainability challenges the world faces, business-as-usual is no option. From now on, an
appropriate balance between people, plane and profit has to be the starting point in every
economic decision we take.
Companies face the task of making their entire production sustainable. As production
chains now stretch out all over the world, smart supply chain management practices consti-
tute the backbone of this process. Firms need even to guarantee that their direct suppliersproduce under sound environmental and social conditions. But that is not enough, they must
also do whatever they can to improve social and environmental performance further down
the supply chain. This is exactly what the employers’ and employees’ organizations in our
Council agreed upon when they signed the Statement on International Corporate Social
Responsibility in December 2008.
Admittedly, sustainable supply chain management is easier said than done. Supply chains
have grown immensely complex, and large international firms often face thousands of direct
suppliers, let alone the number of indirect suppliers. Besides, firms face highly competitive
environments and find it hard to pass the cost of improved investments in sustainability on
to their consumers. Fortunately, we know it can be done. In recent years, many firms have
significantly scaled up their sustainability performance through their supply chains, while
maintaining excellent economic returns.
These successes show that there is a clear business case for sustainability. Especially with
respect to savings on and the substitution of scarce, depletable resources and processes that
contribute to climate change, the rationale is clear. It is important that the people dimension
of sustainability across the supply chain is not overlooked. With wages rising globally,
investing in people all over the world is key to achieve the hard needed labour productivity
increases. Besides, investing in decent work is crucial for the reputation for firms, and more
broadly speaking, for public support for open markets.
As CEO support is key to the realization of any significant change, I am happy to read inthis study that sustainability is already a top concern for many CEO’s. Yet some still do not
grant it the priority it deserves. I hope this study will put sustainable supply chains at the
top of every CEO agenda, where I believe it rightfully belongs.
Alexander Rinnooy Kan
Chair of the Social and Economic Council of the Netherlands
w i t h o u t t h e e x p r e s s w r i t t e n p e r m i s s i o n o f Tr u E c o n o m y C o n s u l t i n g .
INTRODUCTION
The answers to these questions are provided by a large scale scientific research performedby a joint MIT-TruEconomy team. This executive summary recapitulates the key findings andinsights. Approximately 200 companies worldwide contributed with their knowledge. Thesurvey contained questions to the CEO focused on the executive agenda, questions to theCFO focused on business performance and questions to the COO or supply chain executivefocused on supply chain strategies deployed. The objective is to identify a framework thatlinks the firm’s value proposition to its supply chain strategy. Such a framework can establisha strong connection between business strategy and supply chain management and willdrive supply chain management towards the firm’s decision makers. Unlocking the value
In this rapidly changing world, it is of great importance that supply chain executives are
able to find the answers to their questions quickly. As TruEconomy Consulting delivers thehighest quality supply chain management services resulting in measurable client benefits,we try to help find those answers. We believe that pro-actively sharing in-depth knowledgeand best practices are key catalysts for pushing the envelope in the discipline of supplychain management.
Scientific research will help find answers to critical questions. Unfortunately for variousreasons it may take years before leading scientific research will draw on trade and industry.Therefore TruEconomy Consulting firmly invests in scientific research and sharing and applyingthe outcomes. Our partnership with the renowned Massachussetts Institute of Technology inBoston allows us to not only take the supply chain management discipline to a higher levelbut also unlock the outcome of all research conducted together at a higher pace.
Next steps
This research ‘Supply chain management and the executive agenda’ proves there is a directconnection between the maturity of the supply chain and the company performance. With theoutcome of this research you can give your current supply chain a health check and seewhether or not you have the correct enablers. It gives the ability to have a common languagebetween CEO, CFO and supply chain executives, which will take discussions beyond reducinginventory or transportation costs, straight to the core of supply chain management: sustainableimprovements to the bottom line and the ability to become an outlier in your industry.
We wish you lots of inspiration and healthy discussions.
w i t h o u t t h e e x p r e s s w r i t t e n p e r m i s s i o n o f Tr u E c o n o m y C o n s u l t i n g .8
INCREASING DRIVE TOWARDSFLEXIBILITY
An important starting point is an increasingdrive towards flexibility. One observationmade recently in the literature is the distinc-tion between those companies whose supplychain strategies are focussed on cost-efficien-cy and those who are focussed on flexible-response. When participants were asked tocharacterize their companies, it turned outthat most companies in our survey empha-size a flexible-response strategy.
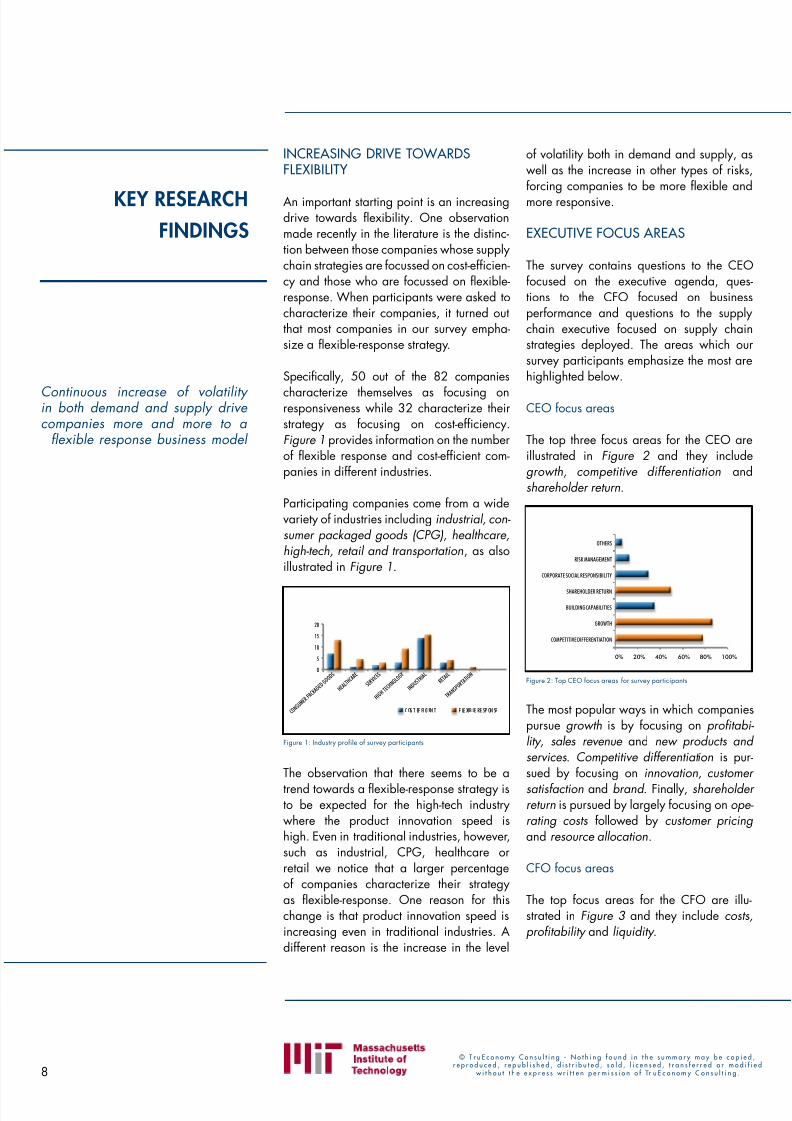
Specifically, 50 out of the 82 companies
characterize themselves as focusing onresponsiveness while 32 characterize theirstrategy as focusing on cost-efficiency.Figure 1 provides information on the numberof flexible response and cost-efficient com-panies in different industries.
Participating companies come from a widevariety of industries including industrial, con- sumer packaged goods (CPG), healthcare,high-tech, retail and transportation, as alsoillustrated in Figure 1.
The observation that there seems to be a
trend towards a flexible-response strategy isto be expected for the high-tech industrywhere the product innovation speed ishigh. Even in traditional industries, however,such as industrial, CPG, healthcare orretail we notice that a larger percentageof companies characterize their strategyas flexible-response. One reason for thischange is that product innovation speed isincreasing even in traditional industries. Adifferent reason is the increase in the level
of volatility both in demand and supply, aswell as the increase in other types of risks,forcing companies to be more flexible andmore responsive.
EXECUTIVE FOCUS AREAS
The survey contains questions to the CEOfocused on the executive agenda, ques-tions to the CFO focused on businessperformance and questions to the supplychain executive focused on supply chainstrategies deployed. The areas which oursurvey participants emphasize the most arehighlighted below.
CEO focus areas
The top three focus areas for the CEO areillustrated in Figure 2 and they includegrowth, competitive differentiation andshareholder return.
The most popular ways in which companiespursue growth is by focusing on profitabi- lity, sales revenue and new products andservices. Competitive differentiation is pur-sued by focusing on innovation, customer
satisfaction and brand . Finally, shareholderreturn is pursued by largely focusing on ope- rating costs followed by customer pricing and resource allocation.
CFO focus areas
The top focus areas for the CFO are illu-strated in Figure 3 and they include costs,profitability and liquidity .
20
15
10
5
0
C O N S
U M E R
P A C K A G E D
G O O D S
H E A L T H
C A R E
S E R V
I C E S
H I G H
T E C H N O
L O G Y
I N D U
S T R I A L
R E T A I L
T R A N
S P O R T A T I O
N
C OS T EF FI CI EN T F LE XIB LE RE SP ON SE
Figure 1: Industry profile of survey participants
OTHERS
RISK MANAGEMENT
CORPORATE SOCIAL RESPONSIBILITY
SHAREHOLDER RETURN
BUILDING CAPABILITIES
GROWTH
COMPETITIVE DIFFERENTIATION
0% 20% 40% 60% 80% 100%
Figure 2: Top CEO focus areas for survey participants
Continuous increase of volatilityin both demand and supply drivecompanies more and more to a
w i t h o u t t h e e x p r e s s w r i t t e n p e r m i s s i o n o f Tr u E c o n o m y C o n s u l t i n g . 9
Focus on costs is pursued by emphasizingreduction of cost-of-goods-sold, operationalefficiency and reduction of sales, generaland administrative expenses.
According to the survey, and not surprisingly,CFOs who focus on profitability empha-sized earnings-before-interest-and-tax (EBIT) and operating margin whereas those CFOsfocusing on liquidity emphasized operatingcash flow, working capital and corporatecash followed by cash-to-cash cycle time .
SCM focus areas
The top three focus areas for supply chainexecutives include satisfying customer
demand, supply chain organization, pro- cesses and technology, and purchasing asshown in Figure 4. How do these supplychain executives achieve each one of theirobjectives?
Satisfaction of customer demand is mostlyachieved through reduction of customerlead times, and reduction of stock outs.Executives who identify supply chain orga- nization, processes and technology empha- sized S&OP processes, followed by IT forplanning and collaboration. Finally, those
executives that focus on purchasing empha-sized reduction of supplier costs, supplierquality and supplier reliability followed byreduction of supplier lead-times.
All these observations apply to the completesample of participating companies. A morerefined analysis allows the research team todistinguish between strategies used by suc-cessful cost-efficient companies and strate-gies applied by best-in-class flexible-respon-se companies. This is discussed in the nextsection, followed by emerging correlationsacross the CEO, CFO and SCM strategies.The correlations are critical in identifying
the link between the firm’s value propositionand its supply chain strategy.
IDENTIFICATION OF BESTPERFORMERS
After finishing each survey section, partici-pants were asked to rank their company’sperformance against targets for specificKey Performance Indicators (KPIs). Supplychain KPIs include information on inventoryturns, supply chain costs, customer order
fill rate, customer order lead time, customerorder profitability and forecast accuracy .Of course, one would expect that cost-effi-cient companies will emphasize inventoryturns and supply chain costs while flexible-response companies emphasize customerorder fill rate and customer order lead-time .
Therefore, performance against targets on in- ventory turns and supply chain costs is appliedto identify the best-in-class cost-efficient com-panies. Similarly, performance against targetson customer order fill rate and customer
order lead-time is used to identify best per-forming flexible-response companies. This isillustrated in Figure 5 .
FORECAST
ACCURACY
CUSTOMER
ORDER FILL RATE
CUSTOMER
ORDER LEAD-TIME
SUPPLY CHAIN COSTS
CUSTOMER
ORDER
PROFITABILITY
INVENTORY TURNS
FLEXIBLE RESPONSE
COST EFFICIENT
Figure 5: Best-in-class supply chain performance
OTHERS
VARIANCE
RESTRUCTURING ASSETS/DEBT
COSTS
LIQUIDITY
PROFITABILITY
0% 20% 40% 60% 80% 100%
Figure 3: Top CFO focus areas for survey participants
OTHERS
RISK MANAGEMENT
SUPPLY CHAIN ORGANIZATION, PROCESSES
SUPPLY CHAIN ASSETS
PURCHASING
SUPPLY CHAIN INNOVATION
VISIBILITY
SATISFYING CUSTOMER DEMAND
0% 50% 100%
Figure 4: Top SCM focus areas for survey participants
Top performing flexible responsecompanies and top performingcost-efficient companies emphasizedifferent supply chain KPIs
w i t h o u t t h e e x p r e s s w r i t t e n p e r m i s s i o n o f Tr u E c o n o m y C o n s u l t i n g .10
In this manner, the top 30 companies wereidentified. By comparing these best-in-classcompanies to everyone else we are ableto identify effective operations strategies,business strategies and their connection tofinancial performance.
KEY INSIGHTS INTO OPERATIONSSTRATEGIES
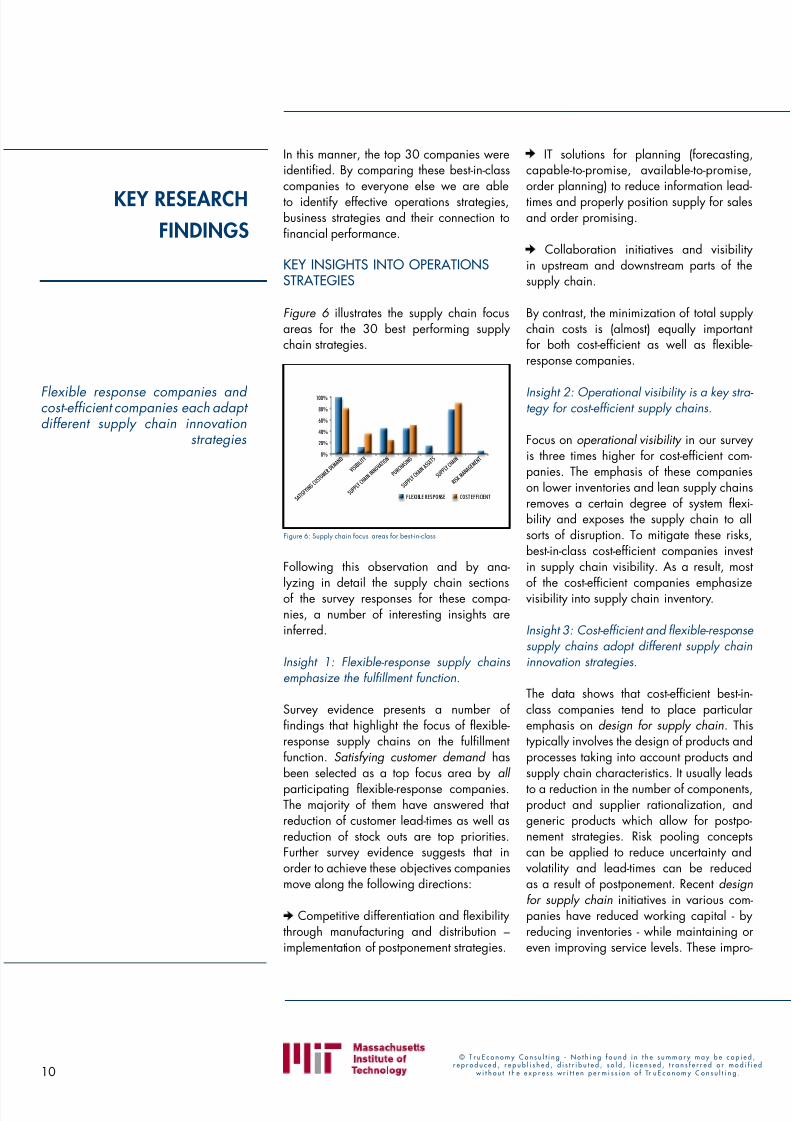
Figure 6 illustrates the supply chain focusareas for the 30 best performing supplychain strategies.
Following this observation and by ana-
lyzing in detail the supply chain sectionsof the survey responses for these compa-nies, a number of interesting insights areinferred.
Insight 1: Flexible-response supply chainsemphasize the fulfillment function. Survey evidence presents a number offindings that highlight the focus of flexible-response supply chains on the fulfillmentfunction. Satisfying customer demand hasbeen selected as a top focus area by all
participating flexible-response companies.The majority of them have answered thatreduction of customer lead-times as well asreduction of stock outs are top priorities.Further survey evidence suggests that inorder to achieve these objectives companiesmove along the following directions:
Competitive differentiation and flexibilitythrough manufacturing and distribution –implementation of postponement strategies.
IT solutions for planning (forecasting,capable-to-promise, available-to-promise,order planning) to reduce information lead-times and properly position supply for salesand order promising.
Collaboration initiatives and visibilityin upstream and downstream parts of thesupply chain.
By contrast, the minimization of total supplychain costs is (almost) equally importantfor both cost-efficient as well as flexible-response companies.
Insight 2: Operational visibility is a key stra- tegy for cost-efficient supply chains.
Focus on operational visibility in our surveyis three times higher for cost-efficient com-panies. The emphasis of these companieson lower inventories and lean supply chainsremoves a certain degree of system flexi-bility and exposes the supply chain to allsorts of disruption. To mitigate these risks,best-in-class cost-efficient companies investin supply chain visibility. As a result, most
of the cost-efficient companies emphasizevisibility into supply chain inventory.
Insight 3: Cost-efficient and flexible-responsesupply chains adopt different supply chaininnovation strategies.
The data shows that cost-efficient best-in-class companies tend to place particularemphasis on design for supply chain. Thistypically involves the design of products andprocesses taking into account products andsupply chain characteristics. It usually leads
to a reduction in the number of components,product and supplier rationalization, andgeneric products which allow for postpo-nement strategies. Risk pooling conceptscan be applied to reduce uncertainty andvolatility and lead-times can be reducedas a result of postponement. Recent designfor supply chain initiatives in various com-panies have reduced working capital - byreducing inventories - while maintaining oreven improving service levels. These impro-
100%
80%
60%
40%
20%
0%
S A T I S
F Y I N
G C U S T O M
E R D E M
A N D
V I S I B I L I T Y
S U P P
L Y C H A I N I N N O
V A T I O
N
P U R C H A
S I N G
S U P P
L Y C H A I N
A S S E T S
S U P P
L Y C H A I N
R I S K
M A N
A G E M
E N T
FLEXIBLE RESPONSE COST EFFICIENT
Figure 6: Supply chain focus areas for best-in-class
Flexible response companies andcost-efficient companies each adaptdifferent supply chain innovation
w i t h o u t t h e e x p r e s s w r i t t e n p e r m i s s i o n o f Tr u E c o n o m y C o n s u l t i n g . 11
vements are more popular with cost-efficientsupply chains.
Innovation in flexible-response companies,on the other hand, is focused on a highfrequency of new products and serviceintroduction. This is probably associatedwith the fact that flexible-response supplychains are typically encountered in fasterclock-speed industries, such as high-tech.The supply chain organization is critical inthis case since the frequent introduction ofnew products and services requires seam-less supply chain integration and support invarious levels.
Finally, cost-efficient supply chain com-panies place particular emphasis on theinnovation of the distribution channel whichcan be explained by the tremendous impactit can have on transportation and warehou-sing cost reduction. For that purpose, cost-efficient companies invest in distributionand transportation to reduce exposure tocost and risk.
Insight 4: Cost-efficient and flexible-response
supply chains adopt different purchasingstrategies.
Indeed, cost-efficient supply chain focus onreducing total landed costs in making pur-chasing decisions while flexible-responsecompanies focus on lead-time reduction.
FINANCIAL AND BUSINESSPERFORMANCE
After completing all three survey sections,participants were asked to grade their com-
pany’s performance in various KPIs versusthe targets set by the firm for these KPIs.
Figure 7 illustrates the similarities and dif-ferences between best-in-class flexible-response and best-in-class cost-efficient com-panies along the executive metrics. As onecan see, supply chain best-in-class flexible-response companies dominate on almost allthe financial measures except two: inventoryturns, where supply chain best-in-class cost-
efficient companies perform better and total asset turnover where performance of the twoclasses of companies is the same.
At the same time, see Figure 8, there is verylittle difference between best-in-class cost-efficient and flexible-response companiesrelative to their individual business targetssuch as revenue or return-on-equity , whilesome difference exists, in favor of flexible-response companies when considering cus- tomer satisfaction and market-share .
FLEXIBLE RESPONSE
COST EFFICIENT
RETURN ON
EQUILTYTOTAL DEBT
RATIO
DEBT TO EQUILTY
RATIO
OPERATING
MARGIN
NET WORKING
CAPITAL TO ASSETS
INVENTORY
TURNOVER
TOTAL ASSET
TURNOVER
OPERATING
CASH FLOW
RETURN ON
ASSETS
Figure 7: Financial performance of supply chain best-in-class againstcompany targets
FLEXIBLE RESPONSE
COST EFFICIENT
REVENUE
RETURN ON
EQUILTY MARKET SHARE
CUSTOMER
SATISFACTION
Figure 8: Business performance of supply chain best-in-class againstcompany targets
Cost-efficient supply chain compa- nies place particular emphasis onthe innovation of the distributionchannel
w i t h o u t t h e e x p r e s s w r i t t e n p e r m i s s i o n o f Tr u E c o n o m y C o n s u l t i n g .12
EXECUTIVE AGENDA AND SUPPLYCHAIN STRATEGIES
Having noticed the differences between cost-efficient companies and flexible-responsecompanies, we analyzed the 30 best-in-class companies to identify links betweenthe executive agenda and supply chainstrategies.
Of course, this is not the only researchto focus on the link between the two.In ‘Operations Rules: Delivering CustomerValue through Flexible Operations’ (MITPress, September 2010), Prof. Simchi-Levi
developed a framework to allow firms tolink their operations strategy with customervalue proposition. He illustrates this frame-work with a few examples. For instance, thebusiness strategy of giant retailer Wal-Martis every-day-low pricing and as a result itsoperations strategy emphasizes cost effi-ciency. By contrast, the business strategyof online retailer Amazon is selection andavailability and therefore its operationsstrategy is focused on efficient and reliableorder fulfillment strategy.
By the same token, the business strategyof Dell Computers when selling its productonline is customer experience - the abilityof consumers to choose whatever productconfiguration they want - and therefore, Dellstrategy is focused on flexibility through anassemble-to-order manufacturing strategy.This is exactly the challenge that Dell facedwhen the firm recently introduced a newchannel to market, the retail channel. Herethe customer value proposition is not selec-tion - the number of configurations available
at a store is rather limited - but rather thevalue proposition is low price. Therefore, inthe retail channel, the operations strategymust emphasize cost efficiency.
The data in this study provides further sup-ports of this connection between the execu-tive agenda and supply chain strategy. Forexample, our data suggests that companieswhose business focused on growth, thesupply chain emphasized organization, pro-
cesses and technology. Similarly, when theexecutive agenda included building capabi-lities, the supply chain focused on investingand utilizing supply chain assets effectively.
And finally, and most importantly, acrossall the best-in-class companies a strong cor-relation has been found between a businessfocus on corporate social responsibilityand innovation in the supply chain. This isindeed appropriate since corporate socialresponsibility includes, among others, afocus on carbon footprint reduction, elimi-nation of waste, and energy and water con-servation - all of which require innovative
product design, manufacturing and supplychain strategies.
Some of the notable differences betweencost-efficient companies and flexible-response companies include the observa-tion that supply chain innovation facilitatesgrowth for flexible-response companies butimpedes growth for cost-efficient compa-nies. This is explained as follows. Flexible-response strategies are associated with fast-clock speed products and technologies, thus
the need for supply chain innovation. Onthe other hand, supply chain innovation typi-cally requires significant investments, henceis not followed by those companies whosestrategy emphasizes cost reduction.
Finally, the research team focused on quan-tifying the magnitude of the link betweenexecutive agenda and supply chain perfor-mance. For this purpose, the four executiveperformance measures - revenue, market- share, customer satisfaction and return-on- equity - were extracted to a single perfor-
mance indicator referred to as the BusinessPerformance Indicator (BPI) using appropri-ate variable reduction techniques.
Our objective is to compare the BPI of the30 best-in-class supply chains to that of theremaining 52 companies. This is done inFigure 9 where you can see the fraction ofbest-in-class companies with different BPIvalues alongside the fraction of the remainingcompanies with the same BPI.
Across all the best-in-class compa- nies a strong correlation has beenfound between a business focus oncorporate social responsibility and
w i t h o u t t h e e x p r e s s w r i t t e n p e r m i s s i o n o f Tr u E c o n o m y C o n s u l t i n g .
KEY RESEARCHFINDINGS
13
As you can see, a large fraction of the best-in-class companies exhibits high BPI. On theother hand, the percentage of remainingcompanies with similar BPI levels is muchsmaller. For example, 62% of the best-in-class companies exhibit above average BPIcompared to 43% of the remaining com-panies. Similarly, 47% of the best-in-classcompanies are in the top one third of theBPI ranking compared with only 25% of theremaining companies.
Similarly, the CFO’s performance metrics -return-on-equity, return-on-assets, total assetsturnover, inventory turnover, operating cashflow, net working capital to assets, ope-
rating margin, debt to equity ratio, andtotal debt ratio - were also extracted to asingle performance metric referred to asthe Financial Performance Indicator (FPI).This indicator is plotted in Figure 10 wherewe provide information on the fraction ofbest-in-class companies and the remainingcompanies with different FPI values. Again,most of the best-in-class companies exhibit asignificantly higher financial performance.
SUMMARY
The relationship between supply chain stra-tegies and business strategies has beenexamined with the objective to establisha link between supply chain managementand the value proposition of the company.
To summarize, the results indicate not only alink between the executive agenda and sup-ply chain strategies but also that businessand financial performance go hand in handwith supply chain performance. Indeed,the business and financial performance ofmost of the best-in-class supply chains in
the survey outperform that of the remainingcompanies.
The number of possible relationships andcorrelations established in this survey coversa wide space of strategies. Although, abig number of them have been analyzedalready there are still areas of great inte-rest that have not been explored fully. Themethodology developed and the informa-tion collected from the survey provides uswith appropriate tools to go into even more
extensive depth in the near future.
40%
35%
30%
25%
20%
15%10%
5%
0%
POOR AVERAGE HIGH
BUSINESS PERFORMANCE INDICATOR
% O
F C O
M P A N I E S
OTHER COMPANIES BEST SUPPLY CHAIN PERFORMERS
30%
25%
20%
15%
10%
5%
0%
POOR AVERAGE HIGH
OTHER COMPANIES BEST SUPPLY CHAIN PERFORMERS
FINANCIAL PERFORMANCE INDICATOR
% O F
C O M P A N I E S
Figure 9: Comparing BPI of best-in-class with that of other companies
Figure 10: Comparing FPI of best-in-class with that of other companies
The business and financial per- formance of most of the best-in- class supply chains in the surveyoutperform that of the remainingcompanies
w i t h o u t t h e e x p r e s s w r i t t e n p e r m i s s i o n o f Tr u E c o n o m y C o n s u l t i n g .
APPENDIX 1
14
METHODOLOGY
The backbone of the framework comprisesthree distinct elements: CEO, CFO and SCMagenda items.
In the early phase of the project, anextensive literature review was conductedto identify existing references on the linkbetween CEO and CFO agenda items andsupply chain strategies. One importantobservation made recently in the literatureis the distinction between those companieswhose supply chain strategy is focused oncost efficiency and those who are focused
on flexible response.
The objective was to understand the diffe-rence between the two strategies and theirlink to the executives’ agenda. For this pur-pose, a number of supply chain and busi-ness performance measures, financial andnon-financial, were reviewed. The objectiveis to apply the performance measures andidentify best-in-class cost efficient companiesand best-in-class flexible-response compa-nies and use the characteristics of these
companies when identifying successful linksbetween SCM and the executive agenda.
The second phase of the project involvedfield study - pilot interviews with fourteencompanies from eight different industries.The objective of this phase was to identify
the top focus areas in each firm along threedimensions: the executive agenda (CEO);financial performance (CFO); and supplychain strategy. The combined findings fromthe field study and the literature reviewwere used to design a focused survey thatwas posted on the web and allowed invitedcompanies to fill out.
The results from the first and second phase ofthe study - the top areas of focus for the CEO,CFO and SCM - are shown in Figure 11.In the online survey, executives, each one in
their respective section, were asked to iden-tify which of these focus areas are currentlyon the top of their agenda.
This was followed by a detailed survey con-sisting of three parts, one for each function(CEO, CFO, SCM). The objective was toidentify how companies accomplish theirtop priorities.
For example, how do firms achieve compe-titive differentiation? Is it by strengthening
brand or by investing in product innovation?Does it vary depending on whether the firmemphasizes cost efficiency or flexibility andresponsiveness?
Similarly, how do firms achieve growth?Is it through a strategy that emphasizes
Executive agenda (CEO)
• Competitive Differentiation• Growth• Building Capabilities• Shareholder Return• Corporate Social Responsibility • Risk Management
profitability or market-share? If the firm focu-ses on building capabilities, what are thecapabilities it is trying to build? Is it lookingat building strong customer and supplierrelationships, for example, or is it looking atoptimizing its supply chain asset strategy?
When supply chain executives focus on visi-bility, what are they trying to accomplish?Is it visibility to supplier’s production plans,inventory levels, or shipment schedule? Bythe same token, when supply chain execu-tives focus on supply chain innovation, what
are they referring to? Do they emphasizenetwork redesign for emerging marketsor new products introduction? And, whensupply chain executives focus on procure-ment, when do they emphasize lead-timereduction? When do they emphasize cuttingprocurement costs? And when do they emp-hasize supplier performance?
Survey responses were then analyzed forrelationships across the CEO, CFO andSCM agendas. These correlations help form
emerging hypotheses linking business strate-gies with supply chain strategies in both thecost-efficient and flexible-response group ofcompanies. In this final stage, our objectivewas two fold:
To identify key differentiators between thestrategies of cost-efficient companies andflexible-response companies.
To identify key interactions between busi-ness strategies and supply chain strategieswhen serving different value propositions.
The research results are captured in acomprehensive research report and highlevel summary is captured in this executivesummary.
w i t h o u t t h e e x p r e s s w r i t t e n p e r m i s s i o n o f Tr u E c o n o m y C o n s u l t i n g .
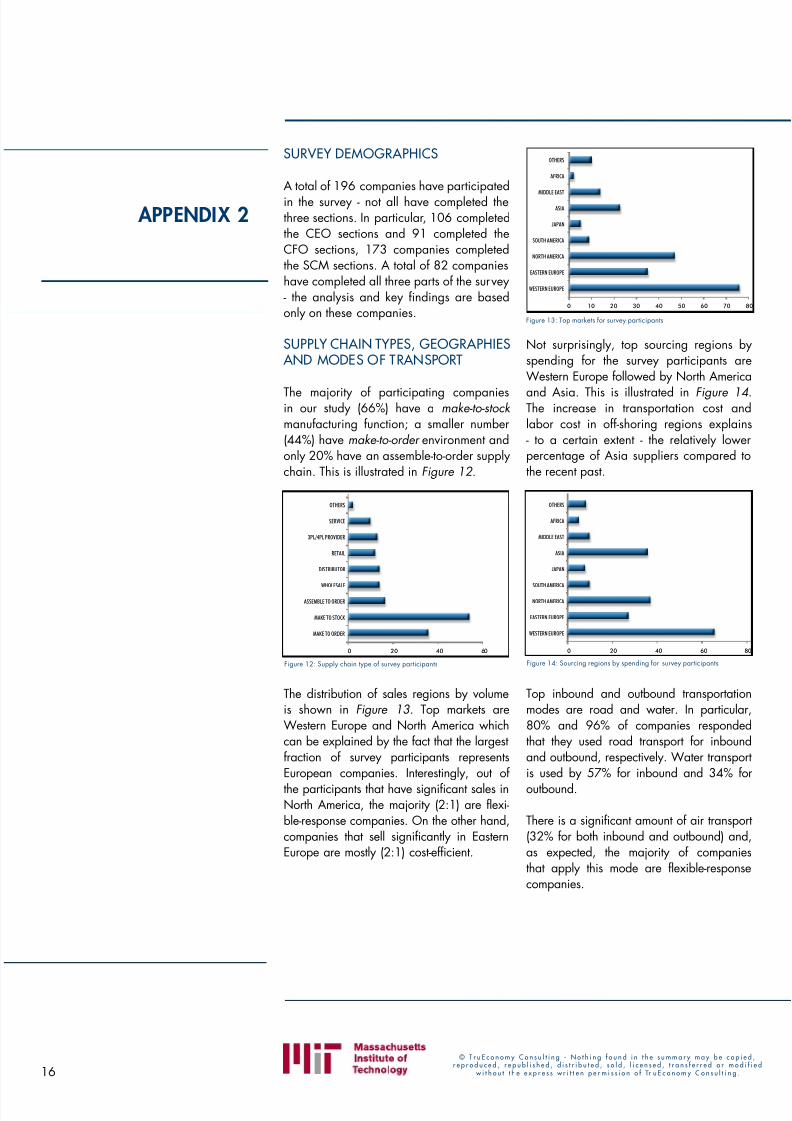
SURVEY DEMOGRAPHICS
A total of 196 companies have participatedin the survey - not all have completed thethree sections. In particular, 106 completedthe CEO sections and 91 completed theCFO sections, 173 companies completedthe SCM sections. A total of 82 companieshave completed all three parts of the survey- the analysis and key findings are basedonly on these companies.
SUPPLY CHAIN TYPES, GEOGRAPHIES AND MODES OF TRANSPORT
The majority of participating companiesin our study (66%) have a make-to-stock manufacturing function; a smaller number(44%) have make-to-order environment andonly 20% have an assemble-to-order supplychain. This is illustrated in Figure 12 .
The distribution of sales regions by volumeis shown in Figure 13. Top markets areWestern Europe and North America whichcan be explained by the fact that the largestfraction of survey participants representsEuropean companies. Interestingly, out of
the participants that have significant sales inNorth America, the majority (2:1) are flexi-ble-response companies. On the other hand,companies that sell significantly in EasternEurope are mostly (2:1) cost-efficient.
Not surprisingly, top sourcing regions byspending for the survey participants areWestern Europe followed by North America
and Asia. This is illustrated in Figure 14.The increase in transportation cost andlabor cost in off-shoring regions explains- to a certain extent - the relatively lowerpercentage of Asia suppliers compared tothe recent past.
Top inbound and outbound transportationmodes are road and water. In particular,80% and 96% of companies respondedthat they used road transport for inboundand outbound, respectively. Water transportis used by 57% for inbound and 34% for
outbound. There is a significant amount of air transport(32% for both inbound and outbound) and,as expected, the majority of companiesthat apply this mode are flexible-responsecompanies.
OTHERS
SERVICE
3PL/4PL PROVIDER
RETAIL
DISTRIBUTOR
WHOLESALE
ASSEMBLE TO ORDER
MAKE TO STOCK
MAKE TO ORDER
0 20 40 60
OTHERS
AFRICA
MIDDLE EAST
ASIA
JAPAN
SOUTH AMERICA
NORTH AMERICA
EASTERN EUROPE
WESTERN EUROPE
0 10 20 30 40 50 60 70 80
OTHERS
AFRICA
MIDDLE EAST
ASIA
JAPAN
SOUTH AMERICA
NORTH AMERICA
EASTERN EUROPE
WESTERN EUROPE
0 20 40 60 80
Figure 14: Sourcing regions by spending for survey participants
Figure 13: Top markets for survey participants
Figure 12: Supply chain type of survey participants
w i t h o u t t h e e x p r e s s w r i t t e n p e r m i s s i o n o f Tr u E c o n o m y C o n s u l t i n g . 17
BIOGRAPHIES
PROFESSOR DAVID SIMCHI-LEVIDepartment of Civil and Environmental Engineering and the Engineering Systems divisionMassachusetts Institute of Technology
Prof. Simchi-Levi is considered to be one of the thought leaders in supplychain management. Prof. Simchi-Levi holds a Ph.D. from Tel Aviv University.His research currently focuses on developing and implementing robustand efficient techniques for logistics and manufacturing systems. He haspublished widely in professional journals on both practical and theoreticalaspects of logistics and supply chain management.
He is also the editor-in-chief of Operations Research, the flag-ship journal of INFORMS , theInstitute for Operations Research and the Management Sciences. This fall he will publish
a new book: ‘Operations Rules: Delivering Customer Value through Flexible Operations’(MIT Press, September 2010).
CONSTANTINE G. VASSILIADIS, Ph.DLead researcher & solution architectTruEconomy Consulting
Dr. Constantine Vassiliadis is the lead researcher from TruEconomyConsulting who worked with Prof. Simchi-Levi on this research project.Dr. Vassiliadis has also worked with Prof. Simchi-Levi on the previousjoint MIT-TruEconomy Consulting project titled ‘A Research into EuropeanSupply Chains 2008-2009’ which highlighted insights in key trends,
challenges and opportunities for European supply chains.
Dr. Vassiliadis holds a Ph.D from Imperial College, London in Process Systems Engineeringand a Master’s Degree (MEng) in Electrical and Computer Engineering from the AristotleUniversity of Thessaloniki. He has been working as a consultant on supply chain improvementinitiatives for companies world-wide for more than a decade.
JAMES PAUL PERUVANKAL Research AssistantMassachusetts Institute of Technology
James Paul Peruvankal is a graduate student at the MIT’s Sloan School of Management andthe School of Engineering. He has worked on supply chain IT projects in the area of planning,
forecasting and inventory management for major multinational retailers. He is a CertifiedSupply Chain Professional by the Association for Operations Management. James holds aBachelor of Technology from the Indian Institute of Technology, Mumbai, India.
w i t h o u t t h e e x p r e s s w r i t t e n p e r m i s s i o n o f Tr u E c o n o m y C o n s u l t i n g .
ACKNOWLEDGEMENTS
ACKNOWLEDGEMENTS
TruEconomy Consulting and the research team would like to express deep and sinceregratitude to all members of the SCM Research Community for taking the time to completethe survey and for sharing their knowledge. Without their contributions we could not havemade this happen.
A special thanks to Ferry Mulder who in the background of this research has facilitated inevery possible way to make this a success.
ABOUT THE SCM RESEARCH COMMUNITY
The SCM Research Community is a community of supply chain executives with the objective to
take supply chain management to a higher level. One of the key activities within this member-ship is to participate in the research project by completing the research survey. The outcomeof all research conducted together is exclusively shared with our SCM Research Community,which currently amounts almost 250 supply chain executives. For more information,visit: www.trueconomy.com