I N T E G R A T E D D I A G N O S T I C S Performing EfFeaive Fault Isolation in Integmted IN TODAY'S CLIMATE of decreas- ing budgets, the number of new systems being developed is de- creasing, and the lives of existing systems are being extended. Con- sequently, aging systems are expe- riencing failures more frequently than before. New systems also fail, and those failures are hard to diag- nose because of the increased so- phistication and complexity of the systems. Performing fault isolation on existing systems and new com- plex systems requires meticulous bookkeeping and detailed under- standing of failure behaviors. The test engineer must devise ap- proaches to fault isolation that pro- vide accurate diagnostics and that take into account such factors as sequence, groups, and potential __i JOHNW.SHEPPARD i WILLIAM R. SIMPSON Arinc Research Corporation In the sixth and final arti series, the authors de modifications or constraints. Then they add factors typically encountered at different levels of fault isolation to modify and constrain the search Finally, they develop trees to illustrate the imp these factors. I false positives and false negatives. In 1 pear on pages 53 and 54 of part 5 of the 1 part 6 of our series on integrated diag- nostic~,'-~ we construct several fault trees that account for these and other factors. We present the case study of an anti- tank missile launcher, used throughout the series, in the context of a complete maintenance architecture. Case study documentation is not repeated here due to space limitations. The dependency diagram and the closed dependency matrices for the case study system ap- series5Tables 1 and 2 on pages 26 and 27 of part 22 provide pertinent data for testsand conclusions. We use these data to develop diagnosticstrategies. Information flow model This series has presented a model- based approach to integrated diagnos- tics. The information flow model permits a thorough design-for-testability procedure and a basis for generating ef- ficient and effective fault isolation strat- egies. The information flow model definesthe interrelationships of sys- tem elements in terms of the flow of diagnostic information. The model can include as an information source any event or observation that provides information about the system under study (for example, stimulus-response pairs, boundaly- scan outputs, and probe informa- tion). The model can include as a fault isolation conclusion any con- clusion that one can draw during diagnosis (a failure of a specific component,a specific failuremode of a piece of hardware, a nonhard- ware failuresuch as bus timing, and the absence of a failure). The model-based approach is hierarchi- cal, and any single model can in- clude any conclusion type. The first step in the model-building process is to determine the level of diag- nostic analysis required. Analysis could include embedded diagnosis (as in built- in test); manual organic maintenance; manual, semiautomatic, or automatic shop repair of units from field sites; or d e pot repair of expensivecards for resale or insertion into a logistics pipeline. The lev- el of diagnosisdeterminesthe fault isola- tion conclusions to consider and the appropriate tests to conduct. Ideally, the engineer develops a hierarchy of sub- - 70 0740-7475/93/0600-0078$03.00 0 1993 IEEE IEEE DESIGN & TEST OF COMPUTERS
Transcript
I N T E G R A T E D D I A G N O S T I C S
Performing EfFeaive Fault Isolation in Integmted
IN TODAY'S CLIMATE of decreas- ing budgets, the number of new systems being developed is de- creasing, and the lives of existing systems are being extended. Con- sequently, aging systems are expe- riencing failures more frequently than before. New systems also fail, and those failures are hard to diag- nose because of the increased so- phistication and complexity of the systems. Performing fault isolation on existing systems and new com- plex systems requires meticulous bookkeeping and detailed under- standing of failure behaviors. The test engineer must devise ap- proaches to fault isolation that pro- vide accurate diagnostics and that take into account such factors as sequence, groups, and potential
__i JOHNW.SHEPPARD i WILLIAM R. SIMPSON
Arinc Research Corporation
In the sixth and final arti series, the authors de
modifications or constraints. Then they add factors typically
encountered at different levels of fault isolation to modify and constrain the search Finally, they develop trees to illustrate the i m p
these factors.
I
false positives and false negatives. In 1 pear on pages 53 and 54 of part 5 of the 1 part 6 of our series on integrated diag- nostic~,'-~ we construct several fault trees that account for these and other factors.
We present the case study of an anti- tank missile launcher, used throughout the series, in the context of a complete maintenance architecture. Case study documentation is not repeated here due to space limitations. The dependency diagram and the closed dependency matrices for the case study system ap-
series5 Tables 1 and 2 on pages 26 and 27 of part 22 provide pertinent data for testsand conclusions. We use these data to develop diagnostic strategies.
Information flow model This series has presented a model-
based approach to integrated diagnos- tics. The information flow model permits a thorough design-for-testability procedure and a basis for generating ef- ficient and effective fault isolation strat-
egies. The information flow model defines the interrelationships of sys- tem elements in terms of the flow of diagnostic information. The model can include as an information source any event or observation that provides information about the system under study (for example, stimulus-response pairs, boundaly- scan outputs, and probe informa- tion). The model can include as a fault isolation conclusion any con- clusion that one can draw during diagnosis (a failure of a specific component, a specific failure mode of a piece of hardware, a nonhard- ware failure such as bus timing, and the absence of a failure). The model-based approach is hierarchi- cal, and any single model can in- clude any conclusion type.
The first step in the model-building process is to determine the level of diag- nostic analysis required. Analysis could include embedded diagnosis (as in built- in test); manual organic maintenance; manual, semiautomatic, or automatic shop repair of units from field sites; or d e pot repair of expensive cards for resale or insertion into a logistics pipeline. The lev- el of diagnosis determines the fault isola- tion conclusions to consider and the appropriate tests to conduct. Ideally, the engineer develops a hierarchy of sub-
-
70 0740-7475/93/0600-0078$03.00 0 1993 IEEE IEEE DESIGN & TEST OF COMPUTERS
Min c c - - - N 0 - , “ ~ ~ ~ ~ ~ ~ ~ ~ ~ ~ ~ ~ ~ ~ ~ ~ , E u I pass Fail (Pass, Fail) Rank*
t l Yes 1 t 4 =@ 1 t4t5-0 =IO 5 10 t, Yes I t 1 =@ 1t11t1-0=13 2 5 t3 Yes I t 3 =@ 1tIOtO-0=11 4 9 t 4 Yes 1 t 6 =a 1t3t4-0 = 8 7 19 t5 Yes I t 4 =@ l t 8 t l - 1 = 9 5 11 t6 Yes I t 5 =@ 1t6t2-1 = 8 6 13 t7 No (t6) Take values from t6 6 14 t8 No (t6) Take values from t, 6 15 t9 No (t6) Take values from t 6 6 16
t l1 Yes 1 t 7 = 8 1t4t2-1 =@ 6 17
3 Yes i t 1 1 = 1 ~ 1 t 2 t 0 - o =@ 3 8
L o Yes I t 6 =@ 1t5t2-1 =@ 7 20
11 2 Yes 1 t 8 = 9 1t3t2-1 =@ 5 12
t l 4 Yes 1 t 1 2 = i 3 i t i t o - o = @ 2 7 tl 5 Yes 1 t 1 3 = 141tOtO-O=@ 1 2 t16 No (t15) Take values from t,, 1 1
int, Yes 1tO=@ l t 1 2 t l - 0 = 14 1 3 int, Yes I t 0 =@ 1t11t2-0 = 14 1 4
7 No (t,,) Take values from t,, 2 6 t l 8 No (t6) Take values from t 6 6 18
* May have other
on where ties are l u l l rankings depending
1-1 ranked Pass = 1 = (column value = 1 A t , E UI) Nonunique elements and diagonal elements shaded to indicate no counting
l u l l [ U 1 1 [ U 1 1
Fail = 1 = (row value t 1 A t, E UI) t (column and row value # 1 A t, E UI) - (elimination creates ambiguity) 1 - 1 k = l 1-1
Figure 1. Information counts for not-needed ranking in case study test-to-test matrix. Circled values are minimum information counts. ( G e part 5 for mathematics.)
systems (thus, a hierarchy of models) to address each level of diagnosis. If the hi- erarchy is developed early in the system design process, the engineer can analyze the hierarchy and continue to refine sys- tem testability as the design matures. This approach fits well within concurrent en- gineering guidelines because of the close ties between system design and testabili- ty design.
Optimized fault isolation: the first step
Previously, we presented an entropy- directed search process and several in- ference rules for developing fault trees5 We derived entropy-directed search from Shannon’s information theory,6 which has also been applied extensive-
ly in decision theory and machine learn- ing.7.8 Entropydirected search seeks to maximize the reduction of uncertainty independently of a test’s o u t ~ o m e . ~ , ~ Using entropy-directed search, we re- duce the search process to a count of information gained and focus only on learned test outcomes (except in the case of tiebreakers). The search for a conclusion terminates either when the outcomes of all tests are known or when only one viable conclusion remains.
To construct a fault tree using entropy- directed search, we first reduce the com- putation load by determining which tests are not needed for diagnosis. The algo- rithm for determining which tests to elim- inate is identical to the excestest analysis algorithm presented in part 3.3
We declare a test not needed if elimina- tion of the test from the test set will cause no relevant additional ambiguity. (Ambi- guity occurs when two conclusions have identical test signatures.) The algorithm ranks the tests in reverse order of desir- ability (based on information gain) and evaluates the least desirable test first. B e cause tests are evaluated sequentially and declaring a test not needed may af- fect whether downstream tests can be d e clared not needed, the ranking forces the least desirable tests to be eliminated first. This “preconditioning” of the test set gives us a tree with the minimum number of tests but may cause overall losses in efficiency.
Figure 1 shows the result of counting information gain for each test in the case
JUNE 1993 79
I N T E G R A T E D D I A G N O S T I C S ~~ -~
\
Figure 2. Not-needed analysis for case study.
Not needed
t i 6 Yes ti, NO
1 % No 1 % No
tz No f17 Yes t14 NO t13 NO t3 No t i NO
ti, No ts Yes
ti, No tie No 14 No
tio NO
Min
5 2 4
D - N C )
- I - ,m - - s 2 2 & ; State Pass Fail (Pass, Fail) - tl 0 0 1 t , 1 1 1 t 3 1 0 1 t 4 ' 0 010 t.5 Not needed t6 Not needed t 7 Not needed t8 Not needed t9 Not needed
8 5 5 3 2 1
ti 6 Not needed 7 Not needed
Unknown 5 7 5 Unknown 1 1 3 1 Unknown 1 1 3 1
Figure 3. /nforrnation counts for first test choice in case study test-to-test matrix
80 IEEE DESIGN & TEST OF COMPUTERS
study, together with the minimum infor- mation yield under an arbitrary outcome. We can weight the information gain for test times, skill levels, failure frequencies, or other factors before ranking. Figure 2 shows the result of evaluating the tests in ranked order. In the figure, the test-tc- conclusion dependency matrix has been transposed and the tests reordered to re- flect the ranking. The shaded rows indi- cate the tests to be declared not needed. For example, the first ranked test is t l 6 . If we remove that row from Figure 2 and compare the column signatures across all conclusions, we find that no two con-
clusions that previously had different sig- natures now have identical signatures. Thus, t l6 is not needed and is eliminated. At this point, the algorithm masks tl6 out of the matrix and evaluates (15. Eliminat- ing tI5 would cause c20 to be identical to No Fault and ~ 1 3 , so t i5 is considered not excess and must be retained. Note that this is true only because t i6 was eliminat- ed. We see from Figure 2 that the analysis determines seven tests are not needed.
Once we have eliminated the excess tests (by assigning their test outcomes as not needed), we create a fault tree, us- ing entropydirected search with the depth-first tree traversal described in part 5. Figure 3 shows the test-to-test matrix after all known tests are masked and the information measure is comput- ed for all remaining tests. The values in Figure 3 differ slightly from those in Fig- ure 1 because different tests have been masked out. In Figure 1, six tests are masked out for uniqueness. In Figure 3, seven are masked out as not needed. The minimum information measure has a maximum value for both t4 and tlo. We resolve the tie in favor of t4 because it has the largest maximum information
value. We assign this first test a pass out- come and provide both the test and its outcome to the inference engine (Fig- ure 4). Because the termination meta- rules are not invoked, the search continues with a second test.
Figure 5 shows termination of the first path in the fault tree. At this point, only t i 5 remains, so we do not actually have to compute information gain. We must choose t15. Drawing inferences from t15's passing invokes the termination meta- rules and assigns the diagnostic out- come to this path. Because the path has terminated, the algorithm backs up in the tree to t15, which is assigned the next outcome (fail outcome). This also tenni- nates the sequence. Again, the algo- rithm assigns the diagnostic outcome and backs up in the tree to t15, which does not have an unevaluated outcome. The algorithm backs up again to t14, which is assigned a fail outcome.
At this point, the sequence does not terminate, and the algorithm must choose a new test. Eventually, because there is no previousstep, backing up fails, signaling completion of the tree. Table 1 shows the complete fault tree in tabular
Table 1. Basic fault tree table for the case study.
Table 2. Skill-level-optimized fault tree for the case study.
Test Previous Pass Fail Step (skill level) step outcome outcome
1 2 3 4 5 6 7 8 9
10 11 12 13 14 15
~
0 1 2 3 2 5 1 7 8 9 8 7
12 13 12 ~
form. This tree is uniform in depth, al- ways requiring four tests to isolate. We can use it to fault-isolate the case study, but we may need to include several practical factors, reviewed in the follow- ing sections.
Diagnosis in an operational environment
If we assume that the case study sys- tem is to be used in a field operational environment, we must verify that it is ready to perform or is repairable in this environment. We must consider two as- pects of fault isolation in an operational environment. First, technicians of various skill levels attempt to isolate faults. It is therefore important to minimize the skill required. Second, we must consider the repair hierarchy. When asystem problem is difficult to diagnose, the operational personnel send the system either to an intermediate repair facility or to a repair shop. For activities with remote opera- tions, repair takes place at the replace able unit level and not at the component level. Remote activities engaged in oper- ations do not undertake repair but send
step 2 Step 3
~ 1 3 , NO Fault
c20 Step 6
Step 8 Step 9 Step 10
c7, C8, c9, Cl0 Step 13 Step 14
c3
c16, C17r C18r ;nul
cl 5
c6
Step 7 Step 5 Step 4
c1, c2 c2 1
c19, ;nul
step 12 step 11 c11, c12
c5 Step 15
int2
c4
c14
int,
the entire system to an intermediate re pair facility. When diagnosis become too difficult or too many systems are sen back to the intermediate repair facility, i sends the system to a shop outside thc operational environment.
Because of this repair hierarchy, wc must develop three sets of fault isolatior procedures and several different faul trees for the operational environment The first set of procedures, for the inter mediate repair facility and activities tha are not remotely deployed, isolates to i level consistent with component repair The procedures are based on minimiz ing either skill level or time to isolate depending on personnel availability The second set of procedures, to bc used by remote activities, isolates to thc replaceable unit level and is optimizec for minimum skill level. The third set o procedures, for remote activities en gaged in operations, determines wheth er or not the system is ready for use.
Weighted fault trees for interme, diate repair. For intermediate repair o the case study, two isolation factors arc
important: skill level (designated by US military enlisted rank) and time.
In the field, an E7 may not be avail- able to assist with each fault isolation, so a diagnostic procedure should use per- sonnel of lower skill levels and call for an E7 only when needed. The first step in building a fault tree optimized forskill level is to assign skill-level weights to each test. For the case study, we assign the numeric values from the military skill-level designations, thus assuming a linear relationship between rank and skill level required for each test. If we b e lieve the linear assumption is incorrect or if it yields unsatisfactory results, we can mathematically emphasize the skill- level factor. We detailed the analytic process of integrating multiple optimiza- tion criteria into the diagnosis, including the use of emphasis factors, in part 5.
The not-needed analysis applies ap- propriate weights (in this case, skill- level) before tests are ranked. Table 2 provides the tree that results from weighting by skill level (listed after each test name). Note that the system can be verified to be operational by an E3 (that is, all tests on the No Fault path require skill levels of E3 or less). Note also that only steps 9 and 10 require high skill lev- els. Further, all the difficult tests occur at the end of diagnostic sequences. This tree requires completion of an average of 4.31 tests-a slight increase over the unweighted tree, which requires 4.0 tests to isolate.
Asecond fault tree is needed for oper- ational use when skill level is not a prob- lem (that is, when E7 personnel are available) but time is. In some cases, however, the time required to perform a test is a function of a number of factors. For example, performing several tests in one sequence may require less time than performing the same tests in a dif- ferent sequence. In that case, test time depends on previous tests performed. For timecritical applications, we may want to construct a matrix of test times as a function of previous tests. (Troy de-
82 IEEE DESIGN & TEST OF COMPUTERS
scribes the matrix approach to time, cost, and other factors.lO) In general, however, we define a time function in which test times depend on access pan- els that are already open, tools that are within reach, test equipment that has been set up, and so on.
For this article, we assume that a sim- ple time metric is sufficient. For the case study, we wish to construct a fault tree for the intermediate repair facility to which personnel resources are fully available. Therefore, we construct a tree
duce cost or weight. In manual diagno- sis, the source of unreliable test outcomes may be as simple as not hav- ing personnel with appropriate skill lev-
Table 3. Time-optimized fault tree for the case study.
of a problem although a problem actual- ly exists. We can address a false assur- ance by determining whether certain tests are failing to provide expected in-
I Test Previous Pass Fail i step (time) step outcome outcome
weighted for both test times and compc- nent failure frequencies so that the opti- mization goal is the minimum time to isolate the most frequently failing ele- ment. Table 3 shows the tree, with the test time for each test in parentheses. The expected time to fault-isolate is computed5 as 3.1 1 time units; actual isc- lationsvary between one and eight time units and require between three and six tests.
Protecting intermediate repair from improper diagnosis. Some skill levels may not be available in some ac- tivities. As a result, personnel with lower-than-desirable skill levels may perform tests. This situation can lead to false test indications (data misinterpret- ed or tests incorrectly performed). If we can determine when the fault isolation may be in error, we can default mainte- nance to the next level of repair. So far, we have assumed that tests are com- pletely reliable. For example, when we determine a test passes, the test really does pass. For a variety of reasons, however, the test may not be reliable. For example, to reduce the amount of code needed to support built-in test (BIT), we may have simplified the pro-
els. At the lower skill levels, we are not certain that test outcomes are being in- terpreted correctly or that the test is even performed correctly.
The false test indication discussed in the literature most frequently is the false alarm. (BIT false alarms and their impli- cations for maintenance are discussed in reports by Malcom and by Speny Cor- poration.IlJ2) The primary result of false alarms is wasted maintenance actions, including inappropriate repairs and in- appropriate system downtime. If mainte nance personnel repair the wrong unit, troubleshooting time will increase until the faulty unit is finally identified.
A second type of false test indication, rarely discussed in the literature but per- haps just as devastating, is the false as- surance. In a false alarm, we have an indication of a problem through im-
formation within the diagnostic process. Several solutions exist for improving in- dividual tests, including repeat polling and modified t01erances.I~
If the problem lies with the technician performing the tests rather than the tests themselves, we may wish to focus on verifying the conclusions being drawn. We can verify such conclusions by mod- ifying the search process to choose tests that focus on the drawn conclusion as a hypothesis. Hypothesis-directed search and entropy-directed search differ in one important aspect: entropydirected search does not presuppose any specif- ic conclusion, but hypothesisdirected search does.
To perform hypothesisdirected search, we examine the test-toconclusion matrix asshown in Figure 6 (next page). We now define two measures as follows:
1; (li depends on c j ) A ( c j E UF), 0; otherwise
a.. = I' {
JUNE 1993
I N T E G R A T E D D I A G N O S T I C S
I ! ! ! ! ! ! ! ! ! ! ! ! ! ! ! ! ! ! ! I c 7 l 0 l 0 1 0 1 0 1 0 1 1 I 1 I 1 I 1 I 1 I 1 I 1 I 1 I 1 I 1 I 1 I 1 I 1 1 o l o l
U1 r
where 6 is the number of conclusion nondependencies in t,.
These two measures are complemen- tary; that is, e, = IUFl - (. Hypothesis- directed search attempts to maximize the value of e, when the test does not d e pend on the hypothesis and to maxi- mize the value of ( when the test does depend on the hypothesis. Figure 6 shows how hypothesis-directed search works. In the figure, we have masked all nonunique fault isolation conclusions (see part 3 of our series for a detailed description of uniqueness) and comput- ed e, and 6 for the case study. To choose a test to verify the hypothesis, we need to mask out the irrelevant members of e, and (. We have done that for hypotheses of cg and c21 (examples 1 and 2, respec- tively). We can choose two types of tests that will verify the hypothesis in either a pass outcome or a fail outcome, but we
' typically choose the most robust test r e ~ gardless of its outcome. In processing c20 o ~ o / o ~ o / o ~ o ~ o / o ~ o ~ o ~ o / o 1 o 1 o / 1 j l j o ~ o ~ o / o
[I1 [ 'I e, = c (column value = 1 A cII E UF) and f, = (column value = 0 A cII E UF)
f, M w E@ N x x x x x >a x 3 2 I I 2 x K K t4failoutcome Example 2 for cZ1:
e, K 2 @) X X X X X X X X )4) X3 I4 15 K W X 1 1 t,passoutcome f 1 1 0 W W 8 @ 9 9 9 9 8 7 6 3 2 1 1 2 (Circled values are maximums in rows.)
Figure 6. Hypothesis-directed search data for case study.
e 1 6 2 4 x 6 7 7 7 7 8 9 @ ) M M X X M 7 1 1 6 - 9
9 iX iX&- ]
,=I where e, is the number of conclusion 1
mation source), c, is thejth fault isolation conclusion, and UF is the set of unique fault isolation conclusions; and
dependencies in t,, t, is the ith test (infor-
0; otherwise
the data, it is important that we mask out any conclusions not to be considered and any tests not to be chosen.
For the case study, we want to con- firm the outcomes of steps in a diagnos- tic sequence. We construct the fault tree, using weighted, entropy-directed search with the following exceptions:
The not-needed calculation is ex- cluded to prevent biasing the data. Entropy-directed search proceeds until it achieves an answer. At that point, the answer becomes the hy- pothesis, and we mask any tests that have already been completed. We then apply hypothesis-directed search in combination with depth- first search. We repeat the process for each fault isolation conclusion in the tree, thus adding one extra test to each diagnostic sequence. We can mod- i@ this procedure to include two or more extra tests by masking the ex- tra test and reapplying the hypothe sisdirected search.
84 IEEE DESIGN & TEST OF COMPUTERS
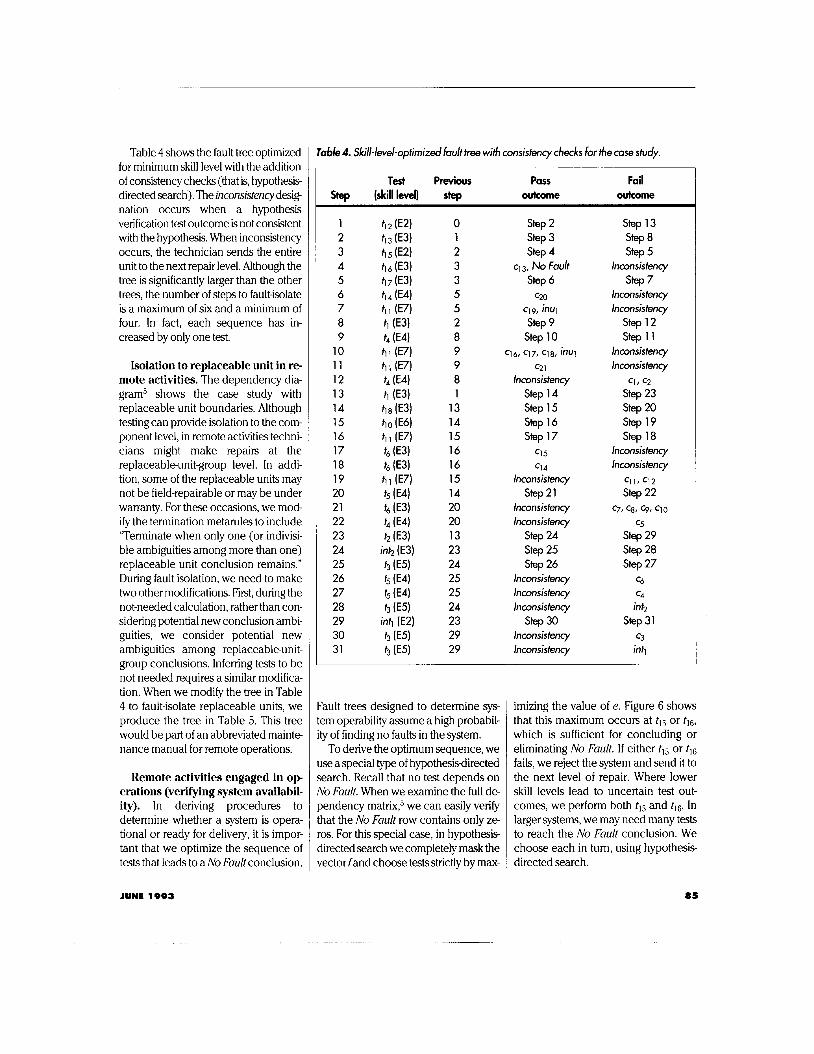
for minimum skill level with the addition of consistency checks (that is, hypothesis directed search). The inconsistency desig nation occurs when a hypothesis verification test outcome is not consistent with the hypothesis. When inconsistency occurs, the technician sends the entire unit to the next repair level. Although the tree is significantly larger than the other trees, the number of steps to fault-isolate is a maximum of six and a minimum of four. In fact, each sequence has in- creased by only one test.
Isolation to replaceable unit in re- mote activities. The dependency dia- gram5 shows the case study with replaceable unit boundaries. Although testing can provide isolation to the com- ponent level, in remote activities techni- cians might make repairs at the replaceableunit-group level. In addi- tion, some of the replaceable units may not be field-repairable or may be under warranty. For these occasions, we mod- ify the termination metarules to include “Terminate when only one (or indivisi- ble ambiguities among more than one) replaceable unit conclusion remains.” During fault isolation, we need to make two other modifications. First, during the not-needed calculation, rather than con- sidering potential new conclusion ambi- guities, we consider potential new ambiguities among replaceable-unit- group conclusions. lnferring tests to be not needed requires a similar modifica- tion. When we modify the tree in Table 4 to fault-isolate replaceable units, we produce the tree in Table 5. This tree would be part of an abbreviated mainte nance manual for remote operations.
Remote activities engaged in op erations (verifying system availabil- ity). In deriving procedures to determine whether a system is opera- tional or ready for delivery, it is impor- tant that we optimize the sequence of tests that leads to a No Fault conclusion.
Test Previous Pass Fail outcome Step (skill level) step outcome
Fault trees designed to determine sys- tem operability assume a high probabil- ity of finding no faults in the system.
To derive the optimum sequence, we use a special type of hypothesisdirected search. Recall that no test depends on No Fault. When we examine the full d e pendency matrix? we can easily verify that the No Fault row contains only z e ros. For this special case, in hypothesis- directed search we completely mask the vector land choose tests strictly by max-
imizing the value of e. Figure 6 shows that this maximum occurs at ti5 or tl6, which is sufficient for concluding or eliminating No Fault. If either t i 5 or tl6 fails, we reject the system and send it to the next level of repair. Where lower skill levels lead to uncertain test out- comes, we perform both t i 5 and tl6. In larger systems, we may need many tests to reach the No Fault conclusion. We choose each in turn, using hypothesis- directed search.
JUNE 1993 85
I N T E G R A T E D D I A G N O S T I C S
case study. As we discussed earlier, in several in-
Test Previous Pass Fail Step (skill level) step outcome outcome
i Penalize 3.0 time units 2 t4, tl0, tl 1
fl I f2, t3, t5 3 4 t6, t7, t8, t9,
t18r t12, h 3 r t14 Individual test, ungrouped I nd ividua I test, u ng rou ped
readable output jacks is located behind a skin panel fastened with 43 flush- mounted screws. When test sequences were developed for this subsystem, tests using the output jacks were placed in a test group. Accessing tests in that test group resulted in a time loss because the skin Dane1 first had to be removed. Ac-
0 1 2 3 3 5 5 2 8 9 9 8 1
13 14 14 13 17 18 19 19 18 22 22 17 25 25 -
step 2 Step 3 Step 4
rug, No Fault Step 6
rug, ;nu1 Step 9
Step 10 ry, rug, ;nu2
TU2
Inconsistency Step 14 Step 15
Inconsistency Step 18 Step 19 Step 20
Inconsistency
Step 23
Inconsistency Step 26
Inconsistency Inconsistency
rug
ru6
Inconsistency
Inconsistency
Step 13 Step 8
Inconsistency
Inconsistency Inconsistency
Step 12 Step 11
Inconsistency
TU1 I TU2
Step 17 Step 16
step 5
step 7
Inconsistency
ru6 Step 25 Step 22 Step 2 1 ru4, ru5
ru3 Step 24
ru3
Step 27 TU1
int2
int,
In a shop environment, different consid- erations may drive the development of fault trees. Forexample, although all nec- essary test resources are available in the shop, for work flow efficiency all tests r e quiring a certain skill level or common test equipment should be contiguous in the fault tree. A collection of tests with common factors is called a test group. Some test groups are easier to perform than others, and some may have penal- ties associated with their execution. Final- ly, some test choices are just too critical to be left to the computer.
Handling test groups. In the case study, we have defined four test groups, shown in Table 6. The tests in each group have some logical relationship to each other, such as requiring the same test equipment. Under ordinary fault is0 lation conditions, we would like to com- plete the tests in one group before proceeding to the next group. We ac- complish this as follows:
rn When we are not currently in a test group, we choose a test by using the normal optimization process.
rn When we are currently in a group and have not completed that group,
Table 6. Test groups for the case study.
Group
we restrict the test choice to the available tests in the group.
rn When we complete a test group, we then choose from among all re- maining tests or test groups. I
Not all tests are as desirable as others. For example, in the inertial navigation number Group members Comments
, I l
86 IEEE DESIGN & TEST OF COMPUTERS
cordingly, the test group would receive a time penalty weighting that would cause tests in the group to be delayed and in some cases avoided. Assuming the case study system requires a similar access panel to perform tests in group 2, we have placed a penalty of 3.0 time units on that group (Table 6).
Sequencing. In some cases, the com- puter should not determine the test se- quence. For example, we should perform tests designated “safe-to-turn- on” first, but optimization may fail to provide this sequencing. In the case study, we can assume that if we begin testing the system and the inputs are not present, we may damage the equip ment. Accordingly, we have designated a test group that includes the two inputs and directed that it must be completed first. This procedure is called group se- quencing. We can sequence all the groups in turn if we wish. In addition, there is a chance that testing int, first will cause an electrostatic discharge if int, is not valid. Therefore, within the group we have sequenced the tests so that int2 is chosen first. Sequencing of this type must be consistent with associated infer- ences (with a couple of exceptions).
Multiple failures. Growth in computational complexity prohibits the development of comprehensive multiplefailure fault trees. Nevertheless, in several cases, multiple failures are a significant problem in developing diag- nostic strategies. For the case study, let us consider two such multiple failures. In part 4 of this s e r i e~ ,~ we discovered that the potential for false indication due to a multiple failure was present in the system. That is, a combined failure of c1 and c5 or a combined failure of c2 and c5 could result in a diagnosis of cg. Suppose engineering analysis has revealed that failure of c, and c5 is indeed possible under certain conditions. We wish to in- clude this multiple failure in the fault tree, and we call the associated group
/
Figure 7. Multiple-failure mapping analysis for case study.
Failure 1. In addition, suppose that engi- neering analysis has determined that failure of ~ 1 4 may actually trigger failure of cpl and vice versa. We include this multiple failure as Failure 2. Although generating fault trees that include all multiple failures is intractable, we can include these specific multiple failures in the trees and in the testability analysis by mapping the multiple failures to sin- gle conclusions in the model.
We obtain the conclusion Failure 1 by combining all the elements of its two constituent parts (c1 and c5). In this case, testability analysis shows an ambiguity between the Failure 1 conclusion and the cg conclusion, which we should
have anticipated from the previous anal- ysis of false indications. To compensate, we add a special test, t,, which looks specifically for the multiple failure and nothing else. Analysis shows that Failure 2 is not a problem and is uniquely isolat- able with the current test set.
Figure 7 shows the complete remap ping of the test-toconclusion matrix for the two multiple failures, including tx. Once we have mapped the additional elements into the model, developing fault trees is straightforward. Table 7 shows the tree that includes these multi- ple failures. With all factors used, the tree requires between one and seven tests for resolution and an expected time
JUNE 1993 87
I N T E G R A T E D D I A G N O S T I C S
Table 7. Tailored fault tree table with test groups and test sequencing for the case study.
Previous Pass Fail outcome outcome Step Test step
1 2 3 4 5 6 7 8 9
10 11 12 13 14 15 16
~ 17
~
0 1 2 3 4 5 6 5 8 4
10 11 3
13 13 15 15
Step 2 Step 3 Step 4 Step 5 Step 6 Step 7
~ 1 3 , NO Fault
cl 6 , c17, c18, ;nu2 c2 1
Step 12
Step 14
Step 16 c6 c4
cl 5
c14
9, c8, c9, cl 0
int2 int,
Step 13 Step 10 Step 8
c19, ;nul c20
step 9 c1, c2
Step 11 Failure 2 Cl 1 I c12 Step 15
c5 Step 17 Failure I
c3
of 7.55 time units (including the penalty of 3.0 time units in seven of the 18 isola- tion sequences).
Special conditions for fault isolation
In some situations, we may wish to ovemde the inferences drawn in the in- ference engine, modify the way we pro- vide information, or tailor the rules to terminate isolation. The following para- graphs describe five basic types of over- rides, or special considerations.
A priori information (prior infer- ence). Before we begin diagnosis, we may have information about the failure. For example, a light indicating trouble with the oil may be illuminated, or cer- tain components may have just been checked and can be assumed good. In- corporating this information before fault isolation can reduce the search space and improve efficiency. Any informa- tion available should be processed by the inference engine before we develop
fault trees. Let us assume that the system is being evaluated at the depot, using calibrated input sources, and that these inputs are good. This results in a fault tree that does not include inputs either as tests or as conclusions.
Suppressed test inference. We saw earlier that one way to address the false- alarm problem is to assume the diagno sis was incorrect and choose additional tests, using hypothesis-directed search. A second way is to assume some testing is wrong. Because the outcomes of some tests may be determined by other tests, we may wish to force execution of certain tests, regardless of whether or not they can be inferred. These tests may be the most accurate, the most reliable, or the easiest to perform properly. We can place them in the tree, or we can suppress inference by the inference en- gine (thus forcing them to be tested).
es for inference. The model also in- cludes the capability to specify several types of linkages for inference outside the dependency matrix representation. Such linkages include:
w A fail test outcome, triggering pass inferences (for example, a light that indicates a failure also indicates a good light bulb and good voltage to the light) A pass test outcome, triggering fail inferences A fail test outcome, triggering an untestable test or tests (for example, unsafetc-test)
w A pass test outcome, triggering an untestable test or tests
We can derive these linkages directly from the inference metarules. Let us as- sume that a fail outcome of t4 renders t1 unsafe to test. This combination is the most frequently encountered and is closely related to the safetoturnan tests (normally handled as a test group and sequenced first in the diagnostic pro- cess). As a result, if t4 is evaluated, the subtree corresponding to t4’s failing will not include tl because the linkage caus- es tl to be inferred untestable.
Intermediate conclusions. Often during isolation, we wish to note progress or specific conclusions as we proceed. These intermediate conclu- sions exist in the model as tests. These tests are immediately declared untest- able, but if another value is assigned (through inference), then that value is reported. For example, we can define a test that depends on all conclusions designated cl to cIo, a test that depends on all conclusions designated cll to cgl,
and a test that depends on all the in- puts. We would then designate these three tests intermediate conclusions. The intermediate conclusions, then, would provide information about two
Linkages. Dependenciesspecified in halves of the system and about all the the model provide certain direct linkag- ~ inputs. An intermediate conclusion
88
.. .
IEEE DESIGN & TEST OF COMPUTERS
means several things to the inference engine:
rn The element is considered untest- able. The element is not to be counted during any optimization.
rn The element is to be announced whenever an inference rule deter- mines its state.
Any combination of elements can appear as an intermediate conclusion. In a complex avionics system, we can consider all warranty items with an inter- mediate conclusion. This construct pro- vides a means for arbitrarily including inferable information in the model with- out biasing the optimization process.
Multiple-outcome tests. So far, we have assumed that test outcomes are binary; that is, tests either pass or fail. However, entropy-directed depth-first search is fully capable of analyzing tests with multiple outcomes. Previous- ly, the backup from a pass outcome led to processing a fail outcome, and the backup from a failed outcome led to another backup in the tree. When mul- tiple outcomes are present, we stay with the individual node until all out- comes are exhausted. That is, on first arrival at a node, we proceed with the choice and assign the first outcome. When we arrive at an answer, we back up and examine the node, choose the next outcome (if available) in line, or back up further.
In the case study, we can assume that in field situations certain tests may not be performable (because of equipment or personnel shortage) and certain tests may be potentially untestable. Thus, the tests have three outcomes: pass, fail, and unknown. If outcomes other than pass and fail are used in a model, then we may have to modify the inference meta- rules and extend the matrix beyond bi- nary. Otherwise, the optimization process remains unchanged.
IN OUR DlSCUSUON OF THE CASE SnrDY, we derived five different fault trees for dif- ferent circumstances. The fault tree shown in Table 7 provides diagnostic se quences to be used in the shop; those in Tables 2,3, and 4 would be used in the operational environment; and the fault tree in Table 5 would be used with a spe cia1 checkout procedure in operational units engaged in remote operations.
A portion of fault tree development should be performed in concert with the testability analyses described in parts 3 and 4. Incorporation of false-alarm checks and multiple-failure diagnosis are two examples of the interaction be- tween fault isolation and testability anal- ysis. The modeling process allows us to answer what-if questions and develop tailored products such as technical manuals for integrated diagnostics.
This article concludes our presenta- tion of the basic concepts of the integrat- ed diagnostics modeling approach. We refer the reader to papers on several re- lated advanced topics not discussed here:
rn Performing interactive fault isola- tion: using the model to diagnose in a dynamically changing en~ir0nment.I~ Learning from actual isolations: modifying time, failure frequency, and other data, as well as learning relationships from diagnostic instance^.'^,'^
rn Reasoning under uncertainty: what to do when outcomes are not exact, technicians’ skill levels are in doubt, or other uncertainty factors are present. 7 ~ 1 8
rn Partitioning large systems and mod- els: Often, large systems translate to slow execution in a dynamic envi- ronment. Partitioning breaks the system into several sub model^.^^ Developing an architecture for intel- ligent, learning, adaptable, and mod- ifiable automatic test equipment?O
rn Tying system testing to logistics: pro-
viding for logistics feedback, includ- ing computer-aided logistics sup- port (CALS).21
rn Temporal factors: applying point- based and interval-based time constraints.22
Developing fault trees for actual, prac- tical diagnosis in an integrated diagnostic environment is a complex process. Con- sidering various ovemdes and constraints allows computation of a virtually infinite number of fault trees for any complexsy5 tem. Real fault trees may simultaneously invoke several of the factors we have dis- cussed. In fact, the development process most likely will require iterative design of the fault trees. Incorporating constraints and ovemdes in the model and algo- rithms will be necessaly to consistently generate practical diagnostic strategies that do not require manual manipulation by an expert. @k
Acknowledgments We thank the following people, without
whom we could not have produced this se- ries of articles: Colin Maunder, Leonard Haynes, Sharon Goodall, Les Orlidge, Sheryl Sieracki, Elizabeth Reed, Ken Wagner, and the editors of IEEE Design & Test. We also thank Jon &re, Brian Kelley, Jerry Graham, Steve Troy, Brian Pickerall, and the many others who helped us to develop concepts or to see the difference between theory and practice.
References 1. W.R. Simpson and J.W. Sheppard, “Sys-
tem Complexity and Integrated Diag- nostics,” IEEE Design & Test, Vol. 8, No. 3, Sept. 1991, pp. 16-30.
2. J.W. Sheppard and W.R. Simpson, “A Mathematical Model for Integrated Di- agnostics,”IEEED&T, Vol. 8, No. 4, Dec.
3. W.R. Simpson and J.W. Sheppard, “Sys- tem Testability Assessment for Integrat- ed Diagnostics,” IEEE D&T, Vol. 9, No. 1, Mar. 1992, pp. 4@54.
1991, pp. 25-38.
JUNE 1993 89
I N T E G R A T E D D I A G N O S T I C S
4. J.W. Sheppard and W.R. Simpson, “Ap plying Testability Analysis for Integrated Diagnostics,” IEEE D&T, Vol. 9, No. 3, Sept. 1992, pp. 65-78.
5. W.R. Simpson and J.W. Sheppard, “Fault Isolation in an Integrated Diagnostic Environment,” IEEED&T, Vol. 10, No. 1, Mar. 1993, pp. 52-66.
6. C.E. Shannon, “A Mathematical Theory of Communications,” Bellsystems Tech- nicalJ., Vol. 27, 1984, pp. 379423.
7. L. Breiman et al., Classification and Re- gression Trees, Wadsworth, Belmont, Calif., 1984.
9. F.I. Dretske, Knowledge and the Flow of Information, MIT Press, Cambridge, Mass., 1982.
10. S.R. Troy, Cost as a Matrix Input to STAMP, STAMP Tech. Note 266, Arinc Research Corp., Annapolis, Md., 1990.
11. J.G. Malcom, “BIT False Alarms: An Im- portant Factor in Operational Readi- ness,” Proc. Annual ReliabiliQ and Maintainability Symp. IEEE, Piscataway, N.J., 1982, p. 206.
12. Design Guide, Built-in Test (BIlJ and Built-in Test Equipment (BFE) for Army Missile Systems, Report TR-RL-CR-81-4, Sperry Corp., Minneapolis, Minn., 1981.
13. W.R. Simpson and J.W. Sheppard, “Analysis of False Alarms During System Design,” Proc. IEEENat’lAerospace Elec- tronics Conf , IEEE, Piscataway, N.J., 1992, pp. 657-661.
14. J.W. Sheppard and W.R. Simpson, “ln- corporating Model-Based Reasoning in Interactive Maintenance Aids,” Proc. IEEE Nat’l Aerospace Electronics Conf ~
IEEE, Piscataway, N.J., 1990, pp. 1238- 1243.
15. J.W. Sheppard and W.R. Simpson, “Ele- ments of Machine Learning in a Field Diagnostic Maintenance Aid,” Proc. Artificial Intelligence Applications for Ac- quisition Management, Logistics Man- agement, and Personnel Management C o d , American Defense Preparedness Assoc., Williamsburg,Va., 1992, pp. 7-13.
pp. 81-106.
16. J.W. Sheppard, “Explanation Based Learning with Diagnostic Models,” IEEE Autotestcon Conf Record, 1992, pp. 159 167.
17. J.W. Sheppard and W.R. Simpson, “Un- certainty Computations in Model Based Diagnostics,” IEEE Autotestcon Conf Record, 1991, pp. 233-242.
18. J.W. Sheppard and W.R. Simpson, “A Neural Network for Evaluating Diagnos- tic Evidence,” Proc. IEEE Nat’l Aerc- space Electronics Conf, 1991, pp.
19. W.R. Simpson and J.W. Sheppard, “Par- titioning Large Diagnostic Problems,” IEEEAutotestcon Conf Record, 1991, pp. 329327.
20. W.R. Simpson and J.W. Sheppard, “An Intelligent Approach to Automatic Test Equipment,” Proc. Int’l Test Cod , IEEE Computer Society Press, Los Alamitos, Calif., 1991, pp. 419426.
21. A.B. Blair, J.W. Sheppard, and W.R. Simpson, “A Partnership for Systems Support: Artificially Intelligent Mainte nance Aids and CAE,” Logistics Spec- trum, J. o f Sociey of Logistics Engineers, Vol. 26, No. 3, Summer 1992, pp. 1926.
22. J.W. Sheppard and W.R. Simpson, “Fault Diagnosis Under Temporal Constraints,” IEEEAutotestcon Conf Record, 1992, pp.
71 7-724.
151-159.
analyst in the Advanced Research and Development Group at Arinc Research Cor- poration. He is also a PhD candidate in com- puter science at Johns Hopkins University. His research interests include applying AI techniques to fault diagnosis, machine learning, neural networks, and knowledge representation. He was a principal deve!op
er of Pointer, an intelligent, interactive maintenance aid, and assisted in the devel- opment of a prototype expert system that diagnoses system failures and reconfigures the system to maintain functioning. He holds a BS from Southern Methodist University and an MS from Johns Hopkins University, both in computer science.
William R. Simpson, a research fellow in the Advanced Research and Development Group at Arinc Research Corporation, works on testability and fault diagnosis. He helped develop the System Testability and Mainte nance Program, which is based on an infor- mation flow model. He was also a principal developer of the Pointer interactive mainte nance aid. He holds a BS from Virginia Poly- technic Institute and State University and an MS and a PhD in aerospace engineering from Ohio State University.
Direct questions or comments on this article to the authors at Arinc Research Corp., Advanced R&D Group, 2551 Riva Rd., Annapolis, MD 21401; [email protected] or [email protected].