Recently, several studies employed video displays to favor the magnocellular pathway in either glaucoma patients (Fitzke et al., 1987, 1989; Silverman et al., 1990; Watkins & Buckingham, 1991; Joffe et al., 1991; Bullimore et al., 1993; Trick et al., 1995; Johnson et al., 1995; Scholl & Zrenner, 1995; Wall et al., 1995), or ocular hypertension patients (Fitzke et al., 1987, 1989; Watkins & Buckingham, 1991; Trick et al., 1995; Johnson et al., 1995; Scholl & Zrenner, 1995). The results indicated that glaucoma and glaucoma-suspect eyes with normal visual field sensitivity sometimes have defects in motion sensitivity. Testing motion perception with random-dot kinematograms, one of the methods previously employed reduces possible interactions with other visual systems such as form perception, and limits the observer's ability to make displacement judgments or direction discriminations based upon positional or orientational cues (Nakayama & Tyler, 1980).
Using a random-dot kinematogram, Silverman et al. (1990) found a 70% elevation of foveal motion coherence thresholds in primary open-angle glaucoma patients and a 44% elevation in ocular hypertensives when compared to age-matched normal controls. Trick and colleagues (Trick et al., 1995), found significant elevations in glaucoma patients' motion thresholds for both low (4.2 deg/sec) and high (12.5 deg/sec) velocity random- dot kinematograms. Bullimore and colleagues (Bulli-
*Glaucoma Center, Department of Ophthalmology, University of California at San Diego, La Jolla, San Diego, CA 92093-0946, U.S.A.
tTo whom all correspondence should be addressed.
more et al., 1993), found that 10 of 15 glaucoma patients had dmin values outside the normal range, but that coherence thresholds and dmax did not discriminate between normals and patients. They also noted that patients suspected of having glaucoma were not sig- nificantly different from normal controls on any of their dependent measures: drain, dmax, or coherence thresholds.
These studies found that results with random-dot kinematograms, while promising as early diagnostic tools, showed considerable overlap between glaucoma patients and normal controls (Bullimore et al., 1993). This overlap might be the result of utilizing large fields of random-dots which would allow both normal and pathologic regions of the visual field to contribute to glaucoma patients' motion percept. Consistent with this view, studies using stimuli designed to test discrete retinal locations indicate that glaucoma patients do have specific locations of marked sensitivity loss (Joffe et al., 1991; Bosworth et al., 1997; Wall et al., 1995; Johnson et al., 1995). These defects, while usually more expansive with motion perimetry, have further been found to correlate with standard automated perimetry field results (Wall et al., 1995). If the overlap is due to the use of too large a field of random dots, then the presentation of smaller display regions at discrete eccentric locations might maximize the sensitivity of motion threshold perimetry.
Of additional clinical relevance, it has been demon- strated that motion perception is very resilient to the confounding influences of blurring, cataract, and pupil size. Trick et al. (1995) manipulated image blurring with trial lenses which varied in power from 0.0 to 8.0 D. They found that optical induced blurring had little effect on
1Q~Q
1990 c.F. BOSWORTH et al.
motion thresholds for contrasts ranging from 15.6% to 41.3%. Blur of +6 D or more produced no significant threshold elevation in their 41.3% contrast condition. In a second manipulation, they placed an opaque contact lens over their observers' test eye with a 1 mm pupil and found that thresholds were not significantly affected. Reduction in the amount of light reaching the retina has also been found to have little effect o n dmi n measures. Turano & Wang (1992) using neutral density filters varied luminance levels over a 40-fold range and found that dr.i, changed only by a factor of 2.
The aim of the current study was to determine if a clinically feasible perimetric motion test discernible primarily by the motion pathways can differentiate among normal, glaucoma, and glaucoma-suspect eyes. Its sensitivity to glaucoma was then compared to the sensitivity of a larger foveally presented target. Addi- tionally, the patients' coherence thresholds from the perimetric motion test were correlated with their standard automated perimetry visual field results.
METHODS
Subjects
Subjects for this study were primary open-angle glaucoma patients (n -- 19), patients suspected of having primary open-angle glaucoma (n =31 ) , and normal controls (n = 30). Primary open-angle glaucoma patients were defined by the following criteria: (1) open angles with abnormal optic discs based on cup/disc asymmetry between the two eyes of 0.2 or more, localized rim defects, disc hemorrhages, or vertical cup/disc>0.6 with excavation determined by indirect ophthalmoscopy through dilated pupils; (2) intraocular pressure greater than 24 mmHg on at least two occasions; and (3) previously documented characteristic standard visual field loss determined by program 24-2 using a Humphrey Visual Field Analyzer 640, with corrected pattern standard deviations outside 95% confidence limits or glaucoma hemifield test results outside the 99% con- fidence limits. Patients suspected of having primary open-angle glaucoma met all of the above criteria except they had normal standard visual fields. Normal controls met the following inclusion criteria: (1) normal optic discs based on the above criteria; (2) no family history of glaucoma; (3) intraocular pressures <21 mmHg; and (4) normal standard visual fields, with corrected pattern standard deviations within 95% confidence limits or glaucoma hemifield test results within normal limits.
For this study, reliability indices were set at 25% or less for fixation losses, false positive errors, and false negative errors. The glaucoma and normal eyes were not significantly different in age, but the glaucoma-suspect eyes were significantly younger than the glaucoma eyes. Mean ages ( ± S D ) were 67.1 _+ 2.4 yr for the glaucoma group, 60.6 __+ 1.9 yr for the glaucoma-suspect group, and 64.1 + 1.9 yr for the normal control group. The normals ranged in age from 45 to 80 yr. Each normal had a glaucoma patient within 3 yr of his or her age. This study
50% Coherence 100% Coherence
t=ogL
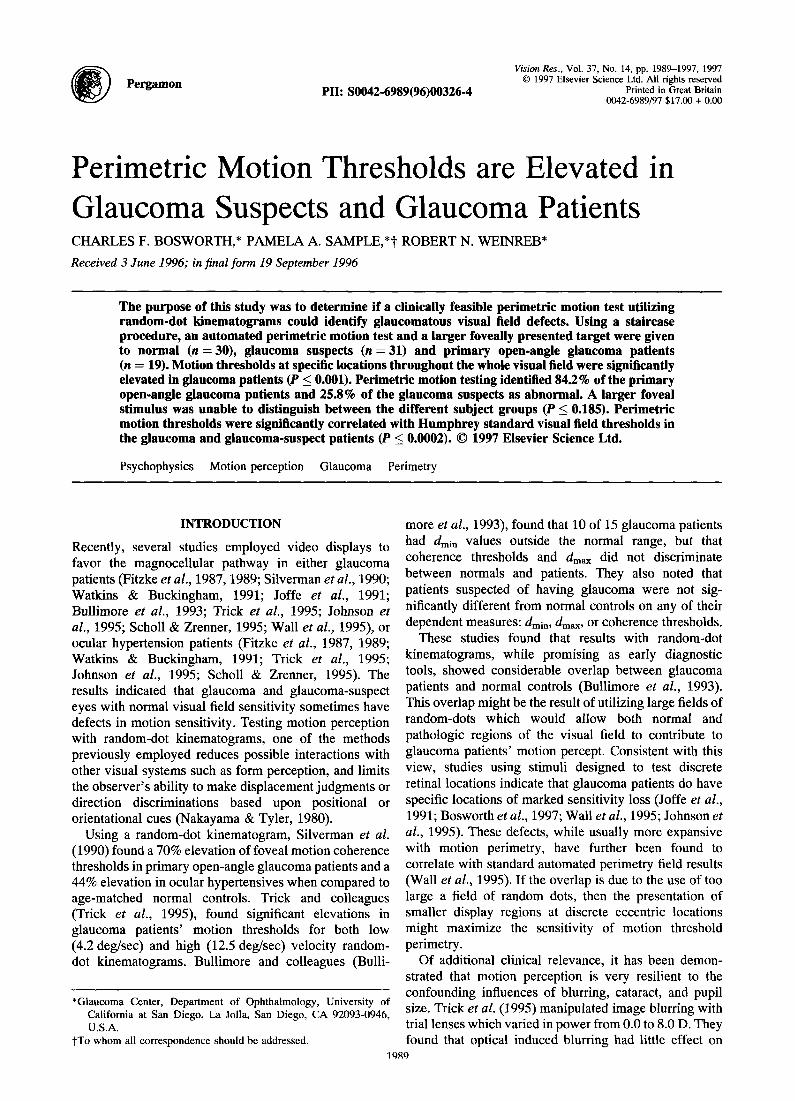
FIGURE 1. The motion stimulus used in our display with cxamples showing the percentage of dots moving coherently at 50% and 100% coherence levels. The black symbols show dot position in frame one. the white symbols show dot position in frame 2, with white arrows showing shift in position for coherent dots and black arrows showing
shift in position for random dots.
was approved by the Human Subjects Committee of the University of California, San Diego and was undertaken with the understanding and consent of each subject.
Random-dot motion display
The motion stimulus was produced on a Barco CCID monitor with 1024 x 768 lines of resolution and a refresh rate of 75 Hz. Each pixel subtended 0.31 mm (7.35 min of arc at the viewing distance of 16.5 cm). The monitor was driven by a Power PC 8100 Macintosh computer using a Raster Ops 24xli video card.
Seven frames were shown in rapid succession to create the motion stimulus. Within each of these frames, 20 dots were randomly placed within a circular test region of 7.3 deg of visual angle. These dots moved at a constant velocity of 8.2 deg/sec in random directions to create "noise." A percentage of the dots was then displaced together in one of four cardinal directions (right, left, up, down) to create the coherent motion signal which the patients were to detect. The randomly chosen signal dots remained the same for all seven frames of the display and had the same spatial displacement as the noise. While it has been reported that this could create streaming for signal dots positioned on a flickering noise which is randomly positioned each frame (Falzett & Lappin, 1983), Watamaniuk et al. (1995) demonstrated that a signal of this nature embedded in a surround of vectored motion is not significantly influenced by non-motion cues. The signal ranged in strength from 0 to 100% coherence. See Fig. 1 for what a 50% and 100% signal random-dot kinematogram would look like. Thresholds were determined by means of a staircase procedure. Staircases began with a coherence value of 80% and a step size of 20% coherence. Each staircase reversal resulted in a halving of the step size down to the minimum of 5% coherence. The staircase was terminated by three reversals at the minimum step size. Threshold was taken as the mean of the last three reversal points.
Because early glaucoma is often characterized by localized, peripheral visual field loss, we designed the perimetric motion stimulus to test 14 retinal locations and to stimulate the short-range motion pathways. The test locations were arranged in a pattern which mapped the
MOTION PERCEPTION IN GLAUCOMA 1991
(Patient #4)
18~s
18
31
28 32
3 0 t~
0 y 3; 24
"22 29 2~
24 30 ,.~;..;.. I O S.D. above normal O1 S.O. above normal J C) within I S.D. of normal
3 0 o
i ...... iii
.~.-'-.:... iii'
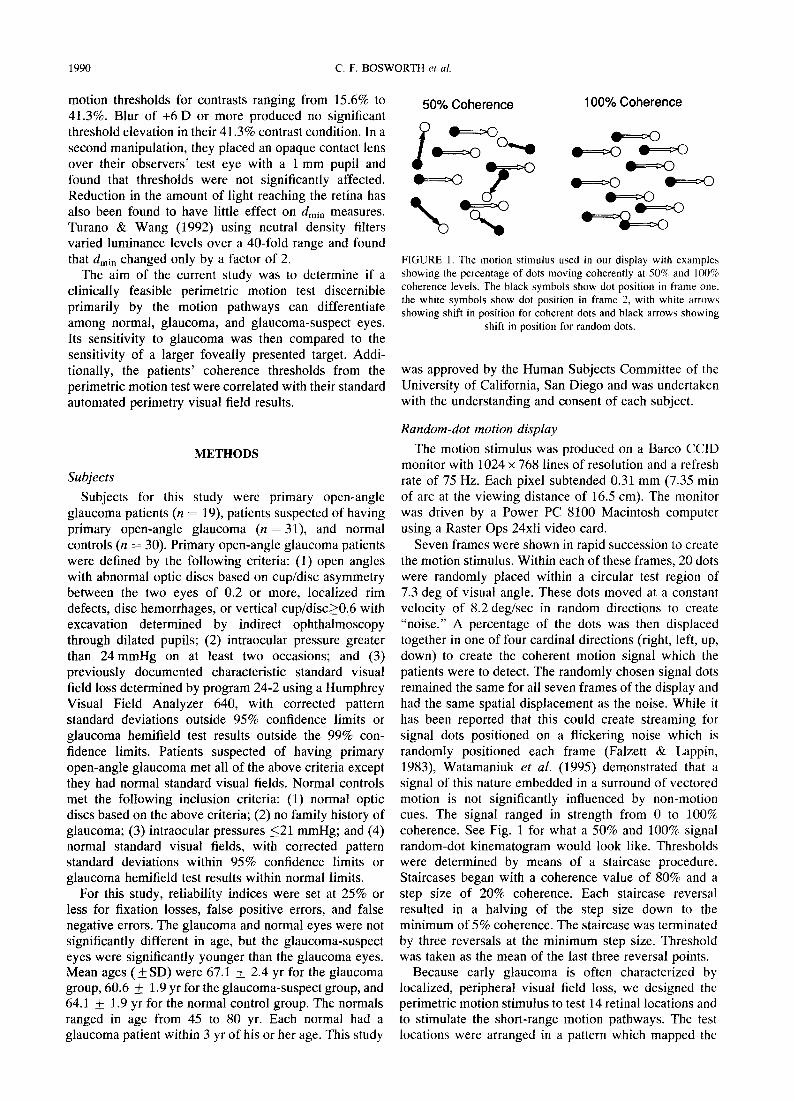
FIGURE 2. An example of Humphrey program 24-2 visual field results for one subject showing the actual threshold values in numeric dB (left) and the gray scale (right). Motion coherence thresholds are superimposed over the gray scale to show the test locations. The number at the origin is threshold for the foveally centered stimulus which was actually much larger than is depicted (diameter 25.1 deg). The remaining 14 are in the correct scale and show threshold values from the perimetric motion
test for this patient.
subject's motion thresholds across the central 24 deg of visual field in under 15 min (Fig. 2). The locations of test were chosen to catch peripheral arcuate type defects and to match up with Humphrey 24-2 testing locations.
Stimulus parameters for the perimetric procedure were selected based on findings from a variety of laboratories (Braddick, 1974; McKee & Nakayama, 1984; Williams & Sekuler, 1984; Baker & Braddick, 1985a,b; Bischof & Groner, 1985; van de Grind et al., 1987; Derrington & Goddard, 1989; Snowden & Braddick, 1989; Satoshi & Cavanagh, 1990; Nawroot & Sekuler, 1990; Cleary & Braddick, 1990; Snowden & Braddick, 1991), and we verified the effectiveness of these parameters for stimuli placed within the central 30 deg visual field (Bosworth et al., 1997). Therefore, the parameters of the current stimulus were within known ranges for testing the motion system while still allowing glaucoma patients with impaired vision to perceive the display. The stimulus parameters were as follows.
Stimulus contrast. The area surrounding the circular test region was a uniform gray background rather than one filled with random noise, because the latter may test regions larger than those defined by the target (Nawroot & Sekuler, 1990). The uniform gray background had a luminance of 26.43 cd/m 2. The dot luminance was 59.23 cd/m 2 giving a contrast of 38.3%. This contrast is below an upper cut-off of 50%, above which visual persistence can impair motion perception in a 7-frame display (Cleary & Braddick, 1990; Derrington & God- dard, 1989), and it is above a contrast level of 30%, below which motion perception exhibits contrast dependence (van de Grind et al., 1987).
Region size. We chose a region size of 7.3 deg because it can cover 4 points on program 24-2 and because field size must be greater than 2.5 deg. in diameter for our displacement value of 29.4min of arc (Baker &
Braddick, 1985a). A foveal field size of 2.5 deg or larger includes dmax values greater than 29.4 min of arc owing to the recruitment of eccentric motion detectors (Baker & Braddick, 1985a). dmax is the maximum displacement over which coherent motion can be perceived.
Number of frames. A stimulus comprised of 7 frames creates six dot displacements, which is within the opti- mum range of 4-6 displacements (Snowden & Braddick, 1989).
Frame duration. The optimum exposure time per frame is between 10 and 80 msec (Baker & Braddick, 1985b). We chose an exposure time of 60 msec.
Inter-stimulus-interval (ISI). An ISI of zero prevents motion reversal, that is reporting movement in the correct plane, but opposite direction (Satoshi & Cavanagh, 1990).
Dot size. A dot size of 29.4 min (4 pixels) was large enough for patients to accurately see the display in the peripheral visual field.
Dot density. Dot density was set at 0.83 dots/deg to reduce the likelihood of mismatching (Williams & Sekuler, 1984). The lower probability of mismatching in the current stimulus allowed us to use larger dot sizes and displacements to facilitate testing patients with reduced vision in the peripheral field. This density gave 20 dots per stimulus.
Dot displacement size. Braddick originally proposed that dmax was 15 min of arc for short-range apparent motion at the fovea (Braddick, 1974). Other studies later showed higher dma x values with increasing eccentricity (Baker & Braddick, 1985a,b; McKee & Nakayama, 1984). Our previous work showed a 4 pixel displacement (29.4 min of arc) generated the lowest average threshold across the tested retinal locations (Bosworth et al., 1997)
Avoiding grating cues at high coherence levels. Visual persistence can affect motion perception by causing
1992 C.F. BOSWORTH et al.
TABLE 1. The parameters involved in motion displays showing the optimum ranges reported in the literature or determined by pilot studies, and the actual settings chosen for this motion automated
perimetry test
Parameter Optimum range Settings
Dot displacement Pilot study 29.4 min of arc Contrast 30%<×<50% 38.3% Frame duration 10 msec<×<80 msec 60 msec Number of steps 4<×<6 6 steps 1SI ~Zero ~Zero Dot density < 1.6 dots/deg 0.83 dots/deg Dot size & number Pilot study 29.4 rain arc & 20 dots Region size > 2.5 deg 7.3 deg Viewing distance Refraction available 16.5 cm Coherence range Independent variable 0-100% Coherence
alpha-stripes (Cleary & Braddick, 1990; Snowden & Braddick, 1991; Bischof & Groner, 1985). Alpha-stripes (Snowden & Braddick, 1991) are illusions which occur when a dot travels repeatedly over the same path generating the perception of stripes. To avoid alpha- stripes, the dots were displaced perpendicularly to their direction of movement as they wrapped around the screen. In addition, a larger dot displacement and a smaller display size helped break down this alpha- striping effect because a large number of dots wrap around during each stimulus presentation. For a summary of the current testing parameters and the optimal ranges suggested in the experimental literature see Table 1.
The foveally centered stimulus subtended a circular region 25.1 deg in diameter with a dot density identical to that used in the smaller perimetric displays. All other parameters remained the same.
and were specifically designed for the viewing distance we used. They are 5 cm in diameter, which reduces the risk of vignetting in the peripheral visual field and, in contrast to conventional lenses, are convex--concave to improve overall image quality (Frisen, 1993).
The subject focused on a black fixation "x" in the center of the display and adapted for 2 min to the background illumination. During this time, a camera was focused on the test eye so that fixation could be monitored by the test administrator on a separate video display system. Trials where fixation was lost were aborted and retested later in the program. The testing procedure was then explained to the subject.
The session began with a foveal practice test which was identical to the foveally centered stimulus. The patient 's performance on these trials was observed by the test administrator to make sure that the patient properly understood the task. After completing the foveal practice, the patients either received the larger foveal test or the perimetric motion test. The order of presentation for the two types of motion stimuli was randomized.
For all testing, the subject reported which direction (left, right, up, down) he/she thought the dots were moving in a four alternative forced-choice paradigm. The test administrator pressed an arrow key corresponding to the direction indicated by the subject. The patient could respond at any time during the stimulus presentation or at the end of the presentation. The program gave a 2 sec delay before presenting the next stimulus. Subjects were informed that they could pause and rest at any time during the test. The whole procedure lasted approxi- mately 30 min and only one randomly chosen eye was tested for each subject.
Test procedures
The subject sat in a darkened room with a patch placed over the non-test eye. The subject 's chin rested in a chin rest while he/she viewed the screen through proper refraction for the test distance of 16.5 cm. The lenses used in this study incorporated a + 6 D spherical correction which would normally induce optical distor- tion in the peripheral parts of the visual field. This optical effect was minimized by utilizing lenses which were designed for high pass resolution perimetry, another computer-based visual field test, by Ophthimus High- Tech Vision in Malmo, Sweden. These lenses produce less aberration across their diameter than normal lenses
Statistics
Analysis of variance was performed on all dependent measures to indicate if a significant difference existed in motion thresholds among the normal, suspect, and glaucoma eyes. If a significant difference was indicated, a Tukey-Kramer Honestly Significant Difference test was performed to localize the effect. Pearson's r was computed for all correlations between motion coherence thresholds and standard visual field results.
RESULTS
Glaucoma patients' motion coherence thresholds were
TABLE 2. Glaucoma, glaucoma suspect, and normal subjects' mean motion coherence thresholds (± SEM) for the larger foveally centered stimulus, the perimetric threshold values averaged across the 14 test points (whole field), the perimetric threshold values averaged across the 7
superior field test points (superior field), and the perimetric threshold values averaged across the 7 inferior field test points (inferior field)
Subject Foveal location Whole field Superior field Inferior field
The P value for each comparison is listed at the bottom of each column *Significantly different from normal and suspects. tSignificantly different from normal.
MOTION PERCEPTION IN GLAUCOMA 1993
elevated at specific locations throughout the visual field (F = 18.0, P<0.0001). Additional pairwise comparisons indicated that glaucoma suspects were not different from normals on any of the dependent measures while the glaucoma group had significant elevations in motion thresholds for the whole visual field, the inferior hemifield, and the superior hemifield. The larger foveally fixated stimulus was unable to differentiate these same
glaucoma patients or glaucoma suspects from normals (F = 1.7, P<0.185) (Table 2).
Although motion automated perimetry did not differ- entiate suspects as a group, 25.8% of the glaucoma- suspect eyes were abnormal on the exam. An abnormal field was defined as having three or more motion threshold values at least two standard deviations above normal threshold, with at least two of the abnormal points
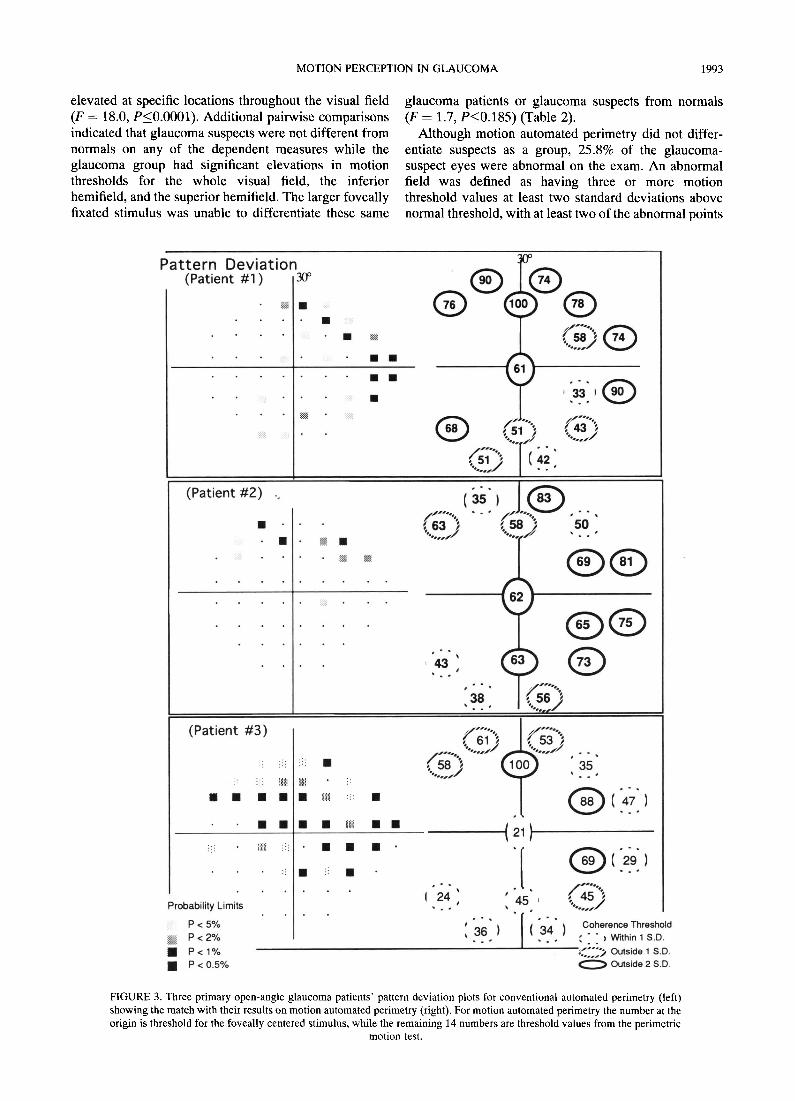
' a t t e r n D e v i a t i o n (Patient #1 ) 30 °
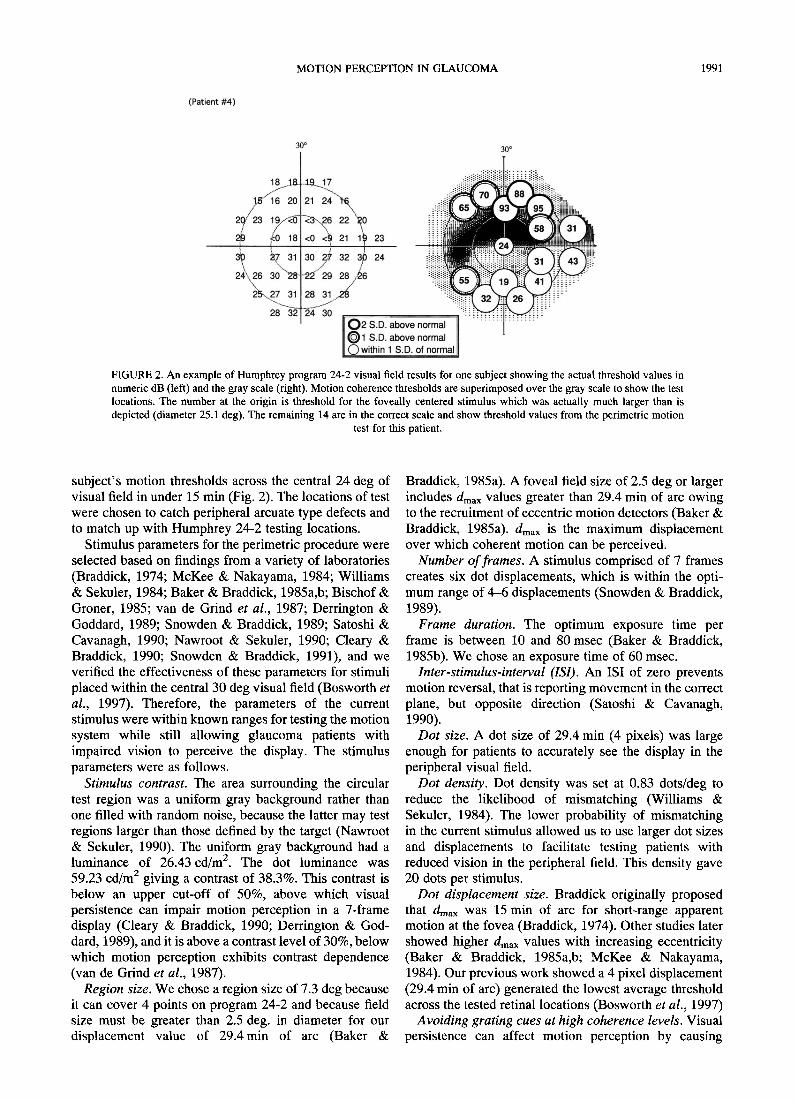
FIGURE 3. Three primary open-angle glaucoma patients' pattern deviation plots for conventional automated perimetry (left) showing the match with their results on motion automated perimetry (right). For motion automated perimetry the number at the origin is threshold for the foveally centered stimulus, while the remaining 14 numbers are threshold values from the perimetric
motion test.
1994 C.F. BOSWORTH e t al.
adjacent to each other. This is a conservative definition since three motion locations would cover at least eight standard field locations. These field criteria identified 84.2% of the glaucoma eyes and 0% of the normal eyes as abnormal.
Individual patient data are shown as illustrations in Fig. 3. Glaucoma patients 1 (top) and 3 (bottom) show a good correspondence between Humphrey standard visual fields
and motion automated perimetry results. Patient 2 (middle) shows a more extensive superior arcuate defect than is present on standard automated perimetry.
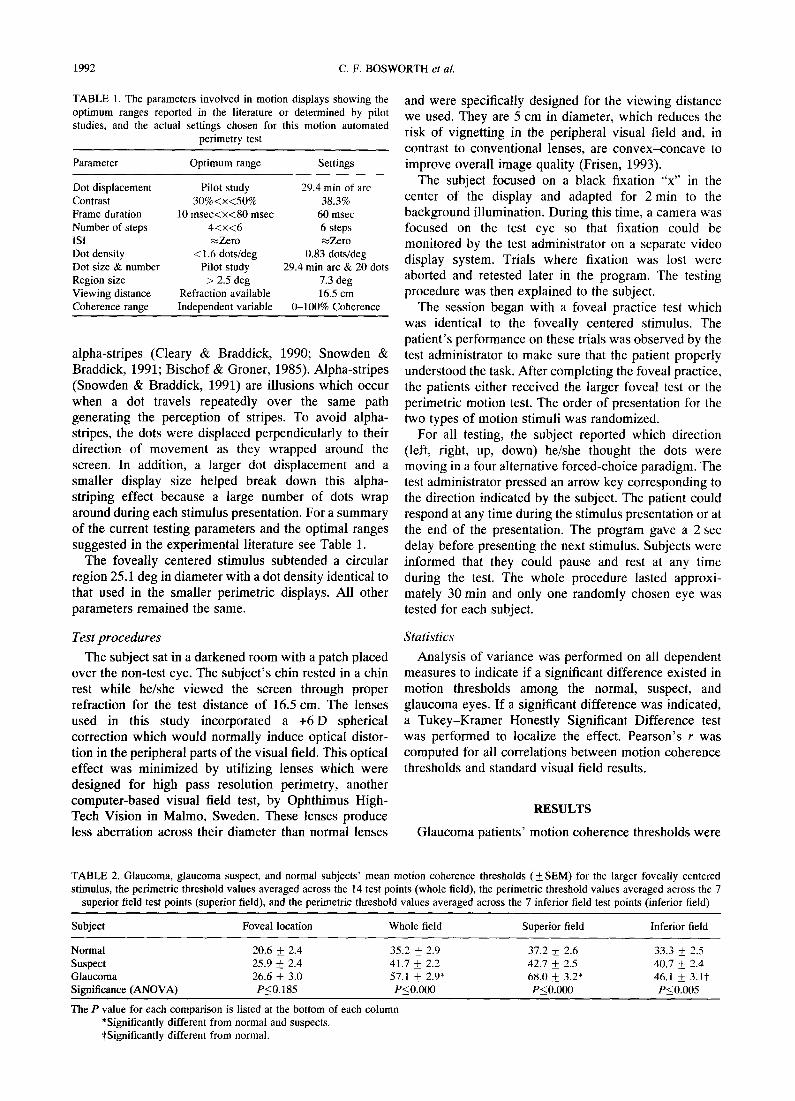
Figure 4 shows the results for three patients suspected of having primary open-angle glaucoma. All three patients' Humphrey standard visual fields were normal while their motion automated perimetry results showed clear defects. Patient 5 (top) shows two localized defects,
Pattern Devia t ion (Patient #5) 3o°
(Patient #6 )
:.o ) % :
( i f" . , ',i= ' • - °£ .~ ,J , . . ,
25 1 • . •
1 7 J
, ~ , , )
I
(~ ) ";g' " @
• s T ?
' ®
1 37
° .
39 , ° .
,~., ,(;;"~ *, % o . ~ i . J
I
~,62 "~
(Patient # 7)
Probability Limits
P < 5% P < 2 %
• P<1% • P< o.5%
f 6"2""~ . . . . ' . . . . . " .~/
(~j".., ( ....... / % • /
f . . . . "., " ,. 582 ( 5 ; " ' ,
®(.., ' 1 27
Q ~f.,jBsss~.
~60~, "ooL.,~
( C " ..... ' ~ 47~ l °°t oho/~ence Threshold
...... / ~ : ~ > o=, i~, 1 s . D Outside 2 S.D,
FIGURE 4. Three glaucoma suspects' pattern deviation plots for conventional automated perimetry (left) showing the match with their results on motion automated perimetry (right). For motion automated perimetry the number at the origin is threshold
for the foveally centered stimulus, while the remaining 14 numbers are threshold values from the perimetric motion test.
MOTION PERCEPTION IN GLAUCOMA " 1995
one superior and one inferior. Patients 7 (bottom) and 6 (middle) show more extensive arcuate defects.
It should be noted that in Figs 3 and 4 Pattern Standard Deviation (PSD) was used for the comparison to motion threshold values. We have chosen to use PSD because it accounts for general reduction in sensitivity which can be due to optical factors, such as blurring, cataract, and pupil size, rather than indicative of glaucomatous damage. While at first this may seem to give an unfair advantage to motion perimetry, it should be noted that motion perception is very resilient to the confounding influences of blurring, cataract, and pupil size (Trick et al., 1995; Turano & Wang, 1992). PSD accounts for these con- founds on Humphrey standard visual field results making it more likely that the results are due to glaucomatous damage and thereby more comparable to motion perimetry.
Secondly, Humphrey utilizes a database of several hundred normal patients while motion perimetry utilizes the normative data from the 30 normal controls. To ascertain that our results were not driven by this difference, we computed our correlations between motion per•merry and standard per•merry using the normative database of 30 and Humphrey's normative database for the standard visual field results.
A significant correlation between the glaucoma and glaucoma-suspect patients' Humphrey standard visual field mean defect and their motion automated perimetry mean defect was found using Humphrey's normative database ( r 2 : 0.25, P < 0.0002) (see Fig. 5). The correlation between motion automated perimetry mean defect and Humphrey standard visual field mean defect, when the normative database of 30 was used to compute both, remained significant (r 2 : 0.18, P < 0.0023). Mean defect is a difference from normal score averaged across the locations of testing. Therefore, a positive score represents performance better than the normals while a negative score represents performance worse than the normals.
Because the glaucoma eyes were on average 3.0 years older than the normal eyes, correlations between age and motion coherence thresholds on the normal controls were computed to ensure that the observed group differences in motion coherence thresholds could not be accounted for by an effect of age. No significant correlations were found between age and any of the dependent measures: foveal stimulus, superior visual field average, inferior visual field average, or whole visual field average (r 2 : 0.0013, P < 0.7548; r 2 : 0.0331, P < 0.1063; r 2 : 0.0011, P < 0.7654; r 2 : 0.0151, P < 0.2549). An additional analysis was conducted by comparing the performance of normals younger than 60 years of age (n : 8) with those older than 60 years of age (n : 22) on the same dependent measures: foveal stimulus, superior visual field average, inferior visual field average, or whole visual field average (t : 0.44, P < 0.6604; t---0.10, P < 0 . 9 1 8 1 ; t : 0 . 8 3 , P < 0 . 4 1 1 3 , and t = 0.46, P < 0.6466). No effect of age was indicated using either measure.
15
¢l) 0~ a - 2
O
ii • • l l
~°~o .;o ; ,'o
Conventional Perimetry Mean Defect (dB)
FIGURE 5. Correlation between the mean defect on conventional automated perimetry and the mean defect on motion automated perimetry across the glaucoma and glaucoma-suspect eyes (r 2 =- 0.25,
P < 0.0002).
DISCUSSION
Evidence indicates that random-dot kinematograms are processed primarily through the larger diameter magno- cellular retinal ganglion cells (Shapley et al., 1981; Livingstone & Hubel, 1988; Schiller & Malpeli, 1987; Schiller et al., 1990a,b). Therefore, two justifications for developing motion tests rather than other psychophysical procedures have been advanced. Histological reports of selective damage to larger optic nerve fibers lead Quigley et al. (1987) to conclude that glaucoma must selectively damage the magnocellular optic nerve fibers because they have, on average, the largest diameter (Quigley et al., 1987). However, as Johnson (1994) points out, the results upon which this conclusion are based show an "overall amount of loss present for all optic nerve fibers irrespective of their diameter".
This leads to a second justification for motion testing. All visual functions may be compromised by glaucoma, with some functions compromised more than others depending on the individual. Consistent with this, tests designed to favor either the parvocellular or the magnocellular systems have indicated threshold eleva- tions in glaucoma and/or glaucoma-suspect eyes (Sample & Weinreb, 1990, 1992; Sample et al., 1993, 1994; Johnson et al., 1993a,b; Frisen, 1993; Tyler, 1981; Casson et al., 1993; Tyler et al., 1994; Drum et al., 1987). Thus, a battery of tests which favor different visual functions may be needed for early detection of glaucoma across patients. Regardless of which theory is correct, either provides justification for continued investigation into the effects of glaucoma on motion perception.
Using random-dot kinematograms to investigate mo- tion processing in glaucoma has value because lesion studies do indicate that random-dot displays can isolate the magnocellular pathway when the parameters are
1996 C.F. BOSWORTH et al.
chosen appropriately. The best evidence for this comes from primate studies where magnocellular and parvocel- lular lesions have been induced in the lateral geniculate nucleus (LGN). Magnocellular lesions in the LGN of primates have been found to obliterate motion perception for a group of dots (embedded in a field of dots) moving at a velocity of 6.5 deg/sec (Schiller et al., 1990a,b). This finding, however, must be tempered by another which found that motion perception for grating targets can survive lesions to the magnocellular LGN under certain conditions (Merigan et al., 1991). Merigan and collea- gues explain their findings in terms of two overlapping mechanisms with differing spatiotemporal sensitivities: the parvocellular system, able to perform direction discriminations for lower temporal and higher spatial frequencies, and the magnocellular system, able to perform direction discriminations at higher temporal and lower spatial frequencies. Translating these dimen- sions into velocity, they conclude that for both of their primate subjects, velocities above 5 deg/sec predomi- nately favored the magnocellular system while those below 5 deg/sec favored the parvocellular system. The notion of spatiotemporal frequency specialization at the subcortical level is supported by both the anatomical and the psychophysical features of the parvocellular and magnocellular pathways. Anatomically, the parvocellular ganglion cells are much greater in number and have a greater sampling density than the magnocellular ganglion cells which have dendritic fields, on average, eight-fold larger than the parvocellular ganglion cells (Perry et al.,
1984). Psychophysically, the magnocellular ganglion cells (Gouras & Zrenner, 1979) and the magnocellular lateral geniculate neurons (Hicks et al., 1983; Derrington & Lennie, 1984) respond preferentially to higher temporal frequency stimuli. Thus, to isolate the motion system as much as possible, and to prevent sparing in other visual systems from compensating for disease- related damage, motion stimuli employing higher temporal and lower spatial frequencies should be utilized.
For any new test to become a successful diagnostic tool for glaucoma, it must be able to reliably differentiate between normal and glaucoma eyes. However, consider- able overlap between glaucoma patients and normal controls has been found in motion thresholds (Bullimore et al., 1993). This could be the result of using relatively large, foveally fixated fields of random dots which might allow both normal and pathologic regions of the visual field to contribute to glaucoma patients' motion percept. Joffe et al. (1991) used a small 3 deg target at multiple retinal locations and found that glaucoma patients had specific locations of marked sensitivity loss. Consistent with this, we found that glaucoma patients do have localized motion defects (Bosworth et al., 1997) to which a larger foveally centered motion stimulus is insensitive. The larger foveally centered motion stimulus tested in this study was unable to differentiate between glaucoma, glaucoma-suspect, and normal eyes while a localized perimetric motion test was able to separate the glaucoma group and identify a percentage of suspects as abnormal.
Longitudinal study of a larger number of primary open-angle glaucoma, normal, and suspect eyes is necessary before the diagnostic and clinical utility of this test can be determined. Comparisons of motion automated perimetry to other functional tests which are known to identify early glaucomatous defects, such as short-wavelength automated perimetry, also are being conducted.
In conclusion, our results suggest that the ability of a motion display to test discrete retinal locations across the visual field is important for detecting early motion deficits in glaucoma patients.
R E F E R E N C E S
Baker, L. C. & Braddick, O. J. (1985a) Eccentricity-dependent scaling of the limits for short-range apparent motion perception. Vision Research, 25, 803-812.
Baker, L. C. & Braddick, O. J. (1985b) Temporal properties of the short range process in apparent motion. Perception, 14, 181-192.
Bischof, W. F. & Groner, M. (1985). Beyond the displacement limit: an analysis of short-range processes in apparent motion, Vision Research, 25, 839-847.
Bosworth, C. F., Sample, P. A. & Weinreb, R.N. (1997). Motion perception thresholds in areas of glaucomatous visual field loss. Vision Research, 37, 355-364.
Braddick, O. J. (1974). A short-range process in apparent motion. Vision Research, 14, 519-527.
Bullimore, M. A., Wood, J.M . & Swenson, K. (1993). Motion perception in glaucoma. Investigative Ophthalmology and Visual Science, 34, 3526--3533.
Casson, E. J., Johnson, C. A. & Shapiro, L. R. (1993). Lmgitudinal comparison of temporal-modulation perimetry with white-on-white and blue-on-yellow perimetry in ocular hypertension and early glaucoma. Journal of the Optical Society of America A, 10. 1792- 1806.
Cleary, R. & Braddick, O. J. (1990). Masking of low frequency information in short-range apparent motion. Vision Research, 30, 317-327.
Derrington, M. A. & Goddard, A. P. (1989). Failure of motion discrimination at high contrasts: evidence for saturation. Vision Research, 29, 1767-1776.
Derrington, M. A. & Lennie, P. (1984). Spatial and temporal contrast sensitivities of neurons in lateral geniculate nucleus of macaque. Journal of Physiology (London), 357, 219-240.
Drum, B., Breton, M. & Massof, R. (1987). Pattern discrimination perimetry: a new concept in visual field testing. Documenta Ophthalmologica, 49, 433--440.
Falzett, M. & Lappin, J. S. (1983). Detection on spatial forms in space and time. Vision Research, 23, 181-189.
Fitzke, F. W., Poinoosawmy, D., Ernst, W. & Hitchings, R. A. (1987). Peripheral displacement thresholds in normals, ocular hypertensives and glaucoma. In Greve, E. L., Heijl, A. (Eds), Seventh International Visual Field Symposium (pp. 447~-52). Dordrecht: Martinus Nijhoff.
Fitzke, F, W., Poinoosawmy, D., Nagasubramanian, S. & Hitchings, R. A. (1989). Peripheral displacement thresholds in glaucoma and ocular hypertension. In Heijl, A. (Ed.), Perimetric update (pp. 399- 405). Amsterdam: Kugler & Ghedini.
Frisen, L. (1993). High-pass resolution perimetry: a clinical review. Documenta Ophthalmologica, 83, 1-25.
Gouras, P. & Zrenner, E. (1979). Enhancement of luminance flicker by color-opponent mechanisms. Science, 205, 587-589.
Hicks, T. P., Lee, B. B. & Vidyasagar, T. R. (1983). The responses of cells in the macaque lateral geniculate nucleus to sinusoidal gratings. Journal of Physiology, 337, 183-200.
Joffe, K. M., Raymond, J. E. & Crichton, A. (1991). Motion perimetry in glaucoma. Investigative Ophthahnology and Visual Science (ARVO abstracts), 32 suppl. 1103.
MOTION PERCEPTION IN GLAUCOMA 1997
Johnson, C. A. (1994). Selective versus nonselective losses in glaucoma. Journal of Glaucoma, 3 suppl. 1, s32-s44.
Johnson, C. A., Adams, A. J., Casson, E. J. & Brandt, J. D. (1993a) Blue-on-yellow perimetry can predict the development of glauco- matous visual field loss. Archives of Ophthalmology, 111,645-650.
Johnson, C. A., Adams, A. J., Casson, E. J. & Brandt, J. D. (1993b) Progression of early glaucomatous visual field loss for blue-on- yellow color perimetry and standard white-on-white automated perimetry. Archives of Ophthalmology, 111, 651-656.
Johnson, C. A., Marshall, D. & Eng, K. M. (1995). Displacement threshold perimetry in glaucoma using a Macintosh computer system and a 21 inch monitor. In Heijl, A. (Ed), Perimetric update (pp. 103-110). Amsterdam: Kugler & Ghedini.
Livingstone, M. S. & Hubel, D. H. (1988). Segregation of form, color, movement, and depth: anatomy, physiology, and perception. Science, 240, 740-749.
McKee, S. P. & Nakayama, K. (1984). The detection of motion in the peripheral visual field. Vision Research, 24, 25-32.
Merigan, W. H., Byrne, C. E. & Maunsell, J. H. R. (1991). Does primate perception depend on the magnocellular pathway? The Journal of Neuroscience, 11, 3422-3429.
Nakayama, K. & Tyler, C. W. (1980). Psychophysical isolation of movement sensitivity by removal of familiar position cues. Vision Research, 21,427--433.
Nawroot, M. & Sekuler, R. (1990). Assimilation and contrast in motion perception: explorations in cooperativity. Vision Research, 30, 1439-1451.
Perry, V. H., Ochler, R. & Cowey, A. (1984). Retinal ganglion cells which project to the dorsal lateral geniculate nucleus in the macaque monkey. The Journal of Neuroscience, 12, 1101-1123.
Quigley, H. A., Sanchez, R. M., Dunkelberger, G. R., L'Hernault, N. L. & Babinski, T. A. (1987). Chronic glaucoma selectively damages large optic nerve fibers. Investigative Ophthalmology and Visual Science, 28, 913-920.
Sample, P. A., Madrid, M. E. & Weinreb, R. N. (1994). Evidence for a variety of functional defects in glaucoma-suspect eyes. Glaucoma, 3, $5-S17.
Sample, P. A., Taylor, J. D. N., Martinez, G., Lusky, M. & Weinreb, R. N. (1993). Short-wavelength color visual fields in glaucoma suspects at risk. American Journal of Ophthalmology, 115, 225-233.
Sample, P. A. & Weinreb, R. N. (1990). Color perimetry for assessment of primary open-angle glaucoma. Investigative Ophthal- mology and Visual Science, 31, 1869-1875.
Sample, P. A. & Weinreb, R. N. (1992). Progressive color visual field loss in eyes with primary open angle glaucoma. Investigative Ophthalmology and Visual Science, 33, 2068-2071.
Satoshi, S. & Cavanagh, P. (1990). ISI produces reverse apparent motion. Vision Research, 30, 757-768.
Schiller, P. H., Logothetis, N. K. & Charles, E. R. (1990a) Role of the color-opponent and broad-band channels in vision. Visual Neuroscience, 5, 321-346.
Schiller, P. H., Logothetis, N. K. & Charles, E. R. (1990b) Functions of
the color-opponent and broad-band channels of the visual system. Nature, 343, 68-70.
Schiller, P. H. & Malpeli, J. G. (1987). Functional specificity of lateral geniculate nucleus laminae of the rhesus monkey. Journal of Neurophysiology, 41,788-797.
Scholl, H. P. N. & Zrenner, E. (1995). Motion thresholds of colored stimuli of different luminance contrasts are increased in ocular hypertension and early primary-open-angle-glaucoma (POAG). Color Vision Deficiencies, 13, 73~85.
Shapley, R. M., Kaplan, E. & Soodak, R. (1981). Spatial summation and contrast sensitivity of X and Y cells in the lateral geniculate nucleus of the macaque. Nature, 292, 543-545.
Silverman, S. E., Trick, G. L. & Harr, W. M.Jr. (1990). Motion perception is abnormal in primary open-angle glaucoma and ocular hypertension. Investigative Ophthalmology and Visual Science, 31, 722-729.
Snowden, R. J. & Braddick, O. J. (1989). The combination of motion signals over time. Vision Research, 29, 1621-1630.
Snowden, R. J. & Braddick, O. J. (1991). The temporal integration and resolution of velocity signals. Vision Research, 31,907-914.
Trick, G. L., Steinman, S. B. & Amyot, M. (1995). Motion perception deficits in glaucomatous optic neuropathy. Vision Research, 35, 2225-2233.
Turano, K. & Wang, X. (1992). Motion thresholds in retinitis pigmentosa. Investigative Ophthalmology and Visual Science, 33, 2411-2422.
Tyler, C. W. (1981). Specific deficits of flicker sensitivity in glaucoma and ocular hypertension. Investigative Ophthalmology and Visual Science, 20, 204-212.
Tyler, C. W., Hardage, L. & Stamper, R. L. (1994). The temporal visiogram in ocular hypertension and its progression to glaucoma. Glaucoma, 3, $65~$72.
Van De Grind, W. A., Keonderink, J. J. & Van Doom, A. J. (1987). Influence of contrast on foveal and peripheral detection of coherent motion in moving random-dot patterns. Optical Society of America A. Optics and lmagescience, 4, 1643-1652.
Wall, M., Kathryn, M. & Ketoff, B. S. (1995). Random dot motion perimetry in patients with glaucoma and in normal controls. American Journal of Ophthalmology, 120, 587-596.
Watamaniuk, S. N. J., McKee, S. P. & Grzywacz, N. M. (1995). Detecting a trajectory embedded in random-direction motion noise. Vision Research, 35, 65-77.
Watkins, R. & Buckingham, T. (1991). Motion perception hyperacuity is abnormal in primary open-angle glaucoma and ocular hyper- tension. Investigative Ophthalmology and Visual Science (ARVO abstracts), 32 suppl, 1103.
Williams, D. W. & Sekuler, R. (1984). Coherent global motion precepts from stochastic local motions. Vision Research, 24, 55-62.
Acknowledgement--The authors wish to thank Scott Hancher, Depart- ment of Ophthalmology, UCSD, for programming the motion test Used in this study.