AbstractBackground Although some predictive factors of long-term survival after a distal gastrectomy for gastric cancer have been reported, only few studies have predicted long-term outcomes based on preoperative parameters. We aimed to evaluate the reliability of perioperative risk calculator for predicting overall survival (OS) after distal gastrectomy in patients with gastric cancer.Methods Overall, 337 patients (225 males, 112 females) who had undergone a distal gastrectomy for gastric cancer at the Keio University Hospital, Tokyo, Japan, between January 2009 and December 2013 were enrolled in this study. We inves-tigated the reliability of a risk calculator for the prediction of OS.Results In multivariate analysis, the risk models for operative mortality and 30-day mortality were identified as predictors of death. Time-dependent receiver operating characteristics (ROC) curve analysis indicated that the estimated area under the curve (AUC) value of the risk model for operative mortality was > 0.870 during the first postoperative 3 years. We set optimal cutoff values of the risk model operative mortality for OS using the Cutoff Finder online tool. The cutoff values of 4.117% were significant risk factors of death. Similar results were observed in the external validation set.Conclusions We elucidated the associations among risk calculator values and OS rates of patients with gastric cancer. Time-dependent ROC curve analysis suggested that the AUC value of the risk model for operative mortality was high, indicating that this risk calculator would be useful for not only short-term outcomes, but also long-term outcomes.
Gastric cancer is the second highest cause of cancer-related deaths in the world. Globally, an estimated 951,600 new stomach cancer cases and 723,100 deaths occurred in 2012, and the incidence rate is the highest in Eastern Asia, spe-cifically in Japan and Korea [1]. Although the most effec-tive curative therapy to achieve long-term survival is gas-trectomy, surgery for the patients with comorbidities has increased with age. Therefore, the prediction of long-term outcomes preoperatively is required for each patient. Some predictive factors of long-term prognosis after a gastrec-tomy have been reported [2–5]; however, only few studies have predicted long-term outcomes based on preoperative parameters.
We previously reported that a perioperative risk calcula-tor predicts long-term oncological outcomes in patients with
Electronic supplementary material The online version of this article (https ://doi.org/10.1007/s1012 0-018-0896-9) contains supplementary material, which is available to authorized users.
625Perioperative risk calculator for distal gastrectomy predicts overall survival in patients…
1 3
esophageal carcinoma [6]. Our previous two studies showed that changes in cytokines such as interleukin (IL)-6 or IL-8 caused by postoperative complications or surgical stress adversely affected short- and long-term outcomes after an esophagectomy [7, 8], and we also concluded that a risk cal-culator was the most reliable predictor of survival because it demonstrates multiple causes for increased inflammatory mediators and growth factors [6].
Kurita et al. [9] reported on a perioperative risk calculator for gastric cancer to predict short-term outcomes of a distal gastrectomy using a Japanese nationwide Web-based data entry system. We expected that patients who had higher risk factors for operative morbidity would have the same negative long-term outcomes as esophageal cancer. We hypothesized that overall survival (OS) prognosis can be predicted if pre-operative risk parameters for short-term outcomes after a distal gastrectomy are known.
In this study, we investigated the reliability of a risk cal-culator for the prediction of OS and determined the cutoff values. To the best of our knowledge, this is the first report of the relationship between perioperative calculator risk val-ues and oncological outcomes. Moreover, validation using an external cohort was performed to strengthen the reliabil-ity of this risk model.
Methods
Patients
Overall, 337 patients who had undergone a distal gastrec-tomy for gastric cancer at the Keio University Hospital, Tokyo, Japan, between January 2009 and December 2013, were enrolled in this study in the development cohort. The reliability of a risk calculator was investigated in this study, and the primary end point was OS in patients with gastric cancer.
Before treatment, the patients were examined by upper gastrointestinal endoscopy, thoracic and abdominal com-puted tomography (CT), laboratory tests, and gastrography. The clinical and pathological stages of cancer were deter-mined according to the Japanese classification of gastric cancer, 3rd English edition [10]. According to a previous NCD study [9], we excluded a patient who had undergone a gastrectomy combined with colectomy, pancreatectomy, hepatectomy, and splenectomy. However, patients who also underwent a cholecystectomy not for gallbladder cancer were included [9]. An external validation cohort was cre-ated using the database of Shizuoka Cancer Center, and 100 patients who satisfied the aforementioned inclusion and exclusion criteria during 2013 were included in the external validation set.
We retrospectively evaluated patients’ hospital records for their clinical information, pathological findings, and progno-sis. This study was conducted with the approval of the ethics committee of the Keio University School of Medicine and Shizuoka Cancer Center.
Clinicopathological factors
The histological types of main tumor were classified into two types: a differentiated type that included papillary and tubular adenocarcinoma and an undifferentiated type that included poorly differentiated, mucinous, and signet-ring cell carcinoma. According to Japanese gastric cancer treatment guidelines (4th edition), in principle, a D1 or D1 + lymphadenectomy is primarily indicated for cT1N0 tumors and D2 lymphadenectomy for cN + or cT2-4 tumors [11]. The reconstruction methods after a gastrectomy are as follows; Billroth I gastroduodenostomy and Roux-en-Y gastrojejunostomy [11]. These indications were decided by the surgeon, based on the patients’ background and intra-operative findings. The tumor location was divided in three parts: upper third (U), middle third (M), or lower third (L). The four equal parts of the gastric circumference are the lesser curvature (Less), greater curvature (Gre), anterior wall (Ant), and posterior wall (Post) [10].
Morbidity and mortality
We used the Clavien–Dindo classification for complica-tions and identified complication cases as those having a Clavien–Dindo classification greater than grade III [12]. Residual tumors were classified as no residual tumor (R0), microscopic (R1), or macroscopic (R2) residual tumor. We examined the 30-day mortality and operative mortality that occurred during hospitalization within 90 days or after dis-charge within 30 days after surgery.
Oncological follow‑up
The discharged patients visited our outpatient clinic at least after 1 month, at 3 months, and every 6 months until 5 years after surgery. In the outpatient clinic, a routine physical examination and routine laboratory investigations for carcinoembryonic antigen and carbohydrate antigen 19-9 were performed. An upper gastrointestinal endoscopy was performed once a year to detect local recurrence and metachronous, multicentric, or multiple cancers. In addition, a thoracoabdominal CT was performed every 6 months to detect local recurrence and systemic metastasis for at least 5 years after a gastrectomy. Disease-free survival (DFS) and OS were also calculated from the date of surgery. Moreover, cancer-specific survival (CSS) was the term from the date of treatment to that of death from cancer.
626 M. Takeuchi et al.
1 3
Risk calculator for a distal gastrectomy
A risk scoring system for a mortality risk calculator after a distal gastrectomy used a logistic regression equation reported in a nationwide database as follows [9]:
where βi is the coefficient of the variable Xi in the logistic regression equation. Xi = 1 if a categorical factor is present and 0 if absent. For the age category, Xi = 1 for age ≤ 59 years; Xi = 2 for age 60–64 years; Xi = 3 for age 65–69 years; Xi = 4 for age 70–74 years; Xi = 5 for age 75–79 years; and Xi = 6 for age ≥ 80 years [9]. We retrospectively evaluated the patient’s preoperative characteristics to calculate the risk for 30-day mortality and operative mortality. The two groups shared the following 13 overlapping variables: age category, need for total assistance in ADL before surgery or within 30 days after surgery, history of cerebrovascular disease, weight loss > 10%, uncontrolled ascites, an American Soci-ety of Anesthesiologists (ASA) score ≥ 3, a white blood cell count > 12,000/µL for 30-day mortality or > 11,000/µL for operative mortality, anemia (hemoglobin: males, < 13.5 g/dL; females, < 12.5 g/dL; or hematocrit: males < 37%; females < 32%), serum albumin < 3.5 for 30-day mortal-ity or < 3.8 g/dL for operative mortality, alkaline phos-phatase > 340 IU/L, serum creatinine > 1.2 mg/dL, serum sodium < 135 mEq/L, and prothrombin time–international normalized ratio > 1.25 for 30-day mortality or > 1.1 for operative mortality. Independent variables for 30-day mor-tality only were habitual alcohol consumption, preoperative pneumonia, history of myocardial infarction, or a bleed-ing disorder without treatment. Independent variables for operative mortality only were the presence of respiratory distress, disseminated cancer, chronic corticosteroid use, urgent surgery, low platelet count (< 12 × 104/µL), aspartate aminotransferase > 40 IU/L, increased level of total bilirubin (> 2 mg/dL), or an activated partial thromboplastin time > 40 s9 (Supplemental Table 1).
Statistical analysis
Categorical variables were analyzed by a Chi square test for univariate analyses and continuous variables were analyzed by the Mann–Whitney U test or Student’s t test. p < 0.05 was considered statistically significant. We investigated associations between the risk calculator’s values and prog-nosis using the Kaplan–Meier method and log-rank test. Moreover, variables with p < 0.05 in the univariate analy-sis were subsequently entered into a Cox hazard regression model for a multivariate analysis of risk factors for death and recurrence. To validate model performance, we used time-dependent receiver operating characteristics (ROC) to
Predicted mortality = e (�0 + Σ�iXi)∕1 + e (�0 + Σ�iXi),
assesses the discriminatory power of continuous markers for time-dependent disease outcomes, the same as in our previ-ous study [13]. Although ROC curves are a popular method for evaluating model performance, many disease outcomes included cancer that is time dependent and ROC curves that vary as a function of time may be more appropriate [14]. In time-dependent ROC, AUC is calculated from the survival rate at each time point, and the plotted curves are compared between groups according to their covariates [14]. In addi-tion to the development set, AUC values were calculated in the external validation cohort. Cutoff Finder, designed by Budczies et al. [15] is freely available on the Internet (http://molpa th.chari te.de/cutoff ). This tool was used to determine the optimal cutoff values for the risk model. Cutoff Finder offers advantage regarding hazard ratio and confidence inter-val plots, which include information on the strength and sig-nificance of prognostic stratification [16]. Interactions were investigated to determine whether the risk calculator has high reliability for predicting OS in each subgroup, which included age, sex, body mass index (BMI), and pathological stage and the presence of laparoscopy, histology, dissection, and resection. The interaction p value was significant at the 5% level [17]. Statistical analyses were performed using Stata/SE 12.1 for Mac (StataCorp, TX, USA), Cutoff Finder, and R, version 3.1.2 (R Foundation Statistical Computing, Vienna, Austria); the R packages “forestplot,” “timeROC,” “coxph,” and “survfit” were used.
Results
Background characteristics
There were 225 men and 112 women in the development cohort (Table 1). The mean risk values for 30-day mortal-ity and operative mortality rates were 0.36% ± 0.77% and 0.76% ± 1.75%, respectively. Seventeen patients (4.7%) suffered from postoperative complications with a Cla-vien–Dindo grade ≧ III; five (1.5%) patients had anastomotic leakage; two (0.6%) patients had pneumonia and pancre-atic fistula, and one (0.3%) patient had abdominal abscess, cholecystitis, pneumothorax, pleural effusion, anastomotic stenosis, abdominal hemorrhage, and surgical site infection. No patients died during hospitalization in this study. No sig-nificant differences were observed in independent variables for 30-day mortality and operative mortality between the NCD population and our data that excluded only eight fac-tors; age, myocardial infarction, disseminated cancer, ASA, hematocrit value, serum albumin level, alkaline phosphatase level, and PT–INR value (Supplemental Table 1).
Overall, 100 patients (71 men and 29 women) were enrolled in the external validation set, and their
627Perioperative risk calculator for distal gastrectomy predicts overall survival in patients…
1 3
clinicopathological characteristics are summarized in Sup-plemental Table 2.
Model results and risk calculator performance
The 5-year OS rate was 90.2% in the development cohort, and 33 patients (9.8%) died in the observed term. Among these patients, 21 died from cancer-related causes and 12 from cancer-unrelated causes. There were 34 patients (10.1%) who had recurrence at one or more regions; of these, 12 patients had peritoneal dissemination only, 10 had distant metastasis only, 10 had recurrence at lymph nodes only, 1 had distant metastasis with distant lymph nodes, and 1 had local recurrence only.
We analyzed the correlation between each parameter of the risk model and long-term outcomes in our study using Cox hazard regression model (Supplemental Table 3). In univariate analysis, age category, ADL, respiratory distress, previous cerebrovascular disease, weight loss, ASA ≧ 3, low hematocrit, low platelets, low serum albumin, high aspartate aminotransferase, high total bilirubin, high serum creatinine, serum sodium values, high PT–INR value, and high APTT value had a significant negative impact on OS. Moreover, variables with p < 0.001 values in the univariate analysis (because we adjusted the number of explanatory variables in the multivariate analysis) were subsequently entered into a Cox regression model for a multivariate analysis, and ADL,
previous cerebrovascular disease, weight loss, and PT–INR value were significant risk factors for death.
Risk factors for long‑term outcomes using a Cox hazard model
We used univariate analysis to determine the risk factors for death from variables such as clinicopathological back-ground, perioperative characteristics, and risk model values for mortality. Several factors such as pathological stage II, pathological stage III, pathological R1 resection, and risk model for mortality value were identified as significant risk factors. In the multivariate analysis using the Cox regres-sion to identify risk factors for death, the risk model for 30-day mortality and operative mortality were identified as predictors of death [risk model for 30-day mortality value, p < 0.001; hazard ratio (HR), 1.76; 95% confidence inter-val (CI), 1.47–2.12, and risk model for operative mortality, p < 0.001; HR 1.28; 95% CI 1.18–1.38] (Table 2). Moreover, the values of risk model for 30-day mortality and operative mortality were identified as predictors of recurrence and cancer-specific death (Supplemental Table 4, 5).
In 88 patients who had pStage > I, both risk models were also predictors for OS in multivariate analysis [risk model for 30-day mortality value, p < 0.001; HR, 1.50; 95% confi-dence interval (CI), 1.20–1.88, and risk model for operative mortality, p = 0.001; HR 1.22; 95% CI 1.08–1.39].
Comparison of two risk calculators using a time‑dependent ROC curve analysis
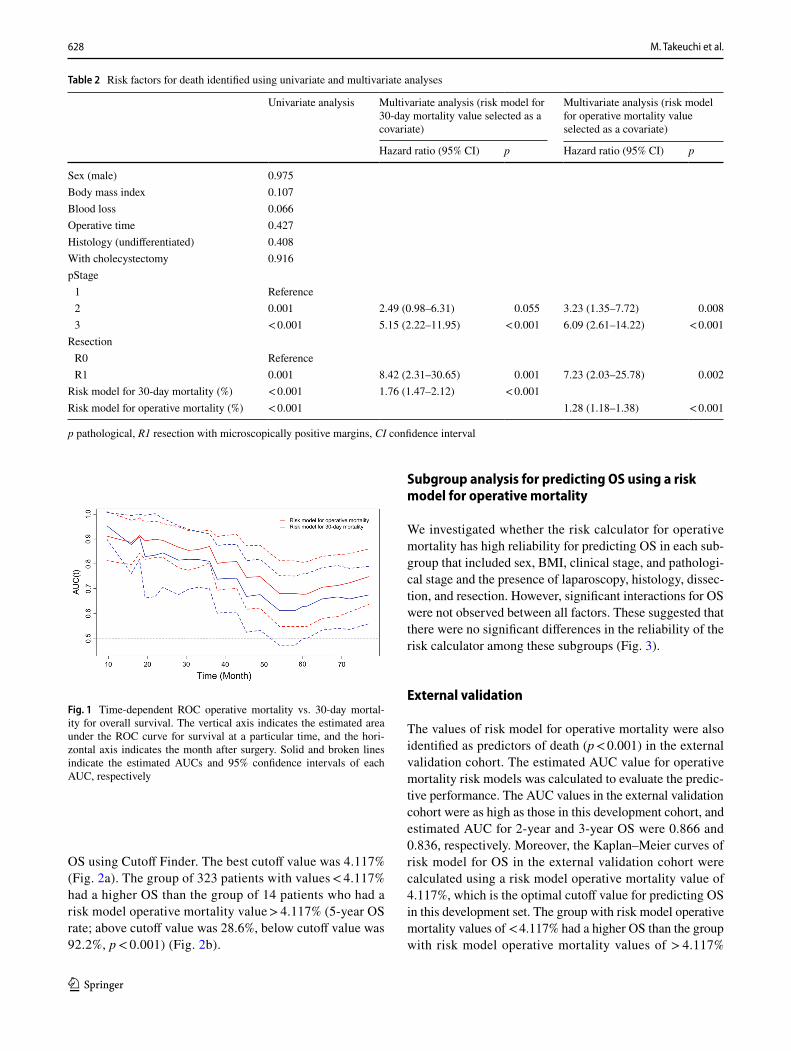
To evaluate model performance for comparing two risk cal-culators, we validated the reliability of the risk calculator using a time-dependent ROC curve analysis. The estimated area under the curve (AUC) values for operative mortality and 30-day mortality risk models were high, especially in terms of the first three postoperative years [estimated AUC for 2-year, and 3-year OS were 0.895, and 0.870 (risk model for operative mortality) and 0.844, and 0.810 (risk model for 30-day mortality), respectively]. Time-dependent ROC curves showed that the AUC value of the risk model for operative mortality was superior to risk model for 30-day mortality in all terms (Fig. 1). Furthermore, the estimated AUC value of the risk model for operative mortality was superior to the risk model for 30-day mortality for predicting DFS and CSS (Supplemental Figure 1, 2).
Optimal cutoff values of risk calculator for operative mortality
To simulate the clinical decision process, we set the opti-mal cutoff value of the operative mortality risk model, which is superior to the 30-day mortality risk model, for
Table 1 Clinicopathological characteristics of development data from the current study
C clinical, p pathological, ASA American Society of Anesthesiolo-gists, BI Billroth I gastroduodenostomy, R-Y Roux-en-Y gastrojeju-nostomy
Development set (n = 337)
Sex (men/women) 225/112Age; median(range) 65 (30–93)Location (U/M/L) 6/186/145Circumference (Less/Gre/Ant/Post/Circ) 133/76/63/54/11Body Mass Index (kg/m2); median
(range)22.4 (14.3–34.0)
cStage (1/2/3/4) 268/41/24/4pStage (1/2/3/4) 249/48/40/0Neoadjuvant 13 (3.9%)Adjuvant 66 (19.6%)Laparoscopy 213 (63.2%)Dissection D1/D1+/D2 7/63/155Reconstruction BI/R-Y 273/64Resection R0/R1/R2 330/6/0Blood loss (ml); median (range) 30 (0–729)Operative time (min); median (range) 250 (128–465)Histology differentiated/undifferentiated 138/199With cholecystectomy 25 (7.4%)
628 M. Takeuchi et al.
1 3
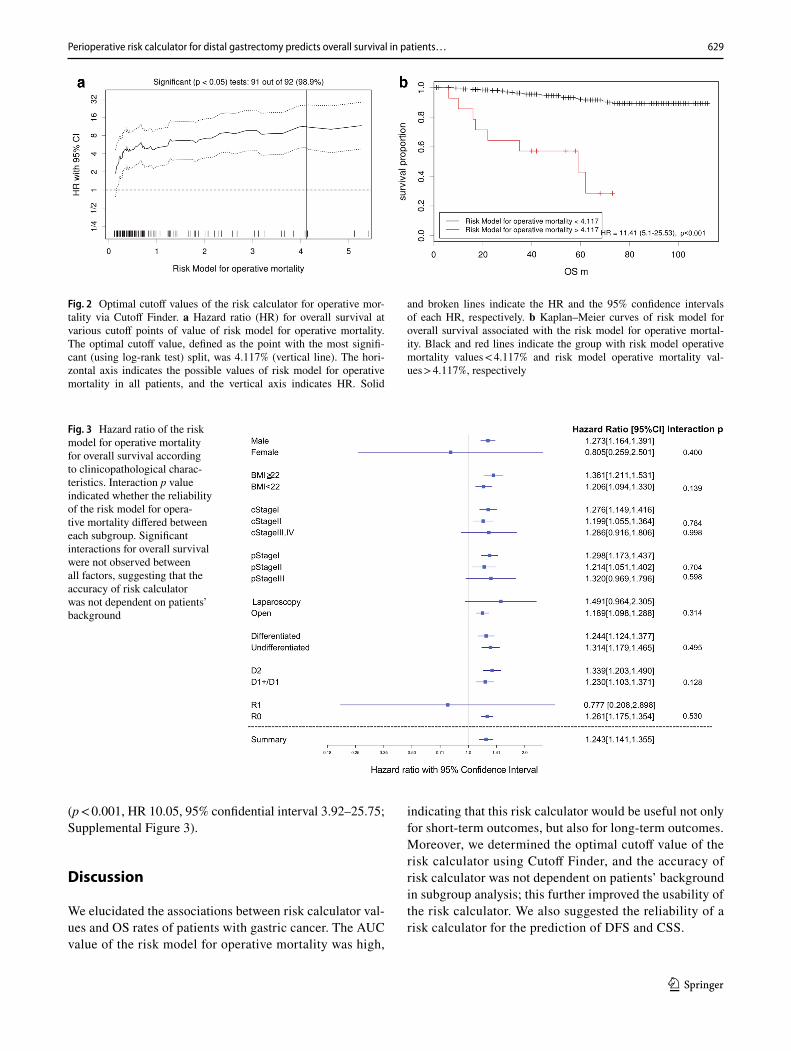
OS using Cutoff Finder. The best cutoff value was 4.117% (Fig. 2a). The group of 323 patients with values < 4.117% had a higher OS than the group of 14 patients who had a risk model operative mortality value > 4.117% (5-year OS rate; above cutoff value was 28.6%, below cutoff value was 92.2%, p < 0.001) (Fig. 2b).
Subgroup analysis for predicting OS using a risk model for operative mortality
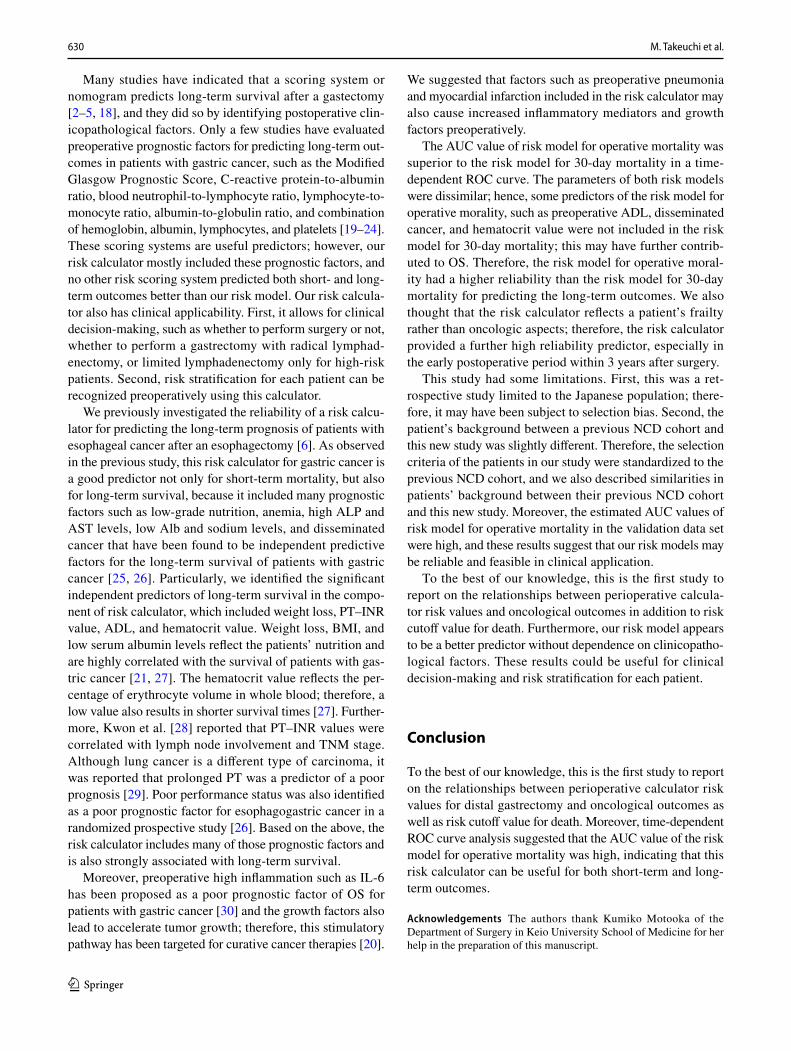
We investigated whether the risk calculator for operative mortality has high reliability for predicting OS in each sub-group that included sex, BMI, clinical stage, and pathologi-cal stage and the presence of laparoscopy, histology, dissec-tion, and resection. However, significant interactions for OS were not observed between all factors. These suggested that there were no significant differences in the reliability of the risk calculator among these subgroups (Fig. 3).
External validation
The values of risk model for operative mortality were also identified as predictors of death (p < 0.001) in the external validation cohort. The estimated AUC value for operative mortality risk models was calculated to evaluate the predic-tive performance. The AUC values in the external validation cohort were as high as those in this development cohort, and estimated AUC for 2-year and 3-year OS were 0.866 and 0.836, respectively. Moreover, the Kaplan–Meier curves of risk model for OS in the external validation cohort were calculated using a risk model operative mortality value of 4.117%, which is the optimal cutoff value for predicting OS in this development set. The group with risk model operative mortality values of < 4.117% had a higher OS than the group with risk model operative mortality values of > 4.117%
Table 2 Risk factors for death identified using univariate and multivariate analyses
p pathological, R1 resection with microscopically positive margins, CI confidence interval
Univariate analysis Multivariate analysis (risk model for 30-day mortality value selected as a covariate)
Multivariate analysis (risk model for operative mortality value selected as a covariate)
Hazard ratio (95% CI) p Hazard ratio (95% CI) p
Sex (male) 0.975Body mass index 0.107Blood loss 0.066Operative time 0.427Histology (undifferentiated) 0.408With cholecystectomy 0.916pStage 1 Reference 2 0.001 2.49 (0.98–6.31) 0.055 3.23 (1.35–7.72) 0.008 3 < 0.001 5.15 (2.22–11.95) < 0.001 6.09 (2.61–14.22) < 0.001
Risk model for 30-day mortality (%) < 0.001 1.76 (1.47–2.12) < 0.001Risk model for operative mortality (%) < 0.001 1.28 (1.18–1.38) < 0.001
Fig. 1 Time-dependent ROC operative mortality vs. 30-day mortal-ity for overall survival. The vertical axis indicates the estimated area under the ROC curve for survival at a particular time, and the hori-zontal axis indicates the month after surgery. Solid and broken lines indicate the estimated AUCs and 95% confidence intervals of each AUC, respectively
629Perioperative risk calculator for distal gastrectomy predicts overall survival in patients…
We elucidated the associations between risk calculator val-ues and OS rates of patients with gastric cancer. The AUC value of the risk model for operative mortality was high,
indicating that this risk calculator would be useful not only for short-term outcomes, but also for long-term outcomes. Moreover, we determined the optimal cutoff value of the risk calculator using Cutoff Finder, and the accuracy of risk calculator was not dependent on patients’ background in subgroup analysis; this further improved the usability of the risk calculator. We also suggested the reliability of a risk calculator for the prediction of DFS and CSS.
Fig. 2 Optimal cutoff values of the risk calculator for operative mor-tality via Cutoff Finder. a Hazard ratio (HR) for overall survival at various cutoff points of value of risk model for operative mortality. The optimal cutoff value, defined as the point with the most signifi-cant (using log-rank test) split, was 4.117% (vertical line). The hori-zontal axis indicates the possible values of risk model for operative mortality in all patients, and the vertical axis indicates HR. Solid
and broken lines indicate the HR and the 95% confidence intervals of each HR, respectively. b Kaplan–Meier curves of risk model for overall survival associated with the risk model for operative mortal-ity. Black and red lines indicate the group with risk model operative mortality values < 4.117% and risk model operative mortality val-ues > 4.117%, respectively
Fig. 3 Hazard ratio of the risk model for operative mortality for overall survival according to clinicopathological charac-teristics. Interaction p value indicated whether the reliability of the risk model for opera-tive mortality differed between each subgroup. Significant interactions for overall survival were not observed between all factors, suggesting that the accuracy of risk calculator was not dependent on patients’ background
630 M. Takeuchi et al.
1 3
Many studies have indicated that a scoring system or nomogram predicts long-term survival after a gastectomy [2–5, 18], and they did so by identifying postoperative clin-icopathological factors. Only a few studies have evaluated preoperative prognostic factors for predicting long-term out-comes in patients with gastric cancer, such as the Modified Glasgow Prognostic Score, C-reactive protein-to-albumin ratio, blood neutrophil-to-lymphocyte ratio, lymphocyte-to-monocyte ratio, albumin-to-globulin ratio, and combination of hemoglobin, albumin, lymphocytes, and platelets [19–24]. These scoring systems are useful predictors; however, our risk calculator mostly included these prognostic factors, and no other risk scoring system predicted both short- and long-term outcomes better than our risk model. Our risk calcula-tor also has clinical applicability. First, it allows for clinical decision-making, such as whether to perform surgery or not, whether to perform a gastrectomy with radical lymphad-enectomy, or limited lymphadenectomy only for high-risk patients. Second, risk stratification for each patient can be recognized preoperatively using this calculator.
We previously investigated the reliability of a risk calcu-lator for predicting the long-term prognosis of patients with esophageal cancer after an esophagectomy [6]. As observed in the previous study, this risk calculator for gastric cancer is a good predictor not only for short-term mortality, but also for long-term survival, because it included many prognostic factors such as low-grade nutrition, anemia, high ALP and AST levels, low Alb and sodium levels, and disseminated cancer that have been found to be independent predictive factors for the long-term survival of patients with gastric cancer [25, 26]. Particularly, we identified the significant independent predictors of long-term survival in the compo-nent of risk calculator, which included weight loss, PT–INR value, ADL, and hematocrit value. Weight loss, BMI, and low serum albumin levels reflect the patients’ nutrition and are highly correlated with the survival of patients with gas-tric cancer [21, 27]. The hematocrit value reflects the per-centage of erythrocyte volume in whole blood; therefore, a low value also results in shorter survival times [27]. Further-more, Kwon et al. [28] reported that PT–INR values were correlated with lymph node involvement and TNM stage. Although lung cancer is a different type of carcinoma, it was reported that prolonged PT was a predictor of a poor prognosis [29]. Poor performance status was also identified as a poor prognostic factor for esophagogastric cancer in a randomized prospective study [26]. Based on the above, the risk calculator includes many of those prognostic factors and is also strongly associated with long-term survival.
Moreover, preoperative high inflammation such as IL-6 has been proposed as a poor prognostic factor of OS for patients with gastric cancer [30] and the growth factors also lead to accelerate tumor growth; therefore, this stimulatory pathway has been targeted for curative cancer therapies [20].
We suggested that factors such as preoperative pneumonia and myocardial infarction included in the risk calculator may also cause increased inflammatory mediators and growth factors preoperatively.
The AUC value of risk model for operative mortality was superior to the risk model for 30-day mortality in a time-dependent ROC curve. The parameters of both risk models were dissimilar; hence, some predictors of the risk model for operative morality, such as preoperative ADL, disseminated cancer, and hematocrit value were not included in the risk model for 30-day mortality; this may have further contrib-uted to OS. Therefore, the risk model for operative moral-ity had a higher reliability than the risk model for 30-day mortality for predicting the long-term outcomes. We also thought that the risk calculator reflects a patient’s frailty rather than oncologic aspects; therefore, the risk calculator provided a further high reliability predictor, especially in the early postoperative period within 3 years after surgery.
This study had some limitations. First, this was a ret-rospective study limited to the Japanese population; there-fore, it may have been subject to selection bias. Second, the patient’s background between a previous NCD cohort and this new study was slightly different. Therefore, the selection criteria of the patients in our study were standardized to the previous NCD cohort, and we also described similarities in patients’ background between their previous NCD cohort and this new study. Moreover, the estimated AUC values of risk model for operative mortality in the validation data set were high, and these results suggest that our risk models may be reliable and feasible in clinical application.
To the best of our knowledge, this is the first study to report on the relationships between perioperative calcula-tor risk values and oncological outcomes in addition to risk cutoff value for death. Furthermore, our risk model appears to be a better predictor without dependence on clinicopatho-logical factors. These results could be useful for clinical decision-making and risk stratification for each patient.
Conclusion
To the best of our knowledge, this is the first study to report on the relationships between perioperative calculator risk values for distal gastrectomy and oncological outcomes as well as risk cutoff value for death. Moreover, time-dependent ROC curve analysis suggested that the AUC value of the risk model for operative mortality was high, indicating that this risk calculator can be useful for both short-term and long-term outcomes.
Acknowledgements The authors thank Kumiko Motooka of the Department of Surgery in Keio University School of Medicine for her help in the preparation of this manuscript.
631Perioperative risk calculator for distal gastrectomy predicts overall survival in patients…
1 3
Compliance with ethical standards
Ethical standards All procedures were performed in accordance with the ethical standards of the responsible committee on human experi-mentation (institutional and national) and the 1964 Declaration of Helsinki and later versions. Informed consent or substitute for it was obtained from all patients included in the study.
Conflict of interest The author(s) declare that they have no competing interests.
References
1. Torre LA, Bray F, Siegel RL, et al. Global cancer statistics, 2012. CA Cancer J Clin. 2015;65:87–108.
2. Song KY, Park YG, Jeon HM, et al. A nomogram for predicting individual survival of patients with gastric cancer who underwent radical surgery with extended lymph node dissection. Gastric Can-cer. 2014;17:287–93.
3. Han DS, Suh YS, Kong SH, et al. Nomogram predicting long-term survival after d2 gastrectomy for gastric cancer. J Clin Oncol. 2012;30:3834–40.
4. Kim Y, Margonis GA, Prescott JD, et al. Nomograms to predict recurrence-free and overall survival after curative resection of adrenocortical carcinoma. JAMA Surg. 2016;151:365–73.
5. Woo Y, Son T, Song K, et al. A Novel Prediction model of prog-nosis after gastrectomy for gastric carcinoma: development and validation using asian databases. Ann Surg. 2016;264:114–20.
6. Takeuchi M, Takeuchi H, Kawakubo H, et al. Perioperative risk calculator predicts long-term oncologic outcome for patients with esophageal carcinoma. Ann Surg Oncol. 2017;25:837–43.
7. Okamura A, Takeuchi H, Matsuda S, et al. Factors affecting cytokine change after esophagectomy for esophageal cancer. Ann Surg Oncol. 2015;22:3130–5.
8. Ogura M, Takeuchi H, Kawakubo H, et al. Clinical significance of CXCL-8/CXCR-2 network in esophageal squamous cell carci-noma. Surgery. 2013;154:512–20.
9. Kurita N, Miyata H, Gotoh M, et al. Risk model for distal gastrec-tomy when treating gastric cancer on the basis of data from 33,917 Japanese patients collected using a Nationwide Web-based Data Entry System. Ann Surg. 2015;262:295–303.
10. Sano T, Aiko T. New Japanese classifications and treatment guidelines for gastric cancer: revision concepts and major revised points. Gastric Cancer. 2011;14:97–100.
11. Japanese Gastric Cancer A. Japanese gastric cancer treatment guidelines 2014 (ver. 4). Gastric Cancer. 2017;20:1–19.
12. Dindo D, Demartines N, Clavien PA. Classification of surgical complications. Ann Surg. 2004;240:205–13.
13. Suzuki Y, Okabayashi K, Hasegawa H, et al. Comparison of pre-operative inflammation-based prognostic scores in patients with colorectal cancer. Ann Surg. 2018;267:527–31.
14. Heagerty PJ, Lumley T, Pepe MS. Time-dependent ROC curves for censored survival data and a diagnostic marker. Biometrics. 2000;56:337–44.
15. Budczies J, Klauscchen F, Sinn BV, et al. Cutoff finder: a com-prehensive and straightforward Web application enabling rapid biomarker cutoff optimization. PLoS One. 2012;7:e51862.
16. Wang Y, Yang L, Xia L, et al. High C-reactive protein/albumin ratio predicts unfavorable distant metastasis-free survival in naso-pharyngeal carcinoma: a propensity score-matched analysis. Can-cer Manag Res. 2018;10:371–81.
17. Poon LC, Wright D, Rolnik DL, et al. Aspirin for evidence-based preeclampsia prevention trial: effect of aspirin in prevention of preterm preeclampsia in subgroups of women according to their characteristics and medical and obstetrical history. Am J Obstet Gynecol. 2017;217:585-e1.
18. Kim Y, Spolverato G, Ejaz A, et al. A nomogram to predict over-all survival and disease-free survival after curative resection of gastric adenocarcinoma. Ann Surg Oncol. 2015;22:1828–35.
19. Saito H, Kono Y, Murakami Y, et al. Prognostic significance of the preoperative ratio of C-reactive protein to albumin and neu-trophil-lymphocyte ratio in gastric cancer patients. World J Surg. 2017:1–7.
20. Lin JP, Lin JX, Cao LL, et al. Preoperative lymphocyte-to-mono-cyte ratio as a strong predictor of survival and recurrence for gas-tric cancer after radical-intent surgery. Oncotarget. 2017;8:79234.
21. Toiyama Y, Yasuda H, Ohi M, et al. Clinical impact of preop-erative albumin to globulin ratio in gastric cancer patients with curative intent. Am J Surg. 2017;213:120–6.
22. Chen XL, Xue L, Wang W, et al. Prognostic significance of the combination of preoperative hemoglobin, albumin, lymphocyte and platelet in patients with gastric carcinoma: a retrospective cohort study. Oncotarget. 2015;6:41370.
23. Melling N, Gruning A, Tachezy M, et al. Glasgow Prognostic Score may be a prognostic index for overall and perioperative sur-vival in gastric cancer without perioperative treatment. Surgery. 2016;159:1548–56.
24. Nozoe T, Iguchi T, Egashira A, et al. Significance of modified glasgow prognostic score as a useful indicator for prognosis of patients with gastric carcinoma. Am J Surg. 2011;201:186–91.
25. Fuchs CS, Muro K, Tomasek J, et al. Prognostic factor analysis of overall survival in gastric cancer from two phase III studies of second-line ramucirumab (REGARD and RAINBOW) using pooled patient data. J Gastric Cancer. 2017;17:132–44.
26. Chau I, Norman AR, Cunningham D, et al. Multivariate prognos-tic factor analysis in locally advanced and metastatic esophago-gastric cancer-pooled analysis from three multicenter, rand-omized, controlled trials using individual patient data. J Clin Oncol. 2004;22:2395–403.
27. Cao HL, Jin SQ, Wang KB, et al. Prognostic factors influenc-ing the survival of patients with carcinoma of the gastric cardia receiving preoperative interventional embolization chemotherapy. Oncotarget. 2017;8:79567.
28. Kwon HC, Oh SY, Lee S, et al. Plasma levels of prothrombin fragment F1 + 2, D-dimer and prothrombin time correlate with clinical stage and lymph node metastasis in operable gastric can-cer patients. Jpn J Clin Oncol. 2008;38:2–7.
29. Ferrigno D, Buccheri G, Ricca I. Prognostic significance of blood coagulation tests in lung cancer. Eur Respir J. 2001;17:667–73.
30. Chang WJ, Du Y, Zhao X, et al. Inflammation-related factors predicting prognosis of gastric cancer. World J Gastroenterol. 2014;20:4586–96.