18
1 This image shows how protected PSP are under pressure from harvesting.

1
This image shows how protected PSP are under pressure from harvesting.

2
Permanent Sample Plots (PSPs)
Strategic 10-Year (2019-2029) Plan
The goal of the Permanent Sample Plot (PSP) program is to collect and maintain long-term re-
measurement data from plots located throughout the province of British Columbia. Data from
the PSP program is an essential component in the development and testing of growth-and-yield
models which are used to project future stand conditions within the province. More generally,
data from the PSP program serves to inform decision makers working within the natural
resource sector on topics such as LiDAR validation, forest health, wildlife habitat, wildfire
dynamics, climate change impacts, and carbon budgets. Consistent re-measurements and
protection from harvesting and salvage logging are key components to ensure success of the
PSP program.
This strategic 10-year plan outlines the goals, actions and future direction of the program. This
is a working document that will be updated as specific goals change, and will be augmented by
annual implementation plans.
Background
The mission of the Forest Inventory Section is, “to produce reliable forest inventories and stand
growth models so that natural resource management in BC is informed by credible information
on forest condition”. Forest inventory provides the foundational information for a wide range
of applications which aid in decisions related to: fibre supply, business opportunities, forest
carbon dynamics, silviculture regimes, harvesting plan, habitat mapping, wildfire risk, and
biodiversity. To meet this wide range of applications, the Forest Inventory Section collects data
at various scales (ground samples, photo interpretation and remote sensing) to derive forest
cover polygons, GIS spatial layers, reports and ground sampling data.
The Permanent Sample Plot (PSP) program is one of multiple ground sampling programs that
provide complimentary data to meet unique objectives. The main strength of the PSP program
is the long-term (90 years) re-measurement data unique to this program.
Objectives
The primary objective of the PSP program is to provide data used in the development and
evaluation of growth-and-yield models that predict future patterns of timber supply around the
province. This is consistent with the original intent of the PSP program which was to validate
growth-and-yield models, develop a database for forest productivity, and create a ground
3
based dataset on tree growth for a variety of uses1. Public sector, private sector and academics
frequently request the PSP data to address specific topics such as carbon accounting, wildlife
habitat assessment, forest health, climate change effects, forest dynamics, tree mortality,
forest regeneration, and validation of imagery based inventories.
Distribution of plots
The PSP program started in the 1920’s with plots subjectively located over a range of stand and
ecosystem types. In British Columbia, approximately 7,800 plots have been established with
approximately 20,000 measurements. Approximately 5,427 plots are still active, meaning they
have not been logged, destroyed, damaged, thinned, lost or impacted in some other way
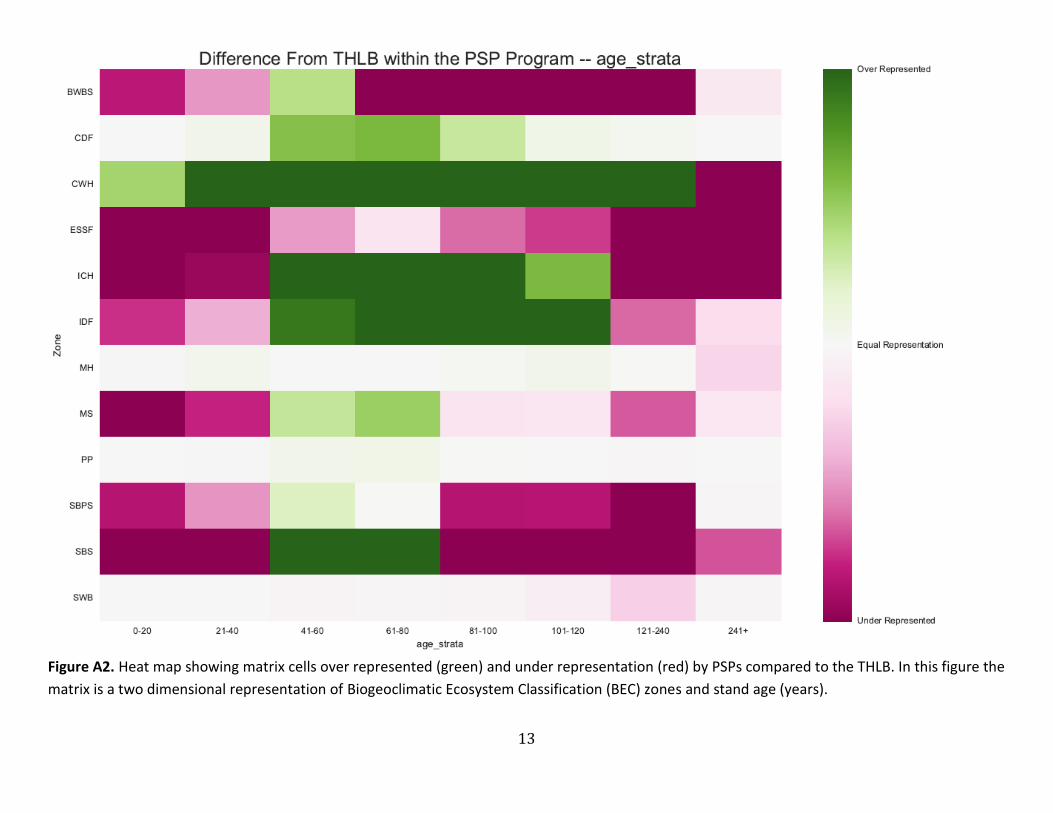
(Figure A1). Although the PSPs are located over a gradient of ecosystem and stand types, they
are not distributed evenly between BEC zones or age classes relative to the Timber Harvestable
Land Base (Figure A2). There are many ways of quantifying forest cover in British Columbia,
using the Timber Harvestable Land Base is one way of quantifying forested lands relevant to the
forest industry in BC.
Past Implementation
How the program met its objectives has evolved over time as needs and interest shift. For
example, the program originally focused only on healthy fully-stocked stands of single
species1,2. With growing interest in modelling and understanding complex forest structures and
dynamics (including mortality, partial damage, multi-species stands, and multiple cohorts) the
program started to retain some partially damaged plots in 1984 and to include mixed species
stands. These plots provide critical information on how forest stands regenerate after partial
damage such as that following the mountain pine beetle attack.
Ideally, PSPs would be measured every 10-years with the number of re-measurements annually
be constant. In reality however, the number of re-measurements per year has fluctuated
significantly (Figure A3). Large amounts of data and plots were acquired in the late 1990’s
followed by a drastic decline in plot re-measurements in 2009 (Figure A3). The number of plots
measured each year determines the number of plots the program can protect and maintain on
a 10-year re-measurement cycle.
1 Omule 2015. A Strategy for the Growth Natural Permanent Sample Plot Program: A Discussion Paper. 2 Stone, J., J. Parminter and J. Braz. 2002. Standing dead tree dynamics extracted from growth and yield permanent sample plots in British Columbia. USDA Forest Service Gen. Tech. Rep. PSW-GTR-181.

4
The 2015-2018 Sample Plan took the PSP Program out of remission by prioritising samples of
highest value and longest time since re-measurement. Prioritization was done using the Forest
Productivity Council’s (FPC)3 matrix and ranking systems that started in 1986 and have changed
over time. The objective of the matrix is to ensure that plots are located on a wide range of
ecosystem types (matrix cells are a unique combination of BEC zones, tree species, stand
density, site index, stand age, and any previous treatments). The objective of the ranking
system is to ensure that the most valuable plot per matrix cell is protected. This 4-year plan
identified approximately 1,700 rank 1 plots that were the highest value plots in each matrix cell.
Resources made it possible to measure approximately 150 plots per year creating a 10-15 year
re-measurement cycle.
3 De Jong et al. 1994. Quality Ratings for Permanent Sample Plots. A report to the Forest Productivity Councils of BC, by the PSP ranking subcommittee of TAC.

5
10-Year Strategy: Goals and Actions
The objective of this 10-Year Strategic Plan is to develop a consistent re-measurement schedule
to meet growth-and-yield data requirements, while enhancing plot protection, data quality,
collaboration, and communication. The 10-Year Strategic Plan is divided into 6 goals that have
associated actions and descriptions. A timeline for accomplishing these actions is provided in
Table A1.
Based on the netdown criteria and matrix ranking system used to prioritize plots for protection
and re-measurement, the 10-Year Plan has identified 2,759 plots to protect and 1,710 plots to
re-measure (Table 1). Re-measurement of 1,710 plots every 10-years creates a need to re-
measure 150 to 200 plots annually. Plots are protected if they are part of a special project that
focused on red alder and western redcedar because this project was specifically targeted to fill
gaps in understanding (Table 2). Further, all rank 2 plots are protected for flexibility and
replacement if needed (Table 2). Finally, PSPs with >=30 years of total measurement period are
protected because of the long-term nature of these plots providing valuable information (Table
2).
Table 1. Netdown criteria used to select the number of PSP samples to protect and re-measure.
Retention Criteria Removal Criteria # Samples Removed
# Samples Remaining
Total # ground samples within FAIB
18,861
G & R sample types CMI, CMO, I, T, VRI, YSM 10,966 7,895
Active (A) and partial damaged (P) status B, D, L, X status 2,418 5,477
Crown forest land Private and IR land 635 4,842
Individual plot size >= 0.04ha Plot size < 0.04ha 18 4,824
GPS coordinates and/or access notes No location reference 0 4,824
Last measured >= 1990 Last measured < 1990 199 4,625
PSPs to protect (meets one of Criteria A-D*) Not meeting any of A-D 1,866 2,759
PSPs to re-measure (meets Criteria A-B*) Not meeting Criteria A-B 1,049 1,710
*See Table 2.
Table 2. Criteria for PSP protection in order of priority with re-measurements planned for plots
in Criteria A and B.
Criteria for PSP protection in order of priority # of plots
A. Rank 1 PSPs (Matrix Defn 1) with >1 msmt 1,675
B. Special project PSPs (Dr, Cw focus) regardless of rank or # msmts 35
C. Rank 2 PSPs (Matrix Defn 1) with > 1msmt 615
D. PSPs with >=30yr total msmt period, regardless of rank 434
Total # PSPs to protect 2,759

6
Goal 1. Enhance protection of PSPs
For PSPs to be viable, and considered for re-measurement, it is required that they be protected from harvesting and other developments (pipelines, roads, landing, etc). Recently, several plots have been harvested without consent. Therefore, efforts to improve communication and understanding of this program, where to find plots, and what to do if plots are in a development area are priorities in the coming years.
# Action Reason
1 Update the District Offices on the location and importance of the PSP program and provide a guidance document on how to deal with conflicting PSPs.
District staff can use this information to identify and address possible conflicts. Some staff might not know where to look for the most up-to-date information or be confused about which plots are protected and which are inactive.
2 Assist District staff in providing a guidance document to licensees about how to identify potentially conflicting PSPs and the procedure to follow when one is identified.
District staff are the main point contact for licensees and will know which licensees are operating in their area.
3 Ensure that PSPs are properly mapped in the Growth-and-Yield Layer and all documentation points to this layer as the authoritative source for PSP location.
Map Notation was used in the past to identify PSP location, but it is inaccurate and incomplete (Figure A4).
4 Update the website with relevant information about the program, its importance and where to go to determine protected plots.
Many people use websites as the first method of information collection. Currently, the website is out-of-date and lacking relevant links to more information.
5 Update the memo from the chief forester in regards to PSP protection.
This memo is out-of-date and refers to Map Notation instead of the Growth-and-Yield Layer.
6 Clarify the difference between CMI and PSP plots in terms of protection.
The Inventory Branch has many plot types some which are protected and some that are not protected. Clarifying this distinction is important.
7
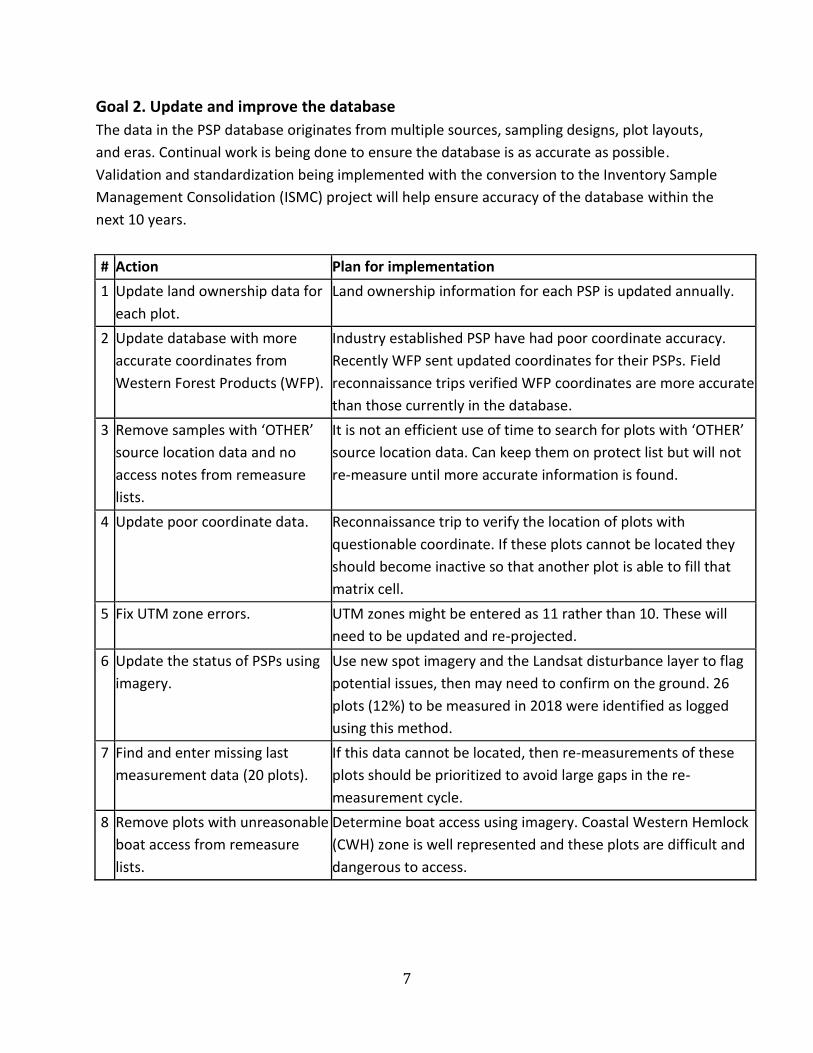
Goal 2. Update and improve the database
The data in the PSP database originates from multiple sources, sampling designs, plot layouts,
and eras. Continual work is being done to ensure the database is as accurate as possible.
Validation and standardization being implemented with the conversion to the Inventory Sample
Management Consolidation (ISMC) project will help ensure accuracy of the database within the
next 10 years.
# Action Plan for implementation
1 Update land ownership data for
each plot.
Land ownership information for each PSP is updated annually.
2 Update database with more
accurate coordinates from
Western Forest Products (WFP).
Industry established PSP have had poor coordinate accuracy.
Recently WFP sent updated coordinates for their PSPs. Field
reconnaissance trips verified WFP coordinates are more accurate
than those currently in the database.
3 Remove samples with ‘OTHER’
source location data and no
access notes from remeasure
lists.
It is not an efficient use of time to search for plots with ‘OTHER’
source location data. Can keep them on protect list but will not
re-measure until more accurate information is found.
4 Update poor coordinate data. Reconnaissance trip to verify the location of plots with
questionable coordinate. If these plots cannot be located they
should become inactive so that another plot is able to fill that
matrix cell.
5 Fix UTM zone errors. UTM zones might be entered as 11 rather than 10. These will
need to be updated and re-projected.
6 Update the status of PSPs using
imagery.
Use new spot imagery and the Landsat disturbance layer to flag
potential issues, then may need to confirm on the ground. 26
plots (12%) to be measured in 2018 were identified as logged
using this method.
7 Find and enter missing last
measurement data (20 plots).
If this data cannot be located, then re-measurements of these
plots should be prioritized to avoid large gaps in the re-
measurement cycle.
8 Remove plots with unreasonable
boat access from remeasure
lists.
Determine boat access using imagery. Coastal Western Hemlock
(CWH) zone is well represented and these plots are difficult and
dangerous to access.
8
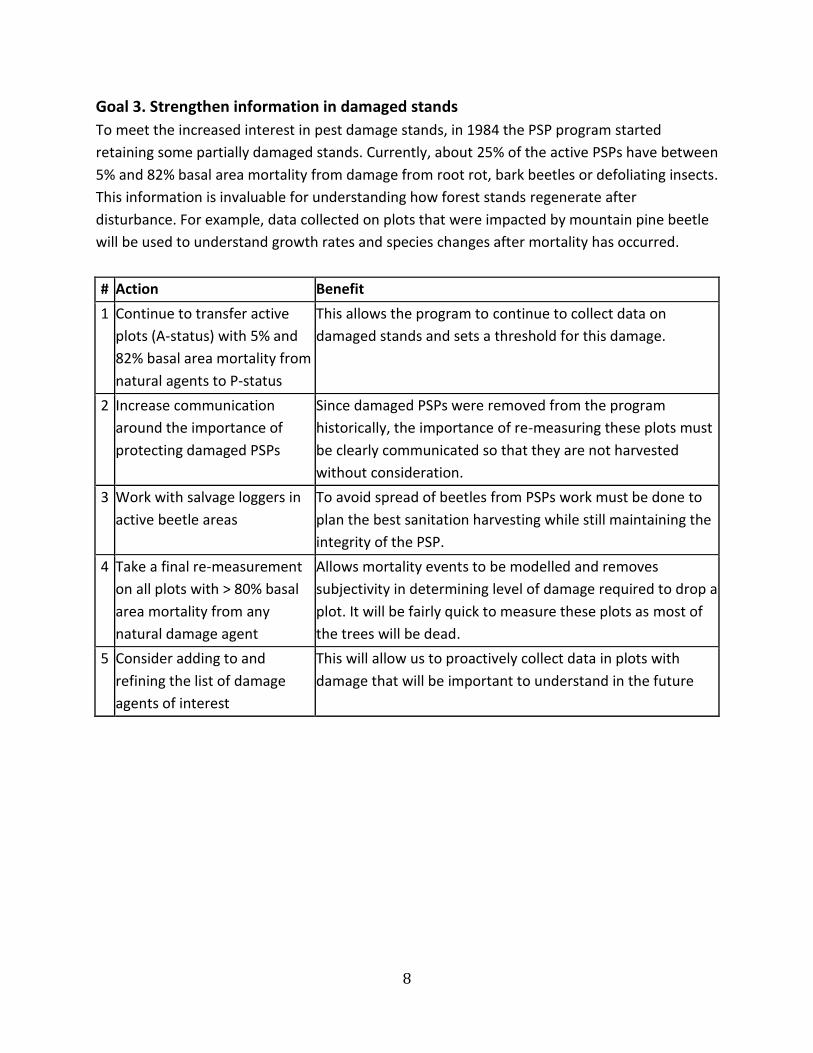
Goal 3. Strengthen information in damaged stands
To meet the increased interest in pest damage stands, in 1984 the PSP program started
retaining some partially damaged stands. Currently, about 25% of the active PSPs have between
5% and 82% basal area mortality from damage from root rot, bark beetles or defoliating insects.
This information is invaluable for understanding how forest stands regenerate after
disturbance. For example, data collected on plots that were impacted by mountain pine beetle
will be used to understand growth rates and species changes after mortality has occurred.
# Action Benefit
1 Continue to transfer active
plots (A-status) with 5% and
82% basal area mortality from
natural agents to P-status
This allows the program to continue to collect data on
damaged stands and sets a threshold for this damage.
2 Increase communication
around the importance of
protecting damaged PSPs
Since damaged PSPs were removed from the program
historically, the importance of re-measuring these plots must
be clearly communicated so that they are not harvested
without consideration.
3 Work with salvage loggers in
active beetle areas
To avoid spread of beetles from PSPs work must be done to
plan the best sanitation harvesting while still maintaining the
integrity of the PSP.
4 Take a final re-measurement
on all plots with > 80% basal
area mortality from any
natural damage agent
Allows mortality events to be modelled and removes
subjectivity in determining level of damage required to drop a
plot. It will be fairly quick to measure these plots as most of
the trees will be dead.
5 Consider adding to and
refining the list of damage
agents of interest
This will allow us to proactively collect data in plots with
damage that will be important to understand in the future

9
Goal 4. Optimize the matrix and selection criteria
The PSP program is not establishing new plots to fill matrix cells. Therefore, the matrix is used
to ensure protection of plots on a range of ecosystem types. Currently matrix cells are very fine
leading to some ecosystems being over represented (Figure A2). The planned actions will
optimize plot protection and re-measurement on a wide and standardized gradient of
ecosystems.
# Action # of
plots Reason
1 Consider industry
established plots as possible
for re-measurement
+312 All these plots are managed by FAIB and should be
considered in our active pool of samples.
2 Change threshold for pure
stands from 70% to 80%
leading species
-1 To be consistent with the Stand Description manual and
the FAIB analysis team.
3 Change the age class matrix
attribute to have 7 equal
bins each of 40 year
increments
-205 This removes bias towards younger stands and avoids
under representation of older stands. It also simplifies
the matrix.
4 Remove BEC variant from
the matrix
-170 The site productivity gradient is captured by the site
index attribute making BEC variant redundant. It also
simplifies the matrix.
5 Add 0-msmt plots to fill gaps
in the matrix.
~+604 Currently 0-msmt plots are not protected or re-
measured in the PSP program but could be useful in
some situations. 604 plots in total but significantly less
would be considered for re-measurement.

10
Goal 5. Strengthen communication and collaboration
Improved communication around the goals and benefits of the PSP program will enhance plot
protection and support for the program, thereby helping to meet other program goals.
# Action Planning and examples
1 Increase collaboration and integration internally with other Inventory programs.
This will be facilitated by conversion to ISMC. Change management for PSP is also considering standardization of some procedures.
2 Increase collaboration externally with academia, other government offices and private sector stakeholders.
One example of such an initiative currently underway is collaborating with the Pacific Forestry Centre to support the development of a National tree core catalogue.
3 Update the website with relevant and important information on the PSP program.
This could be supported by a link to a report of the current status and future direction of the PSP program.
4 Increase access to and usability of PSP data.
Possibly create a standard request for data form online that links to a data sharing agreement. Make it possible to select variables and areas of interest.
5 Build on existing collaborations. Follow up with current users of the data to see how their work is progressing, outcomes, findings and synergies. Including the ABCFP GY Initiative.
Goal 6. Maintain and develop skilled contractors and Ministry staff
One challenge for the continued success of the program is maintaining a steady level of
Ministry staff as well as skilled contractors. Within the next 10-years there will be considerable
turn-over of staff and contractors. Training and succession planning will be critical for this
transition to go smoothly.
# Action Reason
1 Communicate the 10-Year strategic plan with contractors.
So they know there is stable work in the program to invest in learning new handhelds and training new staff.
2 Support staff with helping on the ISMC conversion and handheld development.
Successful implementation of ISMC will help support many goals.
3 Host training and mentoring sessions for contractors.
Having skilled contractors is required for successful contracts and high quality data collection.
4 Hire new staff before retirements occur. To ensure knowledge transfer.

11
Implementation
The program will need to maintain and slightly increase (1) internal capacity to carry out
program actions, administer contracts, and organize training programs; (2) external
capacity of contractors as they retire; and (3) the budget as access to plots becomes
more difficult.
Over the last 4 years, the budget for re-measurement of PSPs has been around
$250,000.
Many of the action items are currently in progress and will be complete within 2018
(Table A1). Some of the action items will need to be re-visited every two or three years
as imagery gets updated, new information becomes available, and situations change
(Table A1). Other action items are ongoing in that they will continually need to be
considered, such as, collaboration and communication (Table A1).
Training with the new handheld data collection tool will be needed in 2019 and 2020
with planned training for contractors every two years (Table A1).
Over the next 10-years, if resources increase priority should be given to:
1. Re-measure protected plots (Criteria B-D in Table 2),
2. Re-measure rank 1 plots with only establishment data (measurement-0 plots),
3. Analyze the current database to provide new insights,
4. Collect new data on plots to address a specific need, and finally
5. Establish new plots to meet a specific need.
Conclusion
The recommended goals and actions within this 10-Year Strategic Plan will strengthen
the PSP database in providing credible information on forest condition to support
modelling and forest management decisions.
Consistent re-measurement of plots over time is needed for the data to be used in its
designed capacity to meet the objectives of supporting Growth and Yield Modelling and
management decisions.
Stable and secure funding, support and staffing are required for this program to thrive
and contribute to knowledge of forest condition used by many stakeholders.
The next 10 years of the program will build on its strengths and ensure continuity in
data collection within this legacy of database.
LiDAR validation, forest health, wildlife habitat, wildfire dynamics, climate change
impacts, and carbon budgets will likely be relevant issues for the PSP program in the
next 10 years.

12
Appendix A: Supplemental Information
Figure A1. The location of all active PSPs in the province. The number of measurements per
plot is indicated in the legend.
13
Figure A2. Heat map showing matrix cells over represented (green) and under representation (red) by PSPs compared to the THLB. In this figure the
matrix is a two dimensional representation of Biogeoclimatic Ecosystem Classification (BEC) zones and stand age (years).

14
Figure A3. Count of the number of plots measured per year including establishment measurements, re-measurements and measurement data
purchased from industry.

15
Figure A4. The Data BC Growth-and-Yield Samples-Active Status layer (orange) is the authoritative source for PSP location. This image compares the
Map Notation (blue) layer to the Growth-and-Yield Samples-Active Status layer (orange) showing that the Map Notation layer can be incorrect due
to missing plots and shifts in plot location.
16
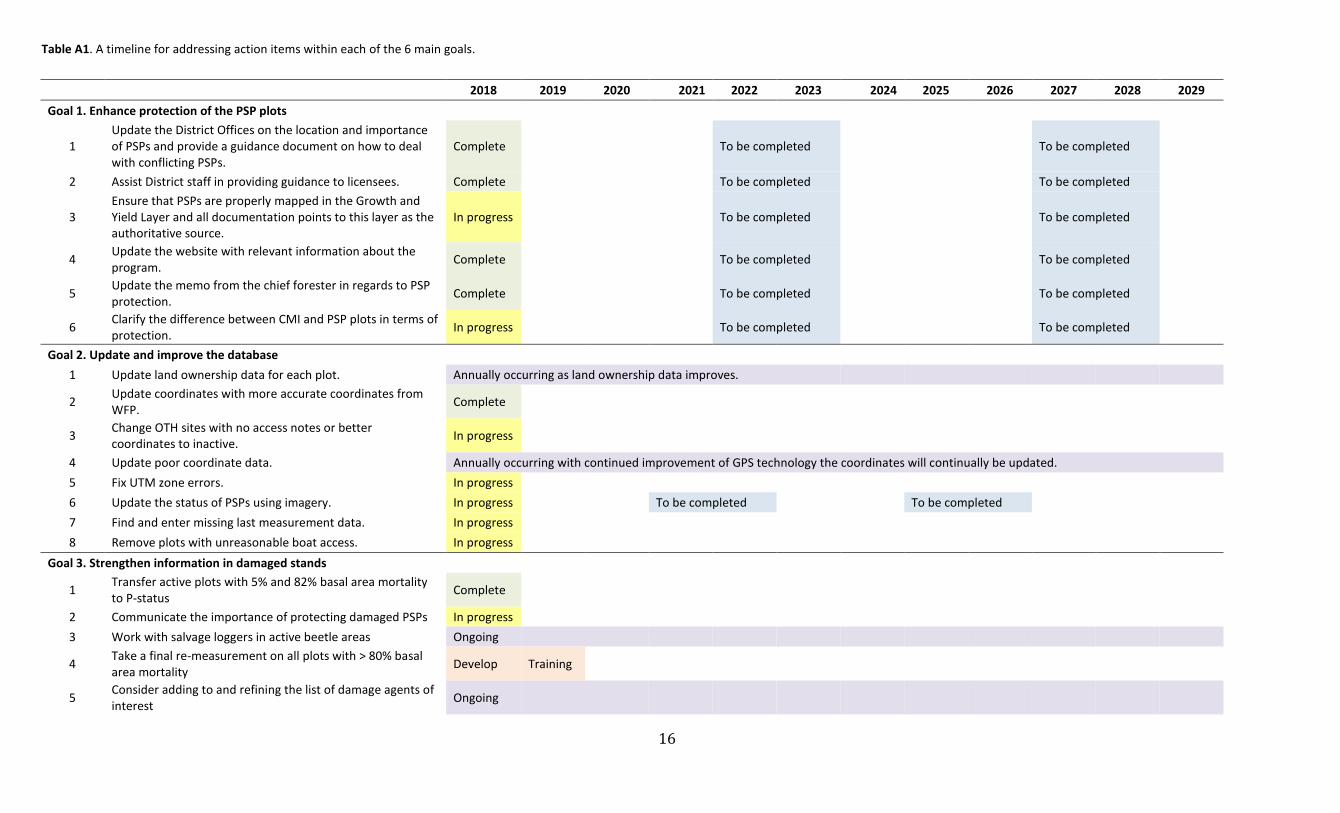
Table A1. A timeline for addressing action items within each of the 6 main goals.
2018 2019 2020 2021 2022 2023 2024 2025 2026 2027 2028 2029
Goal 1. Enhance protection of the PSP plots
1 Update the District Offices on the location and importance of PSPs and provide a guidance document on how to deal with conflicting PSPs.
Complete
To be completed
To be completed
2 Assist District staff in providing guidance to licensees. Complete
To be completed
To be completed
3 Ensure that PSPs are properly mapped in the Growth and Yield Layer and all documentation points to this layer as the authoritative source.
In progress
To be completed
To be completed
4 Update the website with relevant information about the program.
Complete
To be completed
To be completed
5 Update the memo from the chief forester in regards to PSP protection.
Complete
To be completed
To be completed
6 Clarify the difference between CMI and PSP plots in terms of protection.
In progress
To be completed
To be completed
Goal 2. Update and improve the database
1 Update land ownership data for each plot. Annually occurring as land ownership data improves.
2 Update coordinates with more accurate coordinates from WFP.
Complete
3 Change OTH sites with no access notes or better coordinates to inactive.
In progress
4 Update poor coordinate data. Annually occurring with continued improvement of GPS technology the coordinates will continually be updated.
5 Fix UTM zone errors. In progress
6 Update the status of PSPs using imagery. In progress
To be completed
To be completed
7 Find and enter missing last measurement data. In progress
8 Remove plots with unreasonable boat access. In progress
Goal 3. Strengthen information in damaged stands
1 Transfer active plots with 5% and 82% basal area mortality to P-status
Complete
2 Communicate the importance of protecting damaged PSPs In progress
3 Work with salvage loggers in active beetle areas Ongoing
4 Take a final re-measurement on all plots with > 80% basal area mortality
Develop Training
5 Consider adding to and refining the list of damage agents of interest
Ongoing

17
2018 2019 2020 2021 2022 2023 2024 2025 2026 2027 2028 2029
Goal 4. Optimize the matrix and selection criteria
1 Consider industry and MOF established plots equally. Complete
Re-assess matrix
Re-assess matrix
2
Change threshold for pure stands from 70% to 80% leading species.
Complete
Re-assess matrix
Re-assess matrix
3
Change the age class matrix attribute to 7 equal bins of 40 years each.
Complete
Re-assess matrix
Re-assess matrix
4 Remove BEC variant from the matrix. Complete
Re-assess matrix
Re-assess matrix
5 Add 0-msmt plots to fill gaps in the matrix. In progress with matrix evaluation contract.
To be revisited every few years as circumstances change.
Goal 5. Strengthen communication and collaboration
1 Increase collaboration internally with other Inventory programs.
In progress Facilitated by ISMC Ongoing
2 Increase collaboration externally. Ongoing
3 Update the website with relevant information on the PSP program.
In progress
To be completed
To be completed
4 Increase access to and usability of PSP data. Ongoing
5 Build on existing collaborations. Ongoing
Goal 6. Maintain and develop skilled contractors and Ministry staff
1 Communicate the 10-Year Strategic Plan with contractors. Planned
2 Staffing to support ISMC conversion and handheld development.
Conversion Testing Training
3 Host training and mentoring sessions for contractors.
Training
Training
Training
4 Hire new staff before retirements occur. Ongoing

18


