Page 1
Civil Engineering Infrastructures Journal, 49(1): 149 – 164, June 2016
Print ISSN: 2322-2093; Online ISSN: 2423-6691
DOI: 10.7508/ceij.2016.01.011
* Corresponding author E-mail: [email protected]
149
Permeability Characteristics of Compacted and Stabilized Clay with
Cement, Peat Ash and Silica Sand
Mousavi, S.E.1*
and Wong, L.S.2
1
Ph.D., Civil Engineering Department, College of Engineering, Universiti Tenaga
Nasional, IKRAM-UNITEN Road, 43000 Kajang, Selangor, Malaysia. 2
Associate Professor, College of Graduate Studies, Universiti Tenaga Nasional, IKRAM-
UNITEN Road, 43000 Kajang, Selangor, Malaysia.
Received: 29 Jun. 2015; Revised: 08 Dec. 2015; Accepted: 23 Dec. 2015
ABSTRACT: The present paper investigates the influence of stabilization with cement,
peat ash, and silica sand on permeability coefficient (kv) of compacted clay, using a novel
approach to stabilize the clay with peat ash as a supplementary material of cement in the
compacted and stabilized soil. In order to assess the mentioned influence, test specimens of
both untreated and stabilized soil have been tested in the laboratory so that their
permeability could be evaluated. Falling head and one dimensional consolidation tests of
laboratory permeability were performed on the clay specimens and the chemical
compositions of the materials as well as microstructure of the stabilized soil with 18%
cement, 2% peat ash, and 5% silica sand were investigated, using X-ray fluorescence and
scanning electron microscopy respectively. Results show that for soil stabilization with up
to 8% cement content (of the dry weight of the soil), the average value of coefficient of
permeability (kv) is very close to that of untreated soil, whereas the kv value decreases
drastically for 18% cement under identical void ratio conditions. It is further revealed that
addition of 18% cement, 2% peat ash, and 5% silica sand had decreased the coefficient of
permeability by almost 2.2 folds after 24 h, while about 1.7 folds increase was observed in
coefficient of permeability once 13.5% of cement, 1.5% of peat ash, and 20% of silica sand
were added. The partial replacement of cement with the 2% peat ash can reduce the
consumption of cement for soil stabilization.
Keywords: Falling Head, One Dimensional Consolidation, Peat Ash, Permeability, Silica
Sand.
NOMENCLATURES
kv: coefficient of permeability in vertical
direction (m/s)
k20: coefficient of permeability at 20°C (m/s)
kT°C: coefficient of permeability at required
temperature (m/s)
A: cross sectional area of the specimen in
falling head test (mm2)
a: cross sectional area of standpipe tube
(mm2)
Cv: coefficient of consolidation (m2/year)
h: head loss in standpipe (mm)
Page 2
Mousavi, S.E. and Wong, L.S.
150
L: length of specimen in falling head test
(mm)
mv: coefficient of volume change (m2/MN)
Sc: compression settlement (mm)
Q: quantity of flow (mm3/s)
t: time (s)
V: flow velocity (m/s)
γw: unit weight of water (kN/m3)
S: specific surface of the cement or peat ash
(cm2/g)
Ss: specific surface of the standard sample
used in calibration of the apparatus (3640
cm2/g)
T: time taken for the manometer liquid to
drop from the second to the third level
during the test (second)
Ts: time taken for the manometer liquid to
drop from the second to the third level
during the calibration (second)
MDD: Maximum Dry Density (Mg/m3)
OMC: Optimum Moisture Content (%)
INTRODUCTION
Stabilization of fine grained soils has being
executed extensively. The Mesopotamians
and Romans separately found that it was
possible to improve the ability of pathways
to carry the traffic by mixing the weak soil
with a stabilizing agent which improved
their load-bearing ability (Kowalski et al.,
2007). Compacted soil, stabilized with
cement, has been widely used in
geotechnical engineering applications such
as highway embankment and slopes.
Stabilization techniques can improve the
durability and strength of soil as a result of
mixing it with appropriate proportions of
different stabilizers such as cement, lime,
sand, and various ashes. Scientific
techniques of soil stabilization have been
introduced in recent years with the use of
pozzolanic materials like Portland cement as
a stabilizer and hydration agent being quite
popular. Stabilizers with pozzolanic
properties can bind soil particles together
and reduce water absorption by clay
particles (Hossain and Mol, 2011). In recent
years soil stabilization with cement has
become common owing to its low cost of
cement and availability in most countries.
Stabilization can improve the soil in its
water content and cementing agent. In other
words, chemical interactions between soil
particles, cement, and water content reduce
pore spaces of the soil (Horpibulusk et al.,
2010). Thus, stabilized soil with cement
could gain adequate strength and improved
properties in a short time. The improved soil
with low permeability, high strength, and
sufficient thickness can be used in field
requests such as highway construction.
Furthermore, clay has many useful
applications due to its physical properties
such as fine particle size and large surface
area. The effect of some influential factors,
e.g., water content, pozzolanic materials,
cement content and compaction energy on
the engineering characteristics of stabilized
soil with cement and natural pozzolans have
been extensively researched by Hossain and
Mol (2011) and Wong et al. (2013). Previous
researches have proven that cement
decreases the coefficient of permeability
while sand increases the permeability
(Goodary et al., 2012). Meanwhile, the
effect of peat ash on coefficient of
permeability of clay soil has not been
investigated completely. According to
Mousavi and Wong (2015), stabilization of
soft clay with cement and peat ash could
improve the strength and density of soil.
This paper presents a novel material in the
form of peat ash that can be obtained by
burning peat at the temperature of 440 °C for
4 hours in a muffle furnace (ASTM D2974-
14). Peat is an organic soil with a high
content of organic matter. Depending on the
fiber content, ash content, and pH value,
peat can be classified as fibric, hemic, and
sapric; low ash, medium ash, and high ash;
highly-acidic, moderate-acidic, slightly-
Page 3
Civil Engineering Infrastructures Journal, 49(1): 149 – 164, June 2016
151
acidic, and basic peat respectively (Bujang et
al., 2011). Although cement is one of the
oldest building materials around; it is
produced at a very high temperature of about
1500°C in order to make it possible for the
clinker to form. The main concern of cement
production is its highly energy-intensive
process and greenhouse gas production,
resulting in environmental damages due to
its carbon dioxide (CO2) output (Mahasenan
et al., 2003). Therefore, utilization of peat
ash to stabilize clayey soil and partial
replacement of cement with peat ash can
reduce the latter’s use in the stabilized soil,
offering some environmental advantages. On
the other hand, the successful application of
any ground improvement technology begins
with the site application and field demand.
Thus stabilized soil with sufficient thickness,
bearing capacity and strength can be applied
in accordance to a site request such as a
request for highway embankment.
Therefore, it is important to examine the
permeability characteristics of stabilized
clay in order to evaluate the reduction of the
pore spaces in the stabilized soil as a result
of cementation effect. Although, the
previous researches have investigated
permeability of stabilized soils (Abdi and
Pajouh 2009; Ghasemzadeh and Abounouri
2013; Bazargan and Shoaei, 2010), there has
been a limited number of studies on the
permeability of stabilized clay with cement,
peat ash, and silica sand. The main objective
of this paper is, therefore, to evaluate
coefficient of permeability of compacted and
stabilized clay with various proportions of
cement, peat ash, and silica sand.
MATERIALS AND METHODS
Collecting Soil Samples and Used
Material
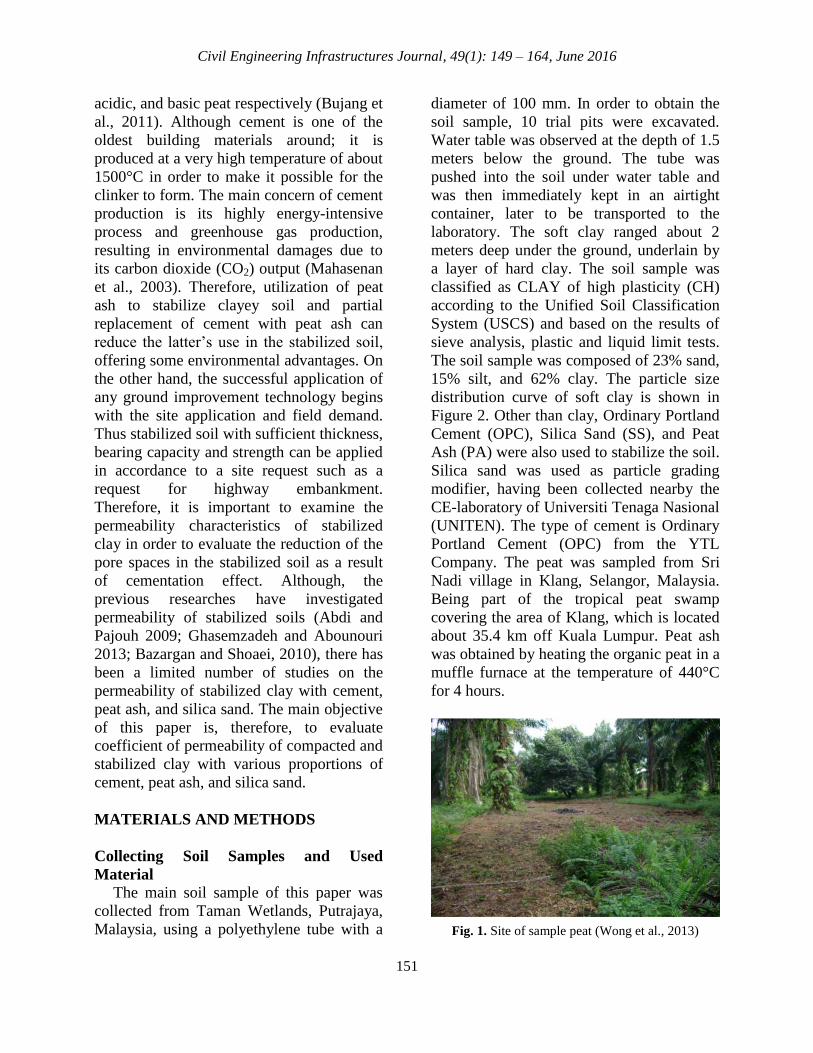
The main soil sample of this paper was
collected from Taman Wetlands, Putrajaya,
Malaysia, using a polyethylene tube with a
diameter of 100 mm. In order to obtain the
soil sample, 10 trial pits were excavated.
Water table was observed at the depth of 1.5
meters below the ground. The tube was
pushed into the soil under water table and
was then immediately kept in an airtight
container, later to be transported to the
laboratory. The soft clay ranged about 2
meters deep under the ground, underlain by
a layer of hard clay. The soil sample was
classified as CLAY of high plasticity (CH)
according to the Unified Soil Classification
System (USCS) and based on the results of
sieve analysis, plastic and liquid limit tests.
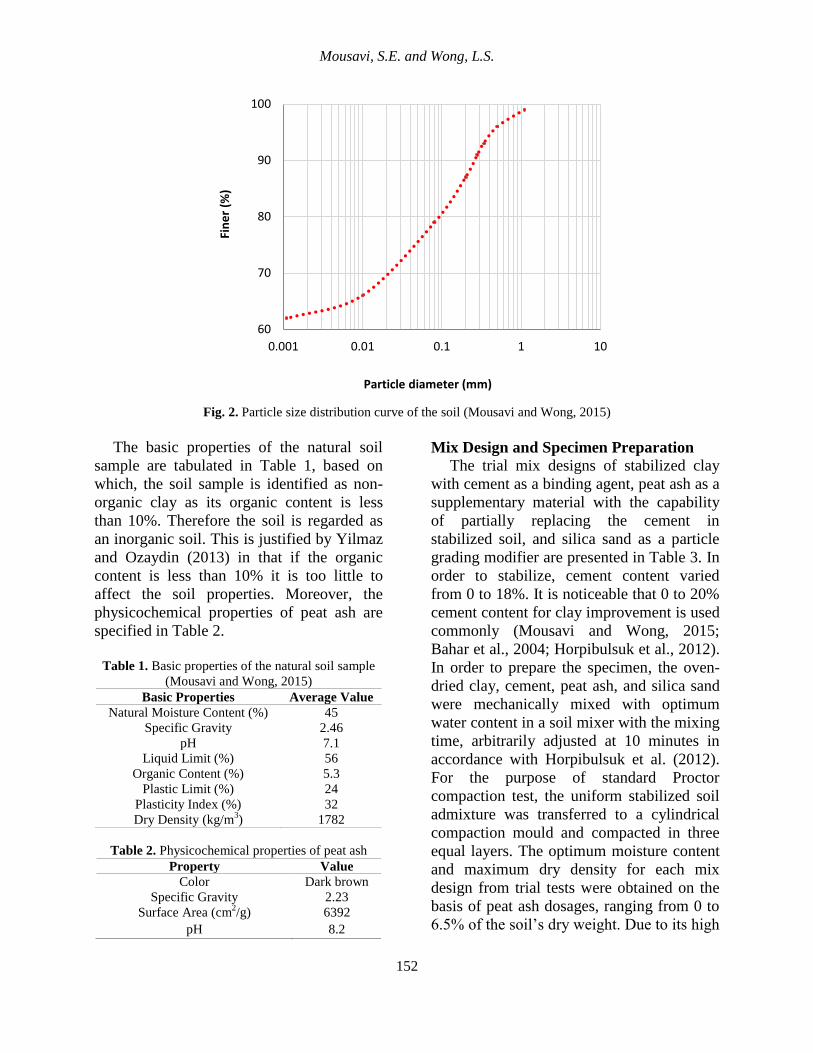
The soil sample was composed of 23% sand,
15% silt, and 62% clay. The particle size
distribution curve of soft clay is shown in
Figure 2. Other than clay, Ordinary Portland
Cement (OPC), Silica Sand (SS), and Peat
Ash (PA) were also used to stabilize the soil.
Silica sand was used as particle grading
modifier, having been collected nearby the
CE-laboratory of Universiti Tenaga Nasional
(UNITEN). The type of cement is Ordinary
Portland Cement (OPC) from the YTL
Company. The peat was sampled from Sri
Nadi village in Klang, Selangor, Malaysia.
Being part of the tropical peat swamp
covering the area of Klang, which is located
about 35.4 km off Kuala Lumpur. Peat ash
was obtained by heating the organic peat in a
muffle furnace at the temperature of 440°C
for 4 hours.
Fig. 1. Site of sample peat (Wong et al., 2013)
Page 4
Mousavi, S.E. and Wong, L.S.
152
Fig. 2. Particle size distribution curve of the soil (Mousavi and Wong, 2015)
The basic properties of the natural soil
sample are tabulated in Table 1, based on
which, the soil sample is identified as non-
organic clay as its organic content is less
than 10%. Therefore the soil is regarded as
an inorganic soil. This is justified by Yilmaz
and Ozaydin (2013) in that if the organic
content is less than 10% it is too little to
affect the soil properties. Moreover, the
physicochemical properties of peat ash are
specified in Table 2.
Table 1. Basic properties of the natural soil sample
(Mousavi and Wong, 2015)
Basic Properties Average Value
Natural Moisture Content (%) 45
Specific Gravity 2.46
pH 7.1
Liquid Limit (%) 56
Organic Content (%) 5.3
Plastic Limit (%) 24
Plasticity Index (%) 32
Dry Density (kg/m3) 1782
Table 2. Physicochemical properties of peat ash Property Value
Color Dark brown
Specific Gravity 2.23
Surface Area (cm2/g) 6392
pH 8.2
Mix Design and Specimen Preparation
The trial mix designs of stabilized clay
with cement as a binding agent, peat ash as a
supplementary material with the capability
of partially replacing the cement in
stabilized soil, and silica sand as a particle
grading modifier are presented in Table 3. In
order to stabilize, cement content varied
from 0 to 18%. It is noticeable that 0 to 20%
cement content for clay improvement is used
commonly (Mousavi and Wong, 2015;
Bahar et al., 2004; Horpibulsuk et al., 2012).
In order to prepare the specimen, the oven-
dried clay, cement, peat ash, and silica sand
were mechanically mixed with optimum
water content in a soil mixer with the mixing
time, arbitrarily adjusted at 10 minutes in
accordance with Horpibulsuk et al. (2012).
For the purpose of standard Proctor
compaction test, the uniform stabilized soil
admixture was transferred to a cylindrical
compaction mould and compacted in three
equal layers. The optimum moisture content
and maximum dry density for each mix
design from trial tests were obtained on the
basis of peat ash dosages, ranging from 0 to
6.5% of the soil’s dry weight. Due to its high
60
70
80
90
100
0.001 0.01 0.1 1 10
Fin
er
(%)
Particle diameter (mm)
Page 5
Civil Engineering Infrastructures Journal, 49(1): 149 – 164, June 2016
153
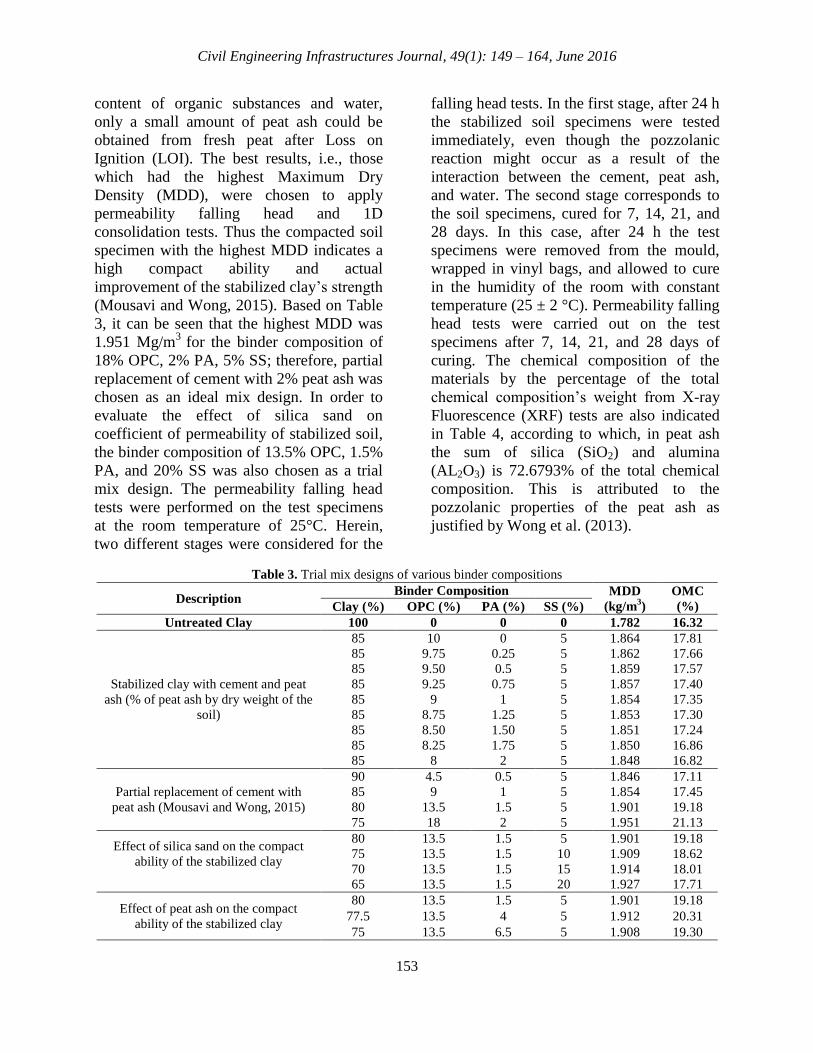
content of organic substances and water,
only a small amount of peat ash could be
obtained from fresh peat after Loss on
Ignition (LOI). The best results, i.e., those
which had the highest Maximum Dry
Density (MDD), were chosen to apply
permeability falling head and 1D
consolidation tests. Thus the compacted soil
specimen with the highest MDD indicates a
high compact ability and actual
improvement of the stabilized clay’s strength
(Mousavi and Wong, 2015). Based on Table
3, it can be seen that the highest MDD was
1.951 Mg/m3
for the binder composition of
18% OPC, 2% PA, 5% SS; therefore, partial
replacement of cement with 2% peat ash was
chosen as an ideal mix design. In order to
evaluate the effect of silica sand on
coefficient of permeability of stabilized soil,
the binder composition of 13.5% OPC, 1.5%
PA, and 20% SS was also chosen as a trial
mix design. The permeability falling head
tests were performed on the test specimens
at the room temperature of 25°C. Herein,
two different stages were considered for the
falling head tests. In the first stage, after 24 h
the stabilized soil specimens were tested
immediately, even though the pozzolanic
reaction might occur as a result of the
interaction between the cement, peat ash,
and water. The second stage corresponds to
the soil specimens, cured for 7, 14, 21, and
28 days. In this case, after 24 h the test
specimens were removed from the mould,
wrapped in vinyl bags, and allowed to cure
in the humidity of the room with constant
temperature (25 ± 2 °C). Permeability falling
head tests were carried out on the test
specimens after 7, 14, 21, and 28 days of
curing. The chemical composition of the
materials by the percentage of the total
chemical composition’s weight from X-ray
Fluorescence (XRF) tests are also indicated
in Table 4, according to which, in peat ash
the sum of silica (SiO2) and alumina
(AL2O3) is 72.6793% of the total chemical
composition. This is attributed to the
pozzolanic properties of the peat ash as
justified by Wong et al. (2013).
Table 3. Trial mix designs of various binder compositions
Description Binder Composition MDD
(kg/m3)
OMC
(%) Clay (%) OPC (%) PA (%) SS (%)
Untreated Clay 100 0 0 0 1.782 16.32
Stabilized clay with cement and peat
ash (% of peat ash by dry weight of the
soil)
85 10 0 5 1.864 17.81
85 9.75 0.25 5 1.862 17.66
85 9.50 0.5 5 1.859 17.57
85 9.25 0.75 5 1.857 17.40
85 9 1 5 1.854 17.35
85 8.75 1.25 5 1.853 17.30
85 8.50 1.50 5 1.851 17.24
85 8.25 1.75 5 1.850 16.86
85 8 2 5 1.848 16.82
Partial replacement of cement with
peat ash (Mousavi and Wong, 2015)
90 4.5 0.5 5 1.846 17.11
85 9 1 5 1.854 17.45
80 13.5 1.5 5 1.901 19.18
75 18 2 5 1.951 21.13
Effect of silica sand on the compact
ability of the stabilized clay
80 13.5 1.5 5 1.901 19.18
75 13.5 1.5 10 1.909 18.62
70 13.5 1.5 15 1.914 18.01
65 13.5 1.5 20 1.927 17.71
Effect of peat ash on the compact
ability of the stabilized clay
80 13.5 1.5 5 1.901 19.18
77.5 13.5 4 5 1.912 20.31
75 13.5 6.5 5 1.908 19.30
Page 6
Mousavi, S.E. and Wong, L.S.
154
Table 4. Chemical composition of the additives for soil stabilization under study
Oxide Compound Weight (%)
OPC Silica Sand Peat Ash
Al2O3 5.6111 5.1661 22.7316
SiO2 21.5602 89.0011 49.9477
SO3 2.1688 0.1421 -
Alkali (K2O, Na2O) - 1.4632 2.8794
CaO 64.9375 0.3372 5.5818
Fe2O3 3.6576 1.0301 17.7265
Others 2.0648 2.8602 1.133
Experimental Procedures
The test methods are based on the
guidelines of ASTM standard. Laboratory
investigation focused on the permeability
falling head (ASTM D5084-03), one
dimensional consolidation (ASTM D2435),
and fineness of materials (ASTM C204-11)
tests. In addition, standard Proctor
compaction test was performed to obtain the
mix design in terms of optimum moisture
content and maximum dry density (ASTM
D698). The diameter and height of the
prepared soil specimens were 50 mm and 20
mm for consolidation test respectively,
whereas in the falling head test the diameter
was 100 mm and the height, 121 mm.
Falling head test
The falling head test was applied in order
to determine the coefficient of permeability
of both untreated and stabilized soil
specimens. To perform the test, the
compacted soil specimen at optimum
moisture content was placed in a metal
mould. Filter papers were positioned at the
top and bottom faces of the soil specimen to
prevent its separation. The assembled
permeameter cell was placed in the
immersion tank. Water was allowed to flow
through the specimen from a standpipe
attached to the top of the mould and
saturated the soil specimen. The test was
conducted at constant 28°C and at different
times, resulting in the head of water change
in a standpipe. The flow velocity in the tube
is given by Eq. (1) (Das, 1989).
𝑉 = −𝑑ℎ
𝑑𝑡 (1)
The coefficient of permeability of the soil
specimen is formulated by Eq. (2) (Das,
1989).
k=2.3026aL
Atlog
10
h1
h2
(mm
s) (2)
The coefficient of permeability at 20°C is
corrected as shown in Eq. (3) (Das, 1989).
k20°C = kT°C×0.8472 (3)
One Dimensional Consolidation Test
The soil sample was placed in a
compaction mould and compacted in three
equal layers at optimum moisture content
and maximum dry density. The compacted
soil specimen was then trimmed with a brass
cutter ring, 50 mm wide and 20 mm high.
Next, the soil specimen was made level with
the end faces of the cutting ring and filter
papers and porous stones were positioned at
the top and bottom faces of the test
specimen. The 1D consolidation tests were
applied on the soil specimens under identical
void ratio conditions. Similar to untreated
soil specimen, the mixture of soil and
additives was compacted at optimum
moisture content and maximum dry density.
The effective vertical stresses of 2.5 kPa, 5
kPa, 10 kPa, 20 kPa, 40 kPa, 80 kPa, and
160 kPa were applied on the 1D
Page 7
Civil Engineering Infrastructures Journal, 49(1): 149 – 164, June 2016
155
consolidation test specimens. The load
increment was two folds larger than the
previous load. The duration of each load was
24 hours. Based on the results of the 1D
consolidation test, the coefficient of
permeability was determined by Eq. 4 (Das,
1989).
k=cv×mv×γw
(4)
Fineness test
The hydration rate depends on the
fineness of the cement particles. Hydration
of cement starts at the surface of cement
particles. Since the total surface area of
cement represents the material available for
hydration. Similarly, high fineness is
necessary to achieve rapid development of
strength (ASTM C204-11). To determine the
fineness of cement and peat ash the
manometer liquid top surface inside the
manometer was adjusted at the lowest
marked level of the manometer. A sample of
ordinary Portland cement of 2.80 g was
prepared in a container. The perforated disk
was placed inside the cell and pushed to the
bottom of the cell. The filter paper was
positioned into the cell to sit on top of the
perforated disk. The cement sample was
poured into the cell, and a filter paper was
placed on top of the cement sample, using a
plunger. The top surface of the manometer,
where the cell should be placed, was lightly
lubricated. The manometer’s valve and air
pump were opened and the cell was placed
on top of the former. The level of the liquid
moved up after both the pump and the
manometer’s valve were closed at the point
in which the liquid level reached the highest
marked level of the manometer, itself. The
stopwatch was started as soon as the level of
liquid started to fall down. The time between
the second marked level from the top and the
third marked level was recorded. The test
also was repeated with 2.80 g peat ash
sample and the specific surface of the
cement sample is formulated in Eq. (5) (Das,
1989).
SS TTSS
(5)
Microstructure analysis
The microstructure of the stabilized soil
with a binder composition of 18% OPC, 2%
PA, and 5% SS was examined under
Scanning Electron Microscopy (SEM) tests,
for which a 10×5 mm2 test specimen was cut
from the compacted and stabilized soil. The
SEM is a microscope that uses electrons
instead of light to form an image. Since
SEM utilizes vacuum conditions and
electrons to form an image, special
preparations must be done on the test
sample. Therefore, the sample was prepared
in dried condition as the presence of water
would result in moisture vaporizing in the
vacuum.
RESULTS AND DISCUSSION
Permeability Falling Head
Untreated soil
The permeability falling head test was
applied on untreated soil specimen, 100 mm
in diameter and 121 mm in height. The total
duration for untreated clay from the
beginning to the end was determined to be
10171 seconds. Figures 3 and 4 present the
results of this test on untreated soil
specimen. Figure 3 also shows the
relationship between flow velocity at 20°C
and hydraulic gradient, obtained from falling
head test. By analyzing coefficient of
determination (R2), as shown in the Figure 3,
it can be seen that the results are satisfactory
because R2
is almost close to 1. Likewise,
Figure 4 illustrates the water flow versus
time in total duration of 10171 seconds for
untreated clay. Similarly, a study, conducted
by Bahar et al. (2004) on stabilization of
Page 8
Mousavi, S.E. and Wong, L.S.
156
local clay with 20% cement, supports the
present results. It has been found by Bahar et
al. (2004) that the kv value at 20°C of local
clay is 19 × 10−8
ms−1
. Thus, such rate of
permeability is very close to that,
investigated in this paper. Such a small
difference of kv is due to the fact that the
nature of clay of this study is different from
the clay examined by Bahar et al. (2004).
Besides, the similar behavior of Bangkok
clay was found by Horpibulsuk et al. (2011).
According to Horpibulsuk et al. (2011), the
coefficient of permeability of Bangkok clay
was determined about 10-7
to 10-8
cm/s.
Fig. 3. Rate of permeability of the untreated clay
Fig. 4. Flow-time relationship of the untreated clay
kv = 11.44×10⁻⁸ ms-1
R² = 0.864
0.00E+00
2.00E-07
4.00E-07
6.00E-07
8.00E-07
1.00E-06
1.20E-06
0 2 4 6 8
Flo
w v
elo
city
at
20
°C (
ms-1
)
Hydraulic gradient, i
R² = 0.940
0
1
2
3
4
5
6
7
8
9
10
0 500 1000 1500 2000 2500
Flo
w (
mm³s
-1)
Time (s)
Page 9
Civil Engineering Infrastructures Journal, 49(1): 149 – 164, June 2016
157
Stabilized soil
The influence of cement, peat ash, and
silica sand on coefficient of permeability of
the compacted clay is shown in Figures 5
and 6. From Figure 5, it can be observed that
the permeability of stabilized soil with
binder composition of 13.5% OPC, 1.5%
PA, and 20% SS was increased by almost
1.7-fold. This implies that adding more silica
sand imposes more porous and less binding
effect of the cement in the stabilized soil. As
shown in Figure 5, the permeability of the
soil specimen with binder composition of
18% OPC, 2% PA, and 5% SS decreased by
almost 2.2-fold; because, cement as a
binding agent and peat ash as a very fine
material had filled the pore spaces of the
stabilized soil and had reduced the voids by
increasing inter-cluster cementation
bonding. Therefore, low porosity of the
stabilized clay specimen indicates low
permeability, showing that the effect of
water flow on the stabilized soil was
reduced. On the other hand, the stabilized
test specimen with 13.5% OPC, 1.5% PA,
and 20% SS had increased the quantity of
the flow. Figure 6 illustrates the
relationships between flow and time. Here, it
can be seen that the maximum value of the
flow corresponds to the stabilized soil with
the binder composition of 13.5% OPC, 1.5%
PA, and 20% SS; moreover, in case of the
falling head test, total test duration for the
untreated clay was 10171 seconds; while, for
the stabilized soil specimen with 13.5%
OPC, 1.5% PA, and 20% SS, a period of
6026 seconds was determined, implying that
adding 20% silica sand to the stabilized soil
induced more porous and enhanced the
ability of water flow as well as the
permeability rate.
Fig. 5. Rate of permeability of the untreated and stabilized soil specimens
0.00E+00
5.00E-07
1.00E-06
1.50E-06
2.00E-06
2.50E-06
0 2 4 6 8
Flo
w v
elo
city
at
20
ᵒC (
m s
-1)
Hydraulic gradient, i
OPC 13.5%, PA 1.5%, SS 20%
Untreated clay
OPC 18%, PA 2%, SS 5%
Page 10
Mousavi, S.E. and Wong, L.S.
158
Fig. 6. Flow-time relationships of untreated and stabilized clay
Table 5 presents the average values of kv
of the soil specimens after 7, 14, 21, and 28-
day curing. From Table 5, it can be observed
that curing leads to an abrupt decrease in kv
for both untreated and stabilized soil
specimens. The significant decrease in the
quantity of flow during the test, and caused
by cement, peat ash, and silica sand occurred
when the cement with 2% peat ash was
partially replaced after a 28-day curing. For
the binder composition of 18% OPC, 2%
PA, and 5% SS, the quantity of flow and
total duration of the falling head test were
determined 1.78 mm3/s and 20834 seconds
respectively. Therefore, the total elapsed
time for the stabilized soil specimen with the
binder composition of 18% OPC, 2% PA,
and 5% SS is the highest. Indeed, the
fineness of peat ash contributed to the
refinement of pore spaces in the stabilized
soil with 18% OPC, 2% PA, and 5% SS that
further reduced its rate of water permeation.
This can be attributed to the increase of
cement content, probable importation of
sufficient bonding of the cement due to the
increased inter-cluster cementation bonding,
decrease of the pore space and pore
refinement by peat ash, and consequently
less porous and permeability of the
stabilized soil. On the other hand, the
stabilized soil with a binder composition of
13.5% OPC, 1.5% PA, and 20% SS showed
a rather spongy quality under falling head
test, which can be attributed to the presence
of 20% of silica sand, consisted of coarse
particles that enhance the porosity of the soil
specimen. However, after curing it also
decreased the coefficient of permeability,
which is due to the growth of cementation
products over time. It has been proven by
Bahar et al. (2004) that increasing the
cement content in stabilized clay would
decrease the coefficient of permeability
while adding 20% cement would reduce the
permeability from 19×10-8
to 10-9
m/s. The
permeability results of both Bahar et al.
(2004) and the present paper are in close
agreement.
0
2
4
6
8
10
12
14
16
18
20
0 1000 2000 3000 4000 5000
Flo
w (
mm
3s-1
)
Time (s)
OPC 13.5%, PA 1.5%, SS 20%
Untreated clay
OPC 18%, PA 2%, SS 5%
Page 11
Civil Engineering Infrastructures Journal, 49(1): 149 – 164, June 2016
159
Table 5. kv values determined by falling head tests after curing
Target Mix Design Coefficient of Permeability After Curing (m/s)
7-day 14-day 21-day 28-day
Untreated Clay 6.37×10⁻⁸
1.16×10⁻⁸
10.71×10⁻⁹
0.34×10⁻¹⁰
18% OPC, 2% PA, 5% SS 0.12×10⁻⁸
7.61×10⁻⁹
2.25×10⁻⁹
0.58×10⁻¹⁰
13.5% OPC, 1.5% PA, 20% SS 14.21×10⁻⁸
11.33×10⁻⁸
7.55×10⁻⁸
1.08×10⁻⁸
One Dimensional (1D) Consolidation
Results of 1D consolidation test on
untreated and stabilized soil specimens are
given in Table 6. The compacted soil
specimen at optimum water content and
maximum dry density with a diameter of 50
mm and height of 20 mm were tested under
effective vertical stresses that amounted to
2.5 kPa, 5 kPa, 10 kPa, 20 kPa, 40 kPa, 80
kPa, and 160 kPa. After analyzing Table 6, it
can be seen that the coefficients of
permeability of test specimens, formulated
with various mix designs, varied due to
various combinations of cement, peat ash,
and silica sand. Similar to falling head test,
the kv value of the test specimen,
corresponding to the stabilized soil with
18% OPC, 2% PA, and 5% SS under 1D
consolidation test, also decreased drastically,
which can be interpreted by the fact that
adding cement promoted the formation of
cementation products which decreased the
porosity of the stabilized soil due to its
binding actions. The low porosity of the
stabilized clay resulted in its low
permeability. In comparison to that of
untreated soil specimen, it can be stated that
the reduction in the rate of permeability of
the stabilized soil, corresponding to the
binder composition of 18% OPC, 2% PA,
and 5% SS, is abrupt. Based on Table 6, an
abrupt increase in the coefficient of
permeability of the stabilized soil with
13.5% OPC, 1.5% PA, and 20% SS can be
seen. This phenomenon occurs because 20%
silica sand in stabilized soil takes up the
spaces that would have been occupied by the
soil particles. Such result and description of
permeability of the stabilized soil with
cement was reported by Horpibulsuk et al.
(2011). Obviously, the results difference is
due to different binder types and dosages.
Table 6. kv values determined by 1D
consolidation tests Soil Composition Average kv (ms
-1)
Untreated Soil 0.84×10⁻¹⁰
Stabilized Soil with
13.5% OPC, 1.5% PA, 20%
SS
11.74×10⁻⁹
Stabilized Soil with
18% OPC, 2% PA, 5% SS 0.50×10
-10
The results of 1D consolidation tests of
untreated and stabilized soil specimens are
summarized in Table 7. To perform the
recompression tests, each vertical load was
held constant for 24 hours prior to the next
loading increment. At the end of the loading
period for 16 kg, the vertical load was
removed and the specimen allowed to be
swelled for 24 hours. The amount of
consolidation settlement was estimated. It
can be observed from Table 7 that a 1.14
mm compression settlement of the untreated
soil has been reached by the clay under a
consolidation stress of 160 kPa. Likewise, a
0.86 mm compression settlement of the
stabilized soil happened under a
consolidation stress of 160 kPa. The positive
results imply that the binder composition of
18% OPC, 2% PA, and 5% SS improved the
settlement by almost 33%.
The variation of kv versus final void ratio
(e) of untreated and stabilized soil specimens
is shown in Figure 7. Both the coefficient of
permeability (kv) and the void ratio have
increased. Besides, adding 20% silica sand is
believed to cause the abrupt increase in void
ratio and coefficient of permeability.
Page 12
Mousavi, S.E. and Wong, L.S.
160
Table 7. Results of 1D consolidation tests
Test Specimen Pressure (kPa) Compression Settlement, Sc (mm)
Untreated Soil
0 0
2.5 0.035
5 0.094
10 0.175
20 0.234
40 0.316
80 0.526
40 0.414
20 0.256
10 0.202
5 0.136
2.5 0.068
5 0.112
10 0.188
20 0.254
40 0.342
80 0.526
160 1.136
Stabilized Soil with
18% OPC, 2% PA, 5% SS
0 0
2.5 0.038
5 0.074
10 0.144
20 0.196
40 0.294
80 0.474
40 0.418
20 0.232
10 0.184
5 0.110
2.5 0.054
5 0.088
10 0.172
20 0.226
40 0.324
80 0.508
160 0.857
Page 13
Civil Engineering Infrastructures Journal, 49(1): 149 – 164, June 2016
161
Fig. 7. Permeability-void ratio relationships under 1D consolidation tests
Table 8 offers a brief comparison of the
results from the laboratory falling head and
1D consolidation tests. Based on this table,
in both falling head and 1D consolidation
tests a similar behavior of hydraulic
conductivity could be observed. The
difference between these results is due to
different tests and methods. It is noticeable
that the falling head test was conducted after
24 h of stabilization, while during the 1D
consolidation tests (each vertical load was
held constant for 24 h) more cementation
crystals were formed and the soil matrix
improved further.
Fineness of Materials
The results of fineness test are given in
Table 9, which shows that specific surface of
the peat ash particles is greater than that of
OPC. Based on ASTM C204-11, the
hydration rate depends on the fineness of the
cement particles. High fineness is necessary
to achieve rapid strength development.
Based on Table 9, the fineness of peat ash
particles is higher than OPC; therefore, peat
ash has filled up the pore spaces of the
stabilized soil and due to its filler effect the
matrix of the soil has improved.
Scanning Electron Micrographs (SEM) of
Stabilized Soil
The SEMs of stabilized soil with a binder
composition of 18% OPC, 2% PA, and 5%
SS are shown in Figures 8 and 9. It can be
identified from the micrographs that the pore
spaces of stabilized soil were clogged by
cementation products as a consequence of
adding cement and peat ash. Figure 9 shows
the evidence of a cementation crystal that
functioned by binding the soil particles
together. It is shown in the both figures that
the stabilized soil was characterized by a
well-cemented soil matrix with very small
pore spaces. This is due to the hydration
reaction of cement and fineness of peat ash
in stabilized soil. Similar microscopic photos
on stabilized soil with cementation crystals
can be observed in the study of Horpibulsuk
et al. 2011, which analyzed microstructures
of Bangkok clay, stabilized with cement, fly
ash, and biomass ash, showing that the pores
of the stabilized soil were filled up with
cementation crystals as a result of the
binding mechanism of the materials.
Untreated 18% OPC,
2% PA, 5%SS
0
2
4
6
8
10
12
14
0 0.2 0.4 0.6 0.8 1
k v (
10
-10 m
s-1)
Void ratio, e
13.5% OPC, 1.5% PA, 20% SS
Page 14
Mousavi, S.E. and Wong, L.S.
162
Table 8. Comparison of the coefficient of permeability of the test specimens
Binder Composition Coefficient of permeability (ms
-1)
Falling Head 1D Consolidation
13.5% OPC, 1.5% PA, 20% SS 19.35×10⁻⁸
11.74×10⁻⁹
Untreated Soil 11.44×10⁻⁸
0.84×10⁻¹⁰
18% OPC, 2% PA, 5% SS 5.24×10⁻⁸
0.50×10⁻¹⁰
Fig. 8. SEM micrographs taken from the surface of the stabilized soil specimen with a binder composition of 18%
OPC, 2% PA, and 5% SS (Mousavi and Wong, 2015)
Fig. 9. Cementation crystals of the stabilized soil specimen with 18% OPC, 2% PA, and 5% SS after 24 h
Page 15
Civil Engineering Infrastructures Journal, 49(1): 149 – 164, June 2016
163
Table 9. Results of fineness of particles test
Material Specific Surface of the Particles (cm2/g)
Ordinary Portland Cement 3865
Peat Ash 6392
CONCLUSIONS
Standard Proctor Compaction Test was
applied on untreated and stabilized soil
specimens. The test specimens which had
the highest MDD were chosen to apply
permeability falling head and 1D
consolidation tests. The following
conclusions can be drawn from this research:
i) The stabilized soil specimen with the
binder composition of 13.5% OPC, 1.5%
PA, and 20% SS drastically increased the
coefficient of permeability. However,
after curing, the kv values decreased.
ii) The stabilized soil with partial
replacement of cement with 2% peat ash
decreased the coefficient of permeability
under both falling head and 1D
consolidation tests.
iii) Having compared the moisture contents
of stabilized soil with binder
compositions of 18% OPC, 2% PA, and
5% SS on one hand, and 8% OPC, 2%
PA, and 5% SS on the other, it was
revealed that at lower water contents, the
available free water in the mixtures was
not sufficient to promote hydration
reaction of cement with water.
Furthermore, as the water content
increased up to the optimal level,
compaction coupled with hydration
effect contributed to the hardening of the
improved soil.
iv) Peat ash due to its filler and pozzolanic
effects, as evident in chemical
composition and fineness of peat ash
test, filled the pore spaces, reducing the
porosity and improving the matrix of the
soil.
v) It can be identified from the micrographs
that the pore spaces of stabilized soil
were clogged by cementation products as
a result of cement and peat ash additions.
Also the stabilized soil was characterized
by a well-cemented soil matrix with very
small pore spaces.
vi) Based on the results, soil stabilized with
a binder composition of 18% OPC, 2%
PA, and 5% SS was chosen as the ideal
mix design. The partial replacement of
cement with the 2% peat ash can reduce
the consumption of cement when
stabilizing the soil.
ACKNOWLEDGMENTS
The authors wish to express their sincere
thanks to Universiti Tenaga Nasional
(UNITEN) for providing facilities and
equipment to carry out this research.
REFERENCES
Abdi, M.R. and Parsa Pajouh, A. (2009). "Use of
bentonite and lime for decreasing the permeability
of liner and cover in landfills", Civil Engineering
Infrastructures Journal, 43(1), 61-70.
ASTM D5084-03. (2003), Standard test methods for
measurement of hydraulic conductivity of
saturated porous materials, American Society of
Testing and Materials, Annual Book of ASTM
Standards, ASTM International, West
Conshohocken, PA.
ASTM D2435. (2003), ASTM D2435, Standard test
method for one-dimensional consolidation
properties of soils using incremental loading,
American Society of Testing and Materials,
Annual Book of ASTM Standards, Philadelphia,
04.08, pp. 1-10.
ASTM C204-11. (2014), Standard test methods for
fineness of hydraulic cement by air permeability
apparatus, American Society of Testing and
Materials, Annual Book of ASTM Standards,
ASTM International, West Conshohocken, PA.
Page 16
Mousavi, S.E. and Wong, L.S.
164
ASTM D698. (2012), Standard test methods for
laboratory compaction characteristics of soil
using standard effort, American Society of
Testing and Materials, Annual Book of ASTM
Standards, ASTM International, West
Conshohocken, PA.
ASTM D2974-14. (2014), Standard test methods for
moisture, ash, and organic matter of peat and
other organic soils, American Society of Testing
and Materials, Annual Book of ASTM Standards,
ASTM International, West Conshohocken, PA.
Bujang, B.K.H., Kazemian, S., Prasad, A. and
Barghchi, M. (2011). "State of an art review of
peat: General perspective", International Journal
of the Physical Sciences, 6(8), 1988-1996.
Bazargan, J. and Shoaei, S.M. (2010). "Analysis of
non-darcy flow in rock fill materials using
gradually varied flow method", Civil Engineering
Infrastructures Journal, 44(2), 131-139.
Bahar, R., Benazzoug, M. and Kenai, S. (2004).
"Performance of compacted cement-stabilised
soil", Cement and Concrete Composites, 26(7),
811-820.
Das, B.M. (1989). Soil mechanic laboratory manual,
6th
Edition, Hardcover, Oxford.
Ghasemzadeh, H. and Abounouri, A.A. (2013). "The
effect of dynamic permeability on velocity and
intrinsic attenuation of compressional waves in
sand", Civil Engineering Infrastructures Journal,
46(2), 221-231.
Goodary, R., Lecomte-Nana, G.L., Petit, C. and
Smith., D.S. (2012). "Investigation of the strength
development in cement-stabilised soils of volcanic
origin", Construction and Building Materials,
28(1), 592-598.
Hossain, K.M.A. and Mol, L. (2011). "Some
engineering properties of stabilized clayey soils
incorporating natural pozzolans and industrial
wastes", Construction and Building Materials,
25(8), 3495-3501.
Horpibulusk, S., Rachan, R., Chinkulkijniwat, A.,
Raksachon, Y. and Suddeepong, A. (2010).
"Analysis of strength development in cement-
stabilized silty clay from micro structural
considerations", Construction and Building
Materials, 24(10), 2011-2021.
Horpibulsuk, S., Phojan, W., Suddeepong, A.,
Chinkulkijniwat, A. and Liu Martin, D. (2012).
"Strength development in blended cement
admixed saline clay", Applied Clay Science, 55,
44-52.
Horpibulsuk, S., Rachan, R. and Suddeepong, A.
(2011). "Compressibility and permeability of
Bangkok clay compared with kaolinite and
bentonite", Applied Clay Science, 52(1-2), 150-
159.
Kowalski, T.E., Dale, W. and Starry, Jr. (2007).
"Modern soil stabilization techniques", Annual
Conference of the Transportation Association of
Canada, Saskatoon, Saskatchewan, October, pp.
14-17.
Mahasenan, N., Steve, S., Kenneth, H. and Kaya, Y.
(2003). "The cement industry and global climate
change: Current and potential future cement
industry CO2 emissions", Greenhouse Gas
Control Technologies, 6th
International
Conference, Oxford, Pergamon, pp. 995-1000.
Mousavi, S.E. and Wong, L.S. (2015). "Performance
of compacted and stabilized clay with cement,
peat ash and silica sand", Jordan Journal of Civil
Engineering, 9(1), 20-32.
Wong, L.S., Hashim, R. and Ali, F. (2013).
"Utilization of sodium bentonite to maximize the
filler and pozzolanic effects of stabilized peat",
Engineering Geology, 152(1), 56-66.
Yilmaz, Y. and Ozaydin, V. (2013). "Compaction and
shear strength characteristics of colemanite ore
waste modified active belite cement stabilized
high plasticity soils", Engineering Geology,155,
45-53.


![On yield stress of compacted clays - Springer · 2018-12-12 · ries require high plastic clays to be compacted for the formation of earth fill barri-[4 , 5].According to clay barriers](https://static.documents.pub/doc/80x56/5fa09869c21d5e76532f8c14/on-yield-stress-of-compacted-clays-springer-2018-12-12-ries-require-high-plastic.jpg)


