Page 1
Perro Creek Stormwater Retrofit Assessment
PerroCreekStormwaterRetrofitAnalysis
Prepared by:
Withassistancefrom:
THEMETROCONSERVATIONDISTRICTS
forthe
MIDDLE ST.CROIXWATERSHEDMANAGEMENTORGANIZATION
Page 2
Perro Creek Stormwater Retrofit Assessment
1
Contents
EXECUTIVE SUMMARY ........................................................................................................................ 3
ABOUT THIS DOCUMENT ..................................................................................................................... 6
DOCUMENT OVERVIEW ............................................................................................................................. 6 Methods ................................................................................................................................................. 6 Catchment Profiles ................................................................................................................................ 6 Catchment Ranking ............................................................................................................................... 7 References ............................................................................................................................................. 7 Appendices ............................................................................................................................................ 7
METHODS .................................................................................................................................................. 8
SELECTION OF SUBWATERSHED ................................................................................................................ 8 DESCRIPTION OF PERRO CREEK AND THE CONTRIBUTING SUBWATERSHED ............................................ 8 SUBWATERSHED ANALYSIS METHODS ..................................................................................................... 9
Step 1: Retrofit Scoping ........................................................................................................................ 9 Step 2: Desktop Retrofit Analysis .......................................................................................................... 9 Step 3: Retrofit Reconnaissance Investigation .................................................................................... 10 Step 4: Treatment Analysis/Cost Estimates ........................................................................................ 10 Step 5: Evaluation and Ranking .......................................................................................................... 14
CATCHMENT PROFILES ..................................................................................................................... 14
CATCHMENT PC-4 ................................................................................................................................... 16 CATCHMENT PC-3 ................................................................................................................................... 18 CATCHMENT PC-5 ................................................................................................................................... 20 CATCHMENT PC-7 ................................................................................................................................... 22 CATCHMENT PC-6 ................................................................................................................................... 24
CATCHMENT RANKING ...................................................................................................................... 26
REFERENCES .......................................................................................................................................... 26
APPENDICES ........................................................................................................................................... 28
APPENDIX 1 – CATCHMENTS NOT INCLUDED IN RANKING TABLE ......................................................... 28 APPENDIX 2 – SUMMARY OF PROTOCOL ................................................................................................. 28 APPENDIX 3 – DEFINITIONS ..................................................................................................................... 28 APPENDIX 4 – SUBWATERSHED MAPS .................................................................................................... 30 APPENDIX 5 – CATCHMENT MAPS .......................................................................................................... 33
Page 3
Perro Creek Stormwater Retrofit Assessment
2
This report details a subwatershed stormwater retrofit analysis resulting in
recommended catchments for placement of Best Management Practice (BMP) retrofits
that address the goals of the Local Governing Unit (LGU) and stakeholder partners. This
document should be considered as one part of an overall watershed restoration plan
including educational outreach, stream repair, riparian zone management, discharge
prevention, upland native plant community restoration, and pollutant source control.
The methods and analysis behind this document attempt to provide a sufficient level of
detail to rapidly assess subwatersheds of variable scales and land‐uses to identify
optimal locations for stormwater treatment. The time commitment required for this
methodology is appropriate for initial analysis applications. This report is a vital part of
overall subwatershed restoration and should be considered in light of forecasting
riparian and upland habitat restoration, pollutant hot‐spot treatment, agricultural and
range land management, good housekeeping outreach and education, and others,
within existing or future watershed restoration planning.
The analysis’s background information is discussed followed by a summary of the
analysis’s results; the methods used and catchment profile sheets of selected sites for
retrofit consideration. Lastly, the retrofit ranking criteria and results are discussed and
source references are provided.
Results of this analysis are based on the development of catchment‐specific conceptual
stormwater treatment BMPs that either supplement existing stormwater infrastructure
or provide quality and volume treatment where none currently exists. Relative
comparisons are then made between catchments to determine where best to initialize
final retrofit design efforts and implement BMP projects. Site‐specific design sets (driven
by existing limitations of the landscape and its effect on design element selections) will
need to be developed to determine a more refined estimate of the reported pollutant
removal amounts reported in this report. This typically occurs after committed
partnerships are developed for each specific target property for which BMPs are
planned.
Page 4
Perro Creek Stormwater Retrofit Assessment
3
ExecutiveSummaryThe subwatershed directly discharging to the main channel of Perro Creek, and existing stormwater
management practices, were analyzed for annual pollutant loading. The subwatershed was broken into
eight catchment areas and evaluated for potential pollutant sources from stormwater discharges.
Stormwater practice options were compared for each catchment, depending on specific site constraints
and characteristics. Potential stormwater BMP retrofit locations were selected by weighing pollutant
loading to the location, feasibility of installation and maintenance.
Perro Creek is a 1.8 mile urban stream that flows though Bayport, MN and discharges to the St. Croix
River. Based on creek monitoring data collected upstream of the St. Croix River from 2006‐2012, Perro
Creek exceeds water quality standards for Total Suspended Solids (TSS), E. Coli, lead and copper. The
stream also directly discharges to the St. Croix River and contributes to the Lake St. Croix impairment
and TMDL for total phosphorous (TP). Utilizing bioretention based practices to reduce annual TP
loading to the St. Croix River by 41.3 pounds will also result in reductions of E. Coli, lead, copper and TSS
loads to the St. Croix River.
The following table summarizes the analysis results. Treatment levels (percent removal rates) for retrofit
projects that resulted in a prohibitive BMP size, or number, or were too expensive to justify installation
are not included. Reported treatment levels are dependent upon optimal BMP location within the
catchment and total BMP area. The recommended treatment levels/amounts summarized here are
based on a subjective analysis of potential BMP installations, considering estimated public participation
and site constraints.
Recommended catchment rankings are based on a relative comparison of the cost per pound of
phosphorus reduced over the life of the BMPs. BMP costs are estimated based on the implementation
of a minimum of 1,000 square feet of BMPs initiated and constructed for the sole purpose of water
quality.
A 30% reduction or 41.3 pounds of total phosphorus and a corresponding 30% (+/‐ 5%) reduction
copper and lead could be achieved for a total cost of $511,595. These results assume water quality
projects are designed and installed independent of any other infrastructure improvements. The costs of
these practices are substantially lower when designed and installed as part of a larger infrastructure
improvement project such as street reconstruction or commercial or institutional building
redevelopment.
The process of channelization (practices to straightening and shortening the stream channel) of Perro
Creek has been occurring since the establishment of the Bayport area in 1856. Channelization and
removal of bank‐side vegetative buffers destabilize streams and result in increased discharges of
sediment and phosphorous. As part of this analysis, a rapid field analysis was conducted to identify
opportunities for stream channel restoration practices to stabilize sloughing banks and restore the
creeks sinuosity and native vegetated buffers. The scope of this report does not identify costs and
pollutant load analysis for creek restoration projects, but potential practices are included in the
catchment summary graphics.
Page 5
Perro Creek Stormwater Retrofit Assessment
4
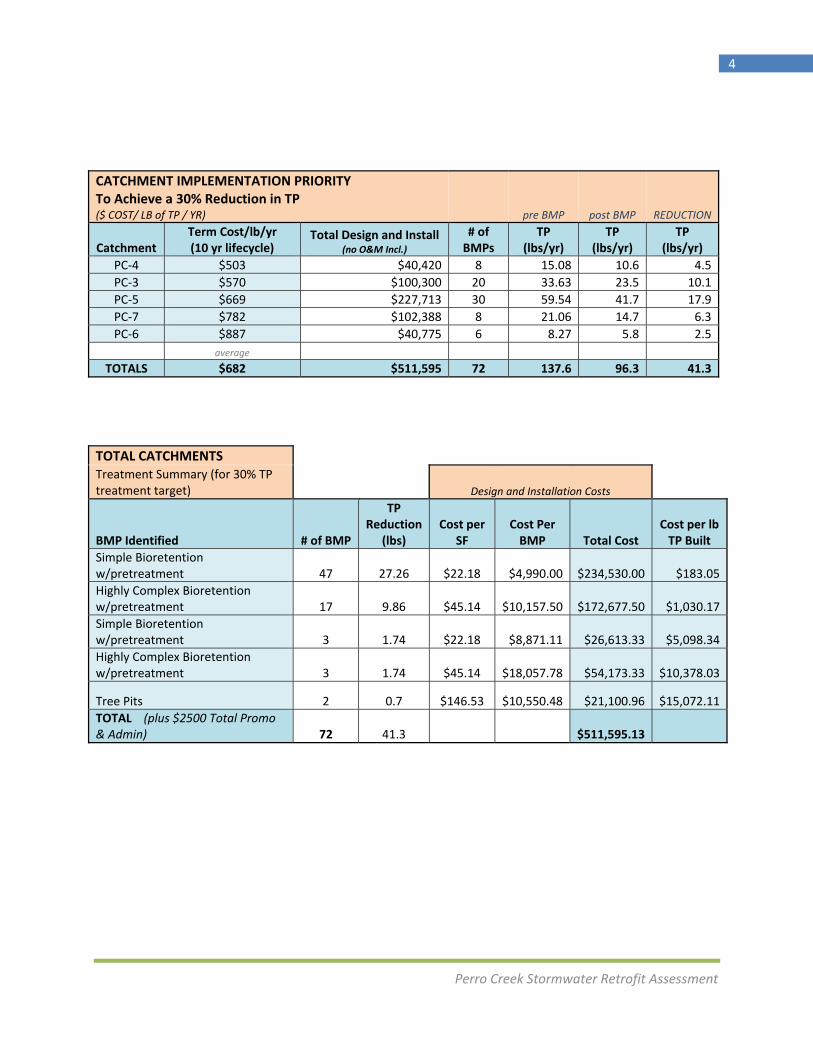
TOTAL CATCHMENTS Treatment Summary (for 30% TP treatment target) Design and Installation Costs
BMP Identified # of BMP
TP Reduction
(lbs) Cost per
SF Cost Per BMP Total Cost
Cost per lb TP Built
Simple Bioretention w/pretreatment 47 27.26 $22.18 $4,990.00 $234,530.00 $183.05
Highly Complex Bioretention w/pretreatment 17 9.86 $45.14 $10,157.50 $172,677.50 $1,030.17
Simple Bioretention w/pretreatment 3 1.74 $22.18 $8,871.11 $26,613.33 $5,098.34
Highly Complex Bioretention w/pretreatment 3 1.74 $45.14 $18,057.78 $54,173.33 $10,378.03
Tree Pits 2 0.7 $146.53 $10,550.48 $21,100.96 $15,072.11
TOTAL (plus $2500 Total Promo & Admin) 72 41.3 $511,595.13
CATCHMENT IMPLEMENTATION PRIORITY To Achieve a 30% Reduction in TP ($ COST/ LB of TP / YR) pre BMP post BMP REDUCTION
Catchment Term Cost/lb/yr (10 yr lifecycle)
Total Design and Install (no O&M Incl.)
# of BMPs
TP (lbs/yr)
TP (lbs/yr)
TP (lbs/yr)
PC‐4 $503 $40,420 8 15.08 10.6 4.5
PC‐3 $570 $100,300 20 33.63 23.5 10.1
PC‐5 $669 $227,713 30 59.54 41.7 17.9
PC‐7 $782 $102,388 8 21.06 14.7 6.3
PC‐6 $887 $40,775 6 8.27 5.8 2.5
average
TOTALS $682 $511,595 72 137.6 96.3 41.3
Page 6
Perro Creek Stormwater Retrofit Assessment
5
Top‐Ranked Perro Creek Catchments and TP Removal Potential
Page 7
Perro Creek Stormwater Retrofit Assessment
6
AboutthisDocument
DocumentOverviewThe Stormwater Retrofit Analysis is a subwatershed management tool used to prioritize stormwater
BMP retrofit projects based on BMP performance and cost effectiveness. This process helps maximize
the value of each dollar spent.
This document is organized into four main sections that describe the general methods used, individual
catchment profiles, a retrofit ranking for the subwatershed, and references used in the analysis
protocol. The Appendices section provides additional information relevant to the analysis.
Under each section and subsection, project‐specific information relevant to that portion of the analysis
is provided with an ItalicizedHeading.
MethodsThe Methods section outlines the general procedures used when assessing the subwatershed. It details
the processes of retrofit scoping, desktop analysis, retrofit field reconnaissance investigation,
cost/treatment analysis, and catchment ranking. The project‐specific details of each procedure are
defined if different from the general standard procedures.
NOTE: the financial, technical, current landscape/stormwater system, and timeframe limits and needs are highly variable from
subwatershed to subwatershed. This analysis uses some, or all, of the methods described herein.
CatchmentProfilesEach catchment profile is labeled with a numerical ID for identification purposes (e.g., Catchment PC‐5,
Catchment PC‐7). This numerical ID is referenced when comparing results across the subwatershed.
Information found in each catchment profile is described below.
CatchmentSummary/DescriptionWithin each Catchment Summary/Description section is a table that summarizes basic information
including catchment size, current land cover, and estimated annual pollutant load (target pollutant(s)
are specified by the LGU). A table of the principal WinSLAMM Standard Land Use model inputs and their
corresponding acreage values are also reported. A brief description of the land cover, stormwater
infrastructure and any other important general information is described.
RetrofitRecommendationThe Retrofit Recommendation section describes the conceptual BMP retrofit(s) selected for the
catchment area and provides a description of why each specific retrofit option was chosen.
Cost/TreatmentAnalysisA summary table provides for the direct comparison of the expected amount of treatment, within a
catchment, that can be expected per invested dollar. In addition, the results of each catchment can be
cross‐referenced to optimize available capital budgets vs. load reduction goals.
Page 8
Perro Creek Stormwater Retrofit Assessment
7
SiteSelectionA rendered aerial photograph highlights properties/areas suitable for BMP retrofit projects. Additional
field inspections will be required to verify project feasibility, but the most ideal locations for BMP project
installations are identified here.
CatchmentRankingCatchment ranking takes into account all of the information gathered during the analysis process to
create a prioritized catchment list. The list is sorted by the cost per pound of phosphorus treated within
each catchment for the duration of the maintenance term (conservative estimate of BMP effective life).
The final cost per pound treatment value includes installation and maintenance costs. There are many
possible ways to prioritize projects within catchments, and the list provided is merely a starting point.
Final catchment ranking for installation may include:
Total amount of pollutant removal
Non‐target pollutant reductions
BMP project visibility
Availability of funding
Total project costs
Educational value
ReferencesThe References section identifies various sources of information synthesized to produce the analysis
protocol utilized in this analysis.
AppendicesThe Appendices section provides supplemental information and/or data used during the analysis
protocol.
Page 9
Perro Creek Stormwater Retrofit Assessment
8
Methods
SelectionofSubwatershedBefore the subwatershed stormwater analysis begins, a process of identifying a high priority water body
as a target takes place. Many factors are considered when choosing which subwatershed to assess for
stormwater retrofits. Water quality monitoring data, non‐degradation report modeling, and TMDL
studies are just a few of the resources available to help determine which water bodies are a priority.
Analyses supported by a Local Government Unit with sufficient capacity (staff, funding, available GIS
data, etc.) to greater facilitate the analysis also rank highly.
In areas without clearly defined studies, such as TMDL or officially listed water bodies of concern, or
where little or no monitoring data exist, metrics are used to score subwatersheds against each other. In
large subwatersheds (e.g., greater than 2500 acres), a similar metric scoring is used to identify areas of
concern, or focus areas, for a more detailed analysis. This methodology was slightly modified from
Manual 2 of the Urban Stormwater Retrofit Practices series.
DescriptionofPerroCreekandtheContributingSubwatershedPerro Creek is a 1.8 mile long urban stream that discharges to the St. Croix River. The creek is located
within the city of Bayport in the northeastern suburban of the Twin Cities metropolitan area. Perro
Creek conveys water from two subwatersheds that encompass a total of 660 acres of urban land use in
the cities of Oak Park Heights, Stillwater and Bayport. Stormwater in the Perro Pond subwatershed is
conveyed through a network of storm sewers, channels, and ponds. Perro Pond is a 53 acre DNR
shallow lake that receives drainage from 340 acres of mixed urban land use primarily from the City of
Oak Park Height and a small portion of Stillwater. The outlet of Perro Pond to Perro Creek is an
adjustable control structure located on the southern point of Perro Pond. To alleviate flooding in
Bayport, the structure is manually closed during the winter by the City of Bayport public works staff.
When the southern control structure is closed, Perro Pond discharges directly to the St. Croix River
through a series of storm sewers located on the north side of the pond. Stormwater in the Perro Creek
direct subwatershed is conveyed to the creek through pipes and channels. The direct discharge
subwatershed encompasses 323.7 acres of mixed urban land use from the City of Bayport.
Since 2006, the Washington Conservation District has collected base flow grab samples, automated
flow‐weighted storm composite samples and duplicate samples according to WCD Standard Operating
Procedures (SOP). An automated sampler located about 1 mile upstream of the St. Croix River,
continuously monitored stream flow discharge and collects event flow composite samples in the spring
and summer. Data collected at this site by the WCD included total discharge, precipitation, and water
quality analysis. All stream flow and chemistry data are published in the water quality monitoring
reports available on the Middle St. Croix WMO website www.mscwmo.org.
Page 10
Perro Creek Stormwater Retrofit Assessment
9
Based on creek monitoring data collected upstream of the St. Croix River from 2006‐2012, Perro Creek
periodically exceeds water quality standards for Total Suspended Solids (TSS), E. Coli, lead, copper, and
zinc. The stream also directly discharges to the St. Croix River and contributes to the Lake St. Croix
impairment and TMDL for total phosphorous (TP).
SubwatershedAnalysisMethodsThe process used for this analysis is outlined below and was modified from the Center for Watershed
Protection’s Urban Stormwater Retrofit Practices, Manuals 2 and 3 (Schueler, 2005, 2007). Locally
relevant design considerations were also included into the process (Minnesota Stormwater Manual).
Step1:RetrofitScopingRetrofit scoping includes determining the objectives of the retrofits (volume reduction, target pollutant
etc) and the level of treatment desired. It involves meeting with local stormwater managers, city staff,
and watershed staff to determine the issues in the subwatershed. This step also helps to define
preferred retrofit treatment options and retrofit performance criteria. In order to create a manageable
area to assess in large subwatersheds, a smaller focus area may be determined.
PerroCreekSubwatershedScopingPollutants of concern for this subwatershed were identified as TP, TSS, and volume. Goals of the
MSCWMO, WCD, and City of Bayport were considered.
Step2:DesktopRetrofitAnalysisDesktop retrofit analysis involves computer‐based scanning of the subwatershed for potential BMP
retrofit catchments and/or specific sites. This step also identifies areas that don’t need to be assessed
because of existing stormwater infrastructure. Accurate and current GIS data is extremely valuable in
conducting the desktop retrofit analysis. Some of the most important GIS layers include: 2‐foot or finer
topography, hydrology, soils, watershed/subwatershed boundaries, parcel boundaries, high‐resolution
aerial photography, and storm drainage infrastructure (with invert elevations and flow direction). The
following table highlights some important features to look for and the associated potential retrofit
project.
Subwatershed Metrics and Potential Retrofit Project Site/Catchment Screening Metric Potential Retrofit Project
Open Space New regional treatment (pond, infiltration basin). Roadway Culverts Add wetland or extended detention water quality
treatment upstream. Outfalls Split flows or add storage below outfalls if open space is
available. Conveyance system Add or improve performance of existing swales, ditches
and non‐perennial streams. Large Impervious Areas (campuses, commercial, parking)
Stormwater treatment on‐site or in nearby open spaces.
Neighborhoods Utilize right of way, roadside ditches or curb‐cut raingardens or filtering systems to treat stormwater before it enters storm drain network.
Page 11
Perro Creek Stormwater Retrofit Assessment
10
Step3:RetrofitReconnaissanceInvestigationAfter identifying potential retrofit sites through this desktop search, a field investigation was conducted
to evaluate each site. During the investigation, the drainage area and stormwater infrastructure
mapping data were verified. Site constraints were assessed to determine the most feasible retrofit
options as well as to eliminate sites from consideration. The field investigation revealed additional
retrofit opportunities that would have gone unnoticed during the desktop search. An in creek analysis
of Perro Creek was also conducted as part of this analysis.
The following stormwater BMPs were considered for each catchment/site:
Stormwater Treated Options for Retrofitting Area
Treated Best Management
Practice Potential Retrofit Project
5.1‐10.0
acres
Infiltration Basin Large and shallow impoundment areas designed to retain and infiltrate stormwater runoff.
0.1‐5.0
acres
Bioinfiltration Use of native soil, soil microbe, and plant processes to treat, evapotranspirate, and/or infiltrate stormwater runoff. Facilities can either be fully infiltrating, fully filtering or a combination thereof.
Biofiltration Filters runoff through engineered biologically active media and passes it through an under‐drain. May consist of a combination of sand, soil, compost, peat, compost, or iron.
Tree Boxes A trench or sump that receives runoff. Stormwater is passed through a conveyance and pretreatment system before entering the infiltration area.
Stream Bank Restoration and Stabilization
These bioengineered practices are designed to reduce in stream bank erosion and filter and/or infiltrate runoff.
Other On‐site, source‐disconnect practices such as rain‐leader raingardens, rainleader disconnect, stormwater planters, dry wells and permeable pavements.
Step4:TreatmentAnalysis/CostEstimates
TreatmentanalysisSites most likely address pollutant reduction goals and those that may have simple
design/install/maintenance considerations are chosen for a cost/benefit analysis that relatively
compares catchments/sites. Treatment concepts are developed taking into account site constraints and
the subwatershed treatment objectives. Projects involving complex stormwater treatment interactions
and those that may pose a risk for upstream flooding require the assistance of a professional engineer.
Conceptual designs at this phase of the design process include cost and pollution reduction estimates.
Reported treatment levels are dependent upon optimal site selection and sizing.
Modeling of the site is done by WinSLAMM. WinSLAMM uses event mean concentrations based on land
use for each catchment/site to estimate relative pollution loading of the existing conditions. The site’s
Page 12
Perro Creek Stormwater Retrofit Assessment
11
conceptual BMP design is modeled to then estimate varying levels of treatment by sizing and design
element. This treatment model can also be used to properly size BMPs to meet restoration objectives.
General WinSLAMM Model Inputs
Parameters Method for Determining Value
Area
Natural Resource Conservation Service Custom watershed delineation tools from ESRI were used to identify catchments in ArcMap 10.1. Software generated catchment boundaries were field verified and modified when necessary.
Land Use
Using GIS, land areas discharging to Perro Creek were evaluated and assigned Standard Land Uses (SLU) in WinSLAMM 10.1. These SLUs describe the average characteristics of impervious and pervious surfaces in each catchment.
Precipitation/Temperature Data
Rainfall and temperature recordings from Minneapolis 1959 were used as a representation of an average year. Winter season was marked as November 15 to March 18.
Pollutant Probability Distribution
WinSLAMM uses a pollutant value file to determine the pollutant loading from a source area. The default value WI_GEO02 computed from USGS was used for this analysis.
Runoff Coefficient The default runoff coefficient WI_SL06 was used.
Particulate Solids Concentration
The default WI_GEO01.ppd particle file developed by USGS was used.
Street Delivery Parameter File
The default street dirt delivery files were used to retain total particles that do not reach the outfall based on rain depths and street textures.
Particle Size Distribution Average of the available outfall particle size distribution data from the National Urban Runoff Program studies.
PerroCreekTreatmentAnalysisFor the Perro Creek Treatment analysis, each catchment (and each relevant parcel within them) was first
assessed for BMP applicability given specific site constraints and soil types. Pedestrian and car traffic
flow, parking needs, snow storage areas, obvious utility locations, existing landscaping, surface water
runoff flow, project visibility, existing landscape maintenance, available space, and other site‐specific
factors dictated the selection of one or more potential BMPs for each site.
WinSLAMM was used to model catchments and a hypothetical BMP located at its outfall. The BMP was
sized from the 10‐30% treatment size and results were tabulated in the Catchment Profile section of this
document.
Page 13
Perro Creek Stormwater Retrofit Assessment
12
CostEstimatesEach resulting BMP (by percent TP‐removal dictated sizing) was then assigned estimated design,
installation and first‐year establishment‐related maintenance costs given its total cubic feet of
treatment. In cases where live storage was 1 foot deep, this number roughly related to square feet of
BMP coverage. An annual cost/TP‐removed for each treatment level was then calculated for the life of
each BMP that includes promotional, administrative and life cycle operations, and maintenance costs.
The following table provides the BMP cost estimates used to assist in cost analysis:
Average BMP Cost Estimates
BMP Description Installation Materials &
Labor
Annual Mainten‐ance
Design Cost ($70/hr)
Installation Oversight Cost
($70/hr)
O & M
Term
Rain Leader Disconnect Rain Garden
Simple residential raingarden
$7.56 $0.25/ft2 $280/100 ft2 $210 10
Infiltration Basin (Turf)
Amended soils with under‐drains
$15.10 $2000/acre $1120/acre $210 10
Simple Bioinfiltration
No engineered soils or under‐drains, but w/curb cuts.
$14.00 $0.75/ft2 $1200/1000 ft2 $210 10
Simple Bioinfiltration w/Structural Pretreatment
No engineered soils or under‐drains, but w/curb cuts and structural pretreatment
$20.00 $0.75/ft2 $1200/1000 ft2 $210 10
Moderately Complex Biofiltration
With engineered soils, under‐drains, curb cuts, no structural pretreatment but no retaining walls
$17.00 $1.50/ft2 $2000/1000 ft2 $290 10
Moderately Complex Biofiltration w/Structural Pretreatment
Incl. engineered soils, under‐drains, curb cuts, structural pretreatment but no retaining walls
$23.00 $0.75/ft2 $2000/1000 ft2 $350 10
Complex Biofiltration w/Structural Pretreatment
As MCBwSP but with 1.5‐2.5 ft partial perimeter walls
$27.50 $0.75/ft2 $3750/1000ft2 $410 10
Page 14
Perro Creek Stormwater Retrofit Assessment
13
Highly Complex Biofiltration w/Structural Pretreatment
As CBwSP but with utility or grey infrastructure modifications
$37.50 $0.75/ft2 $7500/1000ft2 $470 10
Curb‐Cut Cut with apron $80.00
Impervious Cover Conversion
$21.71 $500/acre $1120/acre $210 10
Stormwater Tree Pits2
6' x 12 ' pit with concrete vault
$140.00 $0.75/ft2 140% above construction
$210 10
Grass/Gravel Permeable Pavement
Sand base $18.95 $0.75/ft2 140% above construction
$210 10
Permeable Asphalt
Granite base $10.80 $0.75/ft2 140% above construction
$210 10
Permeable Concrete
Granite base $15.00 $0.75/ft2 140% above construction
$210 10
Permeable Pavers Granite base $35.75 $0.75/ft2 140% above construction
$210 10
Extended Detention
(12.98)*(CU‐FT^0.75)
$1000/acre 3$2800/acre $210 10
Wet Pond (277.89)*(CU‐FT^0.553)
$1000/acre 3$2800/acre $210 10
Perimeter Sand Filter
$259.20 10
Structural Sand Filter
(including peat, compost or iron amendment))
$22.04 $250/25ft $300/25ft $210 10
Underground Sand Filter
$99.08 $0.75/ft2 140% above construction
$210 10
Rain Barrels Does not include pump or distribution
$25.00 $25 NA $210 10
Cisterns Does not include pump or distribution
$16.00 $100 NA $210 10
Dry Swale1 With soil amendments
$7.13 $0.75/ft2 $280/100 ft2 $210 10
Water Quality Swale1
With soil replacement and check dams
$15.01 $0.75/ft2 $1120/1000 ft2 $420 10
French Drain/Dry Well
$15.00 $100 20% above construction
$210 10
Stormwater Planter (ultra urban)
Usually a stormwater disconnect BMP
$35.86 $0.75/ft2 20% above construction
$210 10
1Assumed to be 15 feet in width.
2 Assumed ultra‐urban linear application.
Page 15
Perro Creek Stormwater Retrofit Assessment
14
PerroCreekCostAnalysisFor the Perro Creek cost analysis, promotion, installation and administration for each practice was
estimated based on the actual costs of similar water quality retrofit projects in Washington and Dakota
County from 2010‐2013. Project costs assume the implementation of an average of five practices or
1000 cubic feet of treatment per project area. Cost savings occur when water quality practices are
designed and installed in conjunction with larger capital improvement projects such as reconstruction or
redevelopment. Annual Operation & Maintenance referred to the ft2 estimates provided in the
preceding table.
Step5:EvaluationandRankingThe results of each site were analyzed for cost/treatment to prescribe the most cost‐efficient level of
treatment.
PerroCreekEvaluationandRankingIn the Perro Creek evaluation and ranking, the recommended level of treatment for each catchment, as
reported in the Executive Summary table, was chosen by selecting the expected level of treatment
considering public buy‐in and above a minimal amount needed to justify crew mobilization and outreach
efforts to the area. Should the cumulative expected load reduction of the recommended catchment
treatment levels not meet LGU goals, a higher level of treatment (as described in the Catchment Profile
tables) should be selected. The maps associated with each catchment show potential BMP locations as
determined by field review. To meet treatment level goals for a catchment, a minimum percentage of
potential BMPs (equaling or exceeding the “BMP Surface Area”) must be installed within that
catchment.
CatchmentProfilesThe following pages provide catchment‐specific information that was analyzed for stormwater BMP
retrofit treatment at various levels. Utilizing GIS each catchment is divided into several different land
uses based on WinSLAMM Standard Land Use parameters.
The recommended level of treatment reported in the Ranking Table is determined by weighing the cost‐
efficiency vs. site specific limitations about what is truly practical in terms of likelihood of being granted
access to optimal BMP site locations, expected public buy‐in (partnership), and crew mobilization in
relation to BMP spatial grouping.
For development of the Perro Creek catchment profile section, 5 out of 9 catchments were selected as
the first‐tier areas for stormwater retrofit efforts. Those catchments that are land locked or have
minimal impervious surface area contributing to Perro Creek were not modeled or further analyzed in
this analysis (omitted from the analysis were catchments PC‐1, PC‐2, PC‐8, and PC‐9).
Page 16
Perro Creek Stormwater Retrofit Assessment
15
WinSLAMM Standard Land Use Codes
Land Uses
Codes Definition
Residential
HDRNA High Density Residential without Alleys
HDRWA High Density Residential with Alleys
MDRNA Medium Density Residential without Alleys
MDRWA Medium Density Residential with Alleys
LDR Low Density Residential
MFR Multiple Family Residential
Commercial
STRIPCOM Strip Commercial
DOWNTOWN Commercial Downtown
Industrial
MI Medium Industrial
LI Non‐Manufacturing
Institutional
SCH Education Facilities
INST Miscellaneous Institutional
Other PARK Parks
OPEN Undeveloped
CEM Cemetery
Freeway
FREE Freeways
Page 17
Perro Creek Stormwater Retrofit Assessment
16
CatchmentPC‐4Term Cost Rank = #1
Base Load Summary Catchment PC‐4
Acres 19.4
Volume (acre‐feet/yr) 9.0
TP (lb/yr) 15.1
TSS (lb/yr) 3983
WinSLAMM Input Summary
Catchment PC‐4
Standard Land Use Code Acres Standard Land Use Code Acres
CEM 0.98 MDRWA 11.55
FREE 0.41 MFR 0.31
LDR 0.14 OPEN 1.47
MDRNA 4.58
TOTAL 19.44
DESCRIPTION
This catchment is comprised primarily of medium‐density residential properties with gravel alleys.
Stormwater runoff discharges into the creek though a deteriorated storm sewer system or through a
combination of asphalt‐lined or grass‐lined ditch system that eventually converges with the storm sewer
system.
RETROFIT RECOMMENDATION
A combination of bioinfiltraiton and biofiltration with coarse sediment pretreatment devices and a
water quality swale are recommended for this catchment. In certain locations, elevations may require
small retaining walls to achieve level depressional areas required to infiltrate or filtrate stormwater.
Modeling indicates eight BMPs will achieve a 30% Total Phosphorous reduction in Catchment PC‐4 of 4.5
pounds.
Modeling does not account for increased loading from gravel alleys. It is evident that gravel alleys
contribute larger than modeled results for total phosphorous (TP) and total suspended solids (TSS)
loading. Therefore, targeted outreach and assistance are prioritized to disconnect contributing
impervious areas such as garages and rear lot parking pads from the gravel alleys.
BMP Treatment Summary
(for 30% TP treatment target of Catchment PC‐4) INSTALLED/DESIGNED
BMP Identified # of BMP
SF per BMP Cost per SF
Cost Per BMP Total Cost
Simple Bioretention w/pretreatment 8 225 $22.18 $4,990.00 $39,920.00
TOTAL (plus $500 Promo & Admin) 8 $40,420.00
Page 18
Perro Creek Stormwater Retrofit Assessment
17
CatchmentPC‐4Term Cost Rank = #1
Cost/Benefit Analysis Catchment PC‐4 Reductions
Unit Baseline 10% 20% 30%
TR
EA
TM
EN
T # BMP Projects Needed ‐ 2 5 8
Live Storage Volume (cubic feet) ‐ 420 839 1,272
TP (lb/yr) 15.08 13.6 12.1 10.6
TSS (lb/yr) 3983.0 3,513 3,043 2,573
TSS (% reduced) ‐ 11.8% 23.6% 35.4%
Volume (acre‐feet/yr) 9.0 8.1 7.3 6.4
Volume (% reduced) ‐ 9.8% 19.5% 29.3%
CO
ST
Design and Installation ‐ $9,980 $24,950 $39,920
Promotion & Admin Costs ‐ $500 $500 $500
Total Project Cost ‐ $10,480 $25,450 $40,420
Annual O&M ‐ $420 $839 $1,272
Term Cost/lb/yr (30 yr) ‐ $108 $281 $503
Page 19
Perro Creek Stormwater Retrofit Assessment
18
CatchmentPC‐3Term Cost Rank = #2
Base Load Summary Catchment PC‐3
Acres 65.4
Volume (acre‐feet/yr) 21.0
TP (lb/yr) 47.0
TSS (lb/yr) 13822
WinSLAMM Input Summary Catchment PC‐3
Standard Land Use Code Acres CEM 4.81
FREE 1.16
INST 0.00
LDR 0.48
MDRNA 25.45
OPEN 26.90
PARK 6.57
TOTAL 65.37
DESCRIPTION
This catchment is comprised primarily of medium‐density residential properties without alleys.
Stormwater runoff discharges into the creek though a deteriorated storm sewer system, through a
combination of asphalt lined and grass‐lined ditch system, and at the intersection of Perro Creek and 9th
street stormwater discharges directly into the creek.
RETROFIT RECOMMENDATION
A combination of bioinfiltraiton and biofiltration with coarse sediment pretreatment devices and a
water quality swale are recommended for this catchment. In certain locations, elevations may require
small retaining walls to achieve level depressional areas required to infiltrate or filtrate stormwater.
Modeling indicates eight BMPs will achieve a 30% Total Phosphorous reduction in Catchment PC‐3 of
10.1 pounds.
BMP Treatment Summary (for 30% TP treatment target of Catchment PC‐3) INSTALLED/DESIGNED
BMP Identified # of BMP
SF per BMP Cost per SF
Cost Per BMP Total Cost
Simple Bioretention w/pretreatment 20 225 $22.18 $4,990.00 $99,800.00
TOTAL (plus $500 Promo & Admin) 20 $100,300.00
Page 20
Perro Creek Stormwater Retrofit Assessment
19
CatchmentPC‐3Term Cost Rank = #2
Cost/Benefit Analysis Catchment PC‐3 Reductions
Unit Baseline 10% 20% 30%
TREA
TMEN
T
# BMP Projects Needed ‐ 7 13 20
Live Storage Volume (cubic feet) ‐ 1,117 2,233 3,384
TP (lb/yr) 33.63 30.3 26.9 23.5
TSS (lb/yr) 8983.0 7,950 6,917 5,884
TSS (% reduced) ‐ 11.5% 23.0% 34.5%
Volume (acre‐feet/yr) 21.0 18.8 16.5 14.3
Volume (% reduced) ‐ 10.7% 21.3% 32.0%
COST
Design and Installation ‐ $34,930 $64,870 $99,800
Promotion & Admin Costs ‐ $500 $500 $500
Total Project Cost ‐ $35,430 $65,370 $100,300
Annual O&M ‐ $1,117 $2,234 $3,385
Term Cost/lb/yr (30 yr) ‐ $154 $326 $570
Page 21
Perro Creek Stormwater Retrofit Assessment
20
CatchmentPC‐5Term Cost Rank = #3
Base Load Summary Catchment PC‐5
Acres 71.4
Volume (acre‐feet/yr) 41.8
TP (lb/yr) 59.5
TSS (lb/yr) 17129
WinSLAMM Input Summary
Catchment PC‐5
Standard Land Use Code Acres
Standard Land Use Code Acres
DOWNTOWN 1.30 OPEN 3.68
FREE 2.78 PARK 3.67
INST 4.56 SCH 2.34
MDRNA 19.46 STRIPCOM 2.24
MDRWA 31.40
TOTAL 71.43
DESCRIPTION
This catchment contributes the largest pollutant loads to Perro Creek. It is comprised of primarily
medium‐density residential properties with gravel alleys. Runoff is collected and conveyed to the creek
in one of three ways: though a deteriorated storm sewer system; through a combination of asphalt lined
and grass‐lined ditch system, and from the streets directly into the creek.
RETROFIT RECOMMENDATION
A combination of bioinfiltraiton and biofiltration with coarse sediment pretreatment devices and a
water quality swale are recommended for this catchment. A 10% reduction of TP could be achieved
through the use of moderate cost BMPs. Slopes, density of impervious surface and stormwater rates
pose challenges for retrofitting stormwater practices to achieve 20 and 30% reductions in this
catchment. High cost BMP locations require alteration of street widths and additional stormwater
infrastructure. If coordinated with a larger street or stormwater infrastructure project, design and
installation costs will be much lower. Through the combination of BMPs identified modeling indicates a
30% TP reduction or 17.9 pounds can be achieved in catchment PC‐5.
Modeling does not account for increased loading from gravel alleys. It is evident that gravel alleys
contribute larger than modeled results for total phosphorous (TP) and total suspended solids (TSS)
loading. Therefore, targeted outreach and assistance are prioritized to disconnect contributing
impervious areas such as garages and rear lot parking pads from the gravel alleys.
BMP Treatment Summary
(for 30% TP treatment target of Catchment PC‐5) INSTALLED/DESIGNED
BMP Identified # of BMP
SF per BMP Cost per SF
Cost Per BMP Total Cost
Simple Bioretention w/pretreatment 15 225 $22.18 $4,990.50 $74,857.50
Highly Complex Bioretention w/pretreatment 15 225 $45.14 $10,156.50 $152,347.50
TOTAL (plus $500 Promo & Admin) 30 $227,705.00
Page 22
Perro Creek Stormwater Retrofit Assessment
21
CatchmentPC‐5Term Cost Rank #3
Cost/Benefit Analysis
Catchment PC‐5 Reductions
Unit Baseline 10% 20% 30%
TREA
TMEN
T
# BMP Projects Needed ‐ 10 20 30
Live Storage Volume (cubic feet) ‐ 1,682 3,363 5,095
TP (lb/yr) 59.54 53.6 47.6 41.7
TSS (lb/yr) 17129.0 15,334 13,539 11,744
TSS (% reduced) ‐ 10.5% 21.0% 31.4%
Volume (acre‐feet/yr) 41.8 37.5 33.3 29.0
Volume (% reduced) ‐ 10.2% 20.4% 30.5%
COST
Design and Installation ‐ $49,900 $125,638 $227,213
Promotion & Admin Costs ‐ $500 $500 $500
Total Project Cost ‐ $50,400 $126,138 $227,713
Annual O&M ‐ $1,682 $3,363 $5,095
Term Cost/lb/yr (10 yr) ‐ $125 $335 $669
Page 23
Perro Creek Stormwater Retrofit Assessment
22
CatchmentPC‐7Term Cost Rank = #4
Base Load Summary Catchment PC‐7
Acres 30.7
Volume (acre‐feet/yr) 16.5
TP (lb/yr) 22.7
TSS (lb/yr) 7793
WinSLAMM Input Summary
Catchment PC‐7
Standard Land Use Code Acres Standard Land Use Code Acres
FREE 1.29 MI 1.70
LI 4.08 OPEN 4.72
MDRNA 11.41 STRIPCOM 1.02
MDRWA 6.47
TOTAL 30.69
DESCRIPTION
This catchment is comprised of primarily medium‐density residential properties without alleys. It also
includes stormwater runoff from Hwy 95 and highly impervious light Industrial land uses. Runoff is
conveyed to the creek though a deteriorated storm sewer system and at many locations directly
discharged from the streets into the creek.
RETROFIT RECOMMENDATION
A combination of infiltration basins, bioinfiltraiton, biofiltration and tree pits with coarse sediment
pretreatment devices are recommended for this catchment. A potential for a large infiltration basin
designed to treat multiple acres of stormwater runoff was identified at the intersection of Minnesota St
and 1st Ave S. Modeling indicates 8 BMPs will achieve the 30% TP reduction or 6.3 lbs. in catchment PC‐
7.
Modeling does not account for increased loading from gravel alleys. It is evident that gravel alleys
contribute larger than modeled results for total phosphorous (TP) and total suspended solids (TSS)
loading. Therefore, targeted outreach and assistance are prioritized to disconnect contributing
impervious areas such as garages and rear lot parking pads from the gravel alleys.
BMP Treatment Summary
(for 30% TP treatment target of Catchment PC‐7) INSTALLED/DESIGNED
BMP Identified # of BMP sf per BMP Cost per SF
Cost Per BMP Total Cost
Simple Bioretention w/pretreatment 3 400 $22.18 $8,871.11 $26,613.33
Highly Complex Bioretention w/pretreatment 3 400 $45.14 $18,057.78 $54,173.33
Tree Pits (6’x12’ surface area, 4’ deep cell) 2 72 $146.53 $10,550.48 $21,100.96
TOTAL (plus $500 Promo & Admin) 8 $102,387.63
Page 24
Perro Creek Stormwater Retrofit Assessment
23
CatchmentPC‐7Term Cost Rank #4
Cost/Benefit Analysis Catchment PC‐7 Reductions
Unit Baseline 10% 20% 30%
TREATMENT
#BMPProjectsNeeded ‐ 3 5 8Live Storage Volume (cubic feet) ‐ 408 815 1,236
TP (lb/yr) 21.06 19.0 16.8 14.7
TSS (lb/yr) 6555.0 5,742 4,929 4,117
TSS (% reduced) ‐ 12.4% 24.8% 37.2%
Volume (acre‐feet/yr) 16.5 14.7 12.9 11.2
Volume (% reduced) ‐ 10.2% 20.4% 30.6%
COST
Design and Installation ‐ $26,613 $62,729 $101,888
Promotion & Admin Costs ‐ $500 $500 $500
Total Project Cost ‐ $27,113 $63,229 $102,388
Annual O&M ‐ $426 $851 $1,290
Term Cost/lb/yr (30 yr) ‐ $166 $426 $782
Page 25
Perro Creek Stormwater Retrofit Assessment
24
Catchment#PC‐6Term Cost Rank = #5
Base Load Summary Catchment PC‐6
Acres 9.4
Volume (acre‐feet/yr) 6.6
TP (lb/yr) 8.3
TSS (lb/yr) 2416
WinSLAMM Input Summary
Catchment PC‐6
Standard Land Use Code Acres DOWNTOWN 1.01
FREE 0.72
LI 0.00
MDRNA 1.03
MDRWA 5.97
OPEN 0.23
STRIPCOM 0.44
TOTAL 9.40
DESCRIPTION
This catchment is comprised of primarily medium‐density residential properties with gravel alleys and
highly impervious land uses. Runoff is conveyed to the creek though a storm sewer system and is
directly discharged from the streets into the creek at Central Avenue. The western portion of this small
catchment is steeply sloped.
RETROFIT RECOMMENDATION
A combination of bioinfiltration and biofiltration with coarse sediment pretreatment devices are
recommended for this catchment. A 20% reduction or 1.65 lbs. of TP can be achieved through the use
of moderate cost BMPs. Slopes and density of impervious surface pose challenges for retrofitting
stormwater practices to achieve 20% and 30% reductions in this catchment. High cost BMP locations
require alteration of street widths and additional stormwater infrastructure. If coordinated with a larger
street or stormwater infrastructure, practice design and installation costs will be lower. Modeling
indicates 6 BMPs will achieve the 30% TP reduction or 2.47 lbs. in catchment PC‐6.
Modeling does not account for increased loading from gravel alleys. It is evident that gravel alleys
contribute larger than modeled results for total phosphorous (TP) and total suspended solids (TSS)
loading. Therefore, targeted outreach and assistance are prioritized to disconnect contributing
impervious areas such as garages and rear lot parking pads from the gravel alleys.
BMP Treatment Summary (for 30% TP treatment target of Catchment PC‐6) INSTALLED/DESIGNED
BMP Identified # of BMP
SF per BMP Cost per SF
Cost Per BMP Total Cost
Simple Bioretention w/pretreatment 4 225 $22.18 $4,990.00 $19,960.00
Highly Complex Bioretention w/pretreatment 2 225 $45.14 $10,157.50 $20,315.00
TOTAL (plus $500 Promo & Admin) 6 $40,775.00
Page 26
Perro Creek Stormwater Retrofit Assessment
25
Catchment#PC‐6Term Cost Rank = #5
Cost/Benefit Analysis
Catchment PC‐6 Reductions
Unit Baseline 10% 20% 30%
TREA
TMEN
T
# BMP Projects Needed ‐ 2 4 6
Live Storage Volume (cubic feet) ‐ 349 698 1,058
TP (lb/yr) 8.27 7.4 6.6 5.8
TSS (lb/yr) 2416.0 2,155 1,894 1,633
TSS (% reduced) ‐ 10.8% 21.6% 32.4%
Volume (acre‐feet/yr) 6.6 5.9 5.2 5.0
Volume (% reduced) ‐ 8.1% 16.2% 24.3%
COST
Design and Installation ‐ $9,980 $19,960 $40,275
Promotion & Admin Costs ‐ $500 $500 $500
Total Project Cost ‐ $10,480 $20,460 $40,775
Annual O&M ‐ $349 $698 $1,058
Term Cost/lb/yr (10 yr) ‐ $188 $415 $887
Page 27
Perro Creek Stormwater Retrofit Assessment
26
CatchmentRanking
TOTAL CATCHMENTS Treatment Summary (for 30% TP treatment target) Design and Installation Costs
BMP Identified # of BMP
TP Reduction
(lbs) Cost per
SF Cost Per BMP Total Cost
Cost per lb TP Built
Simple Bioretention w/pretreatment 47 27.26 $22.18 $4,990.00 $234,530.00 $183.05
Highly Complex Bioretention w/pretreatment 17 9.86 $45.14 $10,157.50 $172,677.50 $1,030.17
Simple Bioretention w/pretreatment 3 1.74 $22.18 $8,871.11 $26,613.33 $5,098.34
Highly Complex Bioretention w/pretreatment 3 1.74 $45.14 $18,057.78 $54,173.33 $10,378.03
Tree Pits 2 0.7 $146.53 $10,550.48 $21,100.96 $15,072.11
TOTAL (plus $2500 Total Promo & Admin) 72 41.3 $511,595.13
CATCHMENT IMPLEMENTATION PRIORITY To Achieve a 30% Reduction in TP ($ COST/ LB of TP / YR) pre BMP post BMP REDUCTION
Catchment Term Cost/lb/yr (10 yr lifecycle)
Total Design and Install (no O&M Incl.)
# of BMPs
TP (lbs/yr)
TP (lbs/yr)
TP (lbs/yr)
PC‐4 $503 $40,420 8 15.08 10.6 4.5
PC‐3 $570 $100,300 20 33.63 23.5 10.1
PC‐5 $669 $227,713 30 59.54 41.7 17.9
PC‐7 $782 $102,388 8 21.06 14.7 6.3
PC‐6 $887 $40,775 6 8.27 5.8 2.5
average
TOTALS $682 $511,595 72 137.6 96.3 41.3
Page 28
Perro Creek Stormwater Retrofit Assessment
27
References
Minnesota Stormwater Steering Committee. 2005. Minnesota Stormwater Manual. Minnesota Pollution
Control Agency. St. Paul, MN.
Panuska, J. 1998. Drainage System Connectedness for Urban Areas. Memo. Wisconsin Dept of Natural
Resources. Madison, WI.
Rawls et. al. 1998. Use of Soil Texture, Bulk Density, and Slope of the Water Retention Curve to Predict
Saturated Hydraulic Conductivity. Transactions of the ASAE. Vol 41(4): 983‐988. St. Joseph, MI.
Schueler et. al. 2005. Methods to Develop Restoration Plans for Small Urban Watersheds. Manual 2,
Urban Subwatershed Restoration Manual Series. Center for Watershed Protection. Ellicott City,
MD.
Schueler et. al. 2007. Urban Stormwater Retrofit Practices. Manual 3, Urban Subwatershed Restoration
Manual Series. Center for Watershed Protection. Ellicott City, MD.
USDA. 1986. Urban Hydrology for Small Watersheds TR‐55. Second Edition. Washington, DC.
USGS. 2013. SLAMM Source Loading Model Parameter and Standard Land Use Files for Wisconsin,
http://wi.water.usgs.gov/slamm/ accessed Dec 29, 2013.
Walker, W.W. 2007. P8: Urban Catchment Model, V 3.4. Developed for the USEPA, Minnesota PCA and
the Wisconsin DNR.
Page 29
Perro Creek Stormwater Retrofit Assessment
28
Appendices
Appendix1–CatchmentsnotincludedinRankingTableCatchments not included in ranking table were excluded for a number of reasons, mainly involving
density of impervious surface and opportunities for BMP retrofits. After BMPs are installed within the
priority catchments, it is recommended that the watershed revisit the entire subwatershed to
determine other catchments that, while they may be conducive to retrofitting, were not considered a
high priority for this report.
Appendix2–SummaryofProtocolThis protocol attempts to provide a sufficient level of detail to rapidly assess subwatersheds or
catchments of variable scales and land uses. It provides the assessor defined project goals that aid in
quickly narrowing down multiple potential sites to a point where the assessor can look critically at site‐
specific driven design options that affect, sometimes dramatically, BMP selection. We feel that the time
commitment required for this methodology is appropriate for most initial analysis applications and has
worked well thus far for the Perro Creek Analysis.
Appendix3–DefinitionsThe following terms are used throughout this document and define the basic terminology used to talk
about watersheds and restoration. Many of the terms can have different meanings in different contexts,
so it is imperative to define their use within this document.
Best Management Practice (BMP) – One of many different structural or non‐structural methods used to
treat runoff, including such diverse measures as ponding, street sweeping, bioretention, and infiltration.
Biofiltration Basin‐ A soil and plant based stormwater management practice that infiltrates a portion of
stormwater captured, but conveys excess filtered water through an underdrain.
Bioinfiltration Basin – A soil and plant‐based stormwater management practice that infiltrates all runoff
captured in the basin.
Catchment – Land area within a subwatershed generally having a drainage area of 1 – 100 acres for
urban areas, where all water drains to a particular point. Several catchments make up a subwatershed.
The existing stormwater infrastructure helps to define a catchment; therefore it is critical to obtain
accurate stormwater infrastructure mapping information (including, at a minimum, the location of inlets
and pipes, flow direction, and outfall locations) before undertaking a stormwater analysis process.
Raingarden – A landscaping feature that is planted with native perennial plants and is used to manage
stormwater runoff from impervious surfaces such as roofs, sidewalks, roads, and parking lots.
Page 30
Perro Creek Stormwater Retrofit Assessment
29
Retrofit – The introduction of a new or improved stormwater management element where it either
never existed or did not operate effectively.
Stormwater – Water that is generated by rainfall or snowmelt that causes runoff and is often routed
into drain systems for treatment or conveyance.
Subwatershed – Land area within a watershed generally having a drainage area of more than 500 acres,
where all water drains to a particular point. Several subwatersheds make up a watershed. An example
would be the Perro Creek subwatershed, which is within the boundaries of the Middle St. Croix Water
Management Organization (the watershed). Subwatersheds are entirely based on hydrologic conditions,
not political boundaries.
Urban – Any watershed or subwatershed with more than 10% total impervious cover.
Watershed – Land area defined by topography, where all water drains to a particular point. Watershed
drainage areas are large, ranging from 20 to 100 square miles or more, and are made up of several
subwatersheds. There are currently 8 watersheds located either wholly or partially within Washington
County, each defined along political boundaries that attempt to mimic hydrologic boundaries.
Page 31
Perro Creek Stormwater Retrofit Assessment
30
Appendix4–SubwatershedMaps
Perro Creek Subwatershed – Aerial Photo (2013)
Priority Catchments are Shaded
Page 32
Perro Creek Stormwater Retrofit Assessment
31
Location of the Perro Creek Subwatershed in Bayport, MN
Page 33
Perro Creek Stormwater Retrofit Assessment
32
Location of the Perro Creek Subwatershed within Washington County
Page 34
Perro Creek Stormwater Retrofit Assessment
33
Appendix5–CatchmentMaps