Page 1
227
10 Investment Policy Statement Benchmark Construction for Hospital Endowment Fund Management
Perry D’Alessio and David Edward Marcinko
CONTENTS
Asset Allocation ............................................................................................................................. 229
Develop a Proper Perspective .................................................................................................... 229
Asset Class Considerations .......................................................................................................230
Domestic Equity ...................................................................................................................230
Fixed Income ........................................................................................................................ 231
Foreign Equity ...................................................................................................................... 231
Absolute Return .................................................................................................................... 231
Private Equity ....................................................................................................................... 231
Real Assets ........................................................................................................................... 232
Combining the Asset Classes .................................................................................................... 232
Mean Variance Optimization ............................................................................................... 232
Monte Carlo Simulation ...................................................................................................... 233
The Role of Judgment .......................................................................................................... 235
Other Asset Class Considerations ............................................................................................. 236
Liquidity ............................................................................................................................... 236
Other Asset Classes .............................................................................................................. 236
Organizational Expertise ......................................................................................................236
Groupthink ........................................................................................................................... 236
Amount of Support Endowment Needs to Provide .............................................................. 237
Tactics for Implementing the Allocation Policy ........................................................................ 237
The Effi cient Market Hypothesis ......................................................................................... 237
Managing for Alpha.............................................................................................................. 238
The Tactical Approach .......................................................................................................... 238
Payout Policy ................................................................................................................................. 239
Sustainable Withdrawals ........................................................................................................... 239
Common Payout Methods ......................................................................................................... 239
Stress Testing............................................................................................................................. 241
Avoiding Mistakes ..................................................................................................................... 241
Rethinking the Management of Foundation Endowments: The Commonwealth
Fund 2009 Annual Report ......................................................................................................... 243
Other Considerations .................................................................................................................244
Management Models ............................................................................................................244
Controlling Risks ..................................................................................................................246
TAF-K15524-13-0301-C010.indd 227TAF-K15524-13-0301-C010.indd 227 08/05/13 7:52 PM08/05/13 7:52 PM
Page 2
228 Financial Management Strategies for Hospitals and Healthcare Organizations
Write It Down............................................................................................................................248
Committees and Staff ................................................................................................................249
Self-Assessment ........................................................................................................................249
Other Resources ........................................................................................................................250
Conclusion .....................................................................................................................................250
Acknowledgement .........................................................................................................................250
Suggested Readings ......................................................................................................................250
References ...................................................................................................................................... 259
INTRODUCTION
Dr. Malcolm T. MacEachern, Director of Hospital Activities for the American College of
Surgeons, presciently observed that:
our hospitals are now involved in the worst fi nancial crisis they have ever experienced. It is
absolutely necessary to all of us to put our heads together and try to fi nd some solution. If we
are to have effective results we must have concerted and coordinated immediate action. . . .
Repeated adjustments of expenses to income have been made. Never before has there been
such a careful analysis of hospital accounting and study of fi nancial policies. It is entirely
possible for us to inaugurate improvements in business methods which will lead to greater
ways and means of fi nancing hospitals in the future. . . . It is true that all hospitals have
already trimmed their sales to better meet the fi nancial conditions of their respective com-
munities. This has been chiefl y through economies of administration. There has been more
or less universal reduction in personnel and salaries; many economies have been affected.
Everything possible has been done to reduce expenditures but this has not been suffi cient
to bring about immediate relief in the majority of instances. The continuance of the pres-
ent economic conditions will force hospitals generally to further action. The time has come
when this problem must be given even greater thought, both from its community and from
its national aspect.1
Many health administration and endowment managers would agree that Dr. MacEachern
accurately describes today’s healthcare funding environment. Although they might be startled
to learn that Dr. MacEachern made these observations in 1932, there is the old truism that
there is nothing new under the sun.
Healthcare statistics after the 2012 presidential election and Patient Protection-Affordable
Care Act confi rmation suggest that the fi nancial crises are much the same for today’s hospitals
as they were for hospitals during the Great Depression. The American Hospital Association
recently reported a number of gloomy statistics for hospitals: 2
• Hospitals provided $39 billion in uncompensated care to patients in 2010 represent-
ing 5.8 percent of their expenses.
• Technology costs are soaring as traditional technologies such as X-ray machines
(available for $175,000) are being replaced by contemporary technologies such as
computed tomography (CT) scanners (available for $1 million), which are in turn
being replaced by CT functional imaging with positron emission tomography scans
(available for $2.3 million). Even a "simple" instrument like as a scalpel that costs
$20 is being replaced by equipment for electrocautery, which costs $12,000, and that
is then being replaced by harmonic scalpels that cost $30,000.
A further review added more daunting numbers:3
AQ1
TAF-K15524-13-0301-C010.indd 228TAF-K15524-13-0301-C010.indd 228 08/05/13 7:52 PM08/05/13 7:52 PM
Page 3
229Investment Policy Statement Benchmark Construction
ASSET ALLOCATION
Since a 1986 study of large pension funds suggested that investment policy, rather than market
timing or security selection, was the primary determinant of portfolio performance,5 investors
have seized upon asset allocation as the Holy Grail of investing. Although there has been ongo-
ing debate regarding the original study’s methodology and conclusions, David Swensen, the Chief
Investment Offi cer of Yale University, made the following observation with respect to asset alloca-
tion: “Investors often treat asset allocation’s central role in determining portfolio returns as a truism.
It is not. The Brinson, Singer, and Beebower study describes investor behavior, not fi nance theory.”6
It is its ability to control investor behavior that makes asset allocation so valuable. But what is
asset allocation? In simple terms, asset allocation is the process of combining or blending invest-
ment asset classes in an attempt to obtain the highest possible return at the lowest possible risk.
Because this is a laudable pursuit, an endowment should have a process to guide its behavior in
establishing investment allocation.
DEVELOP A PROPER PERSPECTIVE
It has been said that the most diffi cult single feat in professional sports is hitting the major league
pitch that can arrive at the plate in as few as 0.4 seconds after being thrown. Perhaps the most dif-
fi cult feat in investing is setting an asset allocation. For the endowment manager (and most other
investors), maintaining proper perspective of risk and return is likely the most diffi cult aspect of
setting investment policy. Although investing carries many risks, William Spitz, CFA (Charterd
AQ3
• In 2010, 22.4 percent of hospitals reported a negative total margin.
• From 1997 through 2009, hospitals saw a small net surplus from government
payments from sources such as Medicare and Medicaid deteriorate into a defi cit
approaching $35 billion.
• Emergency departments in 47 percent of all hospitals report operating at or over
capacity, partially refl ecting an approximately 10 percent decline in the number of
emergency departments since 1991.
• The average age of hospital plants has increased 22.5 percent from 8.0 years to 9.8
years in just 15 years.
• From 2003 through September 2007, hospital bond downgrades have outpaced hos-
pital bond upgrades by 19 percent.
In a time when so much seems different yet so much seems the same, hospitals are
increasingly viewing their endowments as a source of help. But what is an endowment? The
same Latin words that give rise to the word dowry also give rise to the word endowment.4 Interestingly, the concepts of a dowry and an endowment are similar in many ways. Both are
typically viewed as gifts for continuing support or maintenance. With respect to the health-
care entity, an endowment is generally used to smooth variations in operating results and to
fund extra programs or plant purchases. Any entity that enjoys the support of an endowment
also encounters the confl icting objectives between current income and future growth.
Dean William Inge, a nineteenth century cleric and author, aptly noted, “Worry is interest
paid on trouble before it is due.” When managing an endowment, it is important that the insti-
tution focus its attention on those items that it can control rather than worrying about those
it cannot control. Successful endowment managers seem to agree that there are at least two
major areas subject to the endowment’s control: asset allocation (also known as investment
policy) and payout policy.
AQ2
TAF-K15524-13-0301-C010.indd 229TAF-K15524-13-0301-C010.indd 229 08/05/13 7:52 PM08/05/13 7:52 PM
Page 4
230 Financial Management Strategies for Hospitals and Healthcare Organizations
Financial Analyst), the treasurer of Vanderbilt University School of Medicine and manager of the
team that provides day-to-day management of Vanderbilt’s $2.25 billion endowment, succinctly
summarized the risks that should represent the primary areas of concern:
1. the endowment could suffer an unacceptable market loss
2. there could be a decrease in the amount of support the endowment could provide to the
sponsoring institution
3. the endowment could fail to preserve its real purchasing power7
When balancing these divergent risks, the endowment manager must remember that an endow-
ment is a matter of “inter-generational equity,” meaning that the future generation cannot and must
not be harmed by actions taken on behalf of the current generation. When establishing the alloca-
tion for an endowment, the concept of inter-generational equity means that the manager must take a
long-term perspective. Such a strict long-term perspective would likely require an almost complete
equity allocation. However, because most healthcare institutions have immediate needs, an endow-
ment manager’s investment allocation must also remain sensitive to the needs for current period
funding.
To put endowment management into a more personal perspective, liken it to investing an indi-
vidual retirement account (IRA) for a 65-year-old Mr. Methuselah who is preparing for 904 golden
years of retirement bliss. His dilemma involves satisfying a need for current income while ensuring
that he preserves the purchasing power of his portfolio.
ASSET CLASS CONSIDERATIONS
The 2006 Commonfund Benchmarks Healthcare Study surveyed 202 public and private healthcare
institutions with total investment assets of $105.8 billion. The average asset allocation reported
by those institutions is shown in Table 10.1.8 Note that this study included pension, operating, and
insurance reserve assets. Because most institutions invest their insurance reserves more conserva-
tively than their pension or operating (endowment) assets, the data will likely appear to be some-
what more conservative than is actually the case for endowment assets. However, even allowing for
this enhanced conservatism, the average annual returns of 6.3 percent for the year ended June 30,
2006, does not seem particularly healthy.
Domestic EquityHistorically, domestic equities have represented a signifi cant portion of a typical endowment’s assets
because they have generated favorable long-term returns relative to cash and bonds. Of course, this
greater return has also entailed greater risk as compared to those same lower return investments.
As shown in the Commonfund survey, the average healthcare entity continues to place heavy reli-
ance on domestic equities. However, survey participants have reduced their allocations to domestic
equities by 7 percent in just two years in favor of international equities and alternative investments.
TABLE 10.1Average Asset AllocationsTotal domestic equities 30%
Fixed income 34%
International equities 12%
Alternative investments 15%
Cash/short-term securities 9%
Total 100%
TAF-K15524-13-0301-C010.indd 230TAF-K15524-13-0301-C010.indd 230 08/05/13 7:52 PM08/05/13 7:52 PM
Page 5
231Investment Policy Statement Benchmark Construction
Fixed IncomeMost endowments will use fi xed income or bond positions to provide more stable sources of income,
greater portfolio diversifi cation, and a hedge against unanticipated spending needs. Although many
fi xed income investments have historically exhibited less volatility or risk than other investment
alternatives, they have also generally tended to have lower long-term returns. When determining
the size of the endowment’s fi xed income position, the manager will want to remember that the
inter-generational nature of endowments is such that long-term returns remain important. In addi-
tion, a substantial body of research suggests that the risk of higher-returning investments such as
stocks diminishes substantially over longer holding periods. Endowments may desire to hedge their
long-term liabilities with long-term bonds. However, they should consider research compiled by
Dimensional Fund Advisors showing that longer-term bonds may not provide signifi cantly higher
return relative to their risk. As shown in the following chart, the average annual return of twenty-
year bonds is virtually identical to that of fi ve-year bonds, but the risk (as measured by standard
deviation) is 75 percent higher.9
U.S. Treasury Obligations 1964–2012
One-Year U.S. Treasury Bills
Five-Year U.S. Treasury Notes
Twenty-Year U.S. Government Bonds
Annualized compound return (%) 0.73 5.17 5.46
Annualized standard deviation (%) 2.24 3.13 3.96
Foreign EquityExposure to foreign equity can enhance the overall diversifi cation of the endowment portfolio.
Perhaps more importantly, some foreign equity markets are substantially less effi cient than the
domestic equity market, which affords the portfolio manager the opportunity to earn above market
returns. Within the foreign equity class, emerging markets are often viewed to be especially attrac-
tive because their rapidly growing and changing economies provide the skillful manager with an
opportunity to add value.
Absolute ReturnThis class of investment seeks to exploit market ineffi ciencies and generate positive returns regard-
less of broader market performance. Investments in this class often are made through the use of
hedge funds. Hedge funds will often employ leverage, short-selling, and arbitrage to take advantage
of pricing distortions in their targeted strategy area.
When investing an endowment’s assets in this category, the manager should be aware of fee
structures that commonly include performance-related incentive fees, hurdle rates, and clawback
clauses. The endowment manager should also remember that these types of investments generally
have much less transparency than other asset classes with which they may be more familiar. Finally,
because many of these investments are offered only to accredited investors, the investment manager
is often free to pursue much more aggressive strategies than would otherwise be pursued for retail
customers.
Private EquityAs with absolute return investments, private equity is generally available only to accredited inves-
tors. The relative lack of effi ciency in this market allows the endowment to seek superior risk-
adjusted returns by participating in such investments as venture capital and leveraged buy-out
funds. When investing in this asset class, the endowment manager would be well served to partner
with managers who “emphasize a value-added approach to investing. Such fi rms work closely with
the portfolio companies to create entities that are fundamentally more valuable, relying only sec-
ondarily on fi nancial engineering to generate returns.”10 Although this class of investments has AQ4
TAF-K15524-13-0301-C010.indd 231TAF-K15524-13-0301-C010.indd 231 08/05/13 7:52 PM08/05/13 7:52 PM
Page 6
232 Financial Management Strategies for Hospitals and Healthcare Organizations
handsomely rewarded many large endowments, the manager must also remember that the very
nature of this class is such that liquidity may be very limited.
Real AssetsAlso known as “hard assets,” this class includes such investments as real estate, gas and oil, and tim-
ber. Many successful endowments have found this to be an attractive class of investments because
they provide strong returns and can serve as an infl ationary hedge. The Yale Endowment’s alloca-
tion to real assets is almost six times the average for other similar institutions, and since 1978 this
allocation has returned an average 15 percent per year.11 As further illustration, since 1987 timber
has provided average annual returns of approximately 15.6 percent12 as compared to 13.1 percent
for domestic equities (as measured by the Wilshire 5000 Index). During this time period, timber
had only three negative return quarters13 and signifi cantly lower volatility than domestic equities.
However, investing in assets such as timber requires that an endowment accept the approximate
fi fteen-year timeframe and the limited liquidity it represents (Spitz, 2004, pers. comm.).
COMBINING THE ASSET CLASSES
Combining the disparate information into a workable asset allocation is as much art as it is sci-
ence, perhaps more so. Most endowments will use a combination of quantitative and qualitative
analyses to develop their allocations. The quantitative portion of the analyses generally uses a
variety of statistical techniques to develop a top-down approach to the general allocation. After
developing a general sense of their desired range of returns, many endowments will use one of
several “optimizer” techniques to assist in constructing an allocation. Commonly used optimiza-
tion techniques include mean variance optimization (MVO) and Monte Carlo simulation (MCS).
Mean Variance Optimization MVO has at its core modern portfolio theory (MPT), which seeks to fi nd the “effi cient frontier”
that defi nes the minimum risk for any given level of return. To fi nd this frontier, MVO will consider
the expected returns, standard deviations (i.e., volatility), and correlation coeffi cients of individual
asset classes. All things being equal, the endowment manager would generally choose the invest-
ments with the highest expected long-term return. However, the current funding needs placed upon
endowments require that they be sensitive to the volatility of asset classes.
Expected volatility is often defi ned as “risk” and is measured by the standard deviation of invest-
ment returns around an expected average return for that same investment. In other words, an asset
class with an expected return of 10 percent and standard deviation of 5 percent would have its
returns range from 5 percent to 15 percent approximately two-thirds of the time. This assumes that
returns are normally distributed around a mean although a fair amount of evidence suggests that
they are not. Table 10.2 summarizes periodic returns and standard deviations for selected classes
of assets.
Cross-asset correlation is measured by the correlation coeffi cients between two categories of
investments. Correlation coeffi cients range from −1.0 to +1.0. A correlation coeffi cient of −1.0
means two investment classes move exactly inversely to one another. On the other hand, a +1.0 cor-
relation coeffi cient means that two asset classes have totally positive correlation. A 0.0 correlation
coeffi cient means that movement in one asset class cannot be used to predict the level of return in
another asset class. By holding asset classes with imperfect correlation, volatility in the portfolio
can be reduced as classes with higher returns balance those with low or negative returns. Table 10.3
summarizes correlation coeffi cients for the same asset classes described in Table 10.2.
The MVO optimizer will then mathematically plot a series of portfolio options that represent the
maximum level of return for a given level of risk. By defi nition, there can be only one such effi cient
frontier of portfolios. Also explicit in MPT is the idea that a portfolio below the effi cient frontier is
ineffi cient, whereas a portfolio above the effi cient frontier is impossible to sustain on a long-term
TAF-K15524-13-0301-C010.indd 232TAF-K15524-13-0301-C010.indd 232 08/05/13 7:52 PM08/05/13 7:52 PM
Page 7
233Investment Policy Statement Benchmark Construction
basis. Figure 10.1 provides a graphic representation of the effi cient frontier and portfolios that would
be considered either ineffi cient or impossible to attain.
Monte Carlo Simulation Named after Monte Carlo, Monaco, which is famous for its games of chance, MCS is a technique
that randomly changes a variable over numerous iterations to simulate an outcome and develop a
probability forecast of successfully achieving an outcome. In endowment management, MCS is
used to demonstrate the probability of “success” as defi ned by achieving the endowment’s asset
growth and payout goals. In other words, MCS can provide the endowment manager with a comfort
level that a given payout policy and asset allocation success will not deplete the real value of the
endowment.
The problem with many quantitative tools is the divorce of judgment from their use. Although
useful, both MVO and MCS have limitations such that they should not supplant the endowment
manager’s experience. As noted, MVO generates an effi cient frontier by relying upon several inputs:
expected return, expected volatility, and correlation coeffi cients. These variables are commonly
input using historical measures as proxies for estimated future performance. This poses a variety
of problems. First, the MVO will generally assume that returns are normally distributed and that
this distribution is stationary. As such, asset classes with high historical returns are assumed to
have high future returns. Second, an MVO optimizer is not generally time sensitive. In other words,
the optimizer may ignore current environmental conditions that would cause a secular shift in the
returns of a given asset class. Finally, an MVO optimizer may be subject to selection bias for certain
asset classes. For example, private equity fi rms that fail will no longer report results and will be
eliminated from the index used to provide the optimizer’s historical data.14
TABLE 10.2Average Annual Returns and Standard Deviations for Selected Asset Class Returns, 2006–2011
Benchmark/Asset Class Return Standard Deviation
Wilshire 5000 1.15% 19.24%
MSCI EAFE −5.37% 22.69%
MSCI EAFE Emerging Markets −1.7% 29.01%
Hedge Fund 2.95% 9.20%
Timber 6.39% 25.67%
Real Estate 6.77% 6.41%
Long-term U.S. Government 11.21% 1.01%
Intermediate U.S. Government 6.34% 1.40%
Short-term U.S. Government 2.69% 1.50%
Medical Infl ation 4.20% 1.14%
Sources: Index data for the Wilshire 5000 data were obtained from Wilshire Associates. Index data
for the MSCI EAFE and MSCI EAFE Emerging Markets were obtained from Morgan
Stanley Capital International, Inc. Index data for the HFRI Fund Weighted Composite Index
was obtained from Hedge Fund Research, Inc. Index and return amounts for timber and real
estate were obtained from the National Council of Real Estate Investment Fiduciaries.
Returns and standard deviations for the Long-term U.S. Government, Intermediate U.S.
Government, and Short-term U.S. Government asset classes were calculated by the author
using thirty-year Treasury Bond, fi ve-year Treasury Note, and thirteen-week Treasury Bill
average annual yields. Medical Infl ation was obtained from the Bureau of Labor Statistics
and represents the rate of infl ation for medical care of all urban consumers. All annual
returns and standard deviations were calculated by the principal author.
TAF-K15524-13-0301-C010.indd 233TAF-K15524-13-0301-C010.indd 233 08/05/13 7:52 PM08/05/13 7:52 PM
Page 8
234 Financial Management Strategies for Hospitals and Healthcare Organizations
TAB
LE 1
0.3
Sele
cted
Ass
et C
lass
Cor
rela
tion
s A
nnua
l Ret
urns
Wils
hire
50
00M
SCI
EAFE
MSC
I EA
FE
Emer
ging
M
arke
tsH
edge
Fu
ndTi
mbe
rR
eal
Esta
teLo
ng-t
erm
U.S
. G
over
nmen
tIn
ter
U.S
. G
over
nmen
tSh
ort-
term
U.S
. G
over
nmen
tM
edic
al
Infl
atio
n
Wil
shir
e 5000
1.0
0
MS
CI
EA
FE
0.7
11.0
0
MS
CI
EA
FE
Em
ergin
g
Mar
ket
s
0.4
10.6
71.0
0
Hed
ge
Fund
0.7
00.6
00.8
21.0
0
Tim
ber
0.3
80.1
80.3
20.5
81.0
0
Rea
l E
stat
e0.0
70.1
6−
0.4
2−
0.3
8−
0.5
91.0
0
Long-t
erm
U.S
.
Gover
nm
ent
0.0
8−
0.2
60.0
10.2
50.6
3−
0.6
51.0
0
Inte
rmed
iate
U.S
.
Gover
nm
ent
0.0
7−
0.3
2−
0.2
00.1
30.4
2−
0.3
40.9
11.0
0
Short
-ter
m U
.S.
Gover
nm
ent
0.1
0−
0.3
0−
0.3
60.0
10.0
90.0
40.6
40.8
91.0
0
Med
ical
Infl
atio
n−
0.3
0−
0.4
00.1
20.0
20.3
0−
0.8
00.7
30.5
50.3
01.0
0
Not
e:
His
tori
cal
dat
a pre
sente
d f
or
illu
stra
tive
purp
ose
s only
.
Sour
ces:
Index
dat
a fo
r th
e W
ilsh
ire
5000 d
ata
wer
e obta
ined
fro
m W
ilsh
ire
Ass
oci
ates
. In
dex
dat
a fo
r th
e M
SC
I E
AF
E a
nd M
SC
I E
AF
E E
mer
gin
g M
arket
s w
ere
obta
ined
fro
m
Morg
an S
tanle
y C
apit
al I
nte
rnat
ional
, In
c. I
ndex
dat
a fo
r th
e H
FR
I F
und W
eighte
d C
om
posi
te I
ndex
wer
e obta
ined
fro
m H
edge
Fund R
esea
rch, In
c. I
ndex
and r
eturn
amounts
for
tim
ber
and r
eal
esta
te w
ere
obta
ined
fro
m t
he
Nat
ional
Counci
l of
Rea
l E
stat
e In
ves
tmen
t F
iduci
arie
s. R
eturn
s fo
r th
e L
ong-t
erm
U.S
. G
over
nm
ent,
Inte
rmed
iate
U.S
. G
over
nm
ent,
and S
hort
-ter
m U
.S. G
over
nm
ent as
set cl
asse
s w
ere
calc
ula
ted b
y the
auth
or
usi
ng thir
ty-y
ear
Tre
asury
Bond, fi
ve-
yea
r T
reas
ury
Note
,
and thir
teen
-wee
k T
reas
ury
Bil
l av
erag
e an
nual
yie
lds.
Med
ical
Infl
atio
n w
as o
bta
ined
fro
m the
Bure
au o
f L
abor
Sta
tist
ics
and r
epre
sents
the
rate
of
infl
atio
n f
or
med
i-
cal
care
of
all
urb
an c
onsu
mer
s. A
ll a
nnual
ret
urn
s an
d c
orr
elat
ions
wer
e ca
lcula
ted b
y t
he
pri
nci
pal
auth
or.
TAF-K15524-13-0301-C010.indd 234TAF-K15524-13-0301-C010.indd 234 08/05/13 7:52 PM08/05/13 7:52 PM
Page 9
235Investment Policy Statement Benchmark Construction
Table 10.4 compares the returns and standard deviations for large- and small-cap stocks for the
twenty-year periods ended in 1979 and 2010.
David Nawrocki identifi ed a number of problems with typical MCS models as being that
most optimizers assume “normal distributions and correlation coeffi cients of zero, neither of
which are typical in the world of fi nancial markets.” Dr. Nawrocki subsequently described a
number of other issues with MCS, including nonstationary distributions and nonlinear correla-
tions. Finally, Dr. Nawrocki quotes Harold Evensky eloquently noted that “[t]he problem is the
confusion of risk with uncertainty. Risk assumes knowledge of the distribution of future out-
comes (i.e., the input to the Monte Carlo simulation). Uncertainty or ambiguity describes a world
(our world) in which the shape and location of the distribution is open to question. Contrary to
academic orthodoxy, the distribution of U.S. stock market returns is far from normal.”15 Other
critics have noted that many MCS simulators do not run enough iterations to provide a meaning-
ful probability analysis.
Some of these criticisms have been addressed by using MCS simulators with more robust cor-
relation assumptions and with a greater number of iterative trials. In addition, some simulators now
combine MVO and MCS to determine probabilities along the effi cient frontier.
The Role of JudgmentDespite their limitations, optimizers are useful tools for developing asset allocations for endow-
ments. They represent another tool in ensuring rational and consistent investor behavior. Most
endowments will also use bottom-up analysis to examine the opportunities within a given asset
class and to make adjustments to the allocations across asset classes.
AQ5
Risk
Return The efficient frontier
Inefficientportfolios
Unattainable portfolios
FIGURE 10.1 The effi cient frontier.
TABLE 10.4Twenty-Year Risk and Return Small-Cap versus Large-Cap (Ibbotson Data)
1979 2010
Risk Return Correlation Risk Return Correlation
Small-Cap Stocks 30.8% 17.4% 78.0% 18.1% 26.85% 59.0%
Large-Cap Stocks 16.5% 8.1% 13.1% 15.06%
Note: IA Micro-Cap Value 14.66 17.44 24.69 0.44
Source: Reproduced from Loeper, D. 2001. Asset Allocation Math, Methods and Mistakes. Wealthcare Capital Management White Paper. CIMA, CIMC
AQ6
TAF-K15524-13-0301-C010.indd 235TAF-K15524-13-0301-C010.indd 235 08/05/13 7:52 PM08/05/13 7:52 PM
Page 10
236 Financial Management Strategies for Hospitals and Healthcare Organizations
OTHER ASSET CLASS CONSIDERATIONS
LiquidityMany investors seek signifi cant liquidity in their investments, and many professionally managed
investments make arrangements to accommodate this desire. The endowment manager, however,
should be sensitive to the diminished portfolio return that may result from requiring excess liquidity.
Several studies have supported Harvard’s Jeremy Stein in his observation that on-demand liquidity
exposes “arbitrageurs to the risk of large withdrawals if they perform poorly in the short run. This
risk in turn makes it dangerous for them [investment managers] to put on trades that are attractive in
a long-run sense, but where convergence to fundamentals is unlikely to be either smooth or rapid.”
To take one leading example, open-end funds are unlikely to want to bet against something like
the Internet bubble of the late 1990s.16 It could be argued that competition for investor funds among
managers makes mediocrity preferable to the chance of failure. Verne Sedlacek of Commonfund
termed this phenomenon “timeframe arbitrage” and noted that endowments that could have a longer-
term investment horizon routinely cede this benefi t by unnecessarily insisting on liquidity.17 When
the performance of less liquid asset classes such as real assets and private equity are compared to
that of more liquid classes such as domestic equity, the endowment manager seeking superior long-
term performance would do well to incorporate less liquid classes into the portfolio.
Other Asset ClassesSome analysts believe that the focus on asset classes may have gone too far as investors have
sought to “over-optimize” their portfolios. David Loeper, CEO of Wealthcare Capital Management,
explained this concept as follows:
Where things have really got off track has been the insistence on breaking asset classes into sub-classes
by style, market capitalization, etc. The unpredictability of all the inputs into our optimizers, even over
long periods of time, has been ignored. We have attempted to take effi cient portfolios of stocks, bonds
and cash and make them even more effi cient by breaking the unpredictable asset classes into even less
predictable sub-classes. This has all been done into the pursuit of “effi ciency” as the proposal was
validated by the Brinson and Beebower study, which purports to fi nd that over 90 percent of the invest-
ment return variance is explained by asset allocation. The risk that you produce ineffi cient portfolios
INCREASES if you increase the number of “asset classes” for which you must forecast not only the
risk and returns but also each asset class’ correlation to the others. The results of the optimizer and
your resulting portfolio’s effi ciency is based on the accuracy of the inputs and NOT THE NUMBER
OF THE INPUTS.18
Organizational ExpertiseSome organizations have signifi cant tenures of experience with certain asset classes. For example,
Mr. Spitz noted that Vanderbilt’s endowment has over twenty-fi ve years of experience investing in
private equities (Spitz, 2004, pers. comm.). Breadth of experience with a particular asset class helps
ensure that an endowment understands its true risks, the proper analysis of potential additional
investments, and its interactions with other elements of the portfolio.
GroupthinkSeveral endowment fund managers have noted that they commonly compare their endowment allo-
cations to those of peer institutions and that, as a result, endowment allocations are often similar to
the “average” as reported by one or more surveys or consulting fi rms. One endowment fund manager
expanded this thought by presciently noting that expecting materially different performance with
substantially the same allocation is unreasonable. It is anecdotally interesting to wonder whether
the seminal study “proving” the importance of asset allocation could have even had a substantially
different conclusion. It seems likely that the pensions surveyed in the study had very similar alloca-
tions given the human tendency to measure one’s self against peers and to use peers for guidance.
AQ7
AQ8
TAF-K15524-13-0301-C010.indd 236TAF-K15524-13-0301-C010.indd 236 08/05/13 7:52 PM08/05/13 7:52 PM
Page 11
237Investment Policy Statement Benchmark Construction
Although peer comparisons can be useful in evaluating your institution’s own processes, groupthink
can be highly contagious and dangerous. For example, in the fi rst quarter of 2000, net fl ows into
equity mutual funds were $140.4 billion as compared to net infl ows of $187.7 billion for all of 1999.
February’s equity fund infl ows were a staggering $55.6 billion, the record for single month invest-
ments. For all of 1999, total net mutual fund investments were $169.8 billion,19 meaning that inves-
tors “rebalanced” out of asset classes such as bonds just in time for the market’s March 24, 2000
peak (as measured by the S&P 500). Of course, investors are not immune to poor decision making
in upward trending markets. In 2001, investors withdrew a then-record amount of $30 billion20 in
September, presumably in response to the September 11th terrorist attacks. These investors man-
aged to skillfully “rebalance” their ways out of markets that declined approximately 11.5 percent
during the fi rst several trading sessions after the market reopened, only to reach September 10th
levels again after only 19 trading days. In 2002, investors revealed their relentless pursuit of self-
destruction when they withdrew a net $27.7 billion from equity funds21 just before the S&P 500’s
29.9 percent 2003 growth.
Although it is easy to dismiss the travails of mutual fund investors as representing only the per-
formance of amateurs, it is important to remember that institutions are not automatically immune
by virtue of being managed by investment professionals. For example, in the 1960s and early 1970s,
common wisdom stipulated that portfolios include the Nifty Fifty stocks that were viewed to be
complete companies. These stocks were considered “one-decision” stocks for which the only deci-
sion was how much to buy. Even institutions got caught up in purchasing such current corporate stal-
warts as Joe Schlitz Brewing, Simplicity Patterns, and Louisiana Home & Exploration. Collective
market groupthink pushed these stocks to such prices that price/earnings ratios routinely exceeded
50. Subsequent disappointing performance of this strategy only revealed that common wisdom is
often neither common nor wise.
More recently, the New York Times reported on June 21, 2007, that Bear Stearns had managed
to forestall the demise of the Bear Stearns High Grade Structured Credit Strategies and the related
Enhanced Leveraged Fund. The two funds held almost $2 billion in mortgage-backed debt securi-
ties, many of which were in the sub-prime market. To compound the problem, the funds borrowed
much of the money used to purchase these securities. The fi rms who had provided the loans to
make these purchases represent some of the smartest names on Wall Street, including JP Morgan,
Goldman Sachs, Bank of America, Merrill Lynch, and Deutsche Bank.22 Despite its efforts, Bear
Stearns had to inform investors less than a week later that these two funds had collapsed.
Amount of Support Endowment Needs to ProvideThe endowment manager will certainly want to consider the proportion of the institution’s operat-
ing budget that is funded by the endowment. For example, an institution whose operating budget is
funded 30 percent by the endowment may need to make fundamentally different decisions regard-
ing the risk/return parameters of the portfolio than an institution whose operating budget is funded
5 percent by the endowment.
TACTICS FOR IMPLEMENTING THE ALLOCATION POLICY
The Effi cient Market HypothesisAn effi cient capital market is one in which security prices rapidly change to refl ect the arrival of
new information and where the prices of securities refl ect all information about the securities. The
effi cient market hypothesis (EMH) includes assumptions regarding the strength of the markets’
effi ciency.
For example, if the markets fully refl ect all security-market information such as historical pric-
ing trends, the effi ciency is deemed to be of at least the weak form. If, on the other hand, security
prices refl ect all public and private information, the effi ciency is deemed to be of the strong form.
If the EMH is true in its strongest form, investors cannot hope to achieve risk-adjusted returns in
TAF-K15524-13-0301-C010.indd 237TAF-K15524-13-0301-C010.indd 237 08/05/13 7:52 PM08/05/13 7:52 PM
Page 12
238 Financial Management Strategies for Hospitals and Healthcare Organizations
excess of those for the applicable market. In other words, if the EMH is true in its strongest sense,
endowment managers would wisely seek to employ a passive form of investing in which the endow-
ment purchases baskets of investments designed to replicate a given market index.
Numerous research studies have been conducted regarding the strength of the market’s effi -
ciency, and the results suggest that the domestic markets are effi cient to some degree. However, the
manager considering a purely passive approach to endowment management should consider several
additional items. First, passive investing may be an unattractive strategy in protracted bear or fl at
markets. For example, the Dow Jones Industrial Average fell approximately 9.7 percent over the
fi fteen-year period between 1966 and 1981. Second, although domestic equity markets are generally
believed to have some effi ciency, other asset classes are believed to be much less effi cient.
Managing for AlphaAlpha measures non-systematic return, or the return that cannot be attributed to the market. It shows
the difference between a fund’s actual return and its expected performance given the level of sys-
tematic (or market) risk (as measured by beta). For example, a fund with a beta of 1.2 in a market
that returns 10 percent would be expected to earn 12 percent. If, in fact, the fund earns a return of 14
percent, it then has an alpha of 2, which would suggest that the manager has added value. Conversely,
a return below that expected given the fund’s beta would suggest that the manager diminished
value. In a truly effi cient market, no manager should be able to consistently generate positive alpha.
In such a market, the endowment manager would likely employ a passive strategy that seeks to repli-
cate index returns. Although there is substantial evidence of effi cient domestic markets, there is also
evidence to suggest that certain managers do repeat their positive alpha performance. In fact,
a 2002 study by Roger Ibbotson and Amita Patel found that “the phenomenon of persistence does
exist in domestic equity funds.” The same study suggested that 65 percent of mutual funds with
the highest style-adjusted alpha repeated with positive alpha performances in the following year.23
Additional research suggests that active management can add value and achieve positive alpha in
concentrated portfolios. A recent study of actively managed mutual funds found that “on average,
higher industry concentration improves the performance of the funds. The most concentrated funds
generate, after adjusting for risk . . the highest performance. They yield an average abnormal return
[alpha] of 2.56 percent per year before deducting expenses and 1.12 percent per year after deducting
expenses.”24
FutureMetrics, a pension plan consulting fi rm, calculated that in 2006 the median pension fund
achieved record alpha of 3.7 percent compared to a 60/40 benchmark portfolio, the best since the
fi rm began calculating return data in 1988.25 Over longer periods of time, an endowment man-
ager’s ability to achieve positive alpha for their entire portfolio is more hotly debated. Dimensional
Fund Advisors, a mutual fund fi rm specializing in a unique form of passive management, compiled
FutureMetrics data on 192 pension funds for the period of 1988 through 2005. Their research showed
that, over this period of time, approximately 75 percent of the pension funds underperformed the
60/40 benchmark.26 The end result is that many endowments will use a combination of active and
passive management approaches with respect to some portion of the domestic equity segment of
their allocation. One approach is known as the “core and satellite” method, in which a “core” invest-
ment into a passive index is used to capture the broader market’s performance while concentrated
satellite positions are taken in an attempt to “capture” alpha. Because other asset classes such as
private equity, foreign equity, and real assets are often viewed to be less effi cient, the endowment
manager will typically use active management to obtain positive alpha from these segments.
The Tactical ApproachMany successful endowments will establish a “strategic” allocation policy that is intended to guide
long-term (greater than one year) investment decisions. This strategic allocation refl ects the endow-
ment’s thinking regarding the existence of perceived fundamental shifts in the market. Most endow-
ments will also establish a target range or band for each asset class. The day-to-day managers then
AQ9
AQ10
TAF-K15524-13-0301-C010.indd 238TAF-K15524-13-0301-C010.indd 238 08/05/13 7:52 PM08/05/13 7:52 PM
Page 13
239Investment Policy Statement Benchmark Construction
have the fl exibility to make tactical decisions for a given class so long as they stay within the target
range. The term “tactical” when used in the context of investment strategy refers to the manager’s
ability to take advantage of short-term (under one year) market anomalies such as pricing dis-
crepancies between different sectors or across different styles. Historically, tactical decisions with
respect to asset allocation were derided as “market timing.” However, market timing implies mov-
ing outside of the target ranges, whereas tactical decision making simply addresses the opportunis-
tic deployment of funds within the asset class target range.
PAYOUT POLICY
Although an endowment is intended to provide an institution with continuing support and as such is
a long-term investment, the institution’s needs for current support dictate that some level of income
be drawn from the endowment. The original payout policies had their roots in federal tax regula-
tions that prescribed certain minimum payout standards for private foundations. Although these
rules are not generally applicable to healthcare endowments, the 5 percent payout currently required
under these rules seems to be a starting point for many endowments. After an extended bull market
in which institutions could simultaneously raise their level of endowment distributions and increase
the asset base of the endowment through market growth, the three-year bear market forced many
endowments to re-examine their payout policies.
SUSTAINABLE WITHDRAWALS
Spending policies, which have a different yet as important a role in overall investments policy as
asset allocation, are focused on the concept of providing for intergenerational equity; that is, current
[patients and programs] should be neither advantaged nor disadvantaged relative to future [patients and
programs]. To maintain this intergenerational equity, the endowment must maintain its value in real
terms (i.e., adjusted for infl ation) over a period of time. Thinking of it in another way, the endowment
at a minimum should cover an institution’s spending and then grow by at least the rate of infl ation.27
In other words, if the applicable long-term rate of infl ation is 3 percent and the rate of withdrawal
is 5 percent, the long-term rate of return cannot be less than 8 percent in order to avoid depleting
the real value of the portfolio. The diffi culty arises when market volatility causes the rate of return
during discreet time periods to fl uctuate signifi cantly from the long-term average. This phenomenon
can cause an endowment to meet its long-term return objectives but still to deplete the portfolio.
COMMON PAYOUT METHODS
Recognizing the risk that market volatility represents to long-term portfolio health, endowments
utilize a variety of methods to calculate periodic payouts.
• Investment yield: An endowment using this method spends only its dividends and interest
and re-invests any unrealized and realized gains. There would appear to be two primary
disadvantages of this method. First, the payout amount will be extremely volatile as yields
on equity and fi xed income investments fl uctuate. Second, the endowment manager could
be encouraged to adopt a short-term focus on yield to the detriment of purchasing power
preservation.
• Percentage of the prior year’s ending market value: An endowment using this method
would withdraw some fi xed percentage of the prior year’s market value. As with the investment
yield method, disbursements from the endowment can be somewhat volatile under this method.
• Moving average: This approach, which is most common among educational institutions,
generally involves taking a percentage of a moving average of the endowment market
value. The percentage commonly approximates 5 percent over a three-year period.
TAF-K15524-13-0301-C010.indd 239TAF-K15524-13-0301-C010.indd 239 08/05/13 7:52 PM08/05/13 7:52 PM
Page 14
240 Financial Management Strategies for Hospitals and Healthcare Organizations
• Infl ation-adjusted: This method simply adds some factor to the applicable rate of infl ation
for the institution.
• Banded infl ation or corridor: This method is similar to the infl ation-adjusted method
except that it establishes a corridor or band of minimum and maximum increases in an
attempt to limit the volatility of the disbursement amounts.
Table 10.5 compares the year-end endowment balances under each of these payout methodolo-
gies over a twenty-year period assuming a 60/40 equity/fi xed income allocation to roughly mirror
the average allocation described earlier. Equity returns are approximated using the S&P 500 index
returns while fi xed income returns are approximated using fi ve-year Treasury bill yields.
TABLE 10.5Payout Policy Comparison Ending Portfolio Balance (in Thousands)
Spend YieldSpend
PercentageMoving Average
Infl ation Adjusted
Banded Infl ation
Medical Infl ation
1984 $101,170 $101,085 $101,085 $99,474 $99,585 $106,111
1985 $103,268 $102,181 $102,217 $98,301 $99,171 $113,288
1986 $106,576 $103,290 $103,382 $96,216 $98,760 $122,017
1987 $109,668 $104,410 $104,561 $96,007 $98,544 $129,098
1988 $112,625 $105,543 $105,754 $94,732 $98,135 $138,021
1989 $115,671 $106,688 $106,961 $91,968 $97,727 $149,758
1990 $118,841 $107,845 $108,181 $88,288 $97,322 $164,113
1991 $122,610 $109,015 $109,416 $86,227 $96,918 $177,110
1992 $127,017 $110,198 $110,664 $85,329 $96,515 $188,846
1993 $132,142 $111,393 $111,927 $85,492 $96,700 $199,030
1994 $136,611 $112,601 $113,204 $86,059 $97,341 $208,826
1995 $141,489 $113,823 $114,495 $87,467 $98,935 $217,071
1996 $146,590 $115,058 $115,802 $89,695 $100,997 $223,666
1997 $151,886 $116,306 $117,123 $92,176 $103,103 $229,971
1998 $158,036 $117,567 $118,459 $94,175 $105,252 $237,827
1999 $164,117 $118,843 $119,811 $95,977 $107,267 $246,557
2000 $170,110 $120,132 $121,178 $97,335 $108,785 $256,838
2001 $177,438 $121,435 $122,561 $98,176 $109,725 $268,962
2002 $185,622 $122,752 $123,959 $98,703 $110,313 $282,541
2003 $194,738 $124,084 $125,373 $100,556 $112,384 $293,016
2004 $206,585 $131,634 $133,002 $106,674 $119,222 $305,432
2005 $219,158 $139,644 $141,095 $113,165 $126,477 $318,526
2006 $232,493 $148,141 $149,680 $120,051 $134,172 $329,874
Note: All calculations were performed by the principal author and assume an initial $100 million endowment portfolio and
a 60/40 split between domestic equities and fi xed income. Domestic equity returns are assumed to be entirely appre-
ciation in nature and to be approximated by increases in the S&P 500 index. Fixed income returns are assumed to be
approximated by average annual yields reported for U.S. fi ve-year Treasury notes. The analysis assumes cost-free
annual rebalancing to the asset allocation. The Spend Yield method assumes that only the yield (interest) is spend
each year. The Spend Percentage method assumes that a consistent 5 percent of the prior year’s ending balance is
spent each year. The Moving Average method assumes that 5 percent of the average of the prior three year’s ending
balance is spent. The Infl ation-Adjusted method assumes that ½ percent is added to the rate of medical infl ation to
determine each year’s spending rate. The Medical Rate of Infl ation was obtained from the Bureau of Labor Statistics
CPI for Medical Care for All Urban Consumers. The Banded Infl ation method utilizes the same assumptions as
the Infl ation Adjusted method except that annual spending cannot be less than 4 percent or more than 6.5 percent.
Table 10.6 compares the annual disbursements from the endowment under these alternative methodologies.
TAF-K15524-13-0301-C010.indd 240TAF-K15524-13-0301-C010.indd 240 08/05/13 7:52 PM08/05/13 7:52 PM
Page 15
241Investment Policy Statement Benchmark Construction
STRESS TESTING
The numerical results indicate that spending must be set substantially lower than the long-term growth
rate of the portfolio, in order to produce an acceptable probability of preserving real value of the origi-
nal [principal]. As a very crude rule of thumb, the spending rate must be set at 200 basis points lower
than the expected growth rate of the fund itself in order to secure a less than 20% chance of having a
negative real return after 20 years. Thus, if a fund is expected to grow by 6% in real terms—a generous
equity premium in today’s environment—spending should be set at less than 4% of current assets.28
In other words, even if an endowment achieves its expected long-term real return of 6 percent, it is
possible for the endowment to fail to meet the goal of long-term principal preservation. Table 10.7
summarizes the diminution in real value of the $100 million endowment under the alternative pay-
out methods described and illustrated in the previous section.
AVOIDING MISTAKES
Among the best of the numerous books analyzing the causes of the crisis in the fi nancial markets is
Too Big to Save?, writ ten by Robert Pozen, chairman of MFS Investment Management and member
of The Commonwealth Fund’s board of directors and its investment committee.
In Too Big to Save?, Pozen describes how the Federal Reserve set interest rates too low from
2001 through 2006, leading dollar investors across the world to search for higher yields from
AQ11
AQ12
TABLE 10.6Payout Policy Comparison Annual Endowment Payouts (in Thousands)
Spend Yield Spend Percentage Moving Average Infl ation Adjusted Banded Infl ation
1984 $4,914 $5,000 $5,000 $6,611 $6,500
1985 $4,058 $5,054 $5,018 $7,226 $6,473
1986 $2,977 $5,109 $5,055 $8,066 $6,446
1987 $3,393 $5,164 $5,111 $6,064 $6,225
1988 $3,716 $5,221 $5,169 $7,116 $6,405
1989 $3,807 $5,277 $5,228 $8,529 $6,379
1990 $3,868 $5,334 $5,288 $9,275 $6,352
1991 $3,463 $5,392 $5,348 $7,434 $6,326
1992 $3,053 $5,451 $5,409 $6,145 $6,300
1993 $2,603 $5,510 $5,471 $5,028 $5,688
1994 $3,571 $5,570 $5,533 $4,635 $5,243
1995 $3,435 $5,630 $5,597 $3,828 $4,330
1996 $3,508 $5,691 $5,660 $3,095 $3,957
1997 $3,624 $5,753 $5,725 $2,977 $4,040
1998 $3,092 $5,815 $5,790 $3,610 $4,124
1999 $3,535 $5,878 $5,856 $3,928 $4,390
2000 $3,993 $5,942 $5,923 $4,482 $5,009
2001 $3,023 $6,007 $5,991 $5,081 $5,679
2002 $2,612 $6,072 $6,059 $5,448 $6,088
2003 $2,179 $6,138 $6,128 $4,153 $4,641
2004 $2,666 $6,204 $6,198 $4,763 $5,324
2005 $3,350 $6,582 $6,372 $5,107 $5,707
2006 $4,151 $6,982 $6,657 $4,598 $5,138
Source: All calculations were performed by the principal author using assumptions that are the same as those used in
Table 10.5.
TAF-K15524-13-0301-C010.indd 241TAF-K15524-13-0301-C010.indd 241 08/05/13 7:52 PM08/05/13 7:52 PM
Page 16
242 Financial Management Strategies for Hospitals and Healthcare Organizations
mortgage-backed securities than were obtainable with U.S. Treasuries.4 This global demand,
given lax regulation of many mortgage lenders and the excessive leverage allowed in Wall Street
banks, drove housing prices to bubble heights. Pozen documents how the spread of new fi nancial
instruments such as collateralized debt obli gations and credit default swaps introduced signifi cant
unappre ciated risks into the fi nancial system, a problem compounded by the trading of such secu-
rities outside regulated exchanges and by the confl icted position of credit-rating agencies, whose
compensation depended on favorable ratings for securities they were supposed to score objectively.
In the debate on legislation to address these fl aws, there is wide agreement on the need for the
following reforms: a systemic risk monitor, higher capital requirements for fi nancial institutions,
more transparent and better organized markets for fi nancial derivatives, as well as expansion of the
fed eral government’s resolution authority to cover insol vent non-bank fi nancial fi rms. Passage of
reform leg islation, however, has been delayed by major points of disagreement, including the scope
of the Federal Reserve’s authority, the proper agency for regulating consumer fi nancial products,
and the supervisory framework for mega-fi nancial institu tions in the system—how to insure their
account ability and defi ne a contained, low-cost role for government when these institutions get into
trouble.
Along with all Americans, foundation endow ment managers have a great deal riding on the out-
come of the ongoing fi nancial system reform debate in the U.S. Congress. The modest investment
returns forecast for the next seven years, noted above, are predi cated on at least a modest economic
recovery and average annual infl ation of 2.5 percent.
AQ13
AQ14
TABLE 10.7Payout Policy Comparison Erosion of Purchasing Power (in Thousands)
Spend Yield Spend Percentage Moving Average Infl ation Adjusted Banded Infl ation
1984 −$4,940 −$5,026 −$5,026 −$6,636 −$6,526
1985 −$10,020 −$11,107 −$11,071 −$14,987 −$14,117
1986 −$15,442 −$18,728 −$18,635 −$25,801 −$23,258
1987 −$19,430 −$24,688 −$24,537 −$33,091 −$30,554
1988 −$25,396 −$32,478 −$32,267 −$43,289 −$39,886
1989 −$34,087 −$43,070 −$42,797 −$57,790 −$52,030
1990 −$45,271 −$56,267 −$55,931 −$75,824 −$66,791
1991 −$54,500 −$68,095 −$67,694 −$90,883 −$80,192
1992 −$61,829 −$78,648 −$78,182 −$103,517 −$92,331
1993 −$66,888 −$87,637 −$87,103 −$113,538 −$102,330
1994 −$72,215 −$96,225 −$95,623 −$122,767 −$111,485
1995 −$75,582 −$103,248 −$102,575 −$129,603 −$118,136
1996 −$77,076 −$108,609 −$107,865 −$133,972 −$122,669
1997 −$78,085 −$113,665 −$112,848 −$137,795 −$126,868
1998 −$79,792 −$120,260 −$119,368 −$143,653 −$132,575
1999 −$82,440 −$127,714 −$126,746 −$150,579 −$139,290
2000 −$86,728 −$136,706 −$135,660 −$159,503 −$148,053
2001 −$91,524 −$147,527 −$146,402 −$170,786 −$159,237
2002 −$96,919 −$159,789 −$158,582 −$183,838 −$172,228
2003 −$98,278 −$168,933 −$167,643 −$192,461 −$180,633
2004 −$98,844 −$173,798 −$172,430 −$198,757 −$186,209
2005 −$99,368 −$178,882 −$177,431 −$205,361 −$192,049
2006 −$97,381 −$181,733 −$180,194 −$209,823 −$195,702
Source: All calculations were performed by the principal author using assumptions that are the same as those employed in
Table 10.5.
TAF-K15524-13-0301-C010.indd 242TAF-K15524-13-0301-C010.indd 242 08/05/13 7:52 PM08/05/13 7:52 PM
Page 17
243Investment Policy Statement Benchmark Construction
However, as documented by Carmen M. Reinhart and Kenneth S. Rogoff in a recently published
landmark study of fi nancial crises, the typical aftermath of a major bank-centered fi nancial crisis
involves a protracted period of falling gross domestic product, often lasting two years or more.5 In
their review of eight centuries of fi nancial crises, with special focus on those in this century, these
scholars label the current turmoil as the “Second Great Contraction,” ranking just below the one that
produced the Great Depression. Thus, there is substantial risk that the nation may face slow growth
and high unemployment for an extended period. This risk puts a premium on getting fi nancial sys-
tem reforms “right,” and in place as soon as pos sible. As Rogoff notes, “If we don’t re-regulate the
banking system properly, we’ll either get very slow growth from overregulation, or another fi nancial
crisis in just ten to fi fteen years.”6
Added to these risks are those posed by the state of U.S. fi nances—the level of government debt
and persistent international balance of payments (current account) defi cits that threaten long-term
growth and stability. As Alice Rivlin, former vice chair of the Federal Reserve and founding direc-
tor of the Congressional Budget Offi ce, argues, “[T]he biggest economic challenge . . . is enacting
credible future defi cit reduction without derailing the fragile recovery.
RETHINKING THE MANAGEMENT OF FOUNDATION ENDOWMENTS: THE COMMONWEALTH FUND 2009 ANNUAL REPORT
In Too Big to Save?, Pozen lays out the mistakes made by many modelers responsible for the intro-
duction of the complex fi nancial instruments, such as mortgage-backed securities and credit default
swaps, that played key roles in bringing the fi nancial system to its knees in 2008.8 Reinhart and
Rogoff similarly identify recurring fallacies and lessons to be drawn from the history of fi nancial cri-
ses. These two bodies of work can help foundations avoid mistakes in managing their endowments.
1. Simple extrapolations of the past are dangerous: Pozen cautions that “the differences
between past and future trend lines can be as important as the similarities.” For example,
given the gravity of the current fi nancial crisis, foundations should be careful about assum-
ing that the historical average of market returns will prevail over the next several years.
2. Be patient in riding out fi nancial bubbles: As Pozen reminds us, investment bubbles can
last for years, but economic fundamentals ultimately win out. In safeguarding against
bubbles, foundations should base their budgeting and investment strategies on what they
perceive to be long-term realities. As Jeremy Grantham points out, this means in practice
that, in a fi nancial bubble like that of 2003–2008, perpetual foundations should allow their
spending rate (spending as a percentage of endowment average market value) to fall—
thereby setting aside “fat years” funds for use in the lean years that are inevitably to come.9
More diffi cult, of course, is sticking to fundamentally sound investment strategies that
produce below-benchmark returns in periods of market excess. As Pozen concludes, “The
timing of the burst of any bubble is impossible to predict, so be very patient.”
3. The frequency of extreme events is greater than people think: Major global banking cri-
ses have occurred, on average, every twelve years since 1900, as Reinhart and Rogoff
document, and every eleven years since 1945. For perpetual foundations, the occurrence
within a forty-year period of two endowment-shaking crises like the fi nancial crisis and oil
shock–induced stagfl ation of the 1970s (when it was not unusual for the infl ation-adjusted
market value of foundation endowments to decline by 60 percent) and the 2008 global
fi nancial disorder indicates that such crises are not “black swan” events. Foundation man-
agers would be wise to heed Pozen’s advice: Pay more attention to low-probability events
and hedge or insure against them if possible.
4. Beware of the “This Time Is Different” syndrome: As Reinhart a nd Rogoff describe, the
thinking of the mid-2000s in the United States was, “Everything is fi ne because of global-
ization, the technology boom, our superior fi nancial system, our better understanding of
AQ15
AQ16
AQ17
AQ18
AQ19
AQ20
AQ21
AQ22
AQ23
AQ24
AQ25
TAF-K15524-13-0301-C010.indd 243TAF-K15524-13-0301-C010.indd 243 08/05/13 7:52 PM08/05/13 7:52 PM
Page 18
244 Financial Management Strategies for Hospitals and Healthcare Organizations
monetary policy, and the phenomenon of securitized debt.” In their research covering mul-
tiple centuries, these authors fi nd that similar thinking preceded virtually every fi nancial
crisis. Foundation managers should conclude that the siren call of “This Time Is Different”
is a sure signal to lower the risk profi le of the endowment.
5. Be knowledgeable of the predictors of fi nancial crisis: Reinhart and Rogoff present a con-
vincing body of evidence that markedly rising asset prices (particularly housing bubbles),
slowing real economic activity, large current account defi cits, and sustained debt build-ups
(public or private) generally precede a fi nancial crisis. Attention to such systemic risk mea-
sures can help foundations position their endowments to better weather fi nancial crises.
6. Understand how the origins of a fi nancial crisis can greatly affect the depth and duration of its impact on economies and markets: Reinhart and Rogoff’s research informs us that
bubbles are far more dangerous when they are fueled by debt, as was the case with the
global housing bubble of the early to mid-2000s. Their study reveals that global fi nancial
crises arising from excess leverage are typically followed by very severe multiyear slow-
downs in economic activity accompanied by high unemployment. Just as such crises pro-
duce major bear markets in stocks, so they entail bear market rallies followed by resumed
slumps. Endowment managers ignore this pattern at considerable risk.
7. Ignore liquidity risk at your peril: With their deep endowment pockets and signifi cant
fi xed-income holdings, foundations generally do not worry much about liquidity. With
increasing commitments to private equity and hedge fund partnerships, however, liquidity
risk was a real concern for many endowments before the recent fi nancial crisis. The crisis
demonstrated that this risk rises signifi cantly as leverage increases within the fi nancial
system. Thus, foundations should keep necessary reserves on hand and take increasing
care that they are cautiously invested as fi nancial storms gather. As yields fall on short-
term investments, foundations will be lured to higher-yielding alternative products, but
the risks and liquidity profi les of such products require very close examination. In light of
recent experience, a number of foundations have taken out lines of credit, and more should
consider doing so.
8. Be ready to question the experts: Adapting Pozen’s advice on how banks and investment
fi rms should manage their expert modelers, a primary role of a foundation’s investment
committee is to understand the limitations of the foundation’s fi nancial staff, consultants,
and investment managers. Committee members should ask questions that push the so-
called experts to explore fully the risks involved in each strategy and the assumptions
underlying any quantitative model.
OTHER CONSIDERATIONS
Management ModelsSolo Investment Committee ModelIn this common approach, typically employed by very small foundations but also by many small
and even midsize ones, the investment committee of the board has virtually all strategic and opera-
tional responsibility for the endowment—working with little or no internal staff or consultant sup-
port, although generally delegating portfolio management to a brokerage fi rm, mutual funds, or
external investment managers (typically using commingled funds shared with other investors).
In this model there is no question where accountability lies, provided performance is tracked and
the board holds the committee accountable.
The weaknesses are that it can be diffi cult to recruit members with suffi cient investment experi-
ence and the ability to commit the required time and attention to successful investment, and there
is signifi cant risk of confl ict of interest. There are challenges in achieving consensus while avoiding
“groupthink,” and no investment company research is available.
TAF-K15524-13-0301-C010.indd 244TAF-K15524-13-0301-C010.indd 244 08/05/13 7:52 PM08/05/13 7:52 PM
Page 19
245Investment Policy Statement Benchmark Construction
Investment Committee-Investment Consultant ModelAs foundation size and investment strategy complexity increase, many investment committees rec-
ognize the need for an investment consultant to help inform and guide their decisions, and some-
times to help implement them. The amount of responsibility delegated by the committee ranges
signifi cantly under this model, depending on the capacities and preferences of the committee and
the ability and services offered by the consultant.
The strength in this model is provided by advice a consultant can bring on asset allocation
based on a wide range of contacts and experience, as well as a strong fi nancial research base.
A consultant can provide an independent voice that helps build a census and avoids confl icts of
interest.
This model has weakened accountability by diffusion of responsibility resulting from diffi culties
in attributing performance. There is diffi culty in verifying the past performance of the consultant,
and the entity must compete with many other clients requiring client’s attention. Effective manage-
ment of consultant can also be an issue.
Investment Committee-Internal Financial Staff-Investment Consultant Model Any foundation with assets of $250 million or more is likely to pursue a sophisticated diversifi ed
investment strategy. Under these circumstances, the day-to-day responsibilities of managing the
endowment require qualifi ed staff; moreover, barring an investment committee member with the
time, inclination, and expertise to work closely with the consultant on strategic and operational
issues like manager searches, a professional staff member is needed to ensure the best use of the
time and skills of the consultant and committee members. Thus, this model entails still higher de
facto (if not formal) levels of responsibility delegation by the investment committee.
The model provides better oversight of and more effective use of consultant. More accountability
exists and safeguards from confl ict of interest. This model, however, relies heavily on the ability of
internal staff and the entity’s ability to pay competitive wages to attract capable staff to add value.
Internal CIO ModelOnce a foundation reaches the $2 billion level in endowment assets, it becomes economical and
feasible to hire a full-time, highly trained, experienced chief investment offi cer (CIO) and recruit a
sizeable, dedicated professional investment team, compensated at the necessary competitive levels.
As described by Lawrence E. Kochard and Cathleen M. Rittereiser, a number of very large founda-
tions, including the Carnegie Corporation and the William and Flora Hewlett Foundation, use this
model and have achieved considerable success.
Outsourced CIO (O-CIO) ModelGiven the shortcomings of the solo investment committee, committee-consultant, and committee-
fi nancial staff-consultant models discussed above, the trend in recent years is for endowments with
less than $2 billion dollars in assets to fully outsource the management of their endowment to a fi rm
that essentially offers a packaged set of services comparable to those that very large foundations
obtain with an in-house CIO. The O-CIO fi rm—the best being the creation of a stellar former CIO
of a large university endowment or pension fund—assumes most of the responsibility for manag-
ing the endowment. While the amount of delegated authority varies from foundation to foundation,
most investment committees using this model have an essentially advisory role and, beyond consul-
tation on broad strategy, leave decisions on managers and tactical moves to the O-CIO. The spec-
trum of actual services offered by O-CIOs is wide, ranging from somewhat customized portfolios
to one-size-fi ts-all proprietary portfolios.
This method provides a high level of investment experience and expertise and is a potential
solution to the problem of a “missing CIO” for endowments with less than $2 billion. Weaknesses
of this approach are the limitations on customization of strategy, the “key person risk” exists, and
inadequate oversight by the investment committee.
AQ26
TAF-K15524-13-0301-C010.indd 245TAF-K15524-13-0301-C010.indd 245 08/05/13 7:52 PM08/05/13 7:52 PM
Page 20
246 Financial Management Strategies for Hospitals and Healthcare Organizations
Controlling RisksBy defi nition, investment risk means uncertainty. As John Griswold, Executive Director of the
Commonfund Institute noted, however, risk can be managed, but it takes “top-down commitment to
risk management and a tough attitude.” An endowment must understand its risks and put someone in
charge of regularly assessing risk and reporting to the committee (Griswold, 2004, pers. comm.). In
1994, Orange County in California fi led for bankruptcy after its treasurer invested signifi cant por-
tions of its $7.5 billion investment pool in various leveraged or derivative securities. It is quite likely
that this bankruptcy would not have occurred had the Orange County treasurer, Robert Citron, been
subject to independent, informed oversight and a comprehensive risk management strategy.29
If the ultimate measure of performance is achieving the endowment’s goals, the ultimate mea-
sure of risk is failing to achieve those same goals. Unfortunately, the inter-generational nature of
endowments is such that ultimate performance and risk are diffi cult to measure in discreet time
increments. In fact, fi xation solely upon the long-term risk would often obscure short-term risks that
would actually result in long-term failure. In managing endowment risk, there seems to be several
best practice steps that successful endowments follow.
Understand the RiskAlthough the broad risk facing endowments can be quickly summarized as “the failure to achieve
spending and infl ation-adjusted growth goals,” the endowment portfolio and the individual assets
may face any number of the following subsidiary risks.
• Call risk: The risk faced by a holder of a callable bond that a bond issuer will take advan-
tage of the callable bond feature and redeem the issue prior to maturity. This means the
bondholder will receive payment on the value of the bond and, in most cases, will be rein-
vesting in a less favorable environment (one with a lower interest rate).
• Capital risk: The risk an investor faces that he or she may lose all or part of the principal
amount invested.
• Commodity risk: The threat that a change in the price of a production input will adversely
affect a producer who uses that input.
• Company risk: The risk that certain factors affecting a specifi c company may cause its
stock to change in price in a different way from stocks as a whole.
• Concentration risk: Probability of loss arising from heavily lopsided exposure to a particu-
lar group of counterparties.
• Counterparty risk: The risk that the other party to an agreement will default.
• Credit risk: The risk of loss of principal or loss of a fi nancial reward stemming from a bor-
rower’s failure to repay a loan or otherwise meet a contractual obligation.
• Currency risk: A form of risk that arises from the change in price of one currency against
another.
• Defl ation risk: A general decline in prices, often caused by a reduction in the supply of
money or credit.
• Economic risk: the likelihood that an investment will be affected by macroeconomic con-
ditions such as government regulation, exchange rates, or political stability.
• Hedging risk: Making an investment to reduce the risk of adverse price movements in an
asset.
• Infl ation risk: Uncertainty over the future real value (after infl ation) of your investment.
• Interest rate risk: Risk to the earnings or market value of a portfolio due to uncertain future
interest rates.
• Legal risk: Risk from uncertainty due to legal actions or uncertainty in the applicability or
interpretation of contracts, laws, or regulations.
• Liquidity risk:30 The risk stemming from the lack of marketability of an investment that
cannot be bought or sold quickly enough to prevent or minimize a loss.
TAF-K15524-13-0301-C010.indd 246TAF-K15524-13-0301-C010.indd 246 08/05/13 7:52 PM08/05/13 7:52 PM
Page 21
247Investment Policy Statement Benchmark Construction
It would seem self-evident that a risk that is not fully understood cannot be consciously managed
or mitigated. As such, the endowment board should consider asking the chief investment offi cer to
delineate the risks associated with each asset class and determine whether options exist for mitigat-
ing or eliminating those risks (John Griswold, 2004, pers. comm.).
Measure the RiskIn addition to the listed risks that may be relevant to particular investments or classes, most endow-
ments will use one of the following broad measures of risk:
• Beta: Beta is a measure of systematic or market risk for either an individual asset or an
entire portfolio. In other words, beta measures a given security’s sensitivity to market
movements. For example, a beta of 1.0 means that a 1 percent change in the market will
result in a 1 percent change in the security’s price. A beta of 1.5 means that a 1 percent
change in the market will result in a 1.5 percent change in the price of the security. Beta is
calculated using a regression model that compares fl uctuations in the security’s return to
that of the market. Many endowments will seek to maintain a beta that is substantially less
than that of some broad market index.
• Standard deviation: In statistical terms, standard deviation measures a normal distribu-
tion around a mean or average. For investment purposes, standard deviation is used to mea-
sure “risk” or, more literally, volatility. As with beta, standard deviation can be measured
at either the asset or the portfolio level.
• Value at risk (VAR): VAR31 as a risk measure has been gaining in popularity for several
reasons. First, portfolio managers and their clients intuitively evaluate risk in monetary
terms rather than standard deviation. Second, in marketable portfolios, deviations of a
given amount below the mean are less common than deviations above the mean for that
same amount.32 Unfortunately, measures such as standard deviation assume symmetrical
risk. VAR measures the risk of loss at some probability level over a given period of time.
For example, a manager may desire to know the portfolio’s risk over a one-day time period.
The VAR can be reported as being within a desired quantile of a single day’s loss. In other
words, assume a portfolio possesses a one-day 90 percent VAR of $5 million. This means
that in any one of ten days the portfolio’s value could be expected to decline by more than
$5 million. Note that VAR is only useful for the liquid portions of an endowment’s portfo-
lio and cannot be used to assess risks in classes such as private equity or real assets.
Contingency PlanMany quantitative methods would have suggested that the October 1987 crash was impossible. Mark
Rubenstein, a professor at University of California at Berkeley, noted that if annualized stock market
volatility is assumed to be approximately 20 percent “(the historical average since 1928), the probabil-
ity that the stock market could fall 29 percent in a single day is 10–160. So improbable is such an event
that it would not be anticipated to occur even if the stock market were to last for 20 billion years. . . .
Indeed, such an event should not occur even if the stock market were to enjoy a rebirth for 20 billion
years in each of 20 billion big bangs.”33 Although it was statistically impossible for it to happen, it did.
The nature of crises is such that many are unanticipated events with unexpected precipitators. As
such, a contingency plan cannot address every conceivable event. A contingency plan should address
the process for confronting these events. Most importantly, the plan should assign responsibility for
actions and contain provisions to limit the ability of panic to impair long-term decisions.
Endowments have at their core donor trust. As such, it is important for an endowment’s contin-
gency plan to include provisions for communicating promptly and forthrightly with the public. One
only has to look at the Red Cross’ performance during the aftermath of the September 11, 2001,
tragedy to receive a lesson on an inappropriate approach. After donating more than $550 million
to the Liberty Fund, donors learned that less than $175 million had been spent on direct aid for
AQ27
TAF-K15524-13-0301-C010.indd 247TAF-K15524-13-0301-C010.indd 247 08/05/13 7:52 PM08/05/13 7:52 PM
Page 22
248 Financial Management Strategies for Hospitals and Healthcare Organizations
victims and that the Red Cross was allocating a large portion of the funds to other programs. After
public outcry and congressional hearings, the Red Cross announced that all donations would be
spent on direct victim relief. Unfortunately, Dr. Bernadine Healy, the president of the Red Cross,
resigned at least in part because of this controversy.34 These violations of public confi dence can have
long-term impacts on an endowment’s donor base. Consider also the United Way, whose national
leader, William V. Aramony, was accused of fraud, embezzlement, and other charges in 1992. Even
a decade later, infl ation-adjusted contributions are lower than they were before the scandal, even
though charitable giving in general has doubled.35
The very nature of crises is such that predetermined contingency plans generally allow more
rapid and appropriate reaction. For an endowment, a well-considered contingency plan will include
both an action (or standstill) plan and a public relations plan.
RebalanceRebalancing the endowment portfolio contradicts conventional market “wisdom” that you allow
your winners to run. Perhaps in speculation this is true, but for investing such a view can be deadly.
Take, for example, the Cleveland Clinic’s experience with its endowment. In 1999, the Cleveland
Clinic Foundation reported $1.2 billion in investments. Unfortunately, by the end of 2002, the
Foundation’s investments were valued at $650 million, a loss of approximately 50 percent. Its losses
refl ected its substantial allocation into technology stocks during the technology boom of the late
1990s. As a result of these investment losses, the Clinic had to postpone a planned $300 million
cardiology center, and certain debt fi nancing had to be restructured. In addition, both Moody’s and
Standard & Poor lowered their ratings on the Clinic.36
Because rebalancing by defi nition requires an endowment to take money from more successful
investment classes and invest it into under-performing classes, it will always cause some measure
of anguish. There will always be some reason why rebalancing should not take place. In 1987, the
unprecedented single-day decline in the market could have been presented as an argument against
moving into equities. In 1998, the seemingly endless number of world fi nancial crises could have
provided a useful excuse to avoid rebalancing into emerging markets. Current bond prices could
provide similar reasons for not rebalancing into an appropriate fi xed income position. However,
because the whole reason for asset allocation policy decisions is to mitigate the negative impact that
irrational behavior can have on an endowment’s investment performance, the endowment should
include a process for periodic rebalancing of its assets.
WRITE IT DOWN
As described earlier, the primary lesson of asset allocation studies seems to be that investor behavior
is arguably the primary determinant of investment success. No one would dream of building a new
house without a blueprint. Although the homeowner might make change orders throughout the pro-
cess, the blueprint will always be used to ensure that the actual house fl oor plan matches the hom-
eowner’s expectation and, more importantly, that the house is structurally sound. The Investment
Policy Statement (IPS) is the endowment manager’s equivalent of a blueprint. One consultant notes
that an IPS must possess three characteristics:37
• Detailed and specifi c: The more detail and specifi city an IPS embodies, the more useful
and measurable it will be.
• Sound rationale: The IPS should answer many of the “why” questions that could arise
when someone with perfect hindsight looks to question the endowment manager’s approach.
• Logically consistent: The IPS should function as a cohesive document in which the provi-
sions do not contradict one another.
Jay Yoder, CFA, Director of Investments at Smith College, noted that an IPS must have the fol-
lowing seven components:38
TAF-K15524-13-0301-C010.indd 248TAF-K15524-13-0301-C010.indd 248 08/05/13 7:52 PM08/05/13 7:52 PM
Page 23
249Investment Policy Statement Benchmark Construction
• Return objectives
• Defi nition and tolerance of risk
• Asset allocation guidelines
• Asset class rationales
• Provisions for periodic rebalancing
• Benchmarks at both the portfolio and asset class level
• Policy regarding indexing
A well-considered endowment IPS will also likely address such issues as payout policy, descrip-
tions of roles and responsibilities, and any investment restrictions. See a sample of an IPS at the end
of this chapter.
COMMITTEES AND STAFF
The failures of corporate governance have been well-publicized, with such examples as Enron, MCI
WorldCom, Adelphia, the Bear Stearns hedge funds, and even the New York Stock Exchange. That
such failures could happen despite the number of intelligent and talented people at each of these
entities suggests that the problems of corporate governance could easily affl ict the committee run-
ning an endowment. Although Sarbanes-Oxley does not yet directly impact the boards of non-profi t
organizations such as endowments, Verne Sedlacek, the former CEO of the Harvard Management
Company and current CEO of Commonfund, suggests that it does provide some considerations for
best practices. In particular, Mr. Sedlacek notes that endowments should consider the following
minimum items with respect to their boards:39
• Structure: One of the key considerations with respect to structure is the board’s size. Mr.
Sedlacek notes that the trend is towards smaller, more active boards. Larger boards can
devolve in such a way that little is accomplished.
• People: Although it may be enticing to have only investment professionals on the board, the
endowment may actually fi nd a board composed of individuals with varying experience to
be more valuable. Investment professionals are not immune to believing that their approach
or knowledge of a particular market segment represents the best option for the endowment.
• Relationships: It is becoming increasingly important that endowment boards have a num-
ber of independent voices.
• Compensation: Although most board members are volunteers, the potential liability and
degree of work required by service might lead the endowment to consider paying board
members to ensure that it attracts the best possible talent.
• Roles and Responsibilities: The endowment should try to carefully delineate the respon-
sibilities of the board and its members in relation to internal staff and the external manag-
ers. Indecisive or confl icting actions by the board can make it diffi cult for the endowment
to retain quality staff.
SELF-ASSESSMENT
Successful healthcare endowments often attribute part of their success to a consistent investment policy.
The elements of a formalized policy that are best known include the IPS, the asset allocation, and the
payout policy. Until recently, few tools existed to help endowments assess and benchmark their invest-
ment processes, particularly the less publicized elements of an appropriate process. The Foundation
for Fiduciary Studies publishes a guide, Prudent Practices for Investment Stewards, that could be help-
ful to endowment fi duciaries seeking to understand best practices in managing an investment process.
The Foundation also publishes a Self-Assessment of Fiduciary Excellence for Investment Stewards, which allows endowment fi duciaries to ask a number of questions about their own processes.40
TAF-K15524-13-0301-C010.indd 249TAF-K15524-13-0301-C010.indd 249 08/05/13 7:52 PM08/05/13 7:52 PM
Page 24
250 Financial Management Strategies for Hospitals and Healthcare Organizations
OTHER RESOURCES
There are many resources on investment theory and analysis. Although a growing number of con-
sultants will either fully or partially outsource endowment management, relatively fewer resources
offer unbiased advice regarding the controllable aspects of endowment management. Fortunately,
at least three resources provide general assistance to the endowment manager seeking additional
broad coverage of these topics.
Commonfund Institute: http://www.commonfund.org
Swensen, D.F.. 2003. Pioneering Portfolio Management: An Unconventional Approach to Institutional Management. New Haven: The Free Press.
Foundation for Fiduciary Studies: http://www.fi duciary360.com
CONCLUSION
Hospital and major healthcare entity endowment fund management needs aim for accountability on
the part of each major player who shares responsibility for the endowment, and for a management
model likely to make most of their resources while protecting against major risks.
In periods of extreme uncertainty, like recent economic downturn, endowments should give
heightened attention to the composition of their investment committees and to the skills and time
priorities of members. They should also reassess the extent to which their investment committee is
adequately staffed to do its job and whether external resources need to be tapped to ensure strong
endowment management.
Just as the fi eld of medicine continuously changes, so too does the fi eld of endowment manage-
ment. Endowment managers continue to increase their knowledge of the science and expand their
skill in the art. However, successful endowment managers will continue to focus on the areas that
they can control in order to minimize the risk of the areas they cannot.
ACKNOWLEDGEMENT
To J. Wayne Firebaugh, CPA, CFP®, CMP™, for assistance in the preparation of this chapter.
SUGGESTED READINGS
Coons, J., Cunnings, C. 204. Introduction to Investment Concepts. In Financial planning for physicians and advisors, Marcinko, D.E., ed. Sudbury, Mass: JB Publishing.
McIntire, C. 2003. Whither Self-Portfolio Management? In Financial planning for physicians and healthcare professionals, Marcinko, D.E., ed. New York: Aspen Publishers.
Craig, J.E. Jr. 2009. Rethinking the management of foundation endowments. In The Commonwealth Fund 2009 annual report. New York: The Commonwealth Fund.
Marcinko, D.E., Firebaugh, W.F. 2010. Hospital endowment fund management. Norcross, Ga: iMBA, Inc.
Press.
AQ28
CASE MODEL 1
The Initial Investment Allocation
After conducting a comprehensive fundraising program, the Hoowa Medical Center received
initial gifts of $50 million to establish an endowment. Its status as the community’s only
trauma center and neonatal intensive care unit causes it to provide substantial amounts of
unreimbursed care every year. This phenomenon, together with the declining reimbursements
and an estimated 6 percent increase in operating costs, leaves the Center with a budgeted cash
TAF-K15524-13-0301-C010.indd 250TAF-K15524-13-0301-C010.indd 250 08/05/13 7:52 PM08/05/13 7:52 PM
Page 25
251Investment Policy Statement Benchmark Construction
shortfall of $4 million for the next fi scal year. Although the new endowment’s funds are avail-
able to cover such operating shortfalls, the donors also expect their gifts to provide perpetual
support for a leading-edge medical institution.
Bill, the Center’s treasurer, has been appointed to supervise the day-to-day operations of
the endowment. One of his initial successes was convincing his investment committee to
retain a consultant who specializes in managing endowment investments. The consultant has
recommended a portfolio that is expected to generate long-term investment returns of approx-
imately 10 percent. The allocation refl ects the consultant’s belief that endowments should
generally have long-term investment horizons. This belief results in an allocation that has
a signifi cant equity bias. Achieving the anticipated long-term rate of returns would allow
the endowment to transfer suffi cient funds to the operating accounts to cover the next year’s
anticipated defi cit. However, this portfolio allocation carries risk of principal loss as well as
risk that the returns will be positive but somewhat less than anticipated. In fact, Bill’s analysis
suggests that the allocation could easily generate a return ranging from a 5 percent loss to a
25 percent gain over the following year.
Although the committee authorized Bill to hire the consultant, he knows that he will have
some diffi culty selling the allocation recommendation to his committee members. In particu-
lar, he has two polarizing committee members around whom other committee members tend
to organize into factions. John, a wealthy benefactor whose substantial inheritances allow
him to support pet causes such as the Center, believes that a more conservative allocation that
allows the endowment to preserve principal is the wisest course. Although such a portfolio
would likely generate a lower long-term return, John believes that this approach more closely
represents the donors’ goal that the endowment provide a reliable and lasting source of sup-
port to the Center. For this committee faction, Bill hopes to use mean variance optimization
to illustrate the ability of diversifi cation to minimize overall portfolio risk while simultane-
ously increasing returns. He also plans to share the results of the Monte Carlo simulation
stress testing he performed, which suggests that the alternative allocation desired by these
“conservative” members of his committee would likely cause the endowment to run out of
money within 20–25 years.
Another polarizing fi gure on Bill’s committee is Marcie, an entrepreneur who took enor-
mous risks but succeeded in taking her software company public in a transaction that netted
her millions. She and other like-minded committee members enthusiastically subscribe to
the “long-term” mantra and believe that the endowment can afford the 8 percent payout
ratio necessary to fund next year’s projected defi cit. Marcie believes that the excess of the
anticipated long-term rate of return over the next year’s operating defi cit still provides some
cushion against temporary market declines. Bill is certain that Marcie will focus on the
upside performance potential. Marcie will also argue that, in any event, additional alterna-
tive investments could be used as necessary to increase the portfolio’s long-term rate of
return. Bill has prepared a comparative analysis of payout policies to illustrate the potential
impact of portfolio fl uctuations on the sustainability of future payout levels. Bill is also
concerned that Marcie and her supporters may not fully understand some of the trade-offs
inherent in certain of the alternative investment vehicles in which they desire to increase the
allocated funds.
Key Issues
1. Given the factors described in the case study (anticipated long-term investment
return, anticipated infl ation rate, and operating defi cit), how should Bill recommend
compromise with respect to maximum sustainable payout rates?
TAF-K15524-13-0301-C010.indd 251TAF-K15524-13-0301-C010.indd 251 08/05/13 7:52 PM08/05/13 7:52 PM
Page 26
252 Financial Management Strategies for Hospitals and Healthcare Organizations
2. How should Bill incorporate the following items into his risk management strategy?
a. educating the committee regarding types of risk affecting individual invest-
ments, classes, and the entire portfolio
b. measuring risk and volatility
c. provisions for periodic portfolio rebalancing
d. using tactical asset allocation
e. developing and implementing a contingency plan
3. What additional steps should Bill take to form a group consensus regarding the
appropriate level of endowment investment risk?
4. What additional elements should Bill add to his presentation to target the concerns
of the “conservative” and “aggressive” committee members, respectively?
CHECKLIST 1: Hospital Endowment Fund Asset Allocation Yes No
Have you developed estimates of expected returns for individual asset classes? o o
Have you developed estimates of expected volatility for individual asset classes? o o
Have you developed estimates of the expected correlation co-effi ciencies among the various asset
classes?
o o
Have you used some form of simulation to develop a top-down preliminary asset allocation:
To determine whether risk could be reduced without sacrifi cing return? o o
To determine the likelihood that your allocation will yield a “successful” result? o o
Have you performed bottom-up analysis of each asset class to refi ne the preliminary allocation? o o
Does your institution have any specialized knowledge with respect to a given asset class? o o
Does your organization place any restrictions on the types of assets in which the endowment can
invest?
o o
With respect to each asset class, have you:
Considered whether the class provides opportunity for managers to add value through active
management?
o o
Considered whether the class has liquidity constraints that should limit the amount of its
allocation?
o o
Developed an understanding of the risks particular to individual security positions and the
class as a whole?
o o
Determined whether the risks particular to that class can be mitigated or quantifi ed? o o
Have you compared your proposed asset allocation to that of peer organizations and evaluated the
reasons for any material differences?
o o
Does your analysis of the allocation suggest that you will be able to meet the desired payout
levels?
o o
CHECKLIST 2: Hospital Endowment Fund Payout Policy Yes No
Does your organization require annual support from its endowment to meet operating needs? o o
If so, is that support a signifi cant portion of your operating budget? o o
Have you identifi ed a target payout rate as a starting point for your payout policy determination? o o
Have you compared the anticipated annual distributions under various payout methods given your
target allocation?
o o
Have you developed an estimate of infl ation for your institution? o o
Have you estimated an expected long-term rate of return given your asset allocation? o o
Have you estimated a long-term sustainable payout rate given your infl ation and return estimates? o o
Have you used modeling to “stress-test” the portfolio given the target payout rate? o o
TAF-K15524-13-0301-C010.indd 252TAF-K15524-13-0301-C010.indd 252 08/05/13 7:52 PM08/05/13 7:52 PM
Page 27
253Investment Policy Statement Benchmark Construction
CHECKLIST 3: Hospital Endowment Fund Investment Policy Statement (IPS) Yes No
Does your endowment have a written IPS? o o
If so, does it contain:
Written return objectives? o o
Defi nition and tolerance for risk? o o
Asset allocation guidelines? o o
Asset class rationales? o o
Provisions for periodic rebalancing? o o
Portfolio level benchmarks? o o
Asset class level benchmarks? o o
Description of payout policy? o o
Description of team member roles/responsibilities? o o
Description of any investment restrictions? o o
Provisions for voting proxies? o o
Limitations on concentrations of any particular security or investment position? o o
Do you periodically review and update your IPS? o o
If so, does the stress-testing suggest that you modify your target payout rate or smoothing
methodology?
o o
If so, does the stress-testing suggest that you modify your target asset allocation to allow for
greater long-term returns or less short-term volatility?
o o
Does your analysis suggest that you modify your payout targets to ensure that the real purchasing
value of the endowment portfolio is preserved?
o o
CASE MODEL 1
Sample Hospital Endowment Fund Investment Policy Statement
Goals and Objectives
Objective of the Policy Statement
In recognition of the inter-generational character of the fund, the Plan has as its objective
the attainment of real growth on the total asset value after current spending. The principle
purpose of the Investment Policy Statement (IPS) is to protect the portfolio from ad hoc revi-
sions of sound long-term policy. The written policy will serve to guide and direct various
investment managers in the investment of funds when short-term market outlooks are trou-
bling. The Board wants to detail, to the extent reasonably possible, the goals and objectives
of the investment plan, as well as the performance measurement techniques that will be used
to evaluate the service rendered by the managers. Realizing that our overall objective is best
accomplished by using a variety of management styles, we will adjust our asset tolerances
and permissible volatility to incorporate specifi c manager styles. The Board hopes that the net
result of the process used to develop investment policy and formalize that policy into a written
statement will increase the likelihood that the Plan can meet the inter-generational needs of
the sponsoring organization.
Performance Objectives and Goals
The Plan’s target performance, on an annualized basis net of fees, will be expected to:
TAF-K15524-13-0301-C010.indd 253TAF-K15524-13-0301-C010.indd 253 08/05/13 7:52 PM08/05/13 7:52 PM
Page 28
254 Financial Management Strategies for Hospitals and Healthcare Organizations
• Equal or exceed the spending rate plus infl ation over the market cycle
• Equal or exceed the average return of the appropriate capital market index weighted
by the asset allocation target percentages
Interim fl uctuations in the value of the fund will be viewed in perspective because the
Plan is considered to have a long-term horizon. However, within an individual asset class,
the fund’s short-term performance and volatility should not be materially worse than those of
the appropriate benchmark for that class.
Investment Philosophy
The Plan will allocate its investments in accordance with the belief that it has a long-
term investment horizon. We believe that long-term investment success requires disci-
pline and consistency of approach. The Plan will be managed on a total return basis,
recognizing the importance of capital preservation while remaining cognizant that real
returns require the assumption of some level of investment risk. The Plan shall seek
appropriate compensation for the risks that must inevitably be assumed while using
prudent investment practices to mitigate or eliminate those risks that can be diversi-
fied without sacrificing return. The basic tenets of the Plan’s management include the
following:
• The portfolio as a whole is more important that any individual asset class or
investment.
• At any given level of risk, there is an optimal combination of asset classes that will
maximize returns.
• Equities and similar investments generally offer higher long-term returns than fi xed
income investments while also generally having higher short-term volatility.
• Overall portfolio risk can be decreased by combining asset classes with low correla-
tions of market behavior.
Investment Policies and Procedures
Investment Program Policy
The investment program is intended to result in a policy that allows the greatest probability
that the goals set forth in the Objective of the Policy Statement can be met. This process
includes the following broad actions:
• Projecting the organization’s spending needs
• Maintaining suffi cient liquidity for near-term spending commitments
• Assessing expected market returns and risks for the individual asset classes
The policy recognizes that diversifi cation among and across asset classes can result in
lower portfolio risk while simultaneously providing higher portfolio returns. Modeling
and simulation are used to identify the asset classes the Plan will use as well as the approx-
imate percentage of the Plan that each class will represent. It is recognized that fl uctuation
in market values will occur or that tactical movements can be made to recognize tempo-
rary market ineffi ciencies. As such, the asset allocation provides ranges around each asset
class target. It is generally anticipated that the investment program that gives rise to the
asset allocation will be periodically repeated and that asset class target ranges will be
modifi ed or affi rmed.
TAF-K15524-13-0301-C010.indd 254TAF-K15524-13-0301-C010.indd 254 08/05/13 7:52 PM08/05/13 7:52 PM
Page 29
255Investment Policy Statement Benchmark Construction
Asset Allocation Targets and Ranges
As a result of the above investment process, the Board has adopted the following asset alloca-
tion policy with the indicated targets and ranges.
Asset Class Minimum Weight Target Weight Maximum Weight
Domestic equities xoxox% xoxox% xoxox%
Fixed income xoxox% xoxox% xoxox%
International equities xoxox% xoxox% xoxox%
Absolute return xoxox% xoxox% xoxox%
Private equity xoxox% xoxox% xoxox%
Real assets xoxox% xoxox% xoxox%
It is expected that the fund’s daily management team will utilize external managers to imple-
ment areas within individual asset classes for which those managers have the requisite exper-
tise, resources, and sustainable investment selection process. These external managers will have
discretion over matters related to security selection and timing within their area of mandate.
Spending Policy
It is the organization’s intent to distribute ___ percent annually based on the ___ payout
methodology. This intent is subject to the understanding that the spending rate plus the orga-
nization’s rate of infl ation will not normally exceed the rate of return. It is understood that
the total return basis for calculating spending as sanctioned by the Uniform Management of
Investment Funds Act (UMIFA) allows the organization to spend an amount in excess of the
current yield (interest and dividends earned), including realized and unrealized appreciation.
However, it is also understood that the inevitable volatility in the portfolio occasionally may
require payouts to be reduced to preserve the purchasing power of the fund.
Rebalancing Policy
The organization recognizes that a disciplined approach to investing is the best way to secure
consistent performance. As such, the fund should be rebalanced within target ranges on no less
than an annual basis in a manner consistent with not incurring inappropriately excessive costs.
Investment Management Policies and Procedures
Equity Securities
Both domestic and international securities are intended to provide capital appreciation and
current income to the Plan. It is generally recognized that the higher return potential of
equities entails higher market volatility and potential for loss. This asset class shall include
domestic and international common stocks or equivalents (American Depository Receipts
plus issues convertible into common stocks). The equity portfolio shall be well diversifi ed to
avoid undue exposure to any single economic sector, industry group, or individual security.
No more than 5 percent of the equity portfolio based on the market value shall be invested in
securities of any one issue or corporation at the time of purchase. No more than 10 percent of
the equity portfolio based on the market value shall be invested in any one industry at the time
of purchase. Capitalization/stocks must be of those corporations with a market capitalization
exceeding $50,000,000. Common and convertible preferred stocks should be of good quality
and traded on a major exchange, including NASDAQ, with requirements that such stocks have
adequate market liquidity relative to the size of the investment.
TAF-K15524-13-0301-C010.indd 255TAF-K15524-13-0301-C010.indd 255 08/05/13 7:52 PM08/05/13 7:52 PM
Page 30
256 Financial Management Strategies for Hospitals and Healthcare Organizations
Fixed Income Securities
Fixed income securities are intended to provide additional diversifi cation to the Plan and to
provide dependable sources of income to the Plan. It is anticipated that the Plan will include
fi xed income investments of various maturities and durations. Allowable types of such securi-
ties include marketable debt securities issued by the United States Government or an agency
of the United States Government, foreign governments, domestic corporations, mortgages and
asset-backed securities, and high yield debt. These investments should be managed actively
to take advantage of opportunities presented by such factors as interest rate fl uctuations and
changes in credit ratings. These investments are subject to the following limitations:
• No issues may be purchased with more than 30 years until maturity.
• Investments of single issuers other than direct obligations of the United States
Government or its agencies may not represent more than 5 percent of the Plan’s
assets.
• No more than 25 percent of the fi xed income securities portion of the Plan’s assets
may be allocated to below investment grade debt issues.
Cash and Equivalents
All cash and equivalent investments shall be in pooled investment vehicles, such as money
market funds, where the fund’s share price is intended to remain constant and the yield is
comparable to the then current risk-free rate of return. The Plan is also permitted to pur-
chase United States agency-guaranteed certifi cates of deposit or short-term United States
Government securities. Cash and equivalents are not generally considered to be appropriate
vehicles for purposes of investment return. As such, these investments should typically be
limited to serving as temporary placements for funds awaiting distribution to the sponsoring
organization or investment into an approved asset class.
Other Securities
• Private capital partnerships: Investments may be made into venture capital, lever-
aged buy-out, or other private equity managed pools. Such investments should only
be made through managers having the requisite experience, resources, and track
record of superior performance with the given type of private equity.
• Real estate: Investments in real estate should be in the form of professionally man-
aged, income-producing commercial or residential properties. Such investments
should be made only through pooled investment real estate funds as managed by
professionals with track records of superior long-term performance.
• Natural resources: Investments may include timber, oil, or gas interests held in the
form of professionally managed pooled limited partnership interests. Such invest-
ments should only be made through managers having the requisite experience,
resources, and track record of superior performance with the given type of natural
resource.
• Absolute return investments: Investments may include equity-oriented or market-
neutral hedge funds (i.e., long/short, event-driven, arbitrage, etc.).
• Derivatives and derivative securities: Derivatives are securities whose value
depends upon the value of some other security or index. Examples of such invest-
ments include futures, options, options on futures, interest-only or principal-only
strips, etc. Certain managers may be permitted to use derivatives. However, no
derivative positions can be utilized if such positions would cause the portfolio to
TAF-K15524-13-0301-C010.indd 256TAF-K15524-13-0301-C010.indd 256 08/05/13 7:52 PM08/05/13 7:52 PM
Page 31
257Investment Policy Statement Benchmark Construction
fall outside of portfolio guidelines. In addition, such derivative positions must be
fully collateralized. Examples of appropriate derivative strategies include hedging a
position; maintaining exposure to an asset class while making changes to the alloca-
tion, where maintaining the derivative position is more cost-effective than holding a
cash position;or changing the duration of a fi xed income position. Such investments
should only be made through managers having the requisite experience, resources,
and track record of superior performance with the given type of derivative. The man-
ager must also be able to demonstrate that such derivatives are integral to their man-
date and that the counterparty to the derivative strategy can fulfi ll their obligations.
Restrictions
The Board is authorized to waive or modify any of the restrictions in these guidelines after
thorough investigation of the manager and the rationale for the deviation.
Roles and Responsibilities
To achieve our overall goals and objectives, we want to identify the parties associated with
our accounts and the functions, responsibilities, and activities of each with respect to the
management of fund assets. Our investment managers are responsible for the day-to-day
investment management of the Plan assets, including specifi c security selection and timing of
purchases and sales. The custodian is responsible for safekeeping the securities, collections,
and disbursements and periodic accounting statements. The prompt credit of all dividends
and interest to our accounts on payment date is required. The custodian shall provide monthly
account statements and reconcile account statements with manager summary account state-
ments. The investment consultant is responsible for assisting the client in developing the
investment policy statement and for monitoring the overall performance of the Plan and the
specifi c investment managers.
Duties of the Board
The Board’s primary duties shall include, but not be limited to, the following items:
• Hiring and evaluating the members of the management team
• Approving the investment policy as prepared by the management team
• Reviewing, no less than annually, the Plan’s allocation and performance
Duties of the Management and Staff
Management and staff will be primarily responsible for the day-to-day administration of the
Plan. It is anticipated that their primary duties shall include, but not be limited to, the follow-
ing items:
• Selecting, retaining, and terminating investment managers as necessary to imple-
ment the investment policy
• Selecting, retaining, and terminating consultants as necessary to prepare the asset
allocation, hire and evaluate managers, perform topical research, and review
performance
• Developing investment policy for the Board’s review and approval
• Implementing investment policy within the target ranges set forth by the Board
• Reviewing no less than quarterly the Plan’s investment performance
• Administering the Plan’s investments in a cost-effective manner
TAF-K15524-13-0301-C010.indd 257TAF-K15524-13-0301-C010.indd 257 08/05/13 7:52 PM08/05/13 7:52 PM
Page 32
258 Financial Management Strategies for Hospitals and Healthcare Organizations
• Developing a contingency Plan for the protection of the Plan’s assets and ensuring
appropriate communication with the public in the face of a catastrophic event
• Selecting an appropriate custodian to hold and safeguard the Plan’s securities
investments
• Maintaining suffi cient records to allow for the necessary oversight and management
of the Plan’s investments
Duties of External Investment Managers
Management and staff will be primarily responsible for the day-to-day administration of the
Plan. It is anticipated that their primary duties shall include, but not be limited to, the follow-
ing items:
• Complying with the provisions of this policy statement
• Staying within the style and risk parameters of their respective mandates
• Providing proof of liability and fi duciary insurance coverages
• Maintaining necessary risk controls
• Using best possible execution for trades made on the Plan’s behalf to ensure the most
timely, cost-effective execution
• Reconciling transaction data no less than monthly with the custodian
• Disclosing material changes in personnel, processes, investment outlook, fi nancial
condition, or other matters that could be reasonably deemed to be of interest to the
Plan
Other Considerations
Trading Guidelines
All trading in accounts shall be done through a recognized national or regional brokerage
fi rm. Additionally, it is understood that block transactions or participation in certain initial
public offerings might not be available through a primary broker. In this case, the manager
should execute those trades through the broker offering the product and service necessary
to best serve the account. It should be the responsibility of the manager to see that duplicate
trade confi rmations and duplicate monthly statements are mailed to your consultant.
Proxy Voting
The investment manager shall have the sole and exclusive right to vote any and all policies
solicited in connection with securities held by the client.
Performance Review and Evaluation
Performance results for the investment managers will be measured on a quarterly basis. Total
fund performance will be measured against a balanced index posed of commonly accepted
benchmarks weighted to match the long-term asset allocation policy of the Plan. Additionally,
the investment performances specifi c for individual portfolios will be measured against com-
monly accepted benchmarks applicable to that particular investment style and strategy. The
consultant will be responsible for complying with this section of our policy statement. The
managers shall report performance results in compliance with the standards established by
the Association for Investment Management and Research. Reports shall be generated on a
quarterly basis and delivered to the client with a copy to the consultant within four weeks of
the end of the quarter.
TAF-K15524-13-0301-C010.indd 258TAF-K15524-13-0301-C010.indd 258 08/05/13 7:52 PM08/05/13 7:52 PM
Page 33
259Investment Policy Statement Benchmark Construction
REFERENCES
1. MacEachern, M.T. 1932. Some economic problems affecting hospitals today and suggestions for their
solution. The Bulletin of the American Hospital Association. July.
2. Steinberg, C. 2003. Overview of the U.S. healthcare system. American Hospital Association.
3. American Hospital Association. Trends affecting hospitals and health systems. 2010. TrendWatch Chartbook 2010. American Hospital Association.
4. Merriam-Webster Online.
5. Brinson, G.P., Hood, R., and Beebower, G.L. 1986. Determinants of portfolio performance. Financial Analysts Journal. July/August.
6. Swensen, D.F. 2000. Pioneering portfolio management. New Haven, CT: The Free Press.
7. I know I don’t want too much of it, but what is it? Principles of Endowment Management. Commonfund.
8. Doody, D. 2007. Measuring up investment policies and practices in not-for-profi t healthcare: Investment management is an area that lends itself to quantitative analysis to produce information that can inform and guide your decision making. Healthcare Financial Management Association and Gale Group.
9. Dimensional Fund Advisors. Evaluating the maturity risk/return tradeoff. Quarterly: 1964–2006, PowerPoint.
10. The Yale Endowment, 2002.
11. Ibid.
12. Data from the National Council of Real Estate Investment Fiduciaries, calculations by author Firebaugh.
13. Ibid.
14. Clark, S.E., and Yates, T.T., Jr. 2003. How effi cient is your frontier? Commonfund Institute White Paper.
November.
15. Nawrocki, D. 2001. The problems with Monte Carlo simulation. FPA Journal. November.
16. Stein, J.C. 2004. Why are most funds open-end? Competition and the limits of arbitrage. Harvard University and NBER Working Paper No. w10259. February.
17. Sedlacek, V. 2004. Currents and commentary enter the matrix. CFQ. Commonfund.
18. Loeper, D.B. 2001. Asset allocation math, methods and mistakes. Wealthcare Capital Management White Paper. June.
19. 2001 Fact Book, Investment Company Institute.
20. Ibid.
21. 2003 Fact Book, Investment Company Institute.
22. Bajaj, V., and Creswell, J. 2007. Bear Stearns staves off collapse of 2 hedge funds. New York Times. June 21.
23. Ibbotson, R.G., and Patel, A.K. 2002. Do winners repeat with style? Summary of fi ndings. Chicago:
Ibbotson & Associates.
24. Kacperczyk, M.T., Sialm, C., and Zheng, L. 2002. On industry concentration of actively managed equity
mutual funds. University of Michigan Business School. November.
25. 2007 annual U.S. corporate pension plan best and worst investment performance report. 2007.
FutureMetrics, April 20.
26. Dimensional Fund Advisors. Basic 60/40 balanced strategy vs. company pension plans results of 192
corporate pension plans. Annual: 1988–2006, PowerPoint.
27. Sedlacek, V.O., and Clark, S.E. 2003. Why do we feel so poor? How the overspending of the ‘90s has
created a crisis in higher education. Commonfund Institute White Paper. December.
28. Milevsky, M.A. 2003. A new perspective on endowments. Research paper on Internet. March 10.
29. Orange County: An ERisk.com case study. http://www.erisk.com
30. Risk management considerations for senior managers and trustees. Commonfund.
31. For a defi nition of Value at Risk, see http://www.gloriamundi.org.
32. Schachter, B. 1997. An irreverent guide to value at risk. http://www.gloriamundi.org.
33. Rubenstein, M. 2000. Comments on the 1987 stock market crash: Eleven years later. Risks in Accumulation Products. Society of Actuaries.
34. Red Cross defends handling of September 11 donations. November 6, 2001. http://archives.cnn.com/
2001/US/11/06/rec.charity.hearing/.
35. Strom, S. 2002. Questions arise on accounting at United Way. The New York Times. November 19.
36. DeLucia, M.S. 2004. Sarbanes-Oxley and the impact on NH nonprofi t organizations. New Hampshire Bar Journal 45:2. http://www.nhbar.org/publications/archives/display-journal-issue.asp?id=13.
37. Yoder, J. 2001. Investment policy start on course stay on course. Commonfund Quarterly. Winter.
38. Ibid.
39. Sedlacek, V. 2003. Your board: Dynamic or dysfunctional? Commonfund Quarterly. Spring/Summer.
40. FI360 Conference. 2013. Global fi duciary insights. http://www.fi duciary360.com.
AQ29
AQ30
AQ31
AQ32AQ33
AQ34AQ35
AQ36
AQ37
AQ38
AQ39
AQ40AQ41AQ42
TAF-K15524-13-0301-C010.indd 259TAF-K15524-13-0301-C010.indd 259 08/05/13 7:52 PM08/05/13 7:52 PM
Page 34
Author Queries
AQ1: Please supply page number for MacEachern quote.
AQ2: Please provide source and page number for Inge quote.
AQ3: Please supply page number for Swensen quote.
AQ4: Please supply page number for Yale Endowment quote.
AQ5: Please supply page number for both Nawrocki quotes in this paragraph.
AQ6: Please confi rm placement of “IA Micro-Cap Value….”
AQ7: Please supply source and page number for Stein quote.
AQ8: Please provide page number for Loeper quote.
AQ9: Please supply page number for Ibbotson and Patel quote.
AQ10: Please supply page number for Kacperczyk et al. 2002 quote.
AQ11: Please confi rm the way the section “Stress Testing” is formatted.
AQ12: Please provide full reference for Pozen, Too Big to Save?AQ13: Beginning with the paragraph starting “In Too Big to Save?, Posen describes…” There are
a numbers that seem like they should correspond to notes, but no corresponding note was
provided. Please clarify. Number 4 is here after “with U.S. Treasuries.”
AQ14: Please provide year range for “next seven years” to avoid this statement becoming outdated.
AQ15: Please provide a complete reference the landmark study by Carmen M. Reinhart and
Kenneth S. Rogoff.
AQ16: Number 5 is here after “years or more”
AQ17: Please provide page number for quote from Rogoff.
AQ18: Number 6 is here after “just ten to fi fteen years”
AQ19: Please provide reference information for the quote by Alice Rivlin, in last paragraph under
Avoiding Mistakes, including page number of quote.
AQ20: Number 8 is here after “its knees in 2008”
AQ21: Please provide page number for Pozen quote
AQ22: Please provide references for “As Jeremy Grantham points out”
AQ23: Number 8 is here after “are inevitably to come”
AQ24: Please provide page number for Pozen quote
AQ25: Please provide page number for Reinhart and Rogoff quote
AQ26: Please provide reference information for Lawrence E. Kochard and Cathleen M. Rittereiser
(under “Internal CIO Model).
AQ27: Please provide page number for Rubenstein quote
AQ28: None of these are cited in the text of this chapter, so this section was changed to “Suggested
Readings.”
AQ29: For all journal articles, please provide page range of article.
AQ30: Ref 2: Please provide city of publisher.
AQ31: Ref 4: Please provide URL.
AQ32: Ref 7: Please provide author.
AQ33: Ref 8: Please provide city of publisher.
AQ34: Ref 9: Please provide a date for this reference. Also, is there a URL or publisher you could
provide for the reader?
AQ35: Ref 10: Please complete reference.
AQ36: Ref 19: Can you provide any further info for this reference (author, publisher, URL, etc.)?
AQ37: Ref 21: Can you provide any further info for this reference (author, publisher, URL, etc.)?
AQ38: Ref 24: Please clarify what type of reference this is and provide appropriate details.
AQ39: Ref 26: Please provide a date for this reference. Also, is there a URL or publisher you could
provide for the reader?
AQ40: Ref 28: Please provide URL
AQ41: Ref 29: Could not access http://www.erisk.com. Please provide working URL.
AQ42: Ref 30: Please provide author and URL or publisher
TAF-K15524-13-0301-C010.indd 260TAF-K15524-13-0301-C010.indd 260 08/05/13 7:52 PM08/05/13 7:52 PM


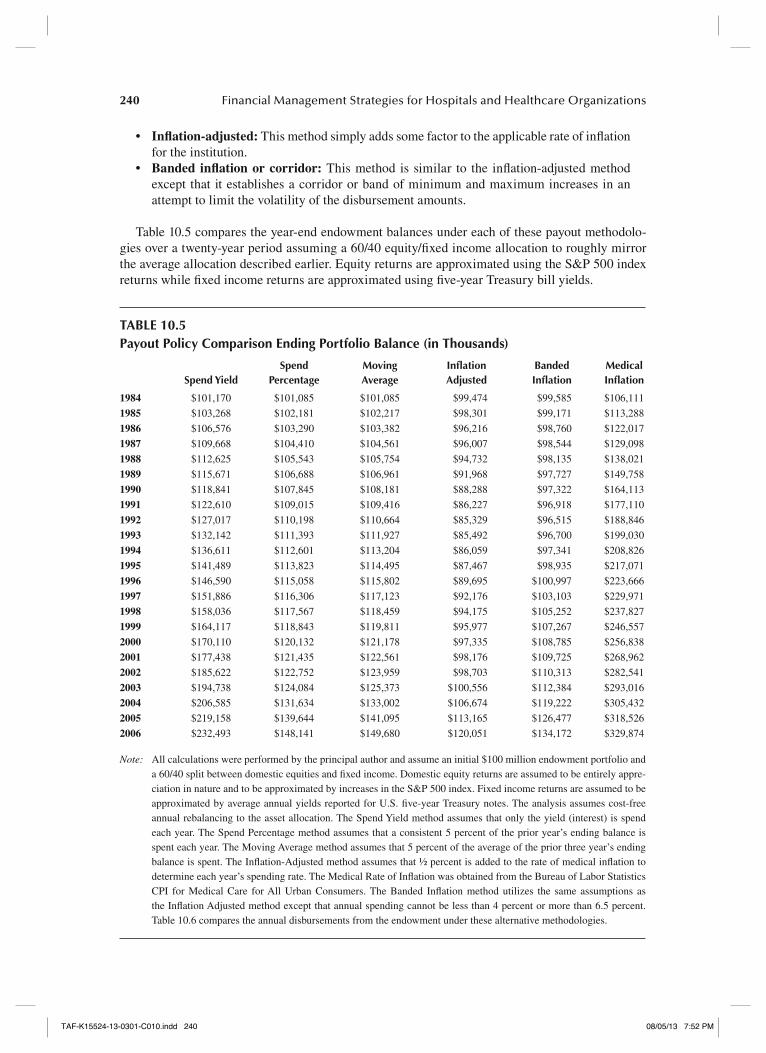
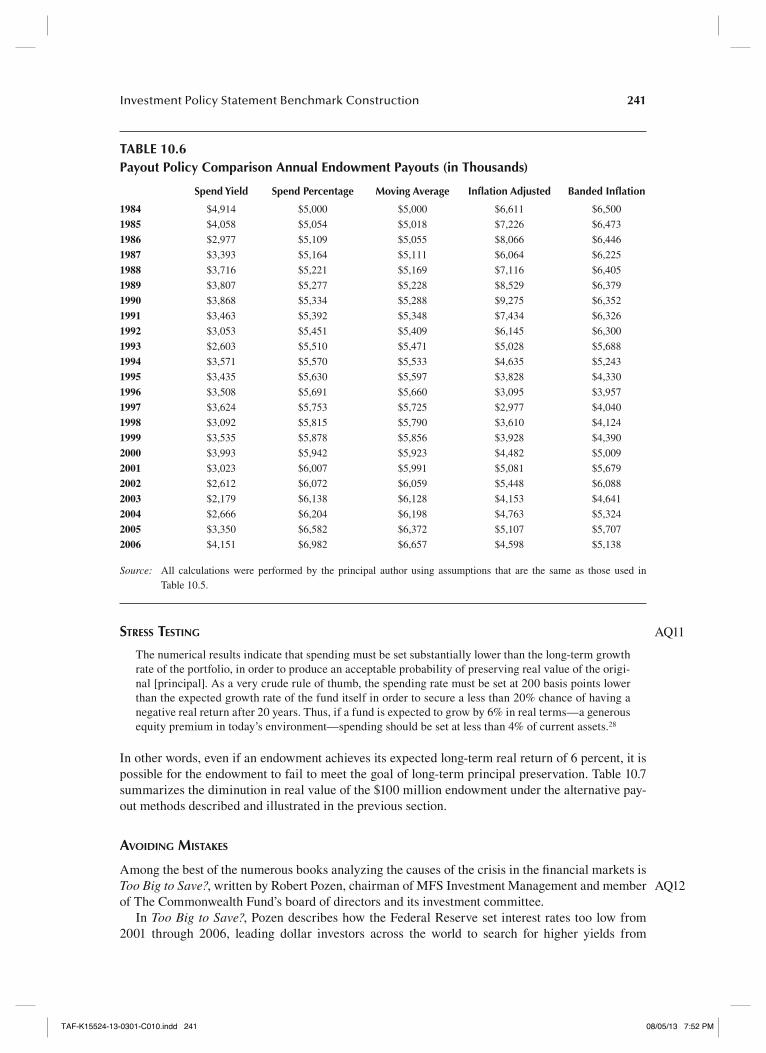


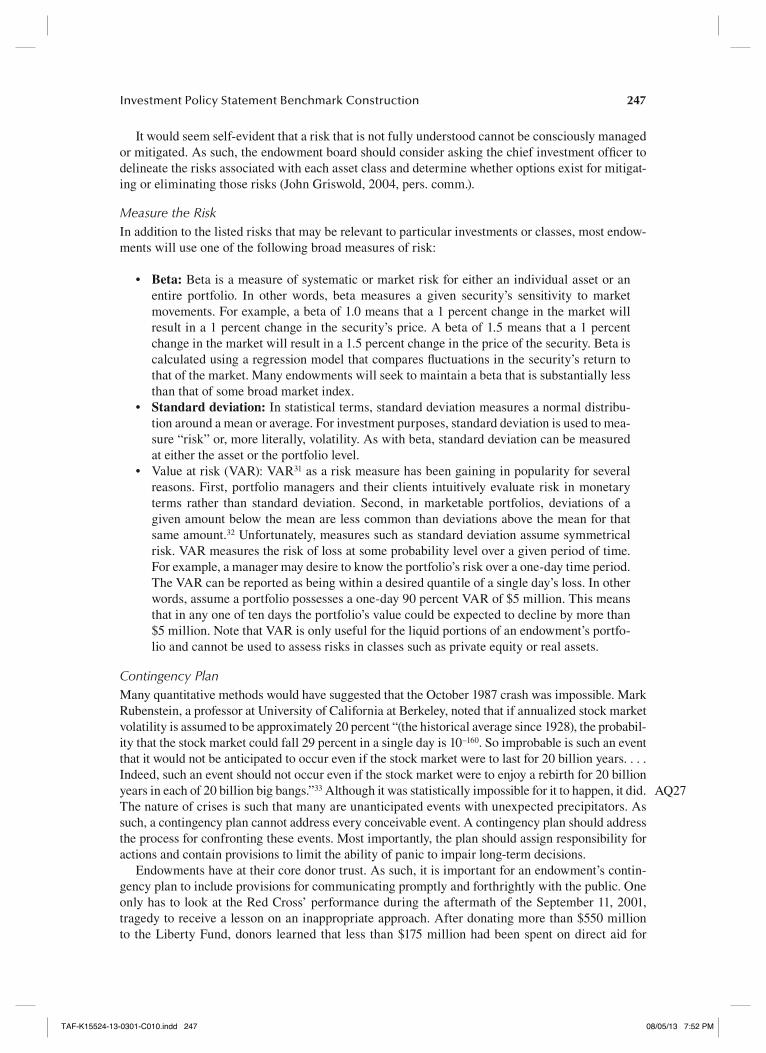


![New Bedford Whaling Museum - Home · 2019. 8. 17. · James B. Russell Charles W. Rand [disposition unknown] Daniel Jones (illegible) Jones Benjamin Gardner Edward W. Perry Edward](https://static.documents.pub/doc/80x56/5fe2917c39b9786b837a0172/new-bedford-whaling-museum-2019-8-17-james-b-russell-charles-w-rand-disposition.jpg)


