Persistent termini of 2004- and 2005-like ruptures of the Sunda megathrust Aron J. Meltzner, 1,2 Kerry Sieh, 1,2 Hong-Wei Chiang, 3 Chuan-Chou Shen, 3 Bambang W. Suwargadi, 4 Danny H. Natawidjaja, 4 Belle Philibosian, 2 and Richard W. Briggs 5 Received 22 September 2011; revised 20 February 2012; accepted 21 February 2012; published 17 April 2012. [1] To gain insight into the longevity of subduction zone segmentation, we use coral microatolls to examine an 1100-year record of large earthquakes across the boundary of the great 2004 and 2005 Sunda megathrust ruptures. Simeulue, a 100-km-long island off the west coast of northern Sumatra, Indonesia, straddles this boundary: northern Simeulue was uplifted in the 2004 earthquake, whereas southern Simeulue rose in 2005. Northern Simeulue corals reveal that predecessors of the 2004 earthquake occurred in the 10th century AD, in AD 1394 2, and in AD 1450 3. Corals from southern Simeulue indicate that none of the major uplifts inferred on northern Simeulue in the past 1100 years extended to southern Simeulue. The two largest uplifts recognized at a south-central Simeulue site—around AD 1422 and in 2005—involved little or no uplift of northern Simeulue. The distribution of uplift and strong shaking during a historical earthquake in 1861 suggests the 1861 rupture area was also restricted to south of central Simeulue, as in 2005. The strikingly different histories of the two adjacent patches demonstrate that this boundary has persisted as an impediment to rupture through at least seven earthquakes in the past 1100 years. This implies that the rupture lengths, and hence sizes, of at least some future great earthquakes and tsunamis can be forecast. These microatolls also provide insight into megathrust behavior between earthquakes, revealing sudden and substantial changes in interseismic strain accumulation rates. Citation: Meltzner, A. J., K. Sieh, H.-W. Chiang, C.-C. Shen, B. W. Suwargadi, D. H. Natawidjaja, B. Philibosian, and R. W. Briggs (2012), Persistent termini of 2004- and 2005-like ruptures of the Sunda megathrust, J. Geophys. Res., 117, B04405, doi:10.1029/2011JB008888. 1. Introduction [2] Tectonic earthquakes are caused by the rupture of faults—breaks in the Earth’s brittle shell along which plates and blocks move relative to one another. Earth’s greatest earthquakes and tsunamis are generated by its biggest faults. These megathrusts are the gently inclined upper surfaces of oceanic plates, where they dive under other plates and into the Earth’s interior. [3] It is curious that although many of these subduction megathrusts are thousands of kilometers long, individual seismic and tsunamigenic ruptures seldom extend along them for more than a few hundred kilometers. This is fortunate, because the principal factor that determines the size of an earthquake is the area of the rupture patch. For example, the ruptures that caused the giant 2004 M W 9.2 Aceh–Andaman and 2011 M W 9.0 Tōhoku earthquakes propagated 1600 km and 400 km from start to finish, respectively [Meltzner et al., 2006; Ozawa et al., 2011], whereas for a M W 7 earthquake, propagation ceases after merely a few tens of kilometers. [4] Although this relationship between rupture length and earthquake and tsunami size has long been known, we can say little about whether a particular, known initiation or ter- mination point has persisted through many earthquake cycles. Thus, we are able to say little about the size (and destructive potential) of future megathrust ruptures. Specifi- cally, if at certain locations along a fault, impediments or barriers to rupture persist over many cycles of strain accu- mulation and release, one could anticipate the largest earth- quake that a fault can produce. If, however, the origins and endpoints of ruptures do not persist through many earthquake cycles, then forecasting the maximum size of future earth- quakes will be far more difficult. 1 Earth Observatory of Singapore, Nanyang Technological University, Singapore. 2 Tectonics Observatory, California Institute of Technology, Pasadena, California, USA. 3 High-precision Mass Spectrometry and Environment Change Laboratory, Department of Geosciences, National Taiwan University, Taipei, Taiwan. 4 Research Center for Geotechnology, Indonesian Institute of Sciences, Bandung, West Java, Indonesia. 5 Geologic Hazards Science Center, U.S. Geological Survey, Denver, Colorado, USA. Copyright 2012 by the American Geophysical Union. 0148-0227/12/2011JB008888 JOURNAL OF GEOPHYSICAL RESEARCH, VOL. 117, B04405, doi:10.1029/2011JB008888, 2012 B04405 1 of 15
Transcript
Persistent termini of 2004- and 2005-like rupturesof the Sunda megathrust
Aron J. Meltzner,1,2 Kerry Sieh,1,2 Hong-Wei Chiang,3 Chuan-Chou Shen,3
Bambang W. Suwargadi,4 Danny H. Natawidjaja,4 Belle Philibosian,2
and Richard W. Briggs5
Received 22 September 2011; revised 20 February 2012; accepted 21 February 2012; published 17 April 2012.
[1] To gain insight into the longevity of subduction zone segmentation, we use coralmicroatolls to examine an 1100-year record of large earthquakes across the boundaryof the great 2004 and 2005 Sunda megathrust ruptures. Simeulue, a 100-km-long islandoff the west coast of northern Sumatra, Indonesia, straddles this boundary: northernSimeulue was uplifted in the 2004 earthquake, whereas southern Simeulue rose in 2005.Northern Simeulue corals reveal that predecessors of the 2004 earthquake occurredin the 10th century AD, in AD 1394 � 2, and in AD 1450 � 3. Corals from southernSimeulue indicate that none of the major uplifts inferred on northern Simeulue in the past1100 years extended to southern Simeulue. The two largest uplifts recognized at asouth-central Simeulue site—around AD 1422 and in 2005—involved little or no upliftof northern Simeulue. The distribution of uplift and strong shaking during a historicalearthquake in 1861 suggests the 1861 rupture area was also restricted to south of centralSimeulue, as in 2005. The strikingly different histories of the two adjacent patchesdemonstrate that this boundary has persisted as an impediment to rupture throughat least seven earthquakes in the past 1100 years. This implies that the rupture lengths,and hence sizes, of at least some future great earthquakes and tsunamis can be forecast.These microatolls also provide insight into megathrust behavior between earthquakes,revealing sudden and substantial changes in interseismic strain accumulation rates.
Citation: Meltzner, A. J., K. Sieh, H.-W. Chiang, C.-C. Shen, B. W. Suwargadi, D. H. Natawidjaja, B. Philibosian,and R. W. Briggs (2012), Persistent termini of 2004- and 2005-like ruptures of the Sunda megathrust, J. Geophys. Res.,117, B04405, doi:10.1029/2011JB008888.
1. Introduction
[2] Tectonic earthquakes are caused by the rupture offaults—breaks in the Earth’s brittle shell along which platesand blocks move relative to one another. Earth’s greatestearthquakes and tsunamis are generated by its biggest faults.These megathrusts are the gently inclined upper surfaces ofoceanic plates, where they dive under other plates and intothe Earth’s interior.[3] It is curious that although many of these subduction
megathrusts are thousands of kilometers long, individual
seismic and tsunamigenic ruptures seldom extend along themfor more than a few hundred kilometers. This is fortunate,because the principal factor that determines the size of anearthquake is the area of the rupture patch. For example, theruptures that caused the giant 2004 MW 9.2 Aceh–Andamanand 2011 MW 9.0 Tōhoku earthquakes propagated 1600 kmand 400 km from start to finish, respectively [Meltzner et al.,2006; Ozawa et al., 2011], whereas for aMW �7 earthquake,propagation ceases after merely a few tens of kilometers.[4] Although this relationship between rupture length and
earthquake and tsunami size has long been known, we cansay little about whether a particular, known initiation or ter-mination point has persisted through many earthquakecycles. Thus, we are able to say little about the size (anddestructive potential) of future megathrust ruptures. Specifi-cally, if at certain locations along a fault, impediments orbarriers to rupture persist over many cycles of strain accu-mulation and release, one could anticipate the largest earth-quake that a fault can produce. If, however, the origins andendpoints of ruptures do not persist through many earthquakecycles, then forecasting the maximum size of future earth-quakes will be far more difficult.
1Earth Observatory of Singapore, Nanyang Technological University,Singapore.
2Tectonics Observatory, California Institute of Technology, Pasadena,California, USA.
3High-precisionMass Spectrometry and Environment Change Laboratory,Department of Geosciences, National Taiwan University, Taipei, Taiwan.
4Research Center for Geotechnology, Indonesian Institute of Sciences,Bandung, West Java, Indonesia.
5Geologic Hazards Science Center, U.S. Geological Survey, Denver,Colorado, USA.
Copyright 2012 by the American Geophysical Union.0148-0227/12/2011JB008888
JOURNAL OF GEOPHYSICAL RESEARCH, VOL. 117, B04405, doi:10.1029/2011JB008888, 2012
[5] Most seismic hazard calculations assume rupturesrepeat in some fashion [e.g., Headquarters for EarthquakeResearch Promotion, 2006; Field et al., 2008]. The begin-ning and end of model ruptures are commonly assumed tooccur at structural or other irregularities or discontinuitiesalong a fault. These assumptions are not without some basisin both observation and theory. For example, modernobservations show that ruptures along strike-slip faults arecommonly restricted by geometrical irregularities. Rupturesterminate if the fault trace is broken by a step over of 4 km ormore [Wesnousky, 2006].[6] Along subduction megathrusts, recognition of barriers
to rupture has been severely limited by the fault inaccessi-bility and the paucity of long paleoseismic records that spanmultiple earthquake cycles. Still, some barriers to rupture inone sequence are known to have broken through in another,whereas others have arrested rupture repeatedly[Natawidjaja et al., 2006; Konca et al., 2008; Sieh et al.,2008; Lay, 2011].[7] In some cases, most notably in Sumatra in 2004 and in
Japan in 2011, ruptures sweep across hundreds of kilometersof megathrust that had experienced only far smaller rupturesin modern times. Modern history and instrumental seismol-ogy suggested that these two deadly reaches were segmentedinto far smaller rupture patches by closely spaced rupturebarriers. Had we recognized earlier that those modernboundaries were not permanent barriers, we might haveanticipated the potential for the 2004 and 2011 earthquakes.[8] One exceptional opportunity to gain insight into the
longevity of barriers exists on Simeulue island, which strad-dles the boundary between the MW 9.2 and MW 8.6 Sundamegathrust ruptures of 26 December 2004 and 28 March2005. Geodetic and coral uplift data constrain the extent of thetwo ruptures well, and corals provide an 1100-year earthquakehistory across this boundary (Figure 1).[9] Megathrust slip in 2004 died off abruptly southeast-
ward under Simeulue [Subarya et al., 2006], from values of10–15 m [Chlieh et al., 2007], even though the adjacentsection of the fault to the southeast had not slipped for acentury and a half and had accumulated the potential formany meters of slip. Three months later, that southeasternsection did fail, but the rupture was separated from the 2004rupture by a narrow region of low cumulative slip [Briggset al., 2006]. This provoked an important question: has thissection also been a barrier to rupture in the past?[10] To determine a long rupture history, we extracted
records of relative sea level change from coral microatolls onfringing reefs directly above the termini of the 2004 and2005 ruptures, following the methods described by Meltzneret al. [2010]. Coral microatolls grow at the base of theintertidal zone, and their upper surfaces record a history oflocal sea level [Scoffin and Stoddart, 1978; Taylor et al.,1987; Zachariasen et al., 2000; Meltzner et al., 2010].Microatoll shapes form because subaerial exposure at timesof extreme low water limits the highest level to which thecoral colonies can grow [Briggs et al., 2006; Meltzner et al.,2010]. That level is termed the highest level of survival(HLS) [Taylor et al., 1987]. Flat-topped pancake-like headsrecord sea level stability; colonies with HLS surfaces thatrise radially outward toward their perimeter reflect rising
sea level during their decades of growth. As reefs subsideor rise in the course of elastic strain accumulation andrelease, microatoll morphologies record changes in relativesea level. Because these corals’ skeletons have annualgrowth bands, rates of change in elevation, when gradual,can be calculated precisely.[11] The times of past uplift or subsidence events can be
dated using U-Th techniques, which optimally enable deter-mination of the age of a coral sample to within a few years[Shen et al., 2002, 2008, 2010; Frohlich et al., 2009]. Incases where individual samples yield insufficiently preciseages, dates from multiple samples on an individual slab canbe combined, along with information about how manyannual bands separate the dated samples, to provide a moreprecise weighted mean estimate for the dates of past upliftor subsidence events. Additionally, if we are confident thattwo microatolls at a site were contemporaneous, we cancombine dates from the two slabs to obtain an even moreprecise weighted mean estimate for the dates of the events.We would be confident that two microatolls were con-temporaneous if both had long records with matchingdiedown histories (with the slabs displaying similar ele-vation changes and identical intervals between therespective diedowns) and individual U-Th dates that weresimilar and precise enough that at least some parts of theslabs must overlap. Commonly, in cases with matchingdiedown histories, we can argue that the two slabs are com-patible either with a complete overlap of the two records,or with no overlap, but not with a partial overlap; if theU-Th dates are close enough and precise enough, we canargue further that only a complete overlap is permitted bythe data, and we can correlate individual diedowns and bandson the two slabs. Examples are discussed in detail byMeltzner et al. [2010].[12] In this study, we present observations and analyses
from two sites above the northwestern limit of the 2005rupture. In an earlier paper [Meltzner et al., 2010], we pre-sented results from northern Simeulue sites above thesoutheastern end of the 2004 rupture. The stark contrast in therupture histories of the 2004 and 2005 patches leads us toconclude that the 2004–2005 rupture boundary has been apersistent barrier to rupture over at least the past 1100 years.
2. Northern Simeulue Rupture History
[13] Using coral microatolls, Meltzner et al. [2010] uncov-ered a remarkably consistent and precise 14th–15th centuryearthquake history at several northwestern Simeulue sites (redlocations in Figure 1 inset). At sites that rose more than 40 cmin 2004, earlier large uplifts occurred within 2 or 3 years of AD1394 and 1450, and a smaller uplift occurred about AD 1430(Figure 2).[14] In AD 1394, corals from sites LDL, LNG, LKP, and
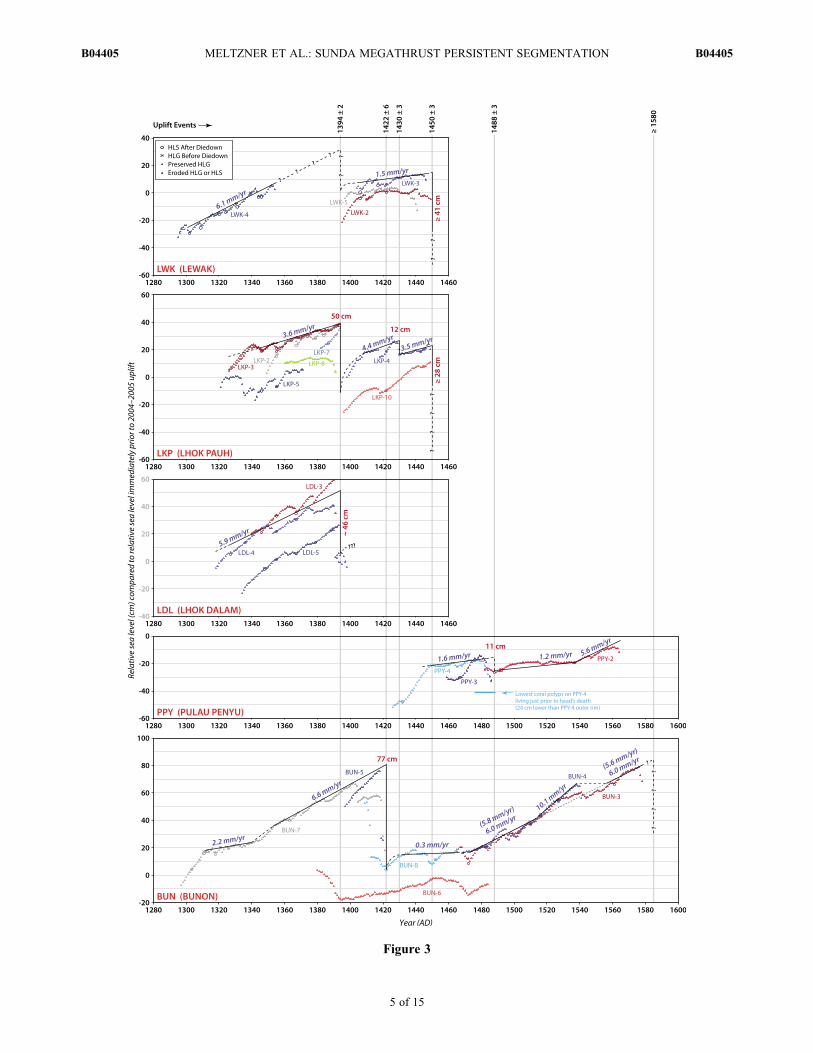
possibly LWK rose [Meltzner et al., 2010]. Uplift was halfa meter both at LKP in AD 1394 � 2 (2s uncertainty, here-after) and at LDL in AD 1393 � 3 (Figures 3 and 4). Thirty-six years later, about AD 1430, microatolls at LKP recorded a12-cm uplift. The spatial extent of this small uplift is not wellresolved, but corals to the northeast at LWK show it did notoccur there (Figure 3) [Meltzner et al., 2010].
MELTZNER ET AL.: SUNDA MEGATHRUST PERSISTENT SEGMENTATION B04405B04405
2 of 15
[15] Then, in AD 1450 � 3, all the corals on the reef flatsabove the 2004 rupture patch of northern Simeulue died sud-denly. The most straightforward explanation for this completemortality is that a large uplift raised the shallow reef flatssufficiently to expose all corals at extreme low water and killthem.Meltzner et al. [2010] argued that at LKP, the uplift musthave been at least 1.2 m to accomplish this and could havebeen 2.5 m or more. In contrast, the site rose only 1.0 m in2004. Following 1450, these reef flats remained devoid ofliving corals until the early 20th century.[16] Far less is known about earlier events. At USL, which
experienced uplift of 1.3 m in 2004, a population of micro-atolls died in AD 956 � 16 [Meltzner et al., 2010]. If thisdeath was related to uplift, then the uplift must have been at
least 38 cm, the height of the coral’s outer living perimeterprior to uplift.
3. Southern–Central Simeulue Rupture History
[17] Here we present results from two sites farther south-east on Simeulue (blue labels in the Figure 1 inset; details ofobservations and analyses appear in sections S1 and S2,Figures S1–S18, and Tables S1–S4 in the auxiliarymaterial).1 These sites were affected more by the 2005 thanthe 2004 rupture, and their long-term uplift histories differmarkedly from those just described to the north and west.
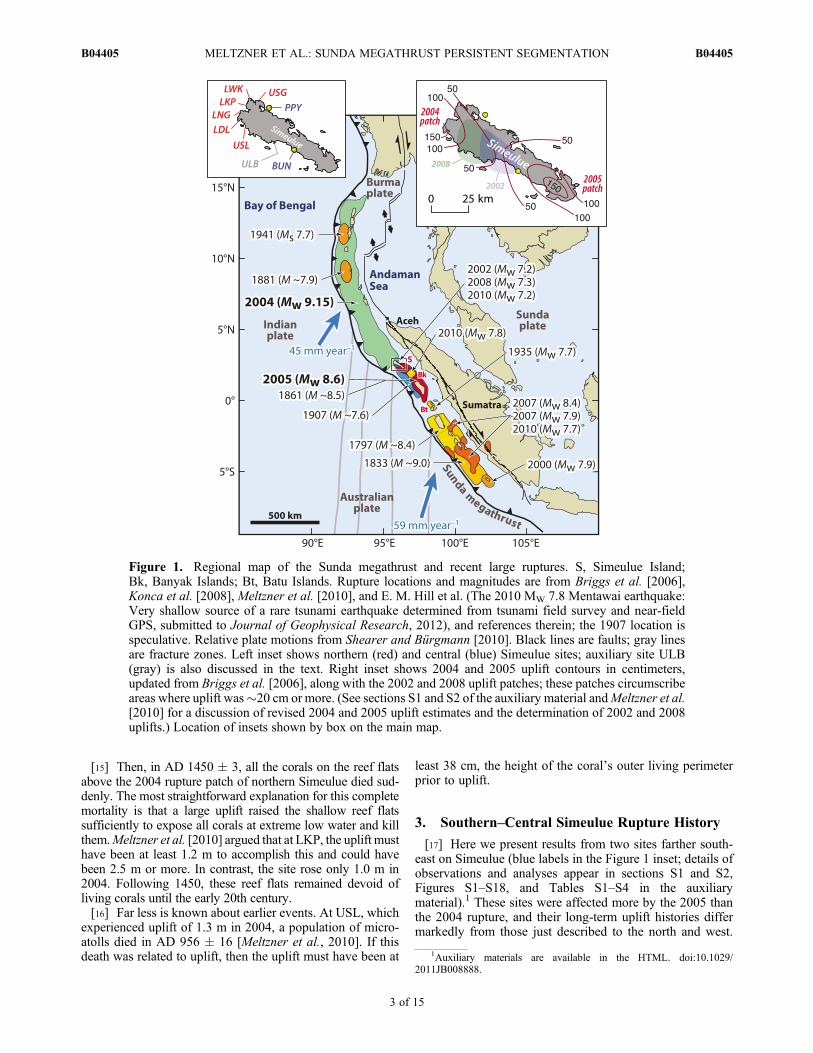
Figure 1. Regional map of the Sunda megathrust and recent large ruptures. S, Simeulue Island;Bk, Banyak Islands; Bt, Batu Islands. Rupture locations and magnitudes are from Briggs et al. [2006],Konca et al. [2008], Meltzner et al. [2010], and E. M. Hill et al. (The 2010 MW 7.8 Mentawai earthquake:Very shallow source of a rare tsunami earthquake determined from tsunami field survey and near-fieldGPS, submitted to Journal of Geophysical Research, 2012), and references therein; the 1907 location isspeculative. Relative plate motions from Shearer and Bürgmann [2010]. Black lines are faults; gray linesare fracture zones. Left inset shows northern (red) and central (blue) Simeulue sites; auxiliary site ULB(gray) is also discussed in the text. Right inset shows 2004 and 2005 uplift contours in centimeters,updated from Briggs et al. [2006], along with the 2002 and 2008 uplift patches; these patches circumscribeareas where uplift was�20 cm or more. (See sections S1 and S2 of the auxiliary material andMeltzner et al.[2010] for a discussion of revised 2004 and 2005 uplift estimates and the determination of 2002 and 2008uplifts.) Location of insets shown by box on the main map.
1Auxiliary materials are available in the HTML. doi:10.1029/2011JB008888.
MELTZNER ET AL.: SUNDA MEGATHRUST PERSISTENT SEGMENTATION B04405B04405
3 of 15
This contrast provides tight constraints on the boundaries ofpast ruptures.
3.1. The Bunon (BUN) Site
[18] The Bunon site sits on a broad promontory along thesouthwest coast of Simeulue, �10 km south of the center ofthe island, near Bunon village (BUN, Figure 1). The Bunonsite consists of two subsites: primary site BUN-A and sub-sidiary site BUN-B. Site BUN-A rose �80 cm during the2005 earthquake, while BUN-B, �1.8 km to the west-northwest, rose �65 cm; both subsites experienced littlevertical change in 2004 (Figures 1 and 2, and section S1 ofthe auxiliary material). Thus, during at least the 2004–2005sequence, Bunon acted in concert with the southern Simeuluepatch and was independent of northern Simeulue. In addition,the Bunon sites rose�20 cm during anMW 7.2 earthquake on2 November 2002 and up to 10 cm during an MW 7.3 earth-quake on 20 February 2008.[19] Both Bunon subsites have abundant modern heads (i.e.,
coral heads that were living at the time of the 2004 and 2005earthquakes), although none of the modern heads had recordsof relative sea level extending back more than �25 years. Inaddition, the BUN-A site has multiple generations of largefossil microatolls (i.e., microatolls that died long before 2004,possibly in prior uplift events) from the 9th–11th and 14th–16thcenturies AD. A total of three modern and seven fossil coralmicroatolls were sampled from the BUN sites; all but onemodern head originated from site BUN-A (Table S1 of theauxiliary material).[20] The sampled microatolls provide three discrete histo-
ries of relative sea level at BUN-A, spanning the mid-9th toearly 11th centuries AD, the early 14th to late 16th centuries,and AD 1982 to 2005. The mid-9th to early 11th century
record is one of remarkably steady relative sea level, with nosudden uplift or subsidence apparent during the 170-yearperiod preceding the BUN-9 microatoll’s death. The death ofBUN-9 around AD 1024 hints at a moderate or large uplift atthat time, although the solitary microatoll conceivably couldhave died from another cause. The BUN-A record picks upagain three centuries later around AD 1311 as the subjacentmegathrust was slowly accumulating strain, with a submer-gence rate of 2.2 mm/yr (Figures 3 and 4). Submergenceaccelerated around 1340 and remained at 6.6 mm/yr until thesite suddenly rose 66–77 cm around AD 1422. This largeuplift may have been followed by �10 cm of postseismicsubsidence. Bunon was then nearly stable from �1433 to�1466. Submergence began again in the 1470s. The sitecontinued to submerge at an average rate of 6.0 mm/yr from�1481 until at least 1576, although it may have been as fastas 10–11 mm/yr from �1516 to �1538. Shortly after 1576,the remaining microatolls at the site died, probably due tocoseismic uplift. The modern record reveals an interseismictectonic subsidence rate of 5.3 mm/yr from 1986 to 1995,followed by the uplifts in 2002, 2005, and 2008.[21] Because the BUN-A record spans the 14th–15th
century, we can assess any changes there during the largenorthern Simeulue uplifts of that period. Microatolls showthat Bunon subsided steadily from �1350 until �1420 andno diedown larger than �5 cm occurred in AD 1394(Figure 3 and section S1 of the auxiliary material). Similarly,Bunon experienced no uplifts larger than �10 cm between�1425 and �1465, although a diedown of �10 cm around1450 may correspond to the 1450 uplift of northern Simeu-lue. Even allowing for all dating uncertainties, the corals atBunon constrain maximum uplift there in 1394 and 1450 to�5 cm and �10 cm, respectively, thus showing that theseevents did not propagate southeastward beneath Bunon(Figure 2).[22] The small, 12-cm �AD 1430 uplift at LKP may,
however, be coeval with the 66–77 cm �AD 1422 uplift atBUN-A. If these two uplifts are contemporaneous, the muchsmaller amplitude of the uplift at LKP indicates the rupturedied out northwestward. If the two uplifts are not contem-poraneous, any uplift at LKP in �1422 was substantiallyless than 12 cm. This would be even stronger evidence thatthe 1422 event did not propagate beneath northern Simeulue.[23] The much older flat-topped BUN-9 microatoll exhi-
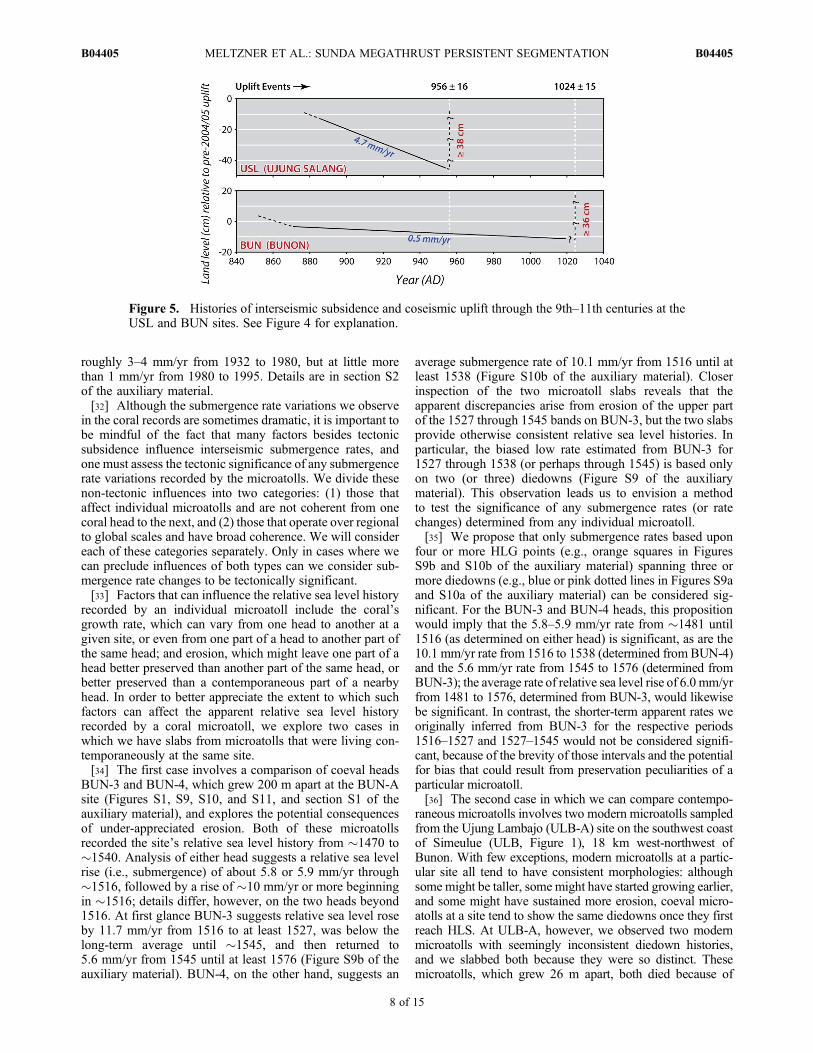
bits a continuous history of relative sea level stability fromaround AD 875 (or even 850) until AD 1020 (Figure 5). Thisrecord precludes extension of the northern Simeulue ruptureof �AD 956 as far southeast as Bunon. Although the head’sultimate death some time after 1020 hints at a moderate orlarge uplift at that time, perhaps similar to the uplifts of�1422 and 2005, the head yielded no evidence for anyearlier large uplift or subsidence events over the course of its170-year history. Thus it appears that the 956 event—likethe northern Simeulue uplifts in 1394, 1450, and 2004—didnot extend beneath Bunon.
3.2. The Pulau Penyu (PPY) Site
[24] We now turn to the other site that limits southeasternpropagation of ruptures from northern Simeulue. Pulau Penyuis a tiny islet 3 km off the northern northeast coast of Simeulue(PPY, Figure 1). Although Pulau Penyu is closer to thenorthern Simeulue locus of uplift, which was associated with
Figure 2. Maps showing locations of uplift in 1394, 1422–1430, 1450, 2004, and 2005. For 2004 and 2005, only selectedsites are shown to facilitate comparison with the earlier uplifts.
MELTZNER ET AL.: SUNDA MEGATHRUST PERSISTENT SEGMENTATION B04405B04405
4 of 15
Figure 3
MELTZNER ET AL.: SUNDA MEGATHRUST PERSISTENT SEGMENTATION B04405B04405
5 of 15
the 2004 earthquake, the majority (if not all) of the uplift atPulau Penyu occurred in 2005. Uplift at Pulau Penyu totaled36–38 cm in 2004–2005; no more than 14 cm of this occurredin 2004. Thus, like Bunon, Pulau Penyumostly acted as part ofthe southern Simeulue patch for the 2004–2005 sequence andwas largely independent of the 2004 patch. In addition, PulauPenyu rose �10 cm and �11 cm, respectively, during themoderate earthquakes of 2002 and 2008.[25] The Pulau Penyu site, PPY-A, occupies the northern
and eastern sides of this islet. There are abundant modernheads and at least two generations of fossil microatolls thatspan the 15th–16th centuries AD. A total of one modern andthree fossil coral microatolls were sampled from the PPY-Asite (Table S1 of the auxiliary material).[26] The sampled microatolls provide two discrete con-
tinuous histories of relative sea level at the PPY-A site,spanning the 15th–16th centuries and AD 1928 to 2005. ThePulau Penyu record begins around AD 1430 with the initialdiedown of the oldest sampled microatoll (Figures 3 and 4).The amplitude of this diedown is unknown and may nothave been large, but the occurrence of the diedown suggeststhe head was not too far below HLS thereafter. This initialdiedown was followed by �26 cm of submergence, whichmay have occurred either suddenly (as during an earthquake)or over as much as a decade. Slow and gradual submergencefrom the 1450s ended in a sudden uplift of 10–24 cm aroundAD 1488. This uplift may have been followed by �14 cm ofpostseismic subsidence. The site then submerged graduallybut not uniformly until at least the 1560s. In the 1560s or1570s, the population of microatolls on the shallow reefflats of PPY-A died, possibly due to coseismic uplift. Themodern record indicates the site submerged steadily at5.9 mm/yr from 1932 to 1980, but the submergence slowedto 1.7 mm/yr from 1980 through at least 1995. The sub-mergence rate deceleration might be partly due to a decreasein the rate of sea level rise in the Indian Ocean basin[Jevrejeva et al., 2006]. This was followed by coseismicuplifts in 2002, 2005, 2008, and possibly 2004.[27] The oldest microatoll sampled at PPY-A overlaps with
a large inferred uplift on the 2004 patch of northern Simeuluein AD 1450 � 3 [Meltzner et al., 2010], allowing us to com-pare the behavior of the 2004 patch with that of the PPY-A siteat the time of that earlier rupture. What are the constraints onuplift at PPY-A during the 1450 northern Simeulue earth-quake? The morphology of PPY-A microatolls alive at thetime precludes a diedown exceeding 10–15 cm (Figure 3). Anuplift in excess of 15 cm is possible only if one postulates aninordinately large amount of subsidence (considerably morethan 26 cm) following the �1430 diedown (a detailed dis-cussion appears in section S2 of the auxiliary material).[28] The small maximum limits on uplift (�15 cm) at
PPY-A in 2004 and in 1450 imply that rupture did not
propagate far eastward or southeastward past Pulau Penyuduring either event. The largest uplift documented at PPY-Areached 22–38 cm, in 2005. Although Pulau Penyu is closerto the peak uplift of the island in 2004 than to that in 2005(Figure 1), there is a much steeper gradient in uplift sepa-rating Pulau Penyu from the former than from the latter.
4. Interseismic Subsidence
[29] In addition to their demonstration of the persistence ofthe central Simeulue rupture boundary, the coral microatollssuggest that interseismic subsidence rates at individual sitesmay have been markedly non-uniform. Until very recently,Earth scientists generally believed that interseismic motionsare more or less constant, punctuated only by sudden earth-quakes and postseismic deformation that follows the earth-quakes and decays predictably with time. Over the pastdecade, however, new technologies and monitoring invest-ments have resulted in the discovery and exploration of diurnalto monthly slow slip events in Japan, Cascadia, and elsewhere[Beroza and Ide, 2009; Gomberg et al., 2010]. These recentdiscoveries underscore our incomplete understanding of plate-boundary processes. Still, many recent studies assume thatgeodetic deformation rates determined over one or severaldecades approximate or represent deformation rates through-out the interseismic cycle [e.g., Bock et al., 2003; Subaryaet al., 2006; Chlieh et al., 2008; Sieh et al., 2008].[30] Our data show that submergence rates are not stationary
over decades to centuries. The submergence rates at Bunon,Pulau Penyu, and some northern Simeulue sites have variedconsiderably through individual seismic cycles and from oneseismic cycle to the next. BUN-A, for example, submerged ata remarkably steady rate of 0.5 mm/yr between about AD 875and 1020 or later (Figure 5 and Figure S12 of the auxiliarymaterial). By contrast, the site submerged at 2.2 mm/yr from1311 to 1340, at 6.6 mm/yr from 1353 to 1422, at merely0.3 mm/yr from 1433 to 1466, and at an average rate of6.0 mm/yr between 1481 and 1576, with an exceptionally fastinterlude (at 10–11 mm/yr) between 1516 and 1538 (Figures 3and 4). Details are in section S1 of the auxiliary material.[31] Pulau Penyu also experienced substantial changes in
submergence rates. From shortly prior to 1500 until �1537,PPY-A submerged at 1.2 mm/yr or less, but then suddenlybegan submerging at 5.6 mm/yr until at least 1560 (Figures 3and 4). The modern microatoll at PPY-A records submer-gence of 5.9 mm/yr from 1932 to 1980, followed by slowersubmergence of 1.7 mm/yr from 1980 through at least 1995.Even considering the temporally variable rates of sea levelrise in the Indian Ocean over the 20th century estimatedby Jevrejeva et al. [2006], a change in the subsidence ratesis apparent: the submergence rates determined from thePPY-A microatoll imply PPY-A subsided tectonically at
Figure 3. The 14th–16th century relative sea level history at northern Simeulue sites LWK, LKP, and LDL [Meltzner et al.,2010], and southern Simeulue sites PPY and BUN. This figure reflects Scenario 1 at BUN (Figure S11a of the auxiliarymaterial) and Scenario A at PPY (Figure S18a of the auxiliary material); for a discussion of slightly different scenarios per-mitted by the data, see sections S1 and S2 of the auxiliary material. Data constrain solid parts of the curves well; dashed por-tions are inferred, and queried portions are conjectural. Dotted line at BUN indicates the AD 1481–1576 average. Diedowns(in centimeters) are red. Submergence rates (in millimeters per year, defined in a relative sense as the rate at which the coraldescends below the surface of the water) are blue. Vertical gray lines mark dates of uplifts. The zero elevation datum at eachsite is the HLG just prior to the 2004–2005 uplift; 14th-century elevations at LDL are not known relative to 2004 elevationsbecause none of the 14th-century heads there were in place.
MELTZNER ET AL.: SUNDA MEGATHRUST PERSISTENT SEGMENTATION B04405B04405
6 of 15
Figure 4. Histories of interseismic subsidence and coseismic uplift through the 14th–16th centuries at theLWK, LKP, LDL, PPY, and BUN sites. The rates and elevations shown have been inverted from thecorresponding relative sea level histories (Figure 3), and the time series has been shifted vertically to accountfor eustatic sea level rise since the 20th century, following the methodology of Meltzner et al. [2010]. Dataconstrain solid parts of the curves well; dashed portions are inferred, and queried portions are conjectural.Uplift amounts (in centimeters) are red. Interseismic subsidence rates (in millimeters per year, defined in anabsolute sense as the geodetic rate at which the land moves downward) are blue. Vertical dotted white linesmark dates of uplifts. The zero elevation datum at each site is the site’s elevation immediately prior to the2004–2005 uplift; 14th-century elevations at LDL are not known relative to 2004 elevations because noneof the 14th-century heads at the site were in place.
MELTZNER ET AL.: SUNDA MEGATHRUST PERSISTENT SEGMENTATION B04405B04405
7 of 15
roughly 3–4 mm/yr from 1932 to 1980, but at little morethan 1 mm/yr from 1980 to 1995. Details are in section S2of the auxiliary material.[32] Although the submergence rate variations we observe
in the coral records are sometimes dramatic, it is important tobe mindful of the fact that many factors besides tectonicsubsidence influence interseismic submergence rates, andone must assess the tectonic significance of any submergencerate variations recorded by the microatolls. We divide thesenon-tectonic influences into two categories: (1) those thataffect individual microatolls and are not coherent from onecoral head to the next, and (2) those that operate over regionalto global scales and have broad coherence. We will considereach of these categories separately. Only in cases where wecan preclude influences of both types can we consider sub-mergence rate changes to be tectonically significant.[33] Factors that can influence the relative sea level history
recorded by an individual microatoll include the coral’sgrowth rate, which can vary from one head to another at agiven site, or even from one part of a head to another part ofthe same head; and erosion, which might leave one part of ahead better preserved than another part of the same head, orbetter preserved than a contemporaneous part of a nearbyhead. In order to better appreciate the extent to which suchfactors can affect the apparent relative sea level historyrecorded by a coral microatoll, we explore two cases inwhich we have slabs from microatolls that were living con-temporaneously at the same site.[34] The first case involves a comparison of coeval heads
BUN-3 and BUN-4, which grew 200 m apart at the BUN-Asite (Figures S1, S9, S10, and S11, and section S1 of theauxiliary material), and explores the potential consequencesof under-appreciated erosion. Both of these microatollsrecorded the site’s relative sea level history from �1470 to�1540. Analysis of either head suggests a relative sea levelrise (i.e., submergence) of about 5.8 or 5.9 mm/yr through�1516, followed by a rise of �10 mm/yr or more beginningin �1516; details differ, however, on the two heads beyond1516. At first glance BUN-3 suggests relative sea level roseby 11.7 mm/yr from 1516 to at least 1527, was below thelong-term average until �1545, and then returned to5.6 mm/yr from 1545 until at least 1576 (Figure S9b of theauxiliary material). BUN-4, on the other hand, suggests an
average submergence rate of 10.1 mm/yr from 1516 until atleast 1538 (Figure S10b of the auxiliary material). Closerinspection of the two microatoll slabs reveals that theapparent discrepancies arise from erosion of the upper partof the 1527 through 1545 bands on BUN-3, but the two slabsprovide otherwise consistent relative sea level histories. Inparticular, the biased low rate estimated from BUN-3 for1527 through 1538 (or perhaps through 1545) is based onlyon two (or three) diedowns (Figure S9 of the auxiliarymaterial). This observation leads us to envision a methodto test the significance of any submergence rates (or ratechanges) determined from any individual microatoll.[35] We propose that only submergence rates based upon
four or more HLG points (e.g., orange squares in FiguresS9b and S10b of the auxiliary material) spanning three ormore diedowns (e.g., blue or pink dotted lines in Figures S9aand S10a of the auxiliary material) can be considered sig-nificant. For the BUN-3 and BUN-4 heads, this propositionwould imply that the 5.8–5.9 mm/yr rate from �1481 until1516 (as determined on either head) is significant, as are the10.1 mm/yr rate from 1516 to 1538 (determined from BUN-4)and the 5.6 mm/yr rate from 1545 to 1576 (determined fromBUN-3); the average rate of relative sea level rise of 6.0 mm/yrfrom 1481 to 1576, determined from BUN-3, would likewisebe significant. In contrast, the shorter-term apparent rates weoriginally inferred from BUN-3 for the respective periods1516–1527 and 1527–1545 would not be considered signifi-cant, because of the brevity of those intervals and the potentialfor bias that could result from preservation peculiarities of aparticular microatoll.[36] The second case in which we can compare contempo-
raneous microatolls involves two modern microatolls sampledfrom the Ujung Lambajo (ULB-A) site on the southwest coastof Simeulue (ULB, Figure 1), 18 km west-northwest ofBunon. With few exceptions, modern microatolls at a partic-ular site all tend to have consistent morphologies: althoughsome might be taller, some might have started growing earlier,and some might have sustained more erosion, coeval micro-atolls at a site tend to show the same diedowns once they firstreach HLS. At ULB-A, however, we observed two modernmicroatolls with seemingly inconsistent diedown histories,and we slabbed both because they were so distinct. Thesemicroatolls, which grew 26 m apart, both died because of
Figure 5. Histories of interseismic subsidence and coseismic uplift through the 9th–11th centuries at theUSL and BUN sites. See Figure 4 for explanation.
MELTZNER ET AL.: SUNDA MEGATHRUST PERSISTENT SEGMENTATION B04405B04405
8 of 15
uplift in the 2004 earthquake, and both recorded relative sealevel history at the site from 1982 or earlier through 2004. Forwhatever reason, ULB-1 (Figure S19 of the auxiliary material)grew upward faster than ULB-2 (Figure S20 of the auxiliarymaterial), and as a result of the faster growth rate, ULB-1experienced minor diedowns in late 1994 and late 1995 notseen on ULB-2, and ULB-1 experienced a substantially largerdiedown than ULB-2 in late 1997.[37] Indeed, out of 26 sites near Simeulue or Nias where
we slabbed microatolls, and among many additional sites wehave surveyed but not sampled, the pair of slabbed corals atULB-A stands out as an extreme example of morphologi-cally dissimilar coeval modern microatolls at a single site.Hence, we argue that it is appropriate and justifiable to usethe ULB-A pair to illustrate a worst-case scenario for irreg-ularities that might bias a single coral head’s relative sealevel history. Analyses of the microatolls individually yieldsubmergence rates of 10.9 mm/yr over 1982–1997 fromULB-1 (Figure S19b of the auxiliary material) and 6.0 mm/yrover 1971–1997 from ULB-2 (Figure S20b of the auxiliarymaterial), whereas analyzing the data from both headsjointly suggests submergence at 9.4 mm/yr over 1971–1997(Figure S21 of the auxiliary material). Although, by themethodology proposed earlier, all three submergence ratesare potentially significant, the lack of congruence of the threeestimates raises the issue of uncertainties or errors in theestimated submergence rates.[38] We can use the BUN-3 and BUN-4 pair, and the
ULB-1 and ULB-2 pair, to estimate reasonable (albeit con-servative) errors for the various submergence rates. Com-paring the relative sea level time series recorded by BUN-3and BUN-4, we note that the maximum differential erosionbetween the heads is 7 cm (Figure 3). Similarly, the maxi-mum difference in any year’s HLG on ULB-1 and ULB-2 is8 cm (Figure S21 of the auxiliary material). As argued ear-lier, we will consider the worst-case scenario to be an 8-cmerror in the apparent elevation gain recorded by a microatollslab due to differential erosion of one part of the headcompared to another part, or due to deficient upward growth.A simple calculation reveals that, for a rate averaged over16 years, the associated error is 5 mm/yr, whereas for a rateaveraged over 40 years, the error drops to 2 mm/yr.Assigning errors in this manner, we obtain submergence ratesof 10.9 � 5.3 mm/yr over 1982–1997 from ULB-1, 6.0 �3.1 mm/yr over 1971–1997 fromULB-2, and 9.4� 3.1 mm/yrover 1971–1997 from the joint analysis. With these errors, therates are indistinguishable, and the differences in the rates arenot significant. Although microatolls with substantially moreerosion can easily be found on any reef, there comes a limitbeyond which it is difficult to recognize diedowns or con-centric rings, and we generally do not employ such heads toestimate interseismic rates.[39] Returning to the time series at BUN-A, we consider
the following submergence rates to be significant: 2.2 �2.8 mm/yr over 1311–1340 (from BUN-7); 6.6 � 1.2 mm/yrover 1353–1422 (from BUN-7); 0.3 � 2.4 mm/yr over1433–1466 (from BUN-8); 5.8� 2.3 mm/yr over 1481–1516(from BUN-3); 10.1 � 3.6 mm/yr over 1516–1538 (fromBUN-4); 5.6 � 2.6 mm/yr over 1545–1576 (from BUN-3).Accordingly, the difference in rates before and after the 1422earthquake is significant, as are the difference in the 1311–1340 and 1353–1422 rates and the difference in the 1433–
1466 and 1481–1516 rates. The apparent rate changes in1516 and around 1540, while perhaps real, cannot be con-sidered significant based on available data.[40] Finally, we address the issue of non-tectonic influ-
ences that operate over regional to global scales and havebroad coherence. Even if a rate change recorded by amicroatoll is significant, it is not necessarily tectonicallysignificant (in other words, it does not necessarily reflect achange in underlying tectonic parameters or processes). Inparticular, changes in relative sea level at a given site dependupon changes in the eustatic sea level or regional changes insea level that arise from nonuniform ocean warming, salinityvariations, gravitational effects, and changes in ocean circu-lation; upon isostatic adjustments of the land due to loadingor unloading of the lithosphere by glaciers or glacial melt-water; and upon tectonic adjustments of the land over theearthquake cycle. We wish to isolate the third contribution torelative sea level changes at any site, but we cannot blindlyignore the other contributions. For modern microatolls—particularly for time series from recent decades—we canutilize independent records of sea level change. For fossilmicroatolls, however, no reliable sea level data exist for thisregion [Meltzner et al., 2010], which presents a challenge.For depiction purposes in Figures 4 and 5, we assume thatpre-20th century tectonic subsidence rates equal the sub-mergence rates recorded by microatolls, but this assumptionhas not been validated by independent data.[41] Fortunately, we can use coeval paleogeodetic data from
different sites on Simeulue to our advantage. Any changes ineustatic or regional sea level should have a nearly uniformeffect at sites over distances of several hundred kilometers.Nicholls and Cazenave [2010] show decadal scale variationsin sea surface height of up to � 20 mm/yr, but the largest andmost spatially variable deviations all occur in specific loca-tions, associated with major currents like the Kuroshio Cur-rent, the Gulf Stream, and the Southern Ocean; since 1992, seasurface heights in the eastern tropical Indian Ocean have beenrising more uniformly and closer to the global average. Simi-larly, isostatic adjustments in the tropics should be roughlyuniform over distances of several hundred kilometers, suchthat any spatial differences in isostatic responses since themid-Holocene would be negligible at sites within 200–300 km of one another [Mitrovica and Milne, 2002]. BecauseSimeulue is only �100 km long, any eustatic or isostaticchanges should be seen synchronously at all sites on Simeulue.Any significant change seen on one part of Simeulue butprecluded by coeval corals on another part of the island isconsidered to be tectonically significant.[42] As it turns out, corals at Lewak on northern Simeulue
record interseismic rate changes that are similar in amplitudeto, but uncorrelated with, the variations at Bunon. Between1308 and 1352, a period of slow submergence at Bunon,microatoll LWK-4 at Lewak recorded steady, rapid submer-gence of 6.1� 1.8 mm/yr. A century later, coeval LWK-2 andLWK-3 suggest rates of 1.4� 2.4 mm/yr over 1408–1441 and1.5 � 3.5 mm/yr over 1411–1434, respectively. Each of theserates is significant, and the difference between the LWK-4 rateand the LWK-2 rate represents a significant change at the site.Furthermore, this 15th century record overlaps with both rapidand slow submergence at Bunon (Figures 3 and 4), indicatingthe changes at the two sites are asynchronous and
MELTZNER ET AL.: SUNDA MEGATHRUST PERSISTENT SEGMENTATION B04405B04405
9 of 15
uncorrelated. We therefore infer that these rate changes reflectreal changes in tectonic processes under the respective sites.[43] The modern microatoll at Lewak, LWK-1, records
submergence of 5.3 � 1.8 mm/yr on average from 1953 to1997, which would correspond to tectonic subsidence of 3.3�1.8 mm/yr if an average eustatic sea level rise of 2 mm/yr isassumed [Meltzner et al., 2010]. However, the submergencerecorded by LWK-1 was slightly faster before the 1970s thanafter. As discussed for the observations at PPY-A, this differ-ence could be largely explained by temporal variations in therate of sea level rise in the Indian Ocean, which is estimated tohave been 1–3 mm/yr faster before the 1970s than since[Jevrejeva et al., 2006]. In this case, the similarity and syn-chronicity of the changes at Lewak and Pulau Penyu (and atLhok Pauh; see Meltzner et al. [2010]) suggest these changesmay be largely or entirely due to regional changes in sea level;nonetheless, independent sea level records suggest that at leastsome of the apparent change at Pulau Penyu may be tectonic.
5. Discussion
[44] Coral microatolls above Simeulue island provide an1100-year paleoseismic and paleogeodetic history across theboundary of the great 2004 and 2005 Sunda megathrust rup-tures, and they support two important conclusions. First, thecontrasting earthquake histories across this modern boundaryare clear evidence for a persistent barrier to rupture. And sec-ond, strain accumulation during the interseismic period is notuniform over time, and not all the variations can be explainedby postseismic processes.
5.1. A Barrier to Rupture
[45] The records from Bunon provide robust evidence thatnone of the major uplifts known or inferred on northernSimeulue in the past 1100 years (�AD 956, 1394, 1450, or2004) involved significant uplift or subsidence at Bunon.Moreover, during the two northern Simeulue events for whichthere is a record at Pulau Penyu (1450 and 2004), the upliftsthere were small. Likewise, the largest uplifts at Bunon—the66–77 cm uplift around AD 1422 and the �80 cm uplift in2005—coincided with little or no vertical deformation onnorthern Simeulue. Historical intensities [Newcomb andMcCann, 1987] and corals at other sites [Meltzner et al.,2009] suggest the large megathrust earthquake of 1861 wasvery similar to that of 2005, in that it involved rupture belowNias island and southeastern Simeulue but not below north-western Simeulue. Thus central Simeulue was above a barrierto rupture from the northwest in 956, 1394, 1450, and 2004and from the southeast in 1422, 1861, and 2005. Althoughthere are gaps in the paleoseismic record, there is no evidencefor throughgoing rupture under central Simeulue at any time inthe past 1100 years.[46] Moderate (MW 7.2–7.3) megathrust ruptures in 2002
and 2008 illuminate a narrow patch of low cumulative slipbetween the 2004 and 2005 ruptures [DeShon et al., 2005;Tilmann et al., 2010], and an additional poorly locatedMW 7.2earthquake on 9May 2010may also lie along this patch. If thisnarrow section is characterized over the long term by exclu-sivelymoderate and smaller ruptures, then it would support thehypothesis that central Simeulue overlies a narrow region ofthe megathrust with fundamentally different properties thanelsewhere along strike.
[47] The Batu Islands section of the megathrust, betweenabout 0.5�S and the Equator, is another persistent barrier torupture (Figure 1) [Natawidjaja et al., 2006]. Great rupturesfrom the southeast in 1797 and 1833 and from the northwestin 1861 and 2005 did not propagate through. At Badgugu(BDG), a site in the Batu Islands, one long-lived coralrecorded small diedowns of �20, �10, and �5 cm, respec-tively, during the great earthquakes of 1797, 1833, and 1861[Natawidjaja et al., 2006]. Continuous GPS observationsnearby (at sites within 60 km, also in the Batu Islands)suggest uplift in 2005 was at most a few centimeters there[Briggs et al., 2006]. The only large uplift in the 260-yearrecord at Badgugu was�70 cm, during a moderate (MW 7.7)earthquake in 1935, wholly within the Batu Islands patch[Natawidjaja et al., 2004, 2006]. Although the Batu Islandspaleoseismic record is shorter than the Simeulue record, itdemonstrates that, like the central Simeulue patch, the BatuIslands patch has been a persistent barrier to throughgoingrupture during several large earthquakes.[48] What causes the central Simeulue and Batu Islands
patches to persistently arrest rupture? Understanding whysome barriers to megathrust rupture appear to persist whereasothers are more ephemeral has been an elusive goal. Onstrike-slip faults, both structural and rheological irregularitieshave the potential to be persistent barriers to rupture: stepovers of 4 km or more have been shown to be reliable ter-minators of coseismic rupture [Wesnousky, 2006], and thecreeping section of the San Andreas fault in California, whichslips more or less steadily at nearly the long-term rate andaccumulates little or no strain [Rolandone et al., 2008], hasbeen assumed to be incapable of sustaining large through-going ruptures. Along subduction zones, numerous relation-ships between structures and rupture segmentation have beenproposed [e.g., Kodaira et al., 2000; Cummins et al., 2002;Bilek, 2010; Loveless et al., 2010; Wang and Bilek, 2011],but identifying a consistent relationship has been challenging[Loveless et al., 2010]; perhaps this is partly because it hasbeen difficult to distinguish truly persistent barriers frommore ephemeral ones, where records are short.[49] Under Simeulue and the Batu Islands, structural or
geometrical impediments to rupture are strong possibilities.Franke et al. [2008] used multichannel reflection and wide-angle/refraction seismic data to identify a rise in the oceanicbasement that is elongated north-northeast to south-southwestoff the southwest coast of Simeulue. This apparent ridgeis masked by sedimentary cover in the trench, and neitherspreading ridges nor fracture zones are evident on high-resolution bathymetry along strike immediately south of thetrench; however, farther south, where the sedimentary coverthins, several fracture zones are imaged on gravity, magnetic[Liu et al., 1983; Cande et al., 1989], and satellite altimetry[Smith and Sandwell, 1997] data. The width (30–50 km) andrelief (� 500–2000 m) of those fracture zones are of thesame order of magnitude as the rise on the subducting plateobserved in the seismic data just south of Simeulue, and oneof those fracture zones projects almost exactly into theimaged rise [Franke et al., 2008]. Continuing farther to thenorth-northeast, this fracture zone, now deeply buriedbeneath trench sediment, would closely align with the per-sistent rupture boundary we have documented on Simeulue.[50] Franke et al. [2008] further suggest that a ramp or
tear along the eastern flank of the subducting fracture zone
MELTZNER ET AL.: SUNDA MEGATHRUST PERSISTENT SEGMENTATION B04405B04405
10 of 15
beneath Simeulue, which appears to have 3 km of relief(down to the east), might reinforce the fracture zone itself asa barrier to rupture propagation. Some of this relief acrossthe fracture zone could be a function of the juxtaposition ofcrust of significantly different ages. The general age of theoceanic crust, however, is Eocene, and, assuming symmet-rical spreading, there is an age difference of �2 Ma [Candeet al., 1989]. The resulting seafloor depth difference should,therefore, be only of the order of 100–200 m [Turcotte andSchubert, 2002; Franke et al., 2008], a difference that can-not account for the overall relief observed across the fracturezone. Alternatively, Franke et al. [2008] suggest that a faultor tear at the eastern flank of the proposed fracture zonecould explain the observed depth difference of 3 km. The N–Sto NNE–SSW striking fracture zones on the oceanic platesouthwest of Sumatra have been reactivated as left-lateralstrike-slip faults [Deplus et al., 1998], one of which ruptured inan MW 7.2 earthquake on 10 January 2012. Near the Sundatrench, these reactivated fracture zones appear to pick up asignificant normal component of slip, due to flexural bendingof the oceanic plate as it descends into the subduction zone[Graindorge et al., 2008]. Franke et al. [2008] proposed that atear in the slab could have formed along the fracture zonesouth of Simeulue in this manner.[51] Focusing on the upper plate, Simeulue also displays
structural discontinuities above the barrier. A broad anticlinein the northwestern part of the island does not connect withanticlines and synclines in the southeast [Endharto andSukido, 1994]. Furthermore, the above-sea level northwesternpart of the island is twice as wide as its southeastern counterpart,and although this exact relationship would not hold with lowersea levels, there would continue to be a pronounced trenchwardstep (from southeast to northwest) along the southwest coast ofSimeulue, even if sea level were 50 m lower. Farther northeastalong strike of the rupture barrier, however, multichannel seis-mic reflection profiles across the Simeulue forearc basin revealno rooted faults cuttingMiocene and younger sediments, exceptfor the trench-parallel West Andaman fault [Berglar et al.,2008]; this suggests that any discontinuities in the upper plateare not pervasive. Any upper-plate discontinuities may simplybe a reflection of the complexity already described along thesubjacent megathrust.[52] The Batu Islands are even more clearly associated
with structural complexity. The Investigator fracture zone,which comprises four individual parallel ridges of up to1900 m relief and �120 km total width, and which is visiblein the seafloor bathymetry, projects beneath the Batu Islands(Figure 1) and correlates with irregularities in the trend ofthe deformation front and in the geomorphology of the upperplate [Kopp et al., 2008]. This fracture zone appears toinfluence seismicity over a wide depth interval. A well-defined band of intense seismicity extending from 80 to200 km depth lies along the prolongation of the Investigatorfracture zone, all the way from the Batu Islands to Tobacaldera [Fauzi et al., 1996; Lange et al., 2010]. The agecontrast across the Investigator fracture zone is �15 Ma[Cande et al., 1989; Kopp et al., 2008], which should lead toa difference of several hundred meters or more in the depth ofthe subducting slab across the fracture zone. Sieh andNatawidjaja [2000] note that the orientations of faults in
the upper plate just west of the northward projection of theInvestigator fracture zone are predominantly north–south,parallel to the topographic and structural grain of the Inves-tigator fracture zone. They hypothesize that the topographicheterogeneity of the Investigator fracture zone has led todisruption of the forearc and outer-arc regions.[53] There are cases, however, in which a clear structural
break did not halt megathrust rupture. Notably, the 1861 and2005 earthquakes ruptured through structural complexitiesin the Banyak Islands [Briggs et al., 2006; Meltzner et al.,2009]. In the Solomon Islands in 2007, megathrust rupturetraversed the subducting Simbo ridge transform and thusbroke through a triple junction [Taylor et al., 2008].[54] As an alternative (or perhaps complement) to direct
structural or geometrical controls, along-strike variations inrheology, interseismic coupling, or fault friction might be acause of these two barriers [Kaneko et al., 2010]. Near theboundary region between the 2004 and 2005 ruptures,Tilmann et al. [2010] examined precisely located aftershocksand demonstrated that the vast majority of aftershocks in thestudy region occurred on the plate interface within a narrowband that they inferred marks the transition between theseismogenic zone and stable sliding. Although this tightband of aftershocks is roughly parallel to both the trench andthe axis of Simeulue, and though it tends to underlie the500 m bathymetric contour for most of its length, there is anabrupt and marked �25 km landward shift of the updip edgeof this band of aftershocks in the vicinity of central Simeu-lue, immediately trenchward of the Bunon site.[55] Although this gap in the aftershocks could simply be
a reflection of the coseismic slip deficit between the 2004and 2005 ruptures, it could also indicate a deeper onset ofunstable frictional conditions and a reduced width of theseismogenic zone [Tilmann et al., 2010]. The location of theaftershock gap corresponds fairly well with the eastern edgeof the ridge imaged by Franke et al. [2008], which implies itcould also overlie the tear in the slab proposed by Frankeet al. [2008], although Tilmann et al. [2010] were unable toresolve any significant shift in the depths of the aftershocksfrom one end of Simeulue to the other. Tilmann et al. [2010]suggest that the fracture zone could be a locus of enhancedfluid release into the megathrust, raising fluid pressure thereand reducing the effective normal stress, which could in turndeepen the onset of seismogenic behavior [Moore andSaffer, 2001; Scholz, 2002]. This mechanism might holdeven if the fracture zone itself is buried under sediments.Whatever the exact reason, a localized �25 km reduction inthe width of the seismogenic zone, Tilmann et al. [2010]point out, might be sufficient to act as a barrier to rupturepropagation in giant earthquakes along the megathrust.[56] Modeling of coral and GPS geodetic data over the
period 1962–2006 from around the Equator suggests theBatu Islands barrier has also been a poorly coupled segmentof the megathrust [Chlieh et al., 2008]. If that low couplingis persistent over centuries, perhaps it is due to locallyenhanced fluid release into the megathrust, as suggested byTilmann et al. [2010], or it might be due to weak rocks suchas serpentine associated with the fracture zone itself. How-ever, whether a 45-year geodetic record is sufficient todetermine the long-term coupling of a portion of a fault
MELTZNER ET AL.: SUNDA MEGATHRUST PERSISTENT SEGMENTATION B04405B04405
11 of 15
remains an open question, particularly in light of dramaticvariations in interseismic subsidence rates documented inthis study at timescales of decades to centuries. Indeed,Prawirodirdjo et al. [2010] argue that the Batu Islands sec-tion of the megathrust was more strongly coupled before2001 than from 2001 until March 2005.[57] Since the Batu Islands and central Simeulue patches
have been persistent impediments to several great earthquakeruptures, we conclude that the intervening 1861 and 2005ruptures are the longest one should expect from this reach ofthe megathrust. Earthquakes larger than those in 1861 or2005 (MW > 8.6) could occur only if the width of the rupturezone was greater (e.g., if slip extended closer to the trench),or if the displacements were larger. Paleoseismologicalidentification of other “permanent” barriers to rupture shouldalso lead to identification of the maximum size earthquakesplausible for other sections of the world’s megathrusts.Without such evidence from the geological record, it wouldseem prudent to conclude that a MW 9 rupture can occur onany sufficiently long section of a megathrust.
5.2. Interseismic Rate Switching
[58] Certain microatolls found on Simeulue appear to reflectsudden changes in submergence rates. At any given site,the submergence rate might remain fixed for decades untilswitching, over a decade or so, to a new rate; submergencemight remain fixed at this new rate for decades more. Thereare ample examples at Bunon and Lewak where significantrate changes demonstrably occur (see section 4), and even insome cases where we have not shown that a rate change issignificant, the observations are nonetheless best explainedby sudden rate changes. These observed rate variations arenot consistent with steadily decaying postseismic deforma-tion [Perfettini et al., 2005]: not only do the rates appear tobe linear (except possibly in the �5–15 years following eachuplift) and the changes abrupt (over shorter time spans thanwe can resolve), but we have examples of both slow thenfaster submergence prior to an uplift (e.g., Bunon, 1311–1422;Bunon, 1433–1580; Figure 4) and fast then slower sub-mergence prior to an uplift (e.g., Pulau Penyu, 1932–2004;Figure S14 of the auxiliary material), as well as uniformlyslow submergence for decades to centuries prior to an uplift(e.g., Bunon, 875–1024; Lewak, 1408–1450; Figures 4 and 5).[59] Furthermore, although submergence rates recorded by
microatolls reflect the combined effect of tectonic land-levelchanges, isostatic adjustments, and eustasy [Meltzner et al.,2010], the variations at Bunon can only be explained bytectonic processes. Since isostasy and eustasy operate overregional to global scales, isostatic or eustatic changesrecorded at Bunon should be recorded at all sites onSimeulue. Quite to the contrary, the notable fluctuations atBunon between 1311 and 1450 are not correlated withfluctuations in the northern Simeulue corals (Figure 4),leaving only tectonics to explain them.[60] Observations such as these are not limited to Simeu-
lue. Work in the Batu and Mentawai Islands has uncoveredsimilar variations there [Natawidjaja et al., 2004, 2006,2007; Sieh et al., 2008]. Along the Japan trench north ofthe 2011 rupture patch, primarily between Honshu andHokkaido, Nishimura et al. [2004] documented apparentchanges in coupling on annual time scales between 1995
and 2002 that cannot be explained entirely by postseismicdeformation following the 1994 Sanriku earthquake. Andabrupt changes in interseismic rates have also been observedwith GPS data in Alaska [Freymueller, 2010]: in lower CookInlet, near Homer, Alaska, part of the subduction interfacethat was creeping prior to 2004 (since at least the mid-1990s)suddenly locked, and has remained locked. Freymueller[2010] suggested that the mid-1990s through 2004 involveda long slow slip event, or that the frictional behavior of theinterface at the downdip end of the locked zone is very sen-sitive to small stress changes.[61] We speculate that sudden interseismic “rate switching,”
as observed in the Sumatran corals, could be a common phe-nomenon along subduction zones. If so, any one local geodeticnetwork will likely need to be in place for many decades toobserve it. Furthermore, this phenomenon might be detectableonly at stations above the locked portion of the fault or near itsdowndip limit; in many cases, the locked portion of the fault isentirely offshore, and only the most trenchward points on landare near the downdip limit. These challenges could explainwhy rate switching has not (yet) been identified as a wide-spread occurrence.[62] Geological observations along exhumed paleo-
subduction zones can be interpreted to support our infer-ences of variations in coupling over the earthquake cycle.Bachmann et al. [2009] presented evidence from anexhumed subduction zone in the central Alps of Europe forfluids circulating along the plate interface and for transientchanges in pore pressure; they argue that these changes maygive rise to variations in coupling over the seismic cycle. Atan exhumed subduction thrust on Kodiak Island, Alaska,Rowe et al. [2011] observed mutually crosscutting faultrocks that distinctly record three general rates of slip: seis-mic slip, recorded by pseudotachylyte bearing rocks; solu-tion creep on discrete foliated cataclasites, representinginterseismic creep; and an intermediate strain rate texture innon-foliated cataclasites. This intermediate strain rate couldrepresent anything from afterslip to slow slip events, to adelocalization of the shear surface during or immediatelyafter seismic slip.[63] The changes in interseismic behavior at various sites
on the Sumatran outer arc islands might arise from smallheterogeneities in the frictional properties along the fault,from decadal-scale variations in fluid flow conditions alongthe fault, or from long-duration slow-slip events. The periodsof faster interseismic subsidence imply increased couplingunder the site and/or intervals during which the locked zoneextended farther downdip; conversely, slower subsidencesuggests decreased coupling or a narrower locked zone.Alternatively, as Freymueller [2010] suggested, the abruptchanges in “interseismic” rates might actually reflect theinitiation or termination of slow slip events. Meade andLoveless [2009] use scaling arguments to suggest that theslip velocity of large slow events may be near the plateconvergence rate, making them indistinguishable fromapparent partial coupling. Elastic dislocation models ofgeodetic measurements above subduction zones have led tothe identification of MW ≈ 6.0–7.2 slow slip events thatrelease elastic strain over periods of days to months, but great(MW ≥ 8) slow slip events have remained unidentified.
MELTZNER ET AL.: SUNDA MEGATHRUST PERSISTENT SEGMENTATION B04405B04405
12 of 15
Meade and Loveless [2009] showed that slip velocity in slowslip events decreases with event magnitude; they predict that,ifMW ≥ 8 slow slip events exist, the slip velocities should be≤50 mm/yr and their durations should be >10 years. Meadeand Loveless [2009] suggest that great slow slip events mayrelease a fraction of the accumulating strain on the plateinterface, creating the appearance of a partially coupled sub-duction zone that is actually a snapshot in the time evolution ofan ongoing MW ≥ 8 slow slip event. The largest slow slipevents could last decades to centuries. Our observations ofsubstantial multidecadal variations in the interseismic subsi-dence rate at individual sites is consistent with their hypoth-esis. It is important to point out, however, that we have notattempted to replicate the observed rate changes with physi-cal or numerical models, and doing so will be an importantnext step in understanding and explaining our observations.
5.3. A Note on the “Missing” Northern SimeulueCorals, AD 1450–1930
[64] Last, our observations at Bunon and Pulau Penyu pro-vide supporting context for a particular argument we advancedduring the course of our earlier work on northern Simeulue.Despite extensively searching much of the coast of northernSimeulue, we were unable to locate a singlemicroatoll that hadbeen alive between AD 1450 and the early 20th century any-where between the USL and USG sites (Figure 1) [Meltzneret al., 2010]. Abundant older (and younger) microatolls atmost of the sites imply that the problem is not one of preser-vation; instead, it must be that no corals grew on the reef flatsof northwestern Simeulue between 1450 and �1930. We alsodid not find fossil microatolls anywhere along the stretch ofcoast for 30 km southeast from USL, but in these locations thecomplete lack of fossil microatolls suggests preservation pro-blems could be a factor.[65] In our earlier work, we explored the question of what
might have prevented corals from colonizing and living onthe reef flats of northwestern Simeulue for nearly five cen-turies. Although we considered biological factors, we arguedthat the most plausible explanation for this absence is thatthose reef flats were sitting above the subtidal zone for mostof that period, a result of tectonic uplift [Meltzner et al.,2010]. Observations at Bunon and Pulau Penyu supportsuch a conclusion and add an intriguing detail.[66] When the microatoll records from Bunon and Pulau
Penyu are considered along with the northwestern Simeuluerecords, it becomes apparent that the region of northwesternSimeulue characterized by the 480-year absence of coralsencompasses but does not extend beyond what eventuallybecame the 2004 rupture patch. We observe that each of thesites with a 1450–1930 gap in the coral record was uplifted�25 cm or more in 2004 but had little or no change in 2005.In contrast, the Bunon and Pulau Penyu reefs, only 10–20 kmaway, which rose mostly or entirely in 2005, had abundantcorals living through at least the 1560s, and microatolls grewat several other southern Simeulue sites between the mid-18th century and 1861. Thus, on Simeulue, there is a one-to-one correspondence between the area lacking corals from1450 until�1930 and the area that was uplifted in 2004. Theperfect coincidence between these two regions argues that thetwo are interrelated, that the 480-year absence of corals isevidence that the reef flats of northern Simeulue must havebeen elevated above the subtidal zone for much of that
period, and that the spatial extent of these elevated reefs wasrestricted to the area west-northwest of the 2004–2005 rup-ture barrier.
6. Conclusions
[67] In this paper, we show that the coral microatolls ofSimeulue document a barrier to rupture that has persistedunder central Simeulue island for at least the past 1100 years,through seven major ruptures. We also show that abrupt andenduring changes in rates of tectonic subsidence are commonduring this period. Both of these discoveries have importantimplications for forecasting large Sumatran earthquakes andfor understanding subduction megathrust processes else-where on Earth.[68] In our earlier paper [Meltzner et al., 2010], we con-
cluded that microatoll sites on northwestern Simeulue thatrose in 2004 consistently record previous large uplifts aroundAD 1394 and 1450. Additionally, one northwestern Simeu-lue site records an earlier uplift about AD 956. In markedcontrast to this history, we show in this paper that microatollsites only tens of kilometers away on central and southeasternSimeulue coasts (which rose in 2005) experienced none ofthese northwestern Simeulue uplifts. Conversely (as in 2005)large uplifts of southeastern Simeulue around AD 1422 andin 1861 appear to have had little or no effect at the north-western Simeulue sites. Hence, terminations of large rupturesunder central Simeulue have occurred at least seven times inthe past 1100 years. Given the long paleoseismic records wehave obtained on either side of central Simeulue, the absenceof any throughgoing rupture shows that the megathrustbeneath central Simeulue is truly a persistent barrier to rup-ture. This barrier might owe its persistence to a north-trend-ing fracture zone in the downgoing slab and a related step ortear in the megathrust itself.[69] Simeulue island’s microatolls also record gradual sub-
mergence during long interseismic intervals, due primarily totectonic subsidence, although changes in sea level could alsocontribute. Microatolls at several sites record abrupt and sus-tained changes in interseismic submergence rates. The fact thatthese changes are in some cases not synchronous from one siteto another implies that at least some of these changes are due toa change in tectonic conditions. Changes in the degree orgeometry of plate coupling, or the onset or termination of long-duration slow-slip events, are the best candidates for causingthese changes.
[70] Acknowledgments. We thank D. Prayudi, I. Suprihanto, andJ. Galetzka for field support; M. Simons and J.-P. Avouac for helpful discus-sions; and R. Bürgmann, R. Gold, J. Freymueller, and H. Kelsey for insight-ful reviews that led to substantial improvements in the manuscript. Thiswork has been supported by NSF grant EAR-0538333 (to K.S.); by NSCgrants 98-2661-M-002-012, 99-2611-M-002-006, and 99-2628-M-002-012(to C.C.S.); by the Indonesian Institute of Sciences (LIPI) and InternationalJoint Research Program of the Indonesian Ministry of Research and Tech-nology (RUTI); by the Gordon and Betty Moore Foundation; and by theEarth Observatory of Singapore. This is Caltech Tectonics Observatory con-tribution 167 and Earth Observatory of Singapore contribution 30. An anno-tated high-resolution X-ray mosaic of each of the BUN-A coral crosssections is provided in the electronic supplement of A. Meltzner’s Ph.D. the-sis [Meltzner, 2010], along with a selection of field photos from the site. Weare forever grateful to Caltech geology librarian Jim O’Donnell for all hisassistance on this project and over the years; Jim passed away the week thispaper was accepted, and he will be sorely missed.
MELTZNER ET AL.: SUNDA MEGATHRUST PERSISTENT SEGMENTATION B04405B04405
13 of 15
ReferencesBachmann, R., O. Oncken, J. Glodny, W. Seifert, V. Georgieva, and M. Sudo(2009), Exposed plate interface in the European Alps reveals fabric stylesand gradients related to an ancient seismogenic coupling zone, J. Geophys.Res., 114, B05402, doi:10.1029/2008JB005927.
Berglar, K., C. Gaedicke, R. Lutz, D. Franke, and Y. S. Djajadihardja(2008), Neogene subsidence and stratigraphy of the Simeulue forearcbasin, northwest Sumatra, Mar. Geol., 253, 1–13, doi:10.1016/j.margeo.2008.04.006.
Beroza, G. C., and S. Ide (2009), Deep tremors and slow quakes, Science,324, 1025–1026, doi:10.1126/science.1171231.
Bilek, S. L. (2010), Invited review paper: Seismicity along the SouthAmerican subduction zone: Review of large earthquakes, tsunamis, andsubduction zone complexity, Tectonophysics, 495, 2–14, doi:10.1016/j.tecto.2009.02.037.
Bock, Y., L. Prawirodirdjo, J. F. Genrich, C. W. Stevens, R. McCaffrey,C. Subarya, S. S. O. Puntodewo, and E. Calais (2003), Crustal motion inIndonesia from Global Positioning System measurements, J. Geophys.Res., 108(B8), 2367, doi:10.1029/2001JB000324.
Briggs, R. W., et al. (2006), Deformation and slip along the Sunda megathrustin the great 2005 Nias–Simeulue earthquake, Science, 311, 1897–1901,doi:10.1126/science.1122602.
Cande, S. C., J. L. LaBrecque, R. L. Larson, W. C. Pitman III, X. Golovchenko,and W. F. Haxby (1989), Magnetic Lineations of the World’s OceanBasins [CD-ROM], Am. Assoc. of Pet. Geol., Tulsa, Okla.
Chlieh, M., et al. (2007), Coseismic slip and afterslip of the great MW 9.15Sumatra–Andaman earthquake of 2004, Bull. Seismol. Soc. Am., 97,S152–S173, doi:10.1785/0120050631.
Chlieh, M., J.-P. Avouac, K. Sieh, D. H. Natawidjaja, and J. Galetzka(2008), Heterogeneous coupling of the Sumatran megathrust constrainedby geodetic and paleogeodetic measurements, J. Geophys. Res., 113,B05305, doi:10.1029/2007JB004981.
Cummins, P. R., T. Baba, S. Kodaira, and Y. Kaneda (2002), The 1946Nankai earthquake and segmentation of the Nankai Trough, Phys. EarthPlanet. Inter., 132, 75–87, doi:10.1016/S0031-9201(02)00045-6.
Deplus, C., M. Diament, H. Hébert, G. Bertrand, S. Dominguez, J. Dubois,J. Malod, P. Patriat, B. Pontoise, and J.-J. Sibilla (1998), Direct evidenceof active deformation in the eastern Indian oceanic plate, Geology, 26,131–134, doi:10.1130/0091-7613(1998)026<0131:DEOADI>2.3.CO;2.
DeShon, H. R., E. R. Engdahl, C. H. Thurber, andM. Brudzinski (2005), Con-straining the boundary between the Sunda and Andaman subduction sys-tems: Evidence from the 2002 MW 7.3 northern Sumatra earthquake andaftershock relocations of the 2004 and 2005 great earthquakes, Geophys.Res. Lett., 32, L24307, doi:10.1029/2005GL024188.
Endharto, M., and Sukido (1994), Geological map of the Sinabang Sheet,Sumatera, scale 1:250,000, Geol. Res. and Dev. Cent., Bandung, Indonesia.
Fauzi, R. McCaffrey, D. Wark, Sunaryo, and P. Y. Prih Haryadi (1996),Lateral variation in slab orientation beneath Toba Caldera, northernSumatra, Geophys. Res. Lett., 23, 443–446, doi:10.1029/96GL00381.
Field, E. H., et al. (2008), The uniform California earthquake rupture forecast,version 2(UCERF 2), U.S. Geol. Surv. Open File Rep., 2007-1437, 104 pp.
Franke, D., M. Schnabel, S. Ladage, D. R. Tappin, S. Neben, Y. S.Djajadihardja, C. Müller, H. Kopp, and C. Gaedicke (2008), The greatSumatra–Andaman earthquakes—Imaging the boundary between the rup-tures of the great 2004 and 2005 earthquakes, Earth Planet. Sci. Lett., 269,118–130, doi:10.1016/j.epsl.2008.01.047.
Freymueller, J. T. (2010), Along-strike and downdip variations in subduc-tion zone slip deficit: Persistent or transient?, paper presented at 2010 FallMeeting, AGU, San Francisco, CA, 13–17 December.
Frohlich, C., M. J. Hornbach, F. W. Taylor, C.-C. Shen, A. Moala, A. E.Morton, and J. Kruger (2009), Huge erratic boulders in Tonga depositedby a prehistoric tsunami, Geology, 37, 131–134, doi:10.1130/G25277A.1.
Gomberg, J., et al. (2010), Slow-slip phenomena in Cascadia from 2007 andbeyond: A review, Geol. Soc. Am. Bull., 122, 963–978, doi:10.1130/B30287.1.
Graindorge, D., et al. (2008), Impact of lower plate structure on upper platedeformation at the NW Sumatran convergent margin from seafloor mor-phology, Earth Planet. Sci. Lett., 275, 201–210, doi:10.1016/j.epsl.2008.04.053.
Headquarters for Earthquake Research Promotion (2006), National seismichazard maps for Japan (2005), report, Tokyo.
Jevrejeva, S., A. Grinsted, J. C. Moore, and S. Holgate (2006), Nonlineartrends and multiyear cycles in sea level records, J. Geophys. Res., 111,C09012, doi:10.1029/2005JC003229.
Kaneko, Y., J.-P. Avouac, and N. Lapusta (2010), Towards inferring earth-quake patterns from geodetic observations of interseismic coupling, Nat.Geosci., 3, 363–369, doi:10.1038/ngeo843.
Kodaira, S., N. Takahashi, A. Nakanishi, S. Miura, and Y. Kaneda (2000),Subducted seamount imaged in the rupture zone of the 1946 Nankaidoearthquake, Science, 289, 104–106, doi:10.1126/science.289.5476.104.
Konca, A. O., et al. (2008), Partial rupture of a locked patch of the Sumatramegathrust during the 2007 earthquake sequence, Nature, 456, 631–635,doi:10.1038/nature07572.
Kopp, H., et al. (2008), Lower slope morphology of the Sumatra trench sys-tem, Basin Res., 20, 519–529, doi:10.1111/j.1365-2117.2008.00381.x.
Lange, D., F. Tilmann, A. Rietbrock, R. Collings, D. H. Natawidjaja, B. W.Suwargadi, P. Barton, T. Henstock, and T. Ryberg (2010), The fine struc-ture of the subducted Investigator fracture zone in western Sumatra as seenby local seismicity, Earth Planet. Sci. Lett., 298, 47–56, doi:10.1016/j.epsl.2010.07.020.
Lay, T. (2011), Earthquakes: A Chilean surprise, Nature, 471, 174–175,doi:10.1038/471174a.
Liu, C.-S., J. R. Curray, and J. M. McDonald (1983), New constraints onthe tectonic evolution of the eastern Indian Ocean, Earth Planet. Sci.Lett., 65, 331–342, doi:10.1016/0012-821X(83)90171-1.
Loveless, J. P., M. E. Pritchard, and N. Kukowski (2010), Testing mechan-isms of subduction zone segmentation and seismogenesis with slip distri-butions from recent Andean earthquakes, Tectonophysics, 495, 15–33,doi:10.1016/j.tecto.2009.05.008.
Meade, B. J., and J. P. Loveless (2009), Predicting the geodetic signature ofMW ≥ 8 slow slip events, Geophys. Res. Lett., 36, L01306, doi:10.1029/2008GL036364.
Meltzner, A. J. (2010), Earthquake recurrence, clustering, and persistentsegmentation near the southern end of the 2004 Sunda megathrust rup-ture, PhD thesis, Calif. Inst. of Technol., Pasadena. [Available at http://resolver.caltech.edu/CaltechTHESIS:06012010-082222484.]
Meltzner, A. J., K. Sieh, M. Abrams, D. C. Agnew, K. W. Hudnut, J.-P.Avouac, and D. H. Natawidjaja (2006), Uplift and subsidence associatedwith the great Aceh–Andaman earthquake of 2004, J. Geophys. Res.,111, B02407, doi:10.1029/2005JB003891.
Meltzner, A. J., K. E. Sieh, H. Chiang, C. Shen, B. Philibosian, B. W.Suwargadi, and D. H. Natawidjaja (2009), Earthquake clusters and persis-tent segmentation near the boundary of the 2004 and 2005 Sunda mega-thrust ruptures, Eos Trans. AGU, 90(52), Fall Meet. Suppl., AbstractT11D-07.
Meltzner, A. J., K. Sieh, H.-W. Chiang, C.-C. Shen, B. W. Suwargadi, D. H.Natawidjaja, B. E. Philibosian, R. W. Briggs, and J. Galetzka (2010),Coral evidence for earthquake recurrence and an A.D. 1390–1455 clusterat the south end of the 2004 Aceh–Andaman rupture, J. Geophys. Res.,115, B10402, doi:10.1029/2010JB007499.
Mitrovica, J. X., and G. A. Milne (2002), On the origin of late Holocenesea-level highstands within equatorial ocean basins, Quat. Sci. Rev., 21,2179–2190, doi:10.1016/S0277-3791(02)00080-X.
Moore, J. C., and D. Saffer (2001), Updip limit of the seismogenic zonebeneath the accretionary prism of southwest Japan: An effect of diageneticto low-grademetamorphic processes and increasing effective stress,Geology,29, 183–186, doi:10.1130/0091-7613(2001)029<0183:ULOTSZ>2.0.CO;2.
Natawidjaja, D. H., K. Sieh, S. N.Ward, H. Cheng, R. L. Edwards, J. Galetzka,and B.W. Suwargadi (2004), Paleogeodetic records of seismic and aseismicsubduction from central Sumatran microatolls, Indonesia, J. Geophys. Res.,109, B04306, doi:10.1029/2003JB002398.
Natawidjaja, D. H., K. Sieh, M. Chlieh, J. Galetzka, B. W. Suwargadi,H. Cheng, R. L. Edwards, J.-P. Avouac, and S. N. Ward (2006), Sourceparameters of the great Sumatran megathrust earthquakes of 1797 and1833 inferred from coral microatolls, J. Geophys. Res., 111, B06403,doi:10.1029/2005JB004025.
Natawidjaja, D. H., K. Sieh, J. Galetzka, B. W. Suwargadi, H. Cheng, R. L.Edwards, and M. Chlieh (2007), Interseismic deformation above the Sundamegathrust recorded in coral microatolls of the Mentawai islands, WestSumatra, J. Geophys. Res., 112, B02404, doi:10.1029/2006JB004450.
Newcomb, K. R., and W. R. McCann (1987), Seismic history and seismo-tectonics of the Sunda Arc, J. Geophys. Res., 92, 421–439, doi:10.1029/JB092iB01p00421.
Nicholls, R. J., and A. Cazenave (2010), Sea-level rise and its impact oncoastal zones, Science, 328, 1517–1520, doi:10.1126/science.1185782.
Nishimura, T., T. Hirasawa, S. Miyazaki, T. Sagiya, T. Tada, S. Miura, andK. Tanaka (2004), Temporal change of interplate coupling in northeasternJapan during 1995–2002 estimated from continuous GPS observations,Geophys. J. Int., 157, 901–916, doi:10.1111/j.1365-246X.2004.02159.x.
Ozawa, S., T. Nishimura, H. Suito, T. Kobayashi, M. Tobita, and T. Imakiire(2011), Coseismic and postseismic slip of the 2011 magnitude-9 Tohoku-Oki earthquake, Nature, 475, 373–376, doi:10.1038/nature10227.
Perfettini, H., J.-P. Avouac, and J.-C. Ruegg (2005), Geodetic displacementsand aftershocks following the 2001 MW = 8.4 Peru earthquake: Implica-tions for the mechanics of the earthquake cycle along subduction zones,J. Geophys. Res., 110, B09404, doi:10.1029/2004JB003522.
MELTZNER ET AL.: SUNDA MEGATHRUST PERSISTENT SEGMENTATION B04405B04405
14 of 15
Prawirodirdjo, L., R. McCaffrey, C. D. Chadwell, Y. Bock, and C. Subarya(2010), Geodetic observations of an earthquake cycle at the Sumatra sub-duction zone: Role of interseismic strain segmentation, J. Geophys. Res.,115, B03414, doi:10.1029/2008JB006139.
Rolandone, F., R. Bürgmann, D. C. Agnew, I. A. Johanson, D. C. Templeton,M. A. d’Alessio, S. J. Titus, C. DeMets, and B. Tikoff (2008), Aseismic slipand fault-normal strain along the central creeping section of the San Andreasfault, Geophys. Res. Lett., 35, L14305, doi:10.1029/2008GL034437.
Rowe, C. D., F. Meneghini, and J. C. Moore (2011), Textural record of theseismic cycle: Strain-rate variation in an ancient subduction thrust, inGeology of the Earthquake Source: A Volume in Honour of Rick Sibson,edited by Å. Fagereng et al., Geol. Soc. Spec. Publ., 359, 77–95,doi:10.1144/SP359.5.
Scholz, C. H. (2002), The Mechanics of Earthquakes and Faulting, 496 pp.,Cambridge Univ. Press, Cambridge, U. K., doi:10.2277/0521655404.
Scoffin, T. P., and D. R. Stoddart (1978), The nature and significance ofmicroatolls, Philos. Trans. R. Soc. London, B, 284, 99–122, doi:10.1098/rstb.1978.0055.
Shearer, P., and R. Bürgmann (2010), Lessons learned from the 2004 Sumatra–Andaman megathrust rupture, Annu. Rev. Earth Planet. Sci., 38, 103–131,doi:10.1146/annurev-earth-040809-152537.
Shen, C.-C., R. L. Edwards, H. Cheng, J. A. Dorale, R. B. Thomas, S. B.Moran, S. E. Weinstein, and H. N. Edmonds (2002), Uranium and tho-rium isotopic and concentration measurements by magnetic sector induc-tively coupled plasma mass spectrometry, Chem. Geol., 185, 165–178,doi:10.1016/S0009-2541(01)00404-1.
Shen, C.-C., et al. (2008), Variation of initial 230Th/232Th and limits of highprecision U-Th dating of shallow-water corals, Geochim. Cosmochim.Acta, 72, 4201–4223, doi:10.1016/j.gca.2008.06.011.
Shen, C.-C., A. Kano, M. Hori, K. Lin, T.-C. Chiu, and G. S. Burr (2010),East Asian monsoon evolution and reconciliation of climate records fromJapan and Greenland during the last deglaciation, Quat. Sci. Rev., 29,3327–3335, doi:10.1016/j.quascirev.2010.08.012.
Sieh, K., and D. Natawidjaja (2000), Neotectonics of the Sumatranfault, Indonesia, J. Geophys. Res., 105, 28,295–28,326, doi:10.1029/2000JB900120.
Sieh, K., D. H. Natawidjaja, A. J. Meltzner, C.-C. Shen, H. Cheng, K.-S. Li,B. W. Suwargadi, J. Galetzka, B. Philibosian, and R. L. Edwards (2008),Earthquake supercycles inferred from sea-level changes recorded in thecorals of West Sumatra, Science, 322, 1674–1678, doi:10.1126/science.1163589.
Smith, W. H. F., and D. T. Sandwell (1997), Global sea floor topography fromsatellite altimetry and ship depth soundings, Science, 277, 1956–1962,doi:10.1126/science.277.5334.1956.
Subarya, C., M. Chlieh, L. Prawirodirdjo, J.-P. Avouac, Y. Bock, K. Sieh,A. J. Meltzner, D. H. Natawidjaja, and R. McCaffrey (2006), Plate-boundary deformation associated with the great Sumatra–Andaman earth-quake, Nature, 440, 46–51, doi:10.1038/nature04522.
Taylor, F. W., C. Frohlich, J. Lecolle, and M. Strecker (1987), Analysis ofpartially emerged corals and reef terraces in the central Vanuatu Arc:Comparison of contemporary coseismic and nonseismic with Quaternaryvertical movements, J. Geophys. Res., 92, 4905–4933, doi:10.1029/JB092iB06p04905.
Taylor, F. W., R. W. Briggs, C. Frohlich, A. Brown, M. Hornbach, A. K.Papabatu, A. J. Meltzner, and D. Billy (2008), Rupture across arc seg-ment and plate boundaries in the 1 April 2007 Solomons earthquake,Nat. Geosci., 1, 253–257, doi:10.1038/ngeo159.
Tilmann, F. J., T. J. Craig, I. Grevemeyer, B. Suwargadi, H. Kopp, andE. Flueh (2010), The updip seismic/aseismic transition of the Sumatramegathrust illuminated by aftershocks of the 2004 Aceh–Andamanand 2005 Nias events, Geophys. J. Int., 181, 1261–1274, doi:10.1111/j.1365-246X.2010.04597.x.
Turcotte, D. L., and G. Schubert (2002), Geodynamics, 472 pp., CambridgeUniv. Press, Cambridge, U. K., doi:10.2277/0521666244.
Wang, K., and S. L. Bilek (2011), Do subducting seamounts generate orstop large earthquakes?, Geology, 39, 819–822, doi:10.1130/G31856.1.
Wesnousky, S. G. (2006), Predicting the endpoints of earthquake ruptures,Nature, 444, 358–360, doi:10.1038/nature05275.
Zachariasen, J., K. Sieh, F. W. Taylor, and W. S. Hantoro (2000), Modernvertical deformation above the Sumatran subduction zone: Paleogeodeticinsights from coral microatolls, Bull. Seismol. Soc. Am., 90, 897–913,doi:10.1785/0119980016.
R. W. Briggs, Geologic Hazards Science Center, U.S. Geological Survey,MS 966, Box 25046, Denver, CO 80225, USA.H.-W. Chiang and C.-C. Shen, High-precision Mass Spectrometry and
Environment Change Laboratory, Department of Geosciences, NationalTaiwan University, Taipei 10617, Taiwan.A. J. Meltzner and K. Sieh, Earth Observatory of Singapore, Nanyang
Technological University, 639798 Singapore. ([email protected])D. H. Natawidjaja and B.W. Suwargadi, Research Center for Geotechnology,
Indonesian Institute of Sciences, Bandung 40135, West Java, Indonesia.B. Philibosian, Tectonics Observatory, California Institute of Technology,
Pasadena, CA 91125, USA.
MELTZNER ET AL.: SUNDA MEGATHRUST PERSISTENT SEGMENTATION B04405B04405