IJRESS Volume 6, Issue 4 (April, 2016) (ISSN 2249-7382) International Journal of Research in Economics and Social Sciences (IMPACT FACTOR – 6.225) International Journal of Research in Economics & Social Sciences Email id: [email protected], http://www.euroasiapub.org 264 Personal Factors Influence on Consumer Satisfaction in Indian Life Insurance Industry Dr. Mukesh Srivastava 1 , Assistant Professor, Amity Business School, Amity University Uttar Pradesh, Lucknow Campus, Lucknow Dr. Charu Bisaria 2 , Assistant Professor, Amity Business School, Amity University Uttar Pradesh, Lucknow Campus, Lucknow Dr. Shobhit Goel 3 , Assistant Professor, Amity Business School, Amity University Uttar Pradesh, Lucknow Campus, Lucknow Abstract The growing number of academic studies on Consumer satisfaction and the mixed findings they report complicate efforts among managers and academics to identify the antecedents to, and outcomes of, businesses having more versus less-satisfied Consumers. Many studies suggest that it costs three to five times as much to attract a new Consumer as it does to retain an old Consumer. Capturing new Consumers from competitors is costly because a greater degree of service improvement is needed to induce Consumers to switch from a competitor. Parasuraman’ (1991) study found that a 5 per cent increase in Consumer retention resulted in more than 25 per cent increase in profits in a number of service industry groups studied. Here in the current study we are trying to specifying the different personal variables affecting the satisfaction level of the Consumers in the life insurance industry. We have found the demographic variables and psychographic variables on which experimentation will be performed to evaluate how these variables are going to create positive or negative satisfaction index for the Consumers in the whole life insurance industry. Keywords: Consumer Satisfaction, Personal Factors, demographic variables, psychographic variables, Life Insurance Industry.
Personal Factors Influence on Consumer Satisfaction in Indian Life Insurance Industry
Dr. Mukesh Srivastava1,
Assistant Professor, Amity Business School, Amity University Uttar Pradesh,
Lucknow Campus, Lucknow
Dr. Charu Bisaria2,
Assistant Professor, Amity Business School, Amity University Uttar Pradesh,
Lucknow Campus, Lucknow
Dr. Shobhit Goel3,
Assistant Professor, Amity Business School, Amity University Uttar Pradesh,
Lucknow Campus, Lucknow
Abstract
The growing number of academic studies on Consumer satisfaction and the mixed findings they report complicate efforts among managers and academics to identify the antecedents to, and outcomes of, businesses having more versus less-satisfied Consumers. Many studies suggest that it costs three to five times as much to attract a new Consumer as it does to retain an old Consumer. Capturing new Consumers from competitors is costly because a greater degree of service improvement is needed to induce Consumers to switch from a competitor. Parasuraman’ (1991) study found that a 5 per cent increase in Consumer retention resulted in more than 25 per cent increase in profits in a number of service industry groups studied. Here in the current study we are trying to specifying the different personal variables affecting the satisfaction level of the Consumers in the life insurance industry. We have found the demographic variables and psychographic variables on which experimentation will be performed to evaluate how these variables are going to create positive or negative satisfaction index for the Consumers in the whole life insurance industry. Keywords: Consumer Satisfaction, Personal Factors, demographic variables, psychographic variables, Life Insurance Industry.
Introduction The growing number of academic studies on Consumer satisfaction and the mixed findings they report complicate efforts among managers and academics to identify the antecedents to, and outcomes of, businesses having more versus less-satisfied Consumers. These mixed findings and the growing emphasis by managers on having satisfied Consumers point to the value of empirically synthesizing the evidence on Consumer satisfaction to assess current knowledge. To this end, the authors conduct a recta-analysis of the reported findings on Consumer satisfaction.
“Consumer satisfaction can be defined as a post consumption evaluative judgment.” -Atila Yuksel Many studies suggest that it costs three to five times as much to attract a new Consumer as it does to retain an old Consumer. Capturing new Consumers from competitors is costly because a greater degree of service improvement is needed to induce Consumers to switch from a competitor. A study found that a 5 per cent increase in Consumer retention resulted in more than 25 per cent increase in profits in a number of service industry groups studied. Repeat Consumers may also benefit businesses by influencing others through positive word-of-mouth advertising. Studies have also revealed that repeat Consumers are more likely to be loyal to the business. Furthermore, to keep and advance their competitive edge, modern business organizations should better understand and profile their Consumers. This is more imperative in the insurance sector, where the variety of the products and services offered concerns particular groups of Consumers.
Review of the Literature With the liberalization and internationalization in insurance, Consumer satisfaction has
become an important means of differentiation and path to achieve business success. Such differentiation based on Consumer satisfaction can be a key source of competitiveness for insurance companies and hence have implication for leadership in such organizations.
Zeithaml et.al (2010) elucidate that Consumers’ emotions can also affect their perceptions of satisfaction with products and services. These emotions can be stable, preexisting emotions- for example; mood state or life satisfaction. Think of times when you are at a happy stage in your life (such as when you are on vacation), and your good ,happy, mood and positive frame of mind have influenced how you feel about the services you experience. Alternatively, when you are in bad mood, your negative feelings may carry over into how you respond to services, causing you to overreact or respond negatively to any little problem. A better understanding of consumer’s behavior through demographic analysis can play an important role in predicting demand for insurance. However, emerging new complex financial products and changes in the preferences of people for preventing their risks make it difficult. The study aims to find out the relationship of demographic characteristics of the respondents with five important factors influencing the purchase of a life insurance product namely product quality and brand image, service quality, Consumer friendliness, brand loyalty and commitment. Negi & Singh (2012) also elaborates that Product Quality and Brand Image came out as the highest ranking factors while Brand Loyalty has been rated as the least important factor. It has been further observed that these factors vary significantly across various demographic characteristics of the respondents. Life Insurance sector has a lot of potential both in terms of sales, revenue and employment generation and difficult to estimate the required Consumer expectation. Barik (2012) confirms that
Consumers realize two basic types of expectation such as desired and adequate service. Life insurance is generally purchased through advisors or simply agents in india.Their personal as well as technical Knowledge catalyzes the acceptance of life insurance products. The different functional benefits that come to Consumers mind are critical for all insurers to take into account considering the credence qualities. Also various reasons for which Consumer expectation fluctuates cannot be neglected for the existing and new entrants to the Indian life insurance industry. Today security is no more only a reasons for life insurance, investment also in the Consumers mind along with the previous basic concept in Indian life insurance because of changing life style, globalization and Consumers’ value perception for this intangibility product.
Research Objective
To serve the purpose the research work carried out the objective framed out is “To study the influence of various Personal measures affecting Consumer satisfaction in life Insurance Industry.”
Methodology & Research Design Conclusive research Design is used and characterized by formal research procedure. The
research objectives are accurately defined and so are information needs. Conclusive Research studies can be classified into Descriptive and Experimental Designs.
In the current study Descriptive research design is used to study the characteristics of consumer segment of life insurance industry, viz., demographic, socio-economic, geographic, psychographic and benefits sought. This Research design can also portray buyer perception of brands; buying power of Consumers; Availability of agents; product consumption patterns; price sensitivity of consumers; market share etc.
According to the above literature review, these consumer characteristics are the sum up of psychographic factors and the demographic factors. Psychographic factors of the consumers which are the individual feelings and beliefs, the services experienced in the past, consumer’s perception about the life insurance services, and his/her motivation factors and personality traits. The demographic factors consist of the Age, Gender, Marital status, educational qualifications, Income etc.
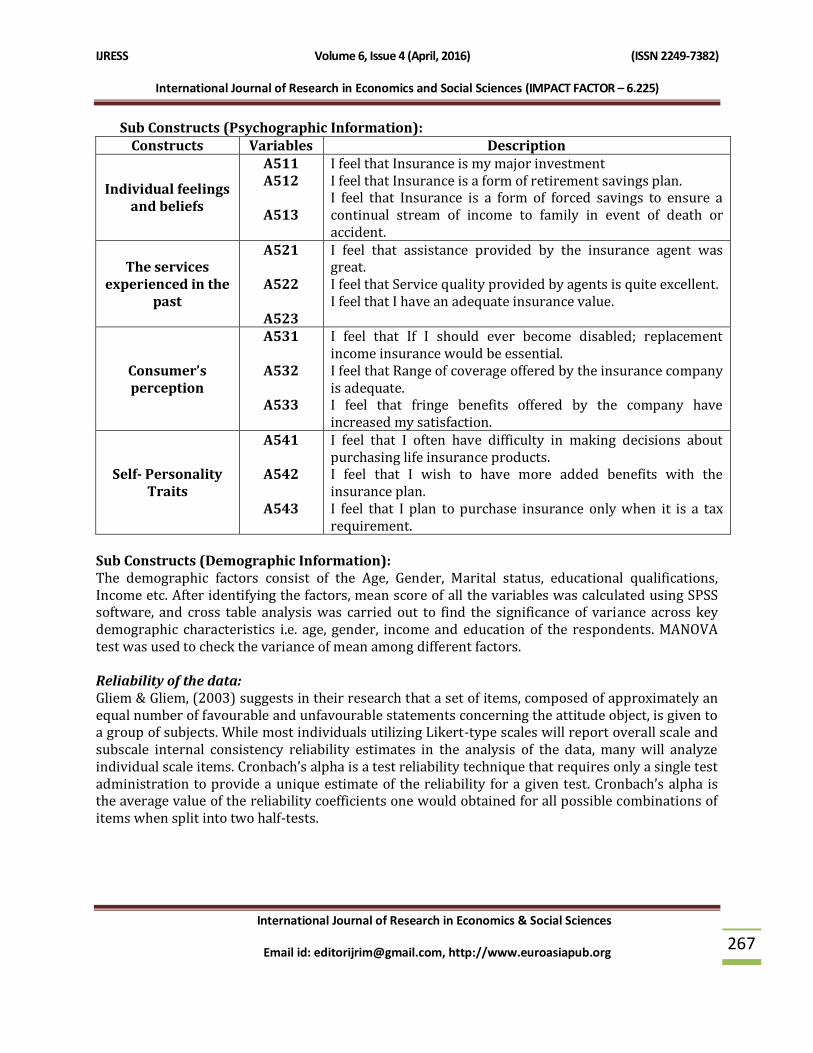
Sub Constructs (Psychographic Information): Constructs Variables Description
Individual feelings and beliefs
A511 A512
A513
I feel that Insurance is my major investment I feel that Insurance is a form of retirement savings plan. I feel that Insurance is a form of forced savings to ensure a continual stream of income to family in event of death or accident.
The services experienced in the
past
A521
A522
A523
I feel that assistance provided by the insurance agent was great. I feel that Service quality provided by agents is quite excellent. I feel that I have an adequate insurance value.
Consumer’s perception
A531
A532
A533
I feel that If I should ever become disabled; replacement income insurance would be essential. I feel that Range of coverage offered by the insurance company is adequate. I feel that fringe benefits offered by the company have increased my satisfaction.
Self- Personality Traits
A541
A542
A543
I feel that I often have difficulty in making decisions about purchasing life insurance products. I feel that I wish to have more added benefits with the insurance plan. I feel that I plan to purchase insurance only when it is a tax requirement.
Sub Constructs (Demographic Information): The demographic factors consist of the Age, Gender, Marital status, educational qualifications, Income etc. After identifying the factors, mean score of all the variables was calculated using SPSS software, and cross table analysis was carried out to find the significance of variance across key demographic characteristics i.e. age, gender, income and education of the respondents. MANOVA test was used to check the variance of mean among different factors. Reliability of the data: Gliem & Gliem, (2003) suggests in their research that a set of items, composed of approximately an equal number of favourable and unfavourable statements concerning the attitude object, is given to a group of subjects. While most individuals utilizing Likert-type scales will report overall scale and subscale internal consistency reliability estimates in the analysis of the data, many will analyze individual scale items. Cronbach’s alpha is a test reliability technique that requires only a single test administration to provide a unique estimate of the reliability for a given test. Cronbach’s alpha is the average value of the reliability coefficients one would obtained for all possible combinations of items when split into two half-tests.
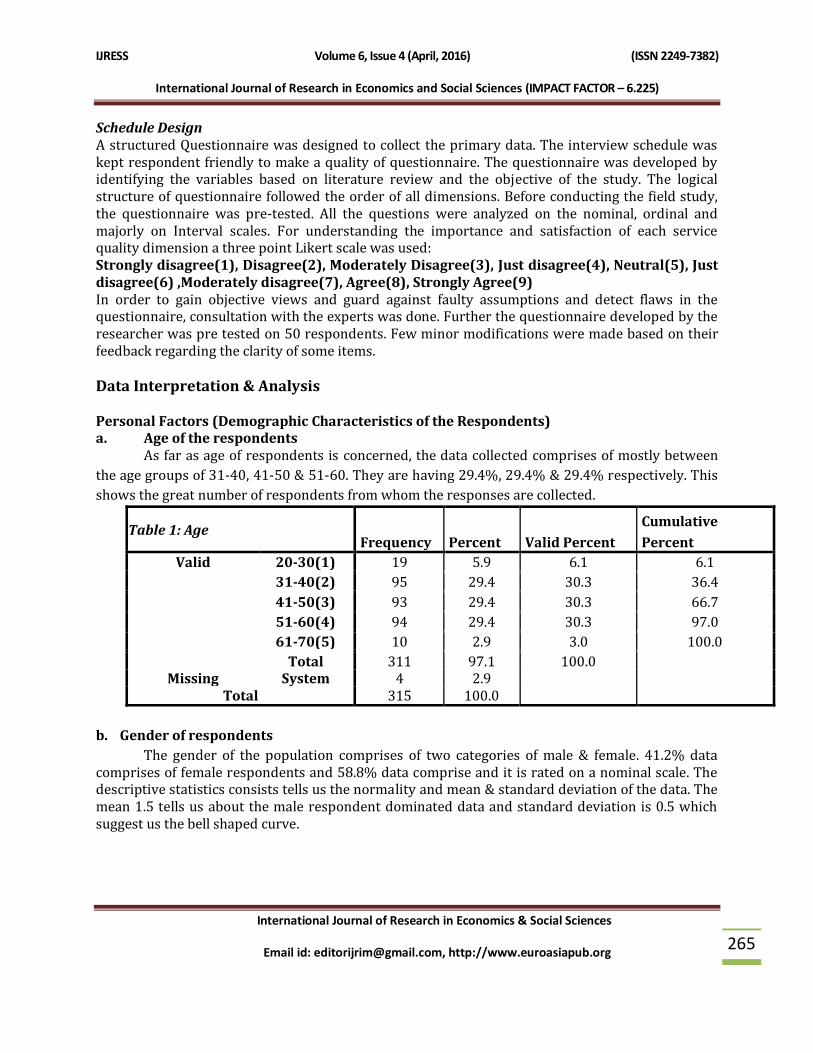
Schedule Design A structured Questionnaire was designed to collect the primary data. The interview schedule was kept respondent friendly to make a quality of questionnaire. The questionnaire was developed by identifying the variables based on literature review and the objective of the study. The logical structure of questionnaire followed the order of all dimensions. Before conducting the field study, the questionnaire was pre-tested. All the questions were analyzed on the nominal, ordinal and majorly on Interval scales. For understanding the importance and satisfaction of each service quality dimension a three point Likert scale was used: Strongly disagree(1), Disagree(2), Moderately Disagree(3), Just disagree(4), Neutral(5), Just disagree(6) ,Moderately disagree(7), Agree(8), Strongly Agree(9) In order to gain objective views and guard against faulty assumptions and detect flaws in the questionnaire, consultation with the experts was done. Further the questionnaire developed by the researcher was pre tested on 50 respondents. Few minor modifications were made based on their feedback regarding the clarity of some items. Data Interpretation & Analysis Personal Factors (Demographic Characteristics of the Respondents) a. Age of the respondents As far as age of respondents is concerned, the data collected comprises of mostly between
the age groups of 31-40, 41-50 & 51-60. They are having 29.4%, 29.4% & 29.4% respectively. This
shows the great number of respondents from whom the responses are collected.
Table 1: Age Frequency Percent Valid Percent
Cumulative
Percent
Valid 20-30(1) 19 5.9 6.1 6.1
31-40(2) 95 29.4 30.3 36.4
41-50(3) 93 29.4 30.3 66.7
51-60(4) 94 29.4 30.3 97.0
61-70(5) 10 2.9 3.0 100.0
Total 311 97.1 100.0 Missing System 4 2.9
Total 315 100.0
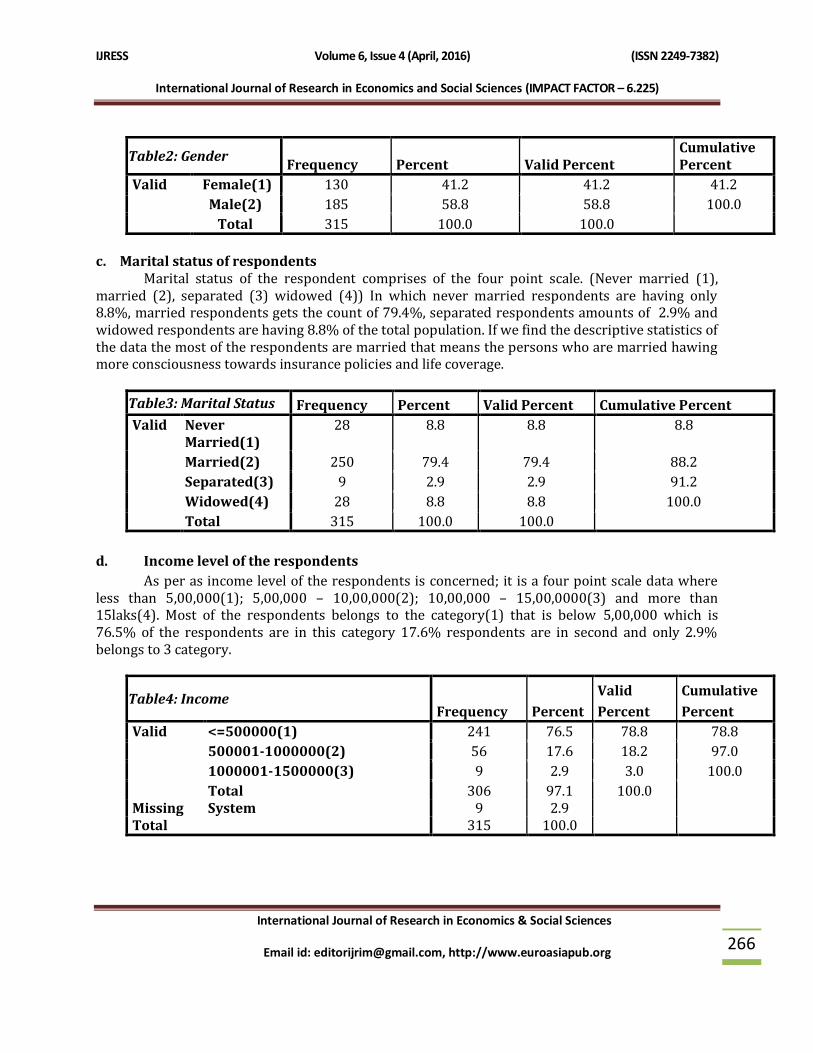
b. Gender of respondents
The gender of the population comprises of two categories of male & female. 41.2% data comprises of female respondents and 58.8% data comprise and it is rated on a nominal scale. The descriptive statistics consists tells us the normality and mean & standard deviation of the data. The mean 1.5 tells us about the male respondent dominated data and standard deviation is 0.5 which suggest us the bell shaped curve.
c. Marital status of respondents Marital status of the respondent comprises of the four point scale. (Never married (1), married (2), separated (3) widowed (4)) In which never married respondents are having only 8.8%, married respondents gets the count of 79.4%, separated respondents amounts of 2.9% and widowed respondents are having 8.8% of the total population. If we find the descriptive statistics of the data the most of the respondents are married that means the persons who are married hawing more consciousness towards insurance policies and life coverage.
Table3: Marital Status Frequency Percent Valid Percent Cumulative Percent
Valid Never Married(1)
28 8.8 8.8 8.8
Married(2) 250 79.4 79.4 88.2
Separated(3) 9 2.9 2.9 91.2
Widowed(4) 28 8.8 8.8 100.0
Total 315 100.0 100.0
d. Income level of the respondents
As per as income level of the respondents is concerned; it is a four point scale data where less than 5,00,000(1); 5,00,000 – 10,00,000(2); 10,00,000 – 15,00,0000(3) and more than 15laks(4). Most of the respondents belongs to the category(1) that is below 5,00,000 which is 76.5% of the respondents are in this category 17.6% respondents are in second and only 2.9% belongs to 3 category.
Table4: Income Frequency Percent
Valid
Percent
Cumulative
Percent
Valid <=500000(1) 241 76.5 78.8 78.8
500001-1000000(2) 56 17.6 18.2 97.0
1000001-1500000(3) 9 2.9 3.0 100.0
Total 306 97.1 100.0 Missing System 9 2.9 Total 315 100.0
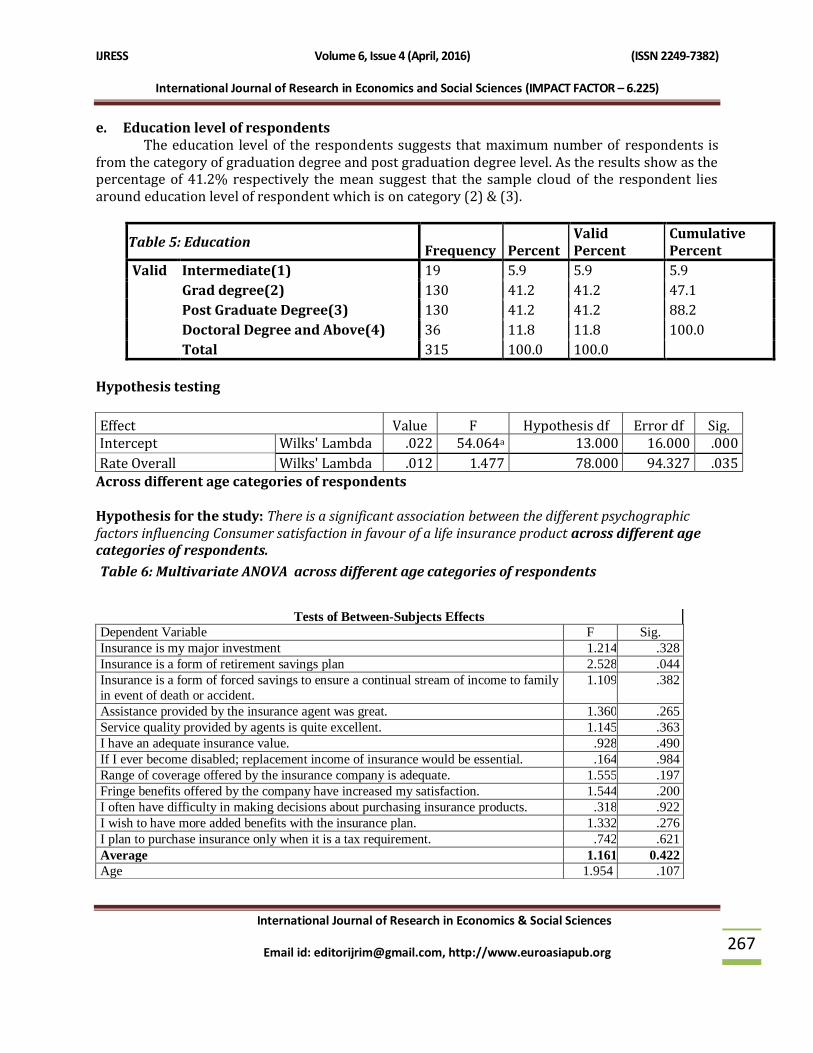
e. Education level of respondents The education level of the respondents suggests that maximum number of respondents is from the category of graduation degree and post graduation degree level. As the results show as the percentage of 41.2% respectively the mean suggest that the sample cloud of the respondent lies around education level of respondent which is on category (2) & (3).
Table 5: Education Frequency Percent
Valid Percent
Cumulative Percent
Valid Intermediate(1) 19 5.9 5.9 5.9
Grad degree(2) 130 41.2 41.2 47.1
Post Graduate Degree(3) 130 41.2 41.2 88.2
Doctoral Degree and Above(4) 36 11.8 11.8 100.0
Total 315 100.0 100.0
Hypothesis testing
Across different age categories of respondents Hypothesis for the study: There is a significant association between the different psychographic factors influencing Consumer satisfaction in favour of a life insurance product across different age categories of respondents.
Table 6: Multivariate ANOVA across different age categories of respondents
Effect Value F Hypothesis df Error df Sig. Intercept Wilks' Lambda .022 54.064a 13.000 16.000 .000
Interpretation: A multivariate analysis of variance was conducted to assess if there were association between the Overall satisfaction of the Consumers on a linear combination of Psychographic factors and Age. A insignificant association was found, Wilky's Lambda = .012, F = 1.477, p=.035. Examination of the coefficients for the linear combinations distinguishing Overall satisfaction of the Consumers groups indicated that grades in Psychographic factors and Age contributed most to distinguishing the groups. In particular, both psychographic factors contributed significantly toward discriminating group. Follow up univariate ANOVAs indicated that both Psychographic factors and Age were significantly associated with Overall satisfaction of the Consumers, F = 1.161, p =.422 and F = 1.954, p = .107, respectively. Across different gender categories of respondents Hypothesis for the study: There is a significant association between the different Psychographic factors influencing Consumer satisfaction in favour of a life insurance product across different gender categories of respondents.
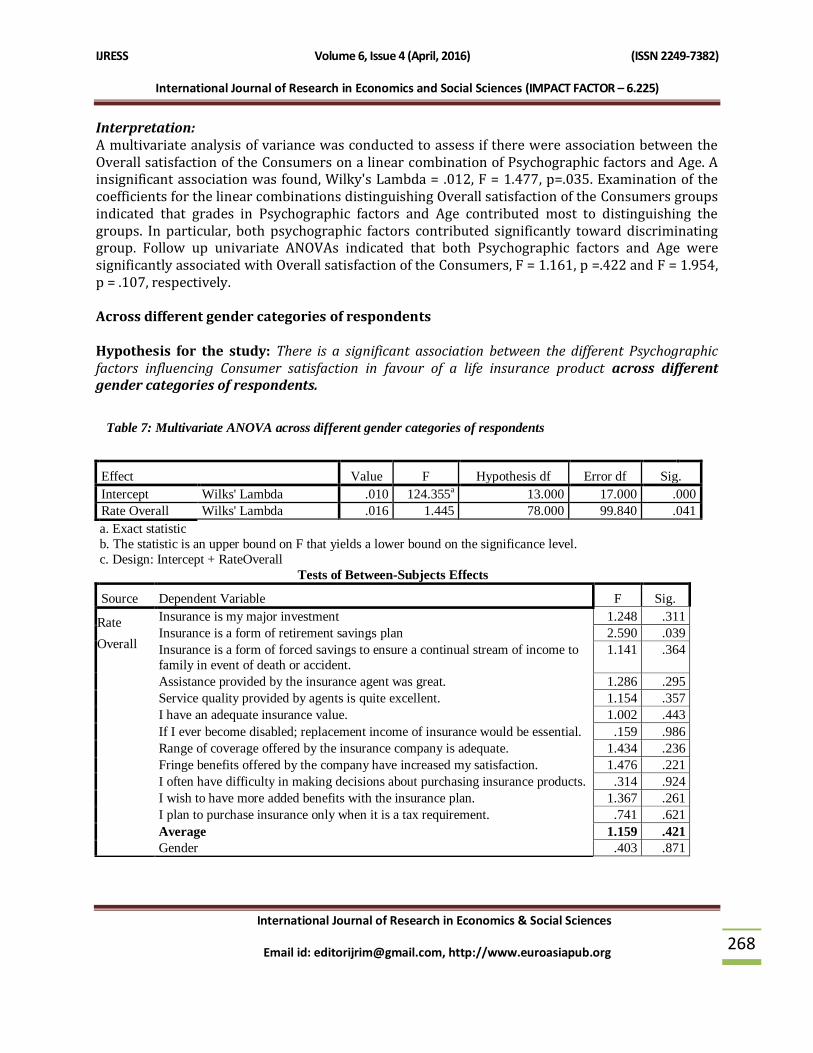
Table 7: Multivariate ANOVA across different gender categories of respondents
Interpretation: A multivariate analysis of variance was conducted to assess if there were any association between the Overall satisfaction of the Consumers on a linear combination of Psychographic factors and Gender. An insignificant association was found, as Wilky's Lambda = .016, F = 1.445, p=.041. Examination of the coefficients for the linear combinations distinguishing Overall satisfaction of the Consumers groups indicated that grades in Psychographic factors and Gender contributed most to distinguishing the groups. In particular, both psychographic factors contributed significantly toward discriminating group. Follow up univariate ANOVAs indicated that both Psychographic factors and Gender were significantly associated with Overall satisfaction of the Consumers, as F = 1.159, p =.4215 and F = .403, p = .871, respectively. Across different income categories of respondents Hypothesis for the study: There is a significant association between the Psychographic factors influencing Consumer satisfaction in favour of a life insurance product across different income categories of respondents.
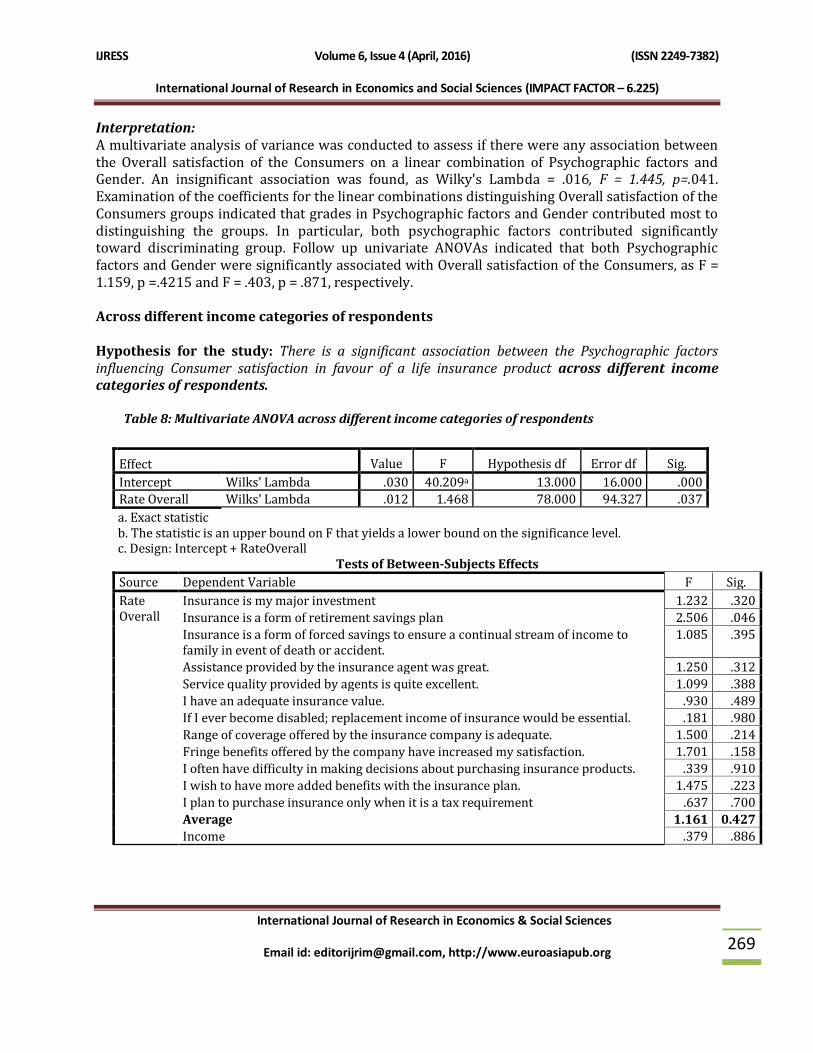
Table 8: Multivariate ANOVA across different income categories of respondents
Interpretation: A multivariate analysis of variance was conducted to assess if there were differences between the Overall satisfaction of the Consumers on a linear combination of Psychographic factors and Income categories. A insignificant difference was found, Wilky's Lambda = .012, F = 1.468, p=.037. Examination of the coefficients for the linear combinations distinguishing Overall satisfaction of the Consumers groups indicated that grades in Psychographic factors and Income categories contributed most to distinguishing the groups. In particular, both psychographic factors contributed significantly toward discriminating group. Follow up univariate ANOVAs indicated that both Psychographic factors and Income categories were significantly association for Overall satisfaction of the Consumers, F = 1.161, p =0.427and F = .140, p = .379, respectively. Across different Marital Status categories of respondents Hypothesis for the study: There is no significant association between the different Psychographic factors influencing Consumer satisfaction in favour of a life insurance product across different Marital Status categories of respondents.
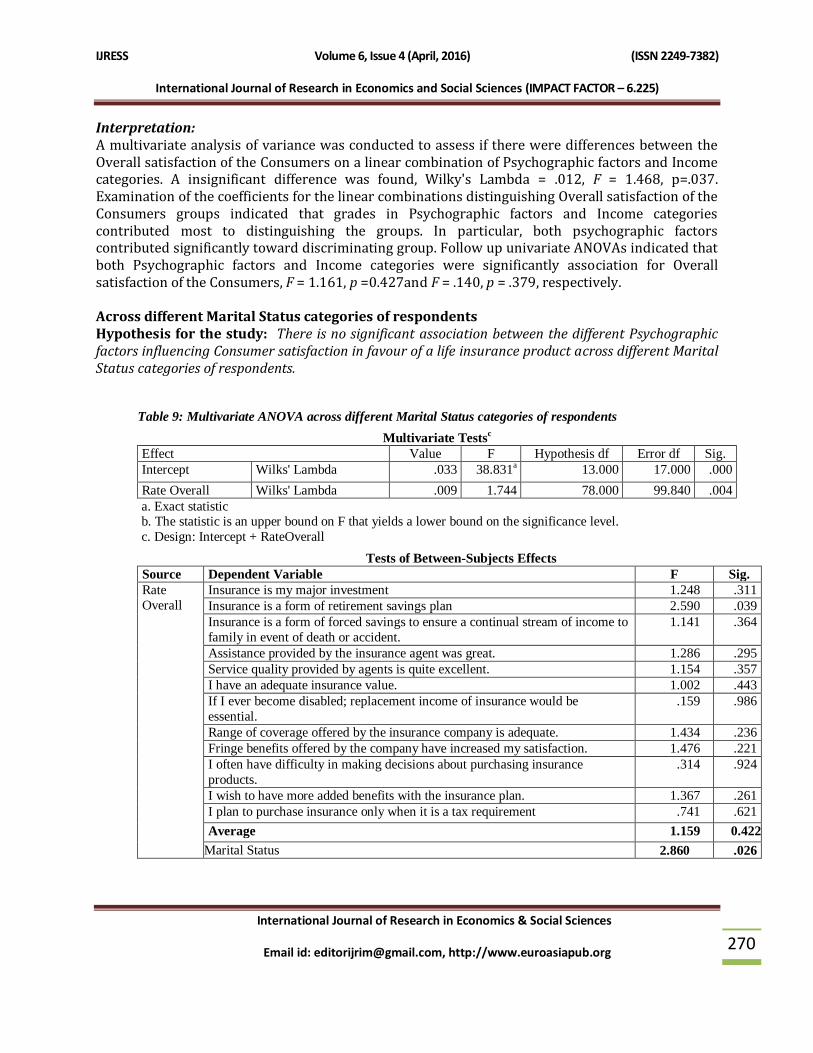
Table 9: Multivariate ANOVA across different Marital Status categories of respondents
Interpretation: A multivariate analysis of variance was conducted to assess if there were associations between the Overall satisfaction of the Consumers on a linear combination of Psychographic factors and Marital Status categories. A significant association was found, Wilky's Lambda = .009, F =1.744, p>=.004). Examination of the coefficients for the linear combinations distinguishing Overall satisfaction of the Consumers groups indicated that grades in Psychographic factors and Marital Status categories contributed most to distinguishing the groups. In particular, psychographic factors contributed significantly toward discriminating group. Follow up univariate ANOVAs indicated that Psychographic factors were significantly different for Overall satisfaction of the Consumers, F = 1.159, p =0.422 and but the Marital Status categories were not significantly different for Overall satisfaction of the Consumers F = 2.860, p = .026. Across different education categories of respondents Hypothesis for the study: There is no significant association between the different Psychographic factors influencing Consumer satisfaction in favour of a life insurance product across different education categories of respondents.
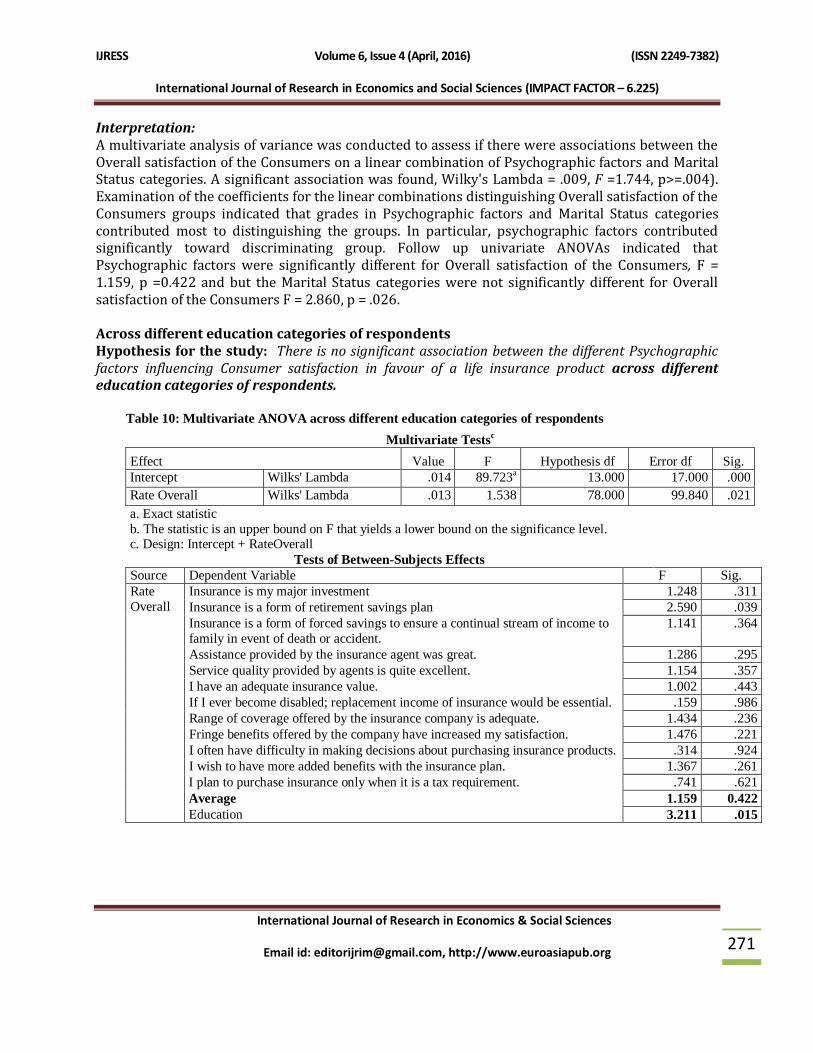
Table 10: Multivariate ANOVA across different education categories of respondents
Interpretation: A multivariate analysis of variance was conducted to assess if there were associations between the Overall satisfaction of the Consumers on a linear combination of Psychographic factors and Education categories. A significant association was found, Wilky's Lambda = .013, F = 1.538, p=.021. Examination of the coefficients for the linear combinations distinguishing Overall satisfaction of the Consumers groups indicated that grades in Psychographic factors and Education categories contributed most to distinguishing the groups. In particular, both psychographic factors contributed significantly toward discriminating group. Follow up univariate ANOVAs indicated that both Psychographic factors were significantly different for Overall satisfaction of the Consumers, F = 1.159, p =0.422 and but the Education categories were not significantly different for Overall satisfaction of the Consumers F = 3.211, p = .015. Findings & Discussions The study shows that the combined effect of the Psychographic factors and Age do not hamper the level of Consumer satisfaction so much but if we check the independently age groups effect and individual’s psychographic factors effect on Consumer satisfaction then it take into much account. Like wise the combined effect of the Psychographic factors and Gender do not hamper the level of Consumer satisfaction so much but if we check the independently Gender groups’ effect and individual’s psychographic factors effect on Consumer satisfaction then it take into much account. If we see the combined effect of the Psychographic factors and Income categories do not hamper the level of Consumer satisfaction so much but if we check the independently Income categories groups’ effect and individual’s psychographic factors effect on Consumer satisfaction then it take into much account. In the same way, the combined effect of the Psychographic factors and Marital Status categories hamper the level of Consumer satisfaction so much but if we check the independently Marital Status categories groups’ effect and individual’s psychographic factors effect on Consumer satisfaction then we see that Psychographic factors are not having that much of impact over Consumer satisfaction but Marital Status plays a vital role there. As the Marital Status level indulges with psychographic factors this starts affecting the individuals’ satisfaction level. Nevertheless, the combined effect of the Psychographic factors and Education categories hamper the level of Consumer satisfaction so much but if we check the independently Education categories groups’ effect and individual’s psychographic factors effect on Consumer satisfaction then we see that Psychographic factors are not having that much of impact over Consumer satisfaction but education plays a vital role there. As the education level indulge with psychographic factors this starts affecting the individuals’ satisfaction level. Implications of Results & Conclusion
Using data from the Indian Life insurance industry, we empirically test whether the relative
influence on Consumer satisfaction is moderated by Consumer characteristics. We conclude that, the demographic factors we have taken for the purpose of the study are age, gender, marital status, education, income and the research proposes the combined effect of the Psychographic factors with age, gender, marital status, education, and income. the combined effect of the Psychographic factors and age, gender, marital status, education, income do not hamper the level of Consumer satisfaction
so much but if we check the independently age groups effect and individual’s psychographic factors effect on Consumer satisfaction then it take into much account. The Demographics and Psychographics are the factors where we see the very important area to look upon. These factors play an important role in building satisfaction of the consumers in Life insurance industry. Especially Education and Marital Status are the factors who are the key factors. As we see in the analysis that there is a very strong correlation between these two factors and the level of Consumer satisfaction in the life insurance industry and it can be judgemental as the person is awared through his knowledge level as much he is knowledgeable and educated he thinks twice and thrice to purchase a product of any kind. And when he is going to make any investment in the insurance product then he researches a lot, compare the prices, go through all facts and figures related to the product then only he is ready to purchase. And when we talk about the satisfaction level; Education level again affect the same. So as to pacify his or her needs, this should be fulfilling with the purchase. Apart from education, Marital Status is also recognized as a factor which makes an effective impact on the satisfaction level of the consumers. As we all know in India, Marriage is the activity we do for our children to make them responsible towards his/her life, for wife, for children, for parents and also for him/herself. This responsibility leads to the probing nature of the consumers about the product, its outcomes, and the end results of the purchase. So Satisfaction Level comes with outcome of the purchase of insurance product. If end results are giving fruitful outcomes then positive satisfaction level will come otherwise it will create a negative satisfaction that is Dissatisfaction.
Recommendations for Future Researches Consumer satisfaction is the focus of the investigation in this research study. It can be defined as the extent to which consumers perceptions of the life insurance product shopping experience confirm their expectations. Most consumers form expectations of the product, life insurance provider, service, and quality of the product that they patronize before engaging in life insurance product shopping activities. These expectations influence their attitudes and intentions to purchase a life insurance product through a certain agent of Life Insurance Company and consequently their decision-making processes, purchasing behavior and loyalty as well. If expectations are met, Consumers achieve a high degree of satisfaction, which influences their purchase of life insurance offerings, attitudes, intentions, decisions, purchasing activity and loyalty positively. In contrast, dissatisfaction is negatively associated with these variables. As we have discussed the variables which are solely responsible for the level of satisfaction are Marital Status (MS), Income (INC) and Gender (GEN). These cater the situations of dissatisfaction in the purchase and the repeat purchases as well. Managerial Implications On the basis of the conclusion and findings; the life insurance marketer may drive the following implications; 1. Marketer should go for target marketing on the basis of socio- economic variables, than a consideration of the income, marital status, education and age of the buyer.
2. The independent age groups effect and individual’s psychographic factors effect on Consumer satisfaction then it take into account. So marketers should try and make up strategies to fulfill the needs of every age-group separately. 3. The independent income groups effect and individual’s psychographic factors effect on Consumer satisfaction then it take into account. So marketers should try and make up strategies to fulfill the needs of every income-group separately. 4. Marketer should cater the life insurance products to the Consumers after complete information about them like education, income, marital status, past experiences etc. 5. Higher the education level, higher the satisfaction level. So education can be the most important criterion for the marketer to study their Consumers. 6. If a Consumer is a married person, he is more inclined towards purchase of life insurance product; so always try to trap up the married person and through proper and quality service retain them. 7. While dealing with this study we found the insurance companies should take care of gender category of the Consumer. Thus insurance companies should have different strategies for male and female Consumers.
References
1. Barik Bhagabat (2012), “Consumer Expectation about insurance product In Indian Life Insurance Industry”, International Journal of Business and Management Tomorrow, Vol. 2 No. 2 (Online).
2. Gliem Joseph A. and Gliem Rosemary R.(2003); ‘Calculating, Interpreting, and Reporting Cronbach’s Alpha Reliability Coefficient for Likert-Type Scales’; Midwest Research to Practice Conference in Adult, Continuing, and Community Education.
3. Negi Divya & Singh Praveen (2012), “Demographic Analysis of Factors Influencing Purchase of Life Insurance Products in India”, European Journal of Business and Management, Vol 4, No.7, (Online)
4. Parasuraman A(1991)., Marketing Services: Competing Through Quality., New York: The Free Press. 5. Srivastava Mukesh and Singh Amit Kumar (2010); ‘A Two- Dimensional study of LIC of India and
HDFC Standard Life Insurance’; VSBM Journal-‘WISDOM’; Vol. 2 ;Issue No. 1 6. Srivastava Mukesh (2013), Medhavi Sanjay and Mishra Priyatosh ; “Application of SERVQUAL in Life
Insurance Organizations”; SDIMT MANAGEMENT REVIEW: A Bi-Annual National Referred Management Journal, Vol. 1, Issue No. 1, January 2013; Pg No.:85-94
7. Srivastava Mukesh (2015), Personal Factors Relation with Customer Satisfaction In Indian Life Insurance Industry”, SAARANSH RKG Journal of management, An International Bi-Annual Refereed Research Journal, Ghaziabad, UP, Vol 6 No.2, Pg 41-56
8. Srivastava Mukesh (2015), Consumer Psychographics and its relationship with satisfaction, International Journal of Management and Social Sciences, Vol.03, Issue-07, Pg 124-131
9. Srivastava Mukesh, Medhavi Sanjay and Rawat Narendra Singh (2012) ; “A Descriptive study of Factors of Consumer Satisfaction with special reference to Indian Life insurance Industry”; ‘SYNERGY; Journal of ITS, Mohan Nagar Ghaziabad, Volume 10, Issue No. 1,Pg No.: 23-43
10. Zeithaml Valarie A, Gremler Dwayne D, Bitner Maru Jo, Pandit Ajay(2010); Chapter: Consumer Perception of Service; Book: ‘Services marketing; Integrating Consumer focus across the firm’; Pg: 114-118; Tata Mc Graw Hill; 9th edition