125
PERSONALITY, COPING AND EMOTIONAL OUTCOME AFTER BRAIN INJURY. Kit Malia Thesis submitted for the Degree of Doctor of Philosophy DECEMBER 1993 DEPARTMENT OF PSYCHOLOGY UNIVERSITY OF SURREY

PERSONALITY, COPING AND EMOTIONAL OUTCOME AFTER BRAIN INJURY.
Kit Malia
Thesis submitted for the Degree of Doctor of Philosophy
DECEMBER 1993 DEPARTMENT OF PSYCHOLOGY
UNIVERSITY OF SURREY

1
ABSTRACT The relationships between personality, coping and emotional outcome after
brain injury were explored using a longitudinal study design. A selection of self
rating questionnaires were completed by the subjects, relatives and a matched
control group. The first study examined the relationships between psychosocial outcome
(measured at 2.5 years post injury) and selected personality attributes (locus
of control, easy going disposition, neuroticism, extroversion, use of humour and
optimism). Personality was measured at 6 monthly intervals post injury and a
retrospective pre injury measure was also included. All variables (except for
locus of control and optimism) were consistently significantly related at all
stages post injury. However no pre injury personality variables were related to
psychosocial outcome. The second study established a factor structure for the Ways of Coping
Checklist. The 4 factors of problem focused, emotion focused, avoidance
coping and wishful thinking were used in subsequent analyses. The third study explored the relationships between personality attributes and
coping style, and between coping style and psychosocial outcome, in an
attempt to establish coping style as a moderator variable on the relationships found in the first study. It also examined how much prediction of psychosocial
outcome was possible from coping style and personality attributes. Significant relationships were found between all of the post injury personality
attributes (except for locus of control) with use of avoidance and wishful
thinking coping strategies. Less use of avoidance coping was also significantly
related to better psychosocial outcome. Between 30-40% of psychosocial
outcome was predicted by post injury personality variables, and the inclusion
of coping in the analysis did not significantly increase this prediction - indicating
that coping does not act as a moderating variable. Reasons for these results
are discussed.

ii
Copyright. Kit Malia 1993

iii
ACKNOWLEDGEMENTS Thanks are due to my supervisor, Graham Powell, for his guidance
throughout the study, to Sean Hammond for his invaluable advice, to Stewart
Torode, Consultant in charge Royal Air Force Headley Court, for his support,
and to past and present Commanding officers of RAF Headley Court.

iv
TABLE OF CONTENTS
ABSTRACT i ACKNOWLEDGEMENTS iii TABLE OF CONTENTS iv LIST OF TABLES vii LIST OF FIGURES xi LIST OF APPENDICES xii
1. REVIEW OF THE LITERATURE 1.1 Psychosocial function
1.1.1 Definition 1 1.1.2 Effects on rehabilitation outcome 1 1.1.3 Incidence of psychosocial problems 1 1.1.4 Psychosocial changes over time 2 1.1.5 Psychosocial dysfunction as a result of
brain injury 2 1.1.6 Measurement of psychosocial function 3 1.1.7 Conclusion 4
1.2 Personality and psychsocial function 1.2.1 Introduction 4 1.2.2 Importance of personality 4 1.2.3 Relationship between personality and
psychsocial function 5 1.3 Injury related variables and psychosocial
function 6 1.4 Coping skills and psychosocial function
1.4.1 Adjustment as an explanation for psychosocial problems 8
1.4.2 What is coping? 8 1.4.3 Coping and psychosocial function after
brain injury 10 1.5 Conclusion 12 1.6 Basic research questions 13
2. RESEARCH REPORT OVERVIEW 2.1 Introduction 14 2.2 Overview of the study structure 14 2.3 Method
2.3.1 Design 15 2.3.2 Subjects 16 2.3.3 Controls 18 2.3.4 Time post injury 20 2.3.5 Procedures 22 2.3.6 Measures 23 2.3.7 Analysis 29

V
3. STUDY ONE: EXPLORING THE RELATIONSHIPS OF INJURY RELATED AND PERSONALITY ATTRIBUTES TO PSYCHOSOCIAL OUTCOME AFTER BRAIN INJURY
3.1 Introduction and summary of the problem 3.1.1 Introduction 30 3.1.2 Questions to be addressed 31
3.2 Method 3.2.1 Measures used 31
3.3 Analysis and results 3.3.1 Distribution 32 3.3.2 Comparisons between subjects and 33
controls 3.3.3 Reliability 35 3.3.4 Accuracy of self reports 36 3.3.5 Changes between pre and post tauma
personality ratings 39 3.3.6 Personality and injury related factors
with psychosocial outcome 46 3.4 Discussion
3.4.1 Insight 51 3.4.2 Personality changes 52 3.4.3 Injury related factors with
psychosocial outcome 52 3.4.4 Personality variables with
psychosocial outcome 53
4. STUDY TWO: ESTABLISHING THE FACTOR STRUCTURE FOR THE WAYS OF COPING CHECKLIST
4.1 Introduction and statement of the problem 4.1.1 Introduction 57 4.1.2 Questions to be addressed 58
4.2 Method 4.2.1 Measures used 58 4.2.2 Procedures 58
4.3 Analysis and results 58 4.4 Discussion 61

vi
5. STUDY THREE: EXPLORING THE RELATIONSHIPS OF INJURY RELATED VARIABLES AND PERSONALITY TO COPING STYLE, AND COPING STYLE TO PSYCHOSOCIAL OUTCOME
5.1 Introduction and summary of the problem 5.1.1 Introduction 62 5.1.2 Summary of the problem 64
5.2 Method 5.2.1 Measures used 65 5.2.2 Procedures 65
5.3 Analysis and results 5.3.1 Reliability and distribution 65 5.3.2 Personality and injury related
variables with coping skills 65 5.3.3 Coping style and psychosocial outcome 69 5.3.4 Prediction of psychosocial outcome 71 5.3.5 Coping as a moderator variable 77
5.4 Discussion 79
6. CONCLUSIONS AND RECOMMENDATIONS 6.1 Summary of findings 84 6.2 Recommendations 86 6.3 Conclusion 86
REFERENCES 87
APPENDICES 96

vii
LIST OF TABLES
Table 1: A list of questionnaires used and who they were sent to. 23
Table 2: 2-Tailed Pearson Correlations between the psychosocial rating scale and the HADS, SAM and BDI. 25
Table 3: Means and standard deviations for post trauma psychosocial, cognitive, executive and physical function ratings 32
Table 4a: Comparison between subject and control ratings on easy going disposition 33
Table 4b: Comparison between subject and control ratings on optimism 33
Table 4c: Comparison between subject and control ratings on neuroticism 33
Table 4d: Comparison between subject and control ratings on physical function 34
Table 4e: Comparison between subject and control ratings on secondary appraisal 34
Table 4f: Comparison between subject and control ratings on problem focused coping 34
Table 5: Cronbach alpha scores of reliability for all measures 35
Table 6a: Accuracy of awareness. Comparing ratings between subjects and relatives using 2-Tailed T-Tests 36
Table 6b: Accuracy of awareness. Comparing ratings between subjects and relatives using amount of discrepancy and Pearson Correlations 38
Table 7: Comparisons between pre and post trauma personality ratings for participants in the longitudinal study design. 40
Table 8a: Changes in easy going disposition between 6 and 12 months post brain injury 40
viii
Table 8b: Changes in locus of control between 6 and 12 months post brain injury 41
Table 8c: Changes in optimism between 6 and 12 months post brain injury 41
Table 8d: Changes in neuroticism between 6 and 12 months post brain injury 41
Table 8e: Changes in extroversion between 6 and 12 months post brain injury 41
Table 8f: Changes in use of humour between 6 and 12 months post brain injury 42
Table 9a: Changes in easy going disposition between 12 and 18 months post brain injury 42
Table 9b: Changes in locus of control between 12 and 18 months post brain injury 42
Table 9c: Changes in optimism between 12 and 18 months post brain injury 42
Table 9d: Changes in neuroticism between 12 and 18 months post brain injury 43
Table 9e: Changes in extroversion between 12 and 18 months post brain injury 43
Table 9f: Changes in use of humour between 12 and 18 months post brain injury 43
Table 1Oa: Changes in easy going disposition between 18 and 24 months post brain injury 43
Table 1Ob: Changes in locus of control between 18 and 24 months post brain injury 44
Table 10c: Changes in optimism between 18 and 24 months post brain injury 44
Table 1 Od: Changes in neuroticism between 18 and 24 months post brain injury 44
Table 1 Oe: Changes in extroversion between 18 and 24 months post brain injury 44
Table 1Of: Changes in use of humour between 18 and 24 months post brain injury 45

ix
Table 11 a: Changes in easy going disposition between 24 and 30 months post brain injury 45
Table 11 b: Changes in locus of control between 24 and 30 months post brain injury 45
Table 11 c: Changes in optimism between 24 and 30 months post brain injury 45
Table 11 d: Changes in neuroticism between 24 and 30 months post brain injury 46
Table 11 e: Changes in extroversion between 24 and 30 months post brain injury 46
Table 11f: Changes in use of humour between 24 and 30 months post brain injury 46
Table 12a: The relationship of pre trauma personality and injury related variables to psychosocial outcome. Ratings by subjects in the longitudinal study 47
Table 12b: The relationship of post trauma personality and injury related variables to psychosocial outcome. Ratings by subjects in the longitudinal study 48
Table 13a: The relationships of pre trauma personality and injury related variables to psychosocial outcome. Ratings by subjects in the cross sectional study 49
Table 13b: The relationships of post trauma personality and injury related variables to psychosocial outcome. Ratings by subjects in the cross sectional study 50
Table 14: Principal Components Factor Analysis on the psychosocial rating scale. 55
Table 15a: The relationship of pre trauma personality and injury related variables to coping skills. Ratings by subjects in the longitudinal study 67
Table 15b: The relationship of post trauma personality and injury related variables to coping skills. Ratings by subjects in the longitudinal study 68

X
Table 16: Two tailed Pearson Correlations between coping at each time point post injury and psychosocial outcome. Ratings by subjects from the longitudinal study 70
Table 17: Two tailed Pearson Correlations between coping style and psychosocial outcome. Ratings by subjects from the cross sectional study design 71
Table 18: Regression to predict psychosocial outcome, using post trauma personality at 6 months post injury 72
Table 19: Regression to predict psychosocial outcome, using post trauma personality at 12 months post injury 73
Table 20: Regression to predict psychosocial outcome, using post trauma personality at 18 months post injury 73
Table 21: Regression to predict psychosocial outcome, using post trauma personality at 24 months post injury 74
Table 22: Regression to predict psychosocial outcome, using post trauma personality at 30 months post injury 74
Table 23: Regression to predict psychosocial outcome, using injury related variables at 12 months post injury 75
Table 24: Regression to predict psychosocial outcome, using injury related variables at 18 months post injury 75
Table 25: Regression to predict psychosocial outcome, using injury related variables at 24 months post injury 76
Table 26: Regression to predict psychosocial outcome, using injury related variables at 30 months post injury 76

xi
LIST OF FIGURES
Figure 1: Numbers of subjects at each of the 6 monthly assessments in the longitudinal study
Figure 2: Spatial plots computed by the analysis programme ALSCAL -a multidimensional scaling technique
Figure 3: A graphical representation of the transactional process model of coping
21
60
63

xii
LIST OF APPENDICES
A: PSYCHOSOCIAL RATING SCALE 96
B: WAYS OF COPING CHECKLIST 97
C: PRIMARY AND SECONDARY APPRAISAL SCALES 99
D: LOCUS OF CONTROL RATING SCALE 100
E: USE OF HUMOUR RATING SCALE 103
F: OPTIMISM RATING SCALE 104
G: EASY GOING DISPOSITION SCALE 104
H: EYSENCK PERSONALITY INVENTORY 105
I: COGNITIVE, EXECUTIVE AND PHYSICAL RATING SCALES 108
J: CONTRIBUTIONS OF COPING ITEMS TO FACTOR
STRUCTURE 109
K: PAPERS FROM THIS INVESTIGATION 112
1
1. REVIEW OF THE LITERATURE
1.1 Psychosocial function
1.1.1 Definition
Psychosocial function is a term which is commonly found in brain injury
literature. However it is usually used in a generalised way with little attempt to
define it (Dikmen, Machamer and Temkin 1993). Psychosocial function
encompasses those aspects of human behaviour relating to social interaction
and emotions (Tate, Lulham, Broe et al 1989).
1.1.2 Effects on rehabilitation outcome
Recently psychosocial dysfunction has been highlighted as the most
problematic long term difficulty after brain injury (Ben-Yishay and Diller 1983,
Prigatano, Fordyce, Zeiner et al 1984, Livingston, Brooks and Bond 1985a,
Weddell, Oddy and Jenkins 1980, Thomsen 1984), often leading to failure in
returning to employment and inadequate personal adjustment - two commonly
used indicators of outcome (Brooks et al 1987, Johnston 1992, Cope, Cole,
Hall and Barkan 1992). It can also lead to chronic marital distress and
breakdown (Peters et al 1990, Rosenbaum 1976, Thomsen 1974).
1.1.3 Incidence of psychosocial problems
It is reported that between 40 - 75% of severely (Glasgow Coma Scale score
of <8 [Teasdale and Jennett 1976]) brain injured people present with
psychosocial problems 6-8 years post injury (Tate et al 1989, Oddy, Coughlan,
Tyerman and Jenkins 1985). However incidence varies markedly between
individuals, with 24% showing few problems, 43% showing some problems and
33% showing major problems at 6 years post injury (Tate et al 1989). It is
2
unclear why some individuals do better than others, although injury related
variables, personality and coping skills are all believed to be important
(Alexander et al 1983, Klonoff et al 1986, Levin et al 1979, Rimel et al 1981,
Rimel et al 1982). The current study is designed to examine the relationships
between these variables in an attempt to develop greater understanding in this
domain.
1.1.4 Psychosocial changes over time
It is unclear whether psychosocial function worsens with increasing time post
injury as claimed by Fordyce, Roueche and Prigatano (1983) in a2 year cross
sectional study, or whether improvements can be noted, as suggested by
Dikmen et al (1993) in their 2 year longitudinal follow up. The majority of
research in this area has not been prospective in design, making it difficult to
draw conclusions on changing patterns of psychosocial function (Weddell et al
1980, Oddy et al 1985). The current study includes both cross sectional and
prospective longitudinal designs.
1.1.5 Psychosocial dysfunction as a result of brain injury
Very few studies use a matched control group, and yet it is commonly
assumed that psychosocial dysfunction is a result of brain injury. A noteable
exception is the 2 year follow up by Dikmen et al (1993) which reports worse
psychosocial function for the brain injured group compared with the control
group. However their selection of controls was apparently done on the grounds
of demographic characteristics only. McKinlay and Brooks (1984) lay down the
ideal characteristics of a control group in brain injury studies. Essentially the
ideal control group should be well matched in all respects except for the brain

3
injury itself. Thus the following criteria should be met:
a) Age, sex, years in education and time post injury should all be
matched.
b) Subjects should be drawn from a similar 'at risk' population to ensure
similar preinjury status.
c) The injury sustained should threaten life in a proportion of cases.
d) The disability should be significant enough to cause the possibility of
adverse psychological reactions.
The current study therefore incorporates an appropriate well matched control
group.
1.1.6 Measurement of psychosocial function
Psychosocial function is described as a personal attribute (Dikmen et al
1993). It is perhaps surprising, then, how ready researchers have been to
ignore the use of self report scales when examining this area. The most
commonly cited reason for this is the supposed insight problems of brain
injured people (Burke, Smith and Imhoff 1989). Although there is some
evidence for this view (Brooks et al 1987), there is also evidence that brain
injured people as a group are as accurate as relatives in their reports on
psychosocial function (Dikmen et al 1993, Tyerman and Humphrey 1984). It
should be remembered that both the relatives and the subjects may perceive
or report on psychosocial function inaccurately.
One way of measuring accuracy of insight more effectively is to use controls
for comparison. This has generally not been done, making it difficult to state
that self reports from brain injured people should be treated any differently to

4
self reports from non neurologically injured people. An exception to this being
the study by Dikmen et al (1993) - which actually concludes that self reports
can be relied on in this subject group. Roueche and Fordyce (1983)
recommend the use of self report and relative report scales since both may be
inaccurate. The belief that brain injured patients are lacking in insight is too
simplistic a statement to justify ignoring their self reports. The current study
therefore makes use of relative and subject ratings.
1.1.7 Conclusion
Most of the literature on psychosocial function after brain injury just describes
it or else focuses on the effects on the family (Brooks, Campsie, Symington et
al 1986, Livingston, Brooks and Bond 1985a, Livingston, Brooks and Bond
1985b). Psychosocial dysfunction can have a significant adverse effect on
rehabilitation outcome and so it is important to develop an understanding of its
determinants and moderators in order to help direct the work of rehabilitation
services.
1.2 Personality and psychosocial function
1.2.1 Introduction
Families of brain injured survivors report more personality changes than any
other problems at both 1 and 5 years post injury (Brooks et al 1986), and often
consider these to be the most distressing aspect of the injury (Ranseen 1990).
1.2.2 Importance of personality
It is widely accepted that both pre and post trauma personality characteristics
are important factors in the development of psychosocial problems (Prigatano

5
1986, Brooks 1984, Rosenthal 1983, Slagle 1990, Miller 1991, Lishman 1968,
Lezak 1989, Cohadon 1981), but there is little empirical research which has
focused on how they are linked, or, indeed, if they really are linked at all
(Prigatano 1986,1992, Brooks 1991).
Personality is defined as patterns of emotional and motivational responses
that develop during our lifetime; these are highly influenced by early life
experiences, are modifiable, although with difficulty, and greatly influence (and
are influenced by) cognitive processes (Prigatano, Pepping and Klonoff 1986).
1.2.3 Relationships between personality and psychosocial function
Personality is not a unitary concept, but is rather comprised of a large
number of different aspects. Reports in the literature dealing with other
common health problems, such as heart disease, stress and burns indicate the
following personality aspects are consistently related to better psychosocial
function: more internal locus of control (Holahan and Moos 1987, Tanck and
Robbins 1979, Anderson 1979, Bulman and Wortman 1977, Lefcourt, Miller,
Ware and Sherk 1981, Basgall and Snyder 1988, Parkes 1984, Shadish et al
1981, Revenson and Felton 1989), greater ability to use humour (Martin and
Lefcourt 1983, Nezu, Nezu and Blissett 1988), greater optimism (Scheier and
Carver 1983,1985), a more easy going disposition (Hinckle 1974, Matthews
1982, Holahan and Moos 1985,1986,1987), and greater extroversion and less
neuroticism (Eysenck 1970, Eysenck and Eysenck 1975, Lynn 1981, McCrae
and Costa 1986, Parkes 1986).
There is very little reported literature in the brain injury field which examines
the relevance of personality in such terms. Two notable exceptions to this both
focussed on the significance of locus of control. Both reports indicate that
6
internal locus of control post injury (the belief that things which happen are
under the individual's personal control) is associated with a significantly lower
incidence of mood disturbances and a trend to be less depressed after brain
injury (Moore and Stambrook 1992, Stephens 1991). However the cross
sectional design does not allow causal direction to be attributed - are these
individuals less depressed because they have a more internal locus of control,
or do they have a more internal locus of control because they are less
depressed?
Finally, although personality changes post brain injury are commonly
described (Stern 1985, Lishman 1968, Slagle 1990, Mauss-Clum and Ryan
1981, Prigatano 1992), there seem to be no studies which examine the
differential significance of pre and post trauma personality on psychosocial
function. It is therefore very difficult to make informed judgements on the
relevance of pre compared with post trauma personality.
The current study has been designed to deal with these shortcomings.
1.3 Injury related variables and psychosocial function.
Location of injury is generally regarded as an important variable in outcome.
Perhaps the most obvious example of this is when the frontal lobes are
damaged - often resulting in severe insight problems and poor outcome
(Eslinger and Domasio 1985, Bergquist and Jacket 1993). The problem of
localising symptoms to certain brain structures or functions following brain
injury is an ongoing task. Some progress has been made in this direction,
however it is increasingly being realised that closed brain injury involves
several parts of the brain, either on a gross observable level (via CT scans etc)
or on a diffuse microscopic level. This makes it very difficult to study localised

7
brain injury effects in this group of subjects.
Severity of injury, as measured by duration of coma and post traumatic
amnesia (PTA) is another important variable commonly related to outcome
(Ruff, Marshall, Crouch et al 1993, Hinkeldey and Corrigan 1990). However
there is also evidence which fails to demonstrate significant relationships
(O'Carroll, Woodrow and Maroun 1991, Oddy, Humphrey and Utley 1978). An
alternative method of measuring severity is by examining the symptoms
actually experienced by the individual. These symptoms are often
multidimensional in nature. A useful method of categorising and understanding
them is provided by Vogenthaler (1988). He presents four domains of function,
consisting of physical, cognitive, executive and psychosocial functions. The
approach consists of completing symptom rating scales.
Despite a substantial belief in the importance of severity and location of
injury there are few studies relating these variables with psychosocial outcome.
The majority of these report no relationship (Oddy et al 1978, O'Carroll et al
1991) or only weak relationships (Sensky 1990). Although Tate et al (1989) did
find a relationship between severity and psychosocial function they stress that
the level of severity interacts with the subject's lifestyle to achieve the effect -
indicating the possible presence of moderating variables.
The current study incorporates measures of severity based on coma length
and PTA duration as well as symptom severity lists, based on Vogenthaler's
domains. In addition attempts are made to examine location of injury, along
with more general demographic variables such as age and educational level.

8
1.4 Coping skills and psychosocial function
1.4.1 Adjustment as an explanation for psychosocial problems
Several authors have proposed the 'coping hypothesis' as an explanation for
understanding the development of psychosocial problems after brain injury
(Van Zomeren, Brouwer and Deelman 1984, Hinkeldey and Corrigan 1990,
Klonoff et al 1986, O'Shanick 1989). Successful coping results in the situation
where the individual experiences himself as healthy, whereas inadequate
coping skills results in the individual either becoming a passive, stigmatised
dissatisfied spectator of life or to pseudo health, characterised by denial and
disability (Fugel-Meyer and Fugel-Meyer 1988). It is possible that coping may
act as a moderating variable in the relationships between personality and injury
related variables with psychosocial outcome.
1.4.2 What is coping?
Coping strategies have been the focus of a substantial body of research
since the early 1980's following Lazarus and Folkman's development of the
process oriented transactional model. Lazarus and Folkman (1984) defined
coping as constantly changing cognitive and behavioural efforts to manage
specific external and/or internal demands that are appraised as taxing or
exceeding the resources of the person. Their model emphasised the role
played by cognition, through the processes of cognitive appraisal and
reappraisal and the dynamic interactive nature of coping.
Primary appraisals are made concerning what is at stake, and secondary
appraisals are made concerning what can be done and how effective this might
be. Given the kinds of problems often seen after brain injury it is likely that
these processes may be unreliable in this subject group. For instance Lezak

9
(1978) conceptualises the most problematic characterological alterations into
5 broad and often overlapping categories, all of which could be expected to
effect appraisal skills:
1. Impaired capability for social perceptiveness leading to self centred
behaviour in which empathy, self reflective and self critical attitudes
are greatly diminished.
2. Impaired capability for control and self regulation leading to
impulsivity, random restlessness and impatience.
3. Stimulus bound behaviour showing social dependency, difficulty in
planning and organising, decreased initiative skills and rigidity.
4. Emotional alterations towards apathy, silliness, lability and irritability.
5. A relative inability to profit from experience and social learning.
However it should be noted that not all appraisal approaches are rational.
Edwards and Cooper (1988) posit alternative methods whereby individuals may
select coping strategies, describing them as non-rational processes relying on
heuristics, biases and habits. It has been recognised that under stressful
conditions decision making processes become less rational (Cohen 1980).
Under the conditions imposed by brain injury it is highly likely that non-rational
appraisal will be widely used.
There is widespread agreement on the factor structure of the Ways of
Coping Checklist (WCCL) used originally by Lazarus and Folkman (Tennen and
Herzberger 1985), and on how these factors relate to health outcomes in a
variety of different illnesses, such as cancer, heart disease and burns (Slaby
and Glickman 1985). At its simplest level the factor structure is two dimensional
(Lazarus and Folkman 1984, Folkman and Lazarus 1980): Problem focused
coping - essentially dealing with the problem itself and solutions to it - and
10
emotion focused coping - dealing with the emotional reactions to the problem.
Further work refined these results either by elaborating upon the substructures
found in these two factors (Carver, Scheier and Weintraub 1989, Vitaliano,
Maiuro, Russo and Becker 1987, Scheier, Weintraub and Carver 1986), or by
redefining the factors, for instance active vs avoidance coping (Billings and
Moos 1981) or direct vs suppression coping (Parkes 1984).
Nevertheless it is recommended that factor analysis should be performed
whenever the coping questionnaire is used with new populations to compare
the results with those found in the literature (Tennen and Herzberger 1985).
Problem focused, active and direct coping strategies all relate positively to
better adaptation to health problems in a variety of illnesses (Moos and Billings
1982, Holahan and Moos 1985,1986,1987, Miller, Brody and Summerton
1988, Vitaliano, Russo, Carr et al 1985, Folkman, Lazarus, Gruen and
DeLongis 1986).
1.4.3 Coping and psychosocial function after brain injury.
Despite the extensive literature linking coping with other health related
problems there are few studies relating it with brain injury. Frank, Haut, Smick
et al (1990) compared the coping styles of subjects less than 1 year post injury
with subjects more than 1 year post injury and found the use of information
seeking was the most dominant coping strategy. They conclude that this
probably reflects the problem solving difficulties and inadequacies of integrating
information which are commonly observed as sequelae. The lack of difference
between the 2 groups in their use of coping strategies is explained by
increasing avoidance of emotional processing after the injury. Despite this lack
of difference Willer, Allen, Liss and Zicht (1991) stress the importance of

11
examining adjustment after the first year during which individuals make the
most progress through the various stages of cognitive and physical recovery
and during which they are usually more closely involved with support services.
They report that the coping strategies most commonly used are related to
increasing involvement in family decisions and activities outside the home, as
well as developing greater awareness of limitations. However neither study
establishes the factor structure for this new subject group. The former uses a
factor structure described for rheumatoid arthritic sufferers (Revenson and
Felton 1989) and the latter uses a nominal group technique - similar to
brainstorming - with no reference to standardised assessments.
Further studies (Moore, Stambrook and Peters 1989, Moore and Stambrook
1992) report that brain injured subjects use coping strategies in three
characteristic ways:
1. Relatively indiscriminant use of a large number of strategies.
2. Relatively rigid use of a few unchanging strategies.
3. Relatively little use of any strategies.
Their results demonstrate that high use of coping strategies is related to
greater amounts of emotional and psychosocial difficulties, whereas limited use
is associated with relatively better outcome. However the study is not
longitudinal in design and therefore direction of causality cannot be established.
Individuals may use more coping strategies because they have more problems
rather than vice versa. In addition the study group spans a period of 1-8 years
post injury. No attempt is made to examine whether psychosocial problems or
coping styles alter with time.
Hinkeldey and Corrigan (1990) report a significantly greater use of avoidance
as a method of coping after brain injury when compared to a previously

12
established non neurologically injured group, and conclude that brain injured
people appear to employ coping strategies that are ineffective and may not be
implementing strategies that could be helpful.
All of these studies can be criticised on methodological grounds; none of
them use a prospective longitudinal design, despite the fact that coping is
defined as a dynamic skill which evolves in response to changing
circumstances. Similarly none of the studies use a control group, making it
difficult to attribute coping styles specifically to brain injured people. Also only
the studies by Moore et al (1989) and Moore and Stambrook (1992) attempt
to establish a factor structure for this particular group.
The current study is designed to explore the factor structure in this patient
group and then to use these factors in subsequent exploration of the
relationships between coping, psychosocial outcome and personality.
1.5 Conclusion
It is clear that after brain injury the interaction between injury related factors,
personality, coping and psychosocial function is not well understood and that
a better understanding could be of benefit to the rehabilitation professional.

13
1.6 Basic research questions
1. What are the relationships between pre and post trauma personality and
injury related factors with psychosocial outcome at 2.5 years post injury?
2. What are the relationships between coping and psychosocial outcome at 2.5
years post injury?
3. Does coping skill act as a moderator in the relationship between personality
and injury related factors with psychosocial outcome at 2.5 years post
injury?

14
2 RESEARCH REPORT OVERVIEW
2.1 Introduction
Given the relatively high incidence of psychosocial problems after brain
injury, along with the deleterious long term effects on personal adjustment,
marital happiness and employment, it is important for rehabilitation
professionals to gain a greater understanding of this domain. There is evidence
which indicates that psychosocial function measured at 2 years post injury
remains relatively static for up to 10 years post injury so this point would
appear to be a suitable time to measure it as outcome (Oddy et al 1985,
Dikmen et al 1993, Thomsen 1984). During the following studies psychosocial
function is measured at each of the 6 monthly assessments. These results are
used as a measure of severity of problems. The final measure of psychosocial
function at 2.5 years after injury is referred to as psychosocial outcome.
2.2 Overview of the study structure
Three studies are reported:
1. The first study explores the links between injury related and personality
attributes with psychosocial outcome.
2. The second study establishes a factor structure for the WCCL when used
with brain injured people. These factors are used in subsequent analyses.
3. The third study explores the relationships between injury related and
personality variables with coping, and coping with psychosocial outcome. The
role of coping as a moderator variable is also examined by testing the effect
it has on the prediction of psychosocial outcome using injury related and
personality attributes.
In order to avoid unnecessary repetition in these reports, those

15
methodological aspects which remain the same for each study are reported in
the next section.
2.3 Method
2.3.1 Design
One of the major criticisms of coping studies in relation to a wide variety of
health related problems is the cross sectional design. Coping is a dynamic,
interactive attribute evolving over time (Lazarus and Folkman 1984, Turk,
Sobel, Follick and Youkilis 1980), yet cross sectional designs are static. In
addition a cross sectional design does not permit the observation of direction
of causality between variables. Thus it is not always certain whether ways of
coping are dependent on other processes or vice versa (Edwards and Cooper
1988). Several authors argue for longitudinal designs to overcome this problem
(Edwards and Cooper 1988, DeLongis, Folkman and Lazarus 1988, Lazarus
1978).
A longitudinal design was therefore used. Given the exploratory nature of
these studies an initial examination using a cross sectional design was also
employed. Comparison between the results obtained from each of these
designs was performed.
A general criticism of studies in the field of brain injury is the lack of suitable
controls (McKinlay and Brooks 1984), making it difficult to attribute post trauma
sequelae specifically to the brain injury. Suitable controls should match in all
respects other than the brain injury itself (McKinlay and Brooks 1984). When
controls are used in studies they tend to be matched solely on demographic
comparisons. This is partly due to the difficulties in obtaining suitable groups.
At Royal Air Force Headley Court there is a large group of patients who are
16
well matched as controls for this group. The controls were obtained from these
patients.
2.3.2 Subjects
102 consecutive admissions to the neurological rehabilitation group (NRG)
at Royal Air Force Headley Court were invited to take part in the study
(excluding all subjects who could not comprehend the questionnaire due to
severe language disruption). 74 of these were able to participate initially in the
cross sectional study -a positive response rate of 73%. 14 dropped out during
the course of the 30 month study, leaving 60 subjects in the longitudinal study.
Reasons for not taking part varied between a reluctance to commit participation
to a2 year study to moving to a new address which I was unable to trace.
Drop out occurred due to non response to mailed questionnaire and telephone
follow ups. It was not possible to pursue reasons in more detail.
The following descriptive information is described for the subjects in the
longitudinal design study, figures for subjects in the cross sectional study
design are given in square brackets.
Severity of injury, as measured by duration of coma (average 9 days, range
0-84 days) [average 7 days, range 0-84 days] and duration of PTA (average
28 days, range 0-140 days) [average 26 days, range 0-140 days], ranged from
mild to very severe. Glasgow coma scale scores were unavailable in the
majority of cases, and so consequently this measure was not used in the
analysis of severity.
Mean age for the subjects was 27.5 years (range 16-49) [27.4 years (range
16-54]. Mean age of leaving school was 16.5 years (range 15-24) in both study
design groups.
17
Of the 59 [72] males and 1 [2] females 21 (35%), [27,36%] were married,
37 (62%), [44,60%] single and 2 (3%), [3,4%] were divorced. Occupational
status was broken into 6 categories, with managerial level accounting for 10%
[8%] of the group, sales/professional for 15% [16%], clerical for 20% [20%],
blue collar for 50% [51 %], student for 2% [2%] and unemployed for 3% [3%].
Road traffic accident in a vehicle, CVA and road traffic accident as a
pedestrian accounted for 78% [77%] of all the injuries (55% [54%], 13%
[13.5%] and 10% [9.5%] respectively). The remaining causes of injury were
carbon monoxide poisoning, hyperpyrexia, hypoxaemia, assault,
decompression sickness, falls, falling objects, infections and boxing injuries.
Although the subjects were obtained from a military environment the causes
of injury were much the same as those generally reported in civilian
populations.
Information regarding sites of injury was collated from written interpretations
of CT scans in the medical records. Results can be divided into 3 categories:
a) 40% [36%] of the subjects had generalised diagnoses (closed head injury
28% [26%], oedema 12% [10%] and 15% [14%] were undiagnosed, b) 22%
[23%] were given diagnoses involving 2 or more areas of the brain (there was
some known frontal involvement in 54% [53%] of these cases, and known
parietal involvement in 23% [35%] of these cases), and c) 23% [27%] were
given diagnoses involving only 1 area of the brain (frontal damage occured in
29% [28%] of these cases and localised CVA's in 43% [42%]).
18
2.3.3 Controls
The majority of brain injury studies have not used controls. McKinlay and
Brooks (1984) point out the dangers of attributing post injury sequelae
specifically to brain injury in the absence of controls; for instance subjects who
are readusting after other types of injury may also present with psychosocial
difficulties.
The ideal control group should be matched in all respects except for the
brain injury itself (McKinlay and Brooks 1984). In order to meet this criterion as
fully as possible a control group was obtained from the same type of at risk
population, from consecutive admissions to the non-neurological rehabilitation
facilities at Headley Court. This group included a significant number of
individuals who had suffered a life threatening and disfiguring injury; all
individuals had to enter Headley Court for a period of rehabilitation and all
experienced a long term or permanent reduction in sporting capabilities -
necessitating varying amounts of personal adjustment given the high profile of
sport and physical fitness in the Armed Services generally.
46 of the 75 patients approached were able to participate in the cross
sectional study, a positive response rate of 61 %. During the course of the 30
month study 21 of these patients dropped out, leaving 25 control subjects in
the longitudinal study. Drop out occurred mainly due to changes of address
which I was unable to locate in the absence of forwarding addresses.
The following descriptive information is provided for controls in the
longitudinal study design; results for controls in the cross sectional design are
presented alongside in squared brackets.
23 (92%) [44,96%] of the controls were male, and 2 (4%) [2,4%] were
female; 10 (40%) [14,30%] were married and 15 (60%) [32,70%] were single.

19
The mean age was 26.7 years (range 17-43) [25.7 years, range 17-43], and
the mean age of leaving education was 17.3 years (range 15-22) [17.2 years,
range 15-22]. There were no significant differences between the brain injured
subjects and controls on these descriptive variables. No PTA or coma was
experienced by this group.
Occupational status is broken into 6 categories, with managerial level
accounting for 0% [0%] of the group, sales/professional for 22% [29%], clerical
for 58% [44%], blue collar for 20% [26%], student for 0% [1 %] and unemployed
for 0% [0%]. These were statistically non significant when compared with the
subjects.
There were 8 causes of injury in the control group: sport (60%) [50%], road
traffic accident (24%) [22%], bomb blasts (8%) [10%], falls (0%) [4%], plane
crashes (4%) [4%], horse riding falls (4%) [4%], parachute injuries (0%) [4%],
and aircraft ejection injuries (0%) [2%]. 32% [20%] of all injuries resulted in a
disfigurement of some kind (amputation, brachial plexus lesion or burns).
The subject and control group were well matched for age, sex, length of time
post injury, marital status, occupation and years in education.

20
2.3.4 Time post injury
In the cross sectional study design each participant was grouped according
to length of time post injury. This resulted in 5 groups at 6 monthly intervals
post injury, up to a point 30 months post injury. Groups 1 (n=22), 2 (n=17), 3
(n=12), 4 (n=16) and 5 (n=7) were statistically matched with each other for
age, sex, years in education, occupation, marital status, PTA, coma and cause
of injury.
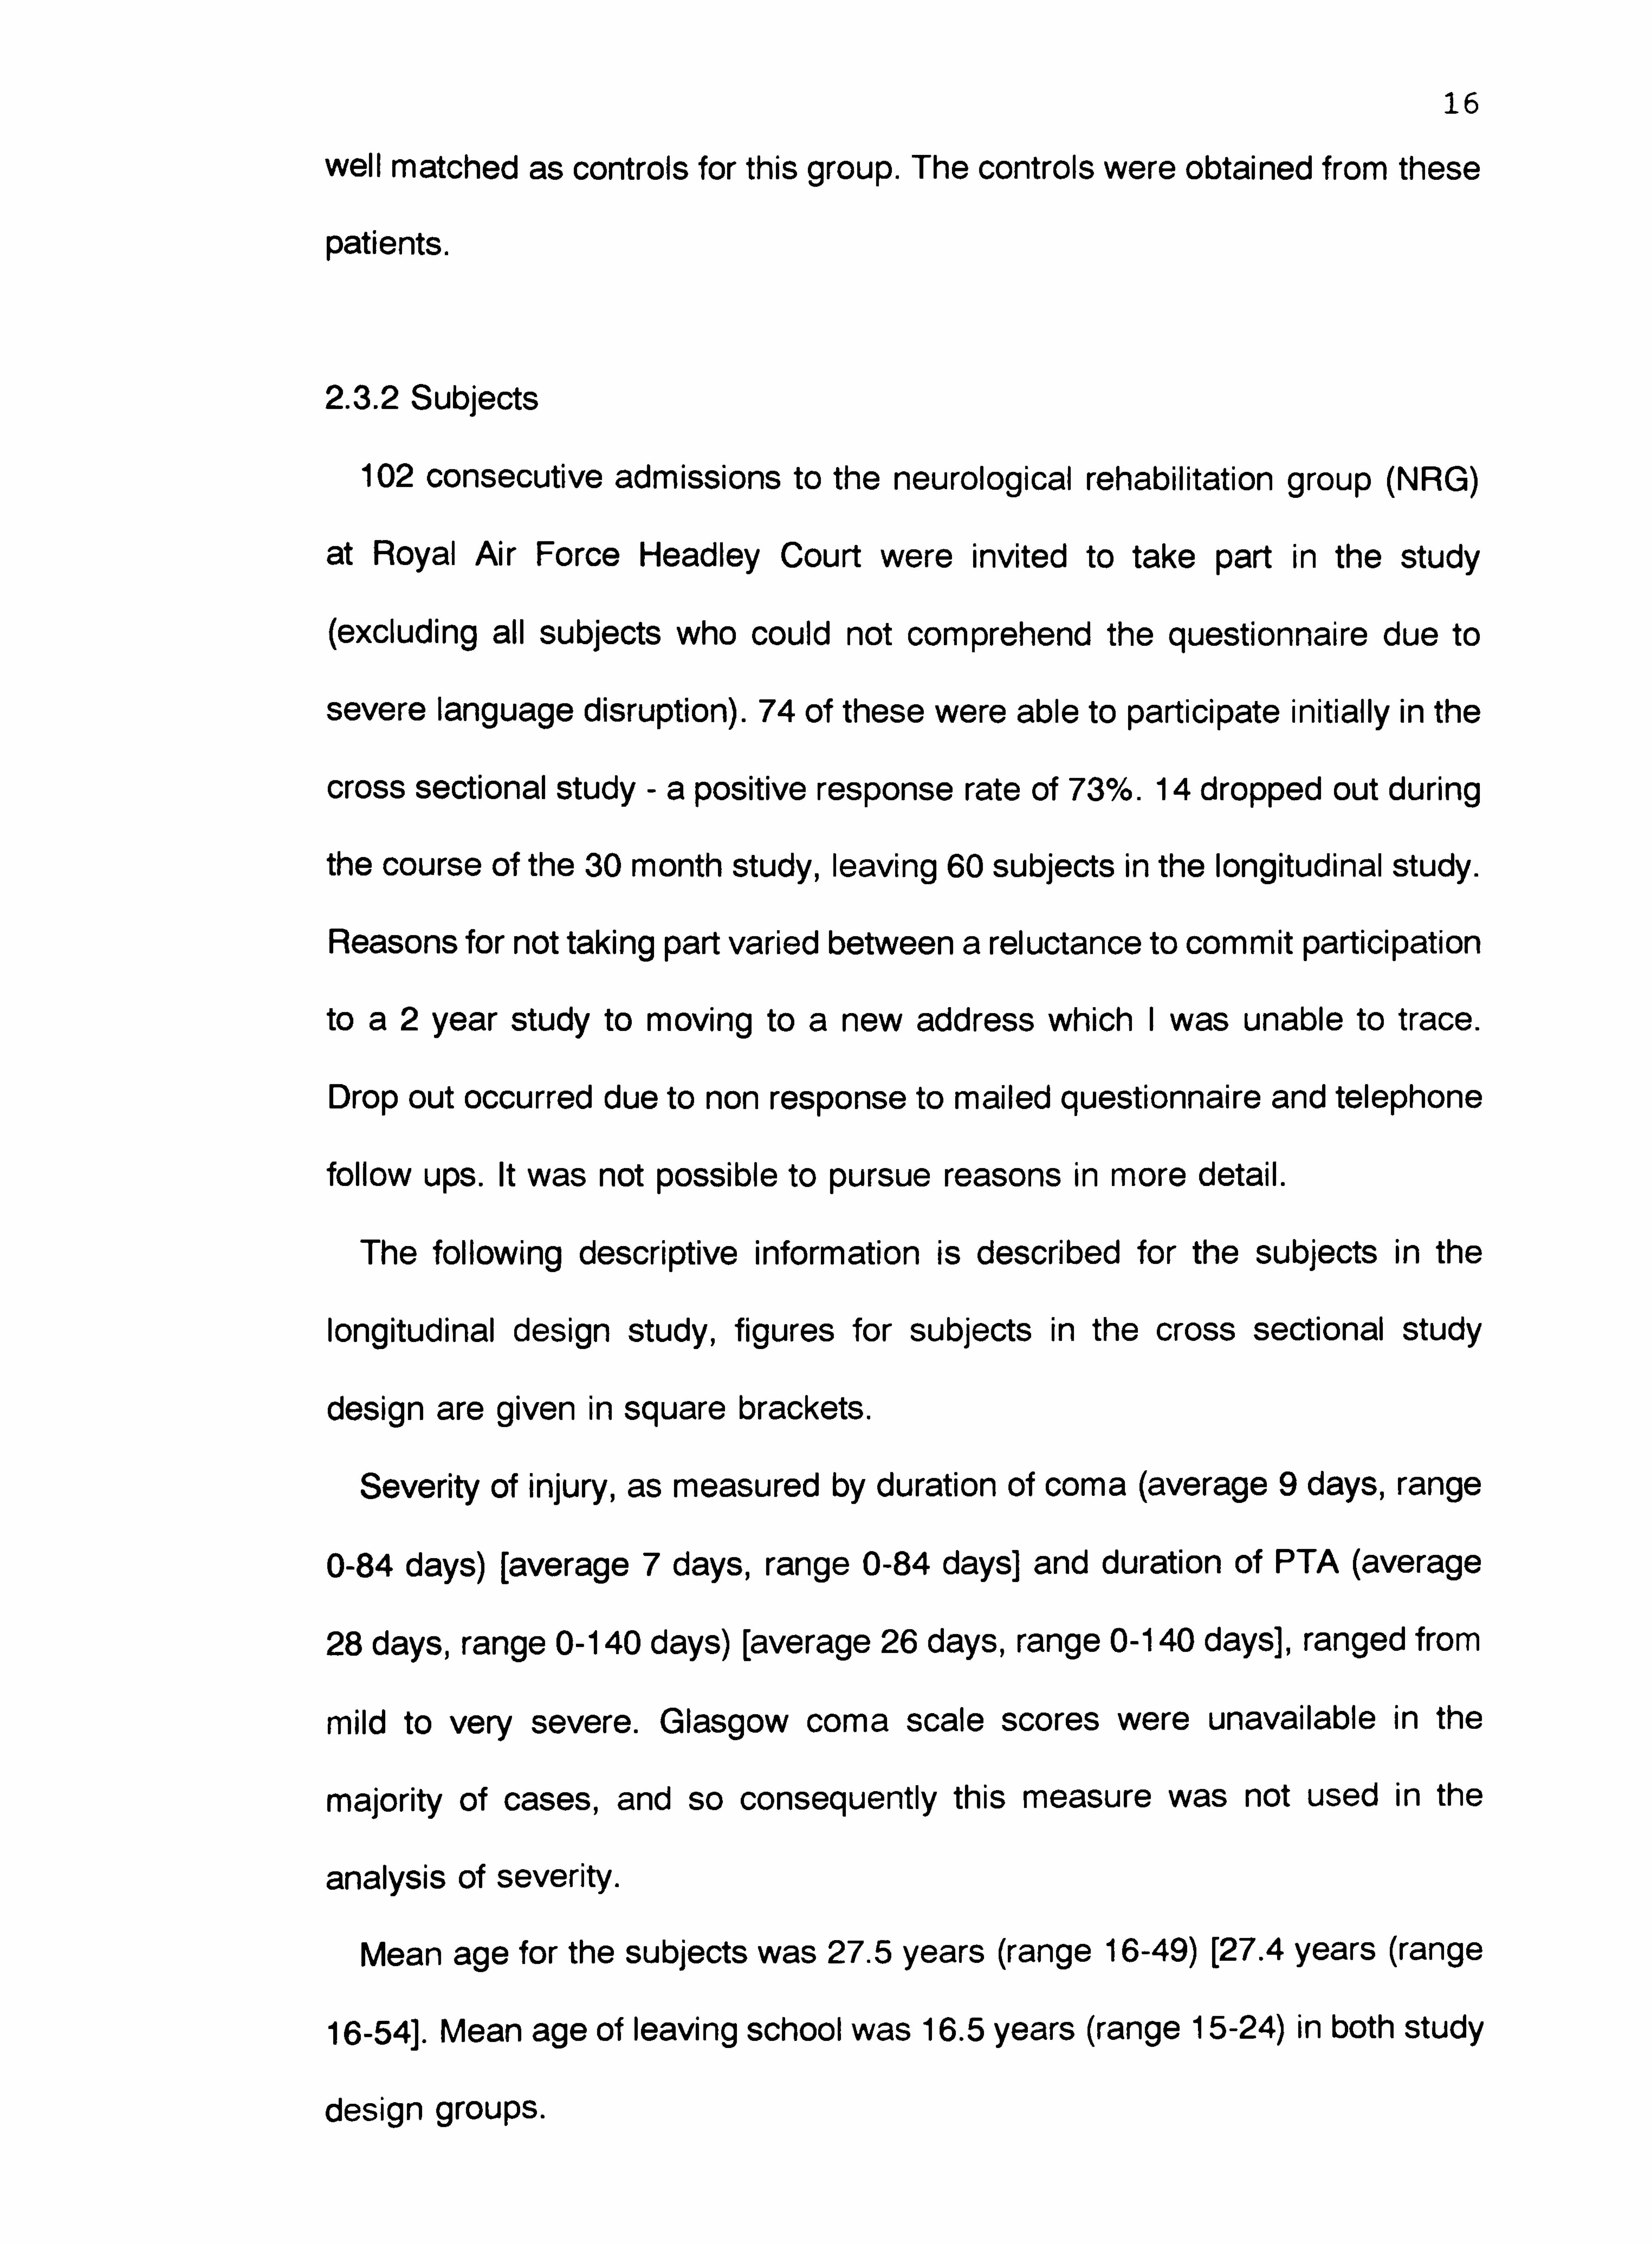
In the longitudinal study design each subject and control was studied at 6
monthly intervals to a point 30 months post injury. Participants in the subject
group were obtained at different time points post injury, in order to maximise
numbers in the study, whereas the control group were all studied for the full 30
month period. Figure 1 illustrates the numbers of subjects at each of the 6
monthly assessments.
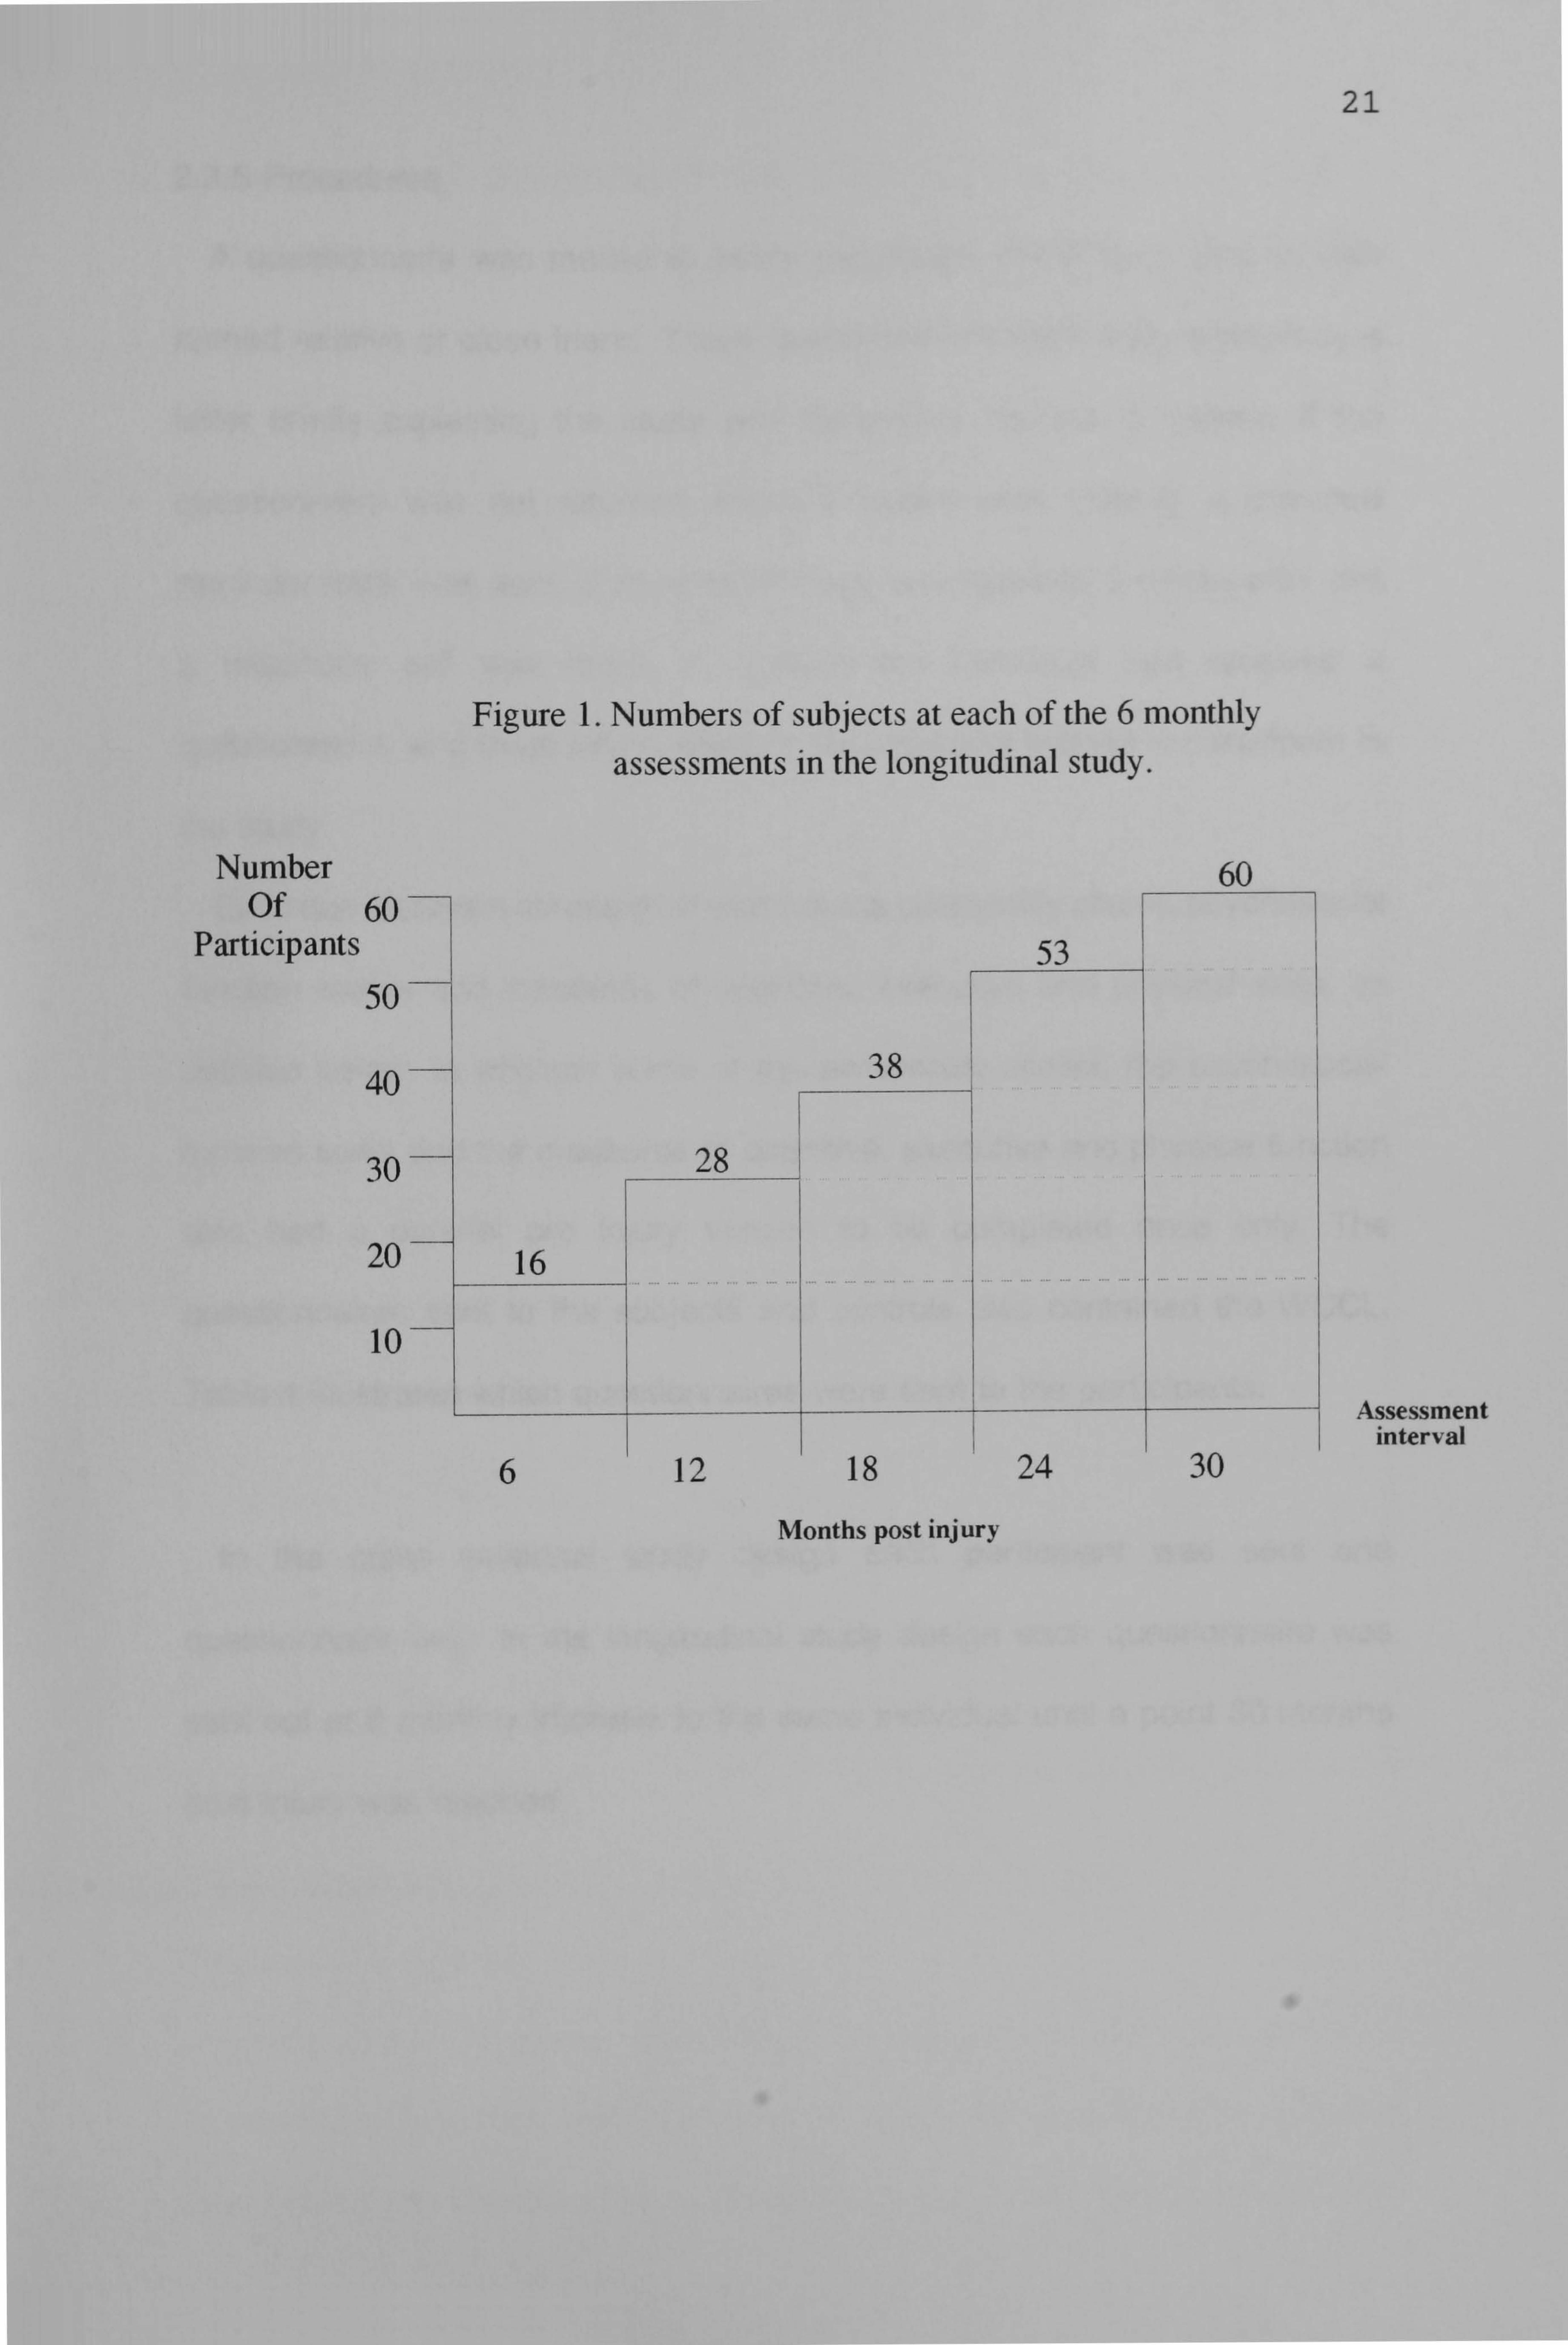
Number Of
Participants
1. Numbers of subjects at each of the 6 monthly assessments in the longitudinal study.
6 12 18
Months post injury
24 30
21
22
2.3.5 Procedures
A questionnaire was mailed to every participant in the study and to their
named relative or close friend. These questionnaires were accompanied by a
letter briefly explaining the study and requesting consent or assent. If the
questionnaire was not returned within 6 weeks after mailing, a standard
reminder letter was sent. If no questionnaire was returned 3 weeks after this
a telephone call was made to confirm the individual had received a
questionnaire, and to ascertain whether the individual wished to participate in
the study.
Each questionnaire consisted of post trauma personality scales, psychosocial
function scales and measures of cognitive, executive and physical skills, as
detailed below. In addition some of the personality scales, the psychosocial
function scale and the measures of cognitive, executive and physical function
also had a parallel pre injury version to be completed once only. The
questionnaires sent to the subjects and controls also contained the WCCL.
Table 1 illustrates which questionnaires were sent to the participants.
In the cross sectional study design each participant was sent one
questionnaire only. In the longitudinal study design each questionnaire was
sent out at 6 monthly intervals to the same individual until a point 30 months
post injury was reached.

23
Table 1. A LIST OF QUESTIONNAIRES USED AND WHO THEY WERE SENT TO.
SUBJECT/ RELATIVE CONTRO L
EASY GOING DISPOSITION PRE INJURY POSTI NJ U RY
LOCUS OF CONTROL PRE INJURY POSTINJURY
OPTIMISM PRE INJURY POSTI NJ U RY
USE OF HUMOUR PRE INJURY POSTINJURY
EYSENCK PERSONALITY PRE INJURY INVENTORY
POSTINJURY
PRIMARY APPRAISAL PRE INJURY POSTINJURY
SECONDARY APPRAISAL PRE INJURY POSTINJURY
WAYS OF COPING PRE INJURY CHECKLIST
POSTINJURY
PSYCHOSOCIAL RATING PRE INJURY SCALE
POSTINJURY
COGNITIVE FUNCTION PRE INJURY POSTINJURY
EXECUTIVE FUNCTION PRE INJURY * * POSTI NJ U RY
PHYSICAL FUNCTION PRE INJURY * * POSTINJURY * *
2.3.6 Measures
Psychosocial function
There are several scales which have been designed to measure outcome or
to chart recovery after brain injury; the Glasgow Outcome Scale (Jennet and
Bond 1975), the Disability Rating Scale (Rappaport, Hall, Hopkins et al 1982),

24
the Levels of Cognitive Functioning Scale (Hagan, Malkmus and Durham
1979), the Glasgow Assessment Schedule (Livingston and Livingston 1985),
some scales used by Bond and Brooks (1976) and the Functional Assessment
Measure [FAM] (1987). No single one of these provides enough detailed
information regarding an individual's psychosocial performance, other than
perhaps the FAM. However this scale cannot be completed by the subject
themself. Recently several articles have reported on the use of the Minnesota
Multiphasic Personality Inventory and the Katz Adjustment Scale as measures
of psychosocial function after brain injury (MacNiven and Finlayson 1993,
Fordyce et al 1983, Hinkeldey and Corrigan 1990). However the first of these
measures is very long and complex, often asking quite abstract questions,
whilst the second focuses on the relatives ratings only. A decision was made
not to use either of these measures.
Thus the 'Headley Court psychosocial rating scale' was devised with the
needs of this particular study in mind. Two criterion needed to be met:
1. The scales could be completed by the brain injured subjects.
2. The scales should reflect the commonly reported problems in the
psychosocial domain.
The 28 items were decided upon after discussion with the whole
rehabilitation team, and are rated on a5 point Likert rating scale, ranging from
'very severe problem' to 'no problem'. The overall score is obtained by
summing these 28 items and then dividing by 28 to obtain an average. The
higher the score the less of a problem is apparent. (Appendix A).
The Cronbach Alpha scores of reliability are reported later in Study One.
They range from . 90 to . 95 for this measure (Table 5). Validity was assessed

25
using 20 brain injured subjects. Scores from the psychosocial rating scale
were summed and divided by 28 to obtain an average score. 2-Tailed Pearson
Correlations were computed between this average score and summed scores
on each of the following measures:
Hospital Anxiety and Depression Scale [HADS] (Zigmond and Snaith
1983)
Spielberger State Trait Anxiety Measure [SAM] (Spielberger, Goursch
and Lushene 1968)
Beck Depression Inventory (short form) [BDI] (Beck and Beck 1972)
Results were significant between all measures, as illustrated in Table 2.
Table 2.2-Tailed Pearson Correlations between the Psychosocial Rating Scale and the HADS, SAM and BDI.
HADS. HADS. SAM. SAM. BDI. Anxiety Depressio State Trait
n Anxiety Anxiety
Psychoso . 61 ** . 72 . 60 ** . 78 ** . 81 ** cial Rating Scale
** = p<. 01
Coping
The 'Ways of Coping Checklist' (WCCL) (Lazarus and Folkman 1984) has
been the most widely used and validated approach to the assessment of
coping skills. It was judged that the widespread use of this measure combined
with its good methodological reviews (Tennen and Herzberger 1985) and the
opportunity it provides to explore the relevant factor structures made it the best
choice from the available assessment methods. The WCCL was originally
developed by factor analysing 68 items on only 100 subjects. Vitaliano et al

26
(1987) developed a revised version which was favourably compared with the
original in terms of its psychometric properties. The revised scale was
developed using a combination of factor analytic and rational approaches.
However Tennen and Herzberger (1985) recommend the establishment of
new factors whenever this checklist is used with new client groups.
The revised checklist consists of 42 different approaches to coping
commonly used in a range of problem situations (Appendix B). The use of each
of these is rated by the individual on a simple yes/no basis. Scores were
obtained on the WCCL by assigning a1 for each item checked by the
individual.
Primary and secondary appraisal are also assessed on this questionnaire,
using measures designed by Lazarus and Folkman (1984) (Appendix C).
Primary appraisal is measured using a 13 item checklist of threats to different
aspects of the individual's life; these are rated on a5 point Likert scale ranging
from 'Doesn't apply' to 'Applies a great deal'. Overall score is obtained by
summing these items and dividing by 13. The higher the score the more
perceived threat is reported.
Secondary appraisal is measured by asking the individual to rate the extent
to which they feel the stressor is changeable or not changeable. This is done
on a4 item checklist rated on a5 point Likert scale, ranging from 'Very true'
to 'Not at all true'. Overall score is obtained by summing these items and
dividing by 4. The higher the score the more control the individual rates
themself as having.
Personality
Locus of Control was measured using the scales originally devised by Rotter

27
(1966) since they have been most widely used in research and have shown
good validity and reliability.
The scales consist of 29 pairs of statements, one relating to an external
locus of control (events are attributed to someone or something else) and one
to an internal locus of control (events are attributed to oneself). There are 3
filler items, thus leaving a total of 26 scoreable items. The individual indicates
which one from each pair they believe in more strongly, using a simple yes/no
answer format. Overall external locus of control score is obtained by totalling
the 26 external items and then dividing by 26 and multiplying by 100. The
same approach is used for internal locus of control items. The higher the
percentage score the more this style of locus of control is used.
(Appendix D).
Use of Humour was studied in a series of articles by Martin and Lefcourt
(1983). They found that humour appreciation, or the ability to accurately
perceive humourous stimuli was not sufficient to reduce stress. An individual
must be able to actually produce or use humour in a stressful situation for it to
have a moderating effect. The measure (Coping Humour Scale) which they
designed specifically to assess the degree to which subjects report using
humour as a means of coping with stressful experiences, was incorporated into
the questionnaire booklet.
This scale consists of 7 items answered on a4 point Likert scale, ranging
from 'strongly disagree' to 'strongly agree'. Overall score was obtained by
summing all 7 scores and dividing them by 7 to obtain an average. The higher
the score the more humour is used. (Appendix E).

28
Optimism. The measure developed by Scheier and Carver (1985) (The 'Life
Orientation Test') for the study of optimism as a stable personality trait was
also incorporated into the present questionnaire.
The Life Orientation Test consists of 12 items; 4 of these are filler items to
disguise the intention of the questions; 4 are phrased in an optimistic direction
and 4 in a pessimistic direction. The individual indicates on a yes/no basis if the
items apply. Recoding of these items was undertaken to allow computation of
overall score by summing the 8 items and then dividing by 8. The higher the
score the more optimism is shown by the individual. (Appendix F).
Easy Going Disposition. Holahan and Moos (1985) have explored the role
of an 'easy going disposition' as a stress resistance factor. Thus the measure
they used was incorporated into the questionnaire.
This measure consists of three 5 point Likert scales ranging from 'quite
accurate' to 'not at all accurate'. The adjectives used are 'easy going', 'calm'
and 'happy'.
The sum of the 3 scales was divided by 3 to obtain the overall score. Lower
scores reflect increasing 'easy going disposition'. (Appendix G).
Extroversion and Neuroticism. The Eysenck Personality Inventory consists
of 57 items; 9 of these items constitute a 'lie' scale; 24 constitute extroversion
items and 24 constitute neuroticism items. The individual indicates on a yes/no
basis if the items apply. Overall score for each of these personality attributes
was computed by summing all the relevant items and dividing by 24. The
higher the score the more extroversion or neuroticism is demonstrated by the
individual. (Appendix H).

29
Other measures. All demographic and medical information was collected
from the medical records. In addition measures of cognitive, executive and
physical function were also used to assess the level of severity of problems.
As for the measurement of psychosocial function, no single presently available
test can provide sufficient detail on these skill areas. Consequently
questionnaires were designed at Headley Court to be used in this study. The
14 items on these 3 questionnaires were decided on after discussion with the
whole rehabilitation team, and are rated on a5 point Likert rating scale,
ranging from 'very severe problem' to 'no problem'. Each of the scores for
cognitive, executive and physical items were summed and divided by the
appropriate number of items. The higher the score the less of a problem is
apparent. (Appendix I).
2.3.7 Analysis.
All analysis was carried out using the SPSSX (V2.2) programme on a
mainframe computer.

30
3 STUDY ONE. EXPLORING THE RELATIONSHIPS OF INJURY RELATED
AND PERSONALITY ATTRIBUTES TO PSYCHOSOCIAL OUTCOME AFTER
BRAIN INJURY.
3.1 Introduction and summary of the problem
3.1.1 Introduction
It is commonly found in outcome studies that injury related factors are
significant, particularly severity of injury (Ruff et at 1993, Hinkeldey and
Corrigan 1990). However 'outcome' is usually defined as return to work
(Conder 1989) - not psychosocial function. The nature of the relationships
between severity and psychosocial outcome are unclear.
It is also often stated that both pre and post trauma personality are important
factors in psychosocial function (Prigatano 1986, Slagle 1990), but there is little
empirical research to support or negate this.
Several issues are important to consider when examining the relationships
between personality and psychosocial function; firstly can the self ratings of
brain injured people be relied on? Secondly, there is a need to define specific
aspects of personality rather than be global, since some aspects may have
stronger relationships than others. Thirdly it is important to examine both pre
and post trauma personality attributes separately since personality changes
commonly occur as a result of the brain injury (Brooks et al 1986). Fourthly,
there is a paucity of research which utilises adequate controls, making it
difficult to attribute such changes to the brain injury itself.
The present study was designed with these considerations in mind.

31
3.1.2 Questions to be addressed
1. Which injury related factors are related to psychosocial outcome, and in
what way?
2. Can self reports of brain injured people be relied on?
3. Do selected personality attributes change after brain injury, and in what
way?
4. Do personality attributes continue to change or remain fixed in the months
after brain injury?
5. Are these changes specific to brain injury?
6. Which pre trauma personality attributes are related to psychosocial
outcome and in what way?
7. Which post trauma personality attributes are related to psychosocial
outcome and in what way?
8. Are these relationships peculiar to brain injury?
9. Are the results from the cross sectional design comparable with those
from the longitudinal design?
3.2 Method
3.2.1 Measures used
Educational level, age and time post injury were included as measures of
demographic information. Location of injury and measures of severity (coma,
PTA, cognitive, physical, executive and psychosocial function [as opposed to
the psychosocial outcome measure]) were also included. Together these
variables are referred to as injury related variables.
The Headley Court psychosocial rating scale and all the personality
measures detailed above were also used to measure psychosocial outcome

32
and personality respectively.
3.3 Analysis and Results
3.3.1 Distribution
Normative distributions were visually inspected for each variable. A positive
skew was noted on psychosocial function and also on the measures of
cognitive, executive and physical function. However the responses were judged
to be sufficiently normal to justify the use of parametric analysis - given that the
results obtained would be more strongly indicated due to the more conservative
nature of this statistical approach. Table 3 shows the means and standard
deviations for post trauma scores on psychosocial cognitive, executive and
physical function ratings for participants in the longitudinal study.
Table 3. MEANS AND STANDARD DEVIATIONS FOR POST TRAUMA PSYCHOSOCIAL, COGNITIVE, EXECUTIVE AND PHYSICAL FUNCTION RATINGS.
SUBJECT mean sd
RELATIVE mean sd
CONTROL mean sd
RELATIVE mean sd
PSYCHOSOCIAL 4.33.61 4.36.65 4.62.50 4.79.24
COGNITIVE 3.98.80 3.92.86 4.76.39 4.84.24
PHYSICAL 3.80.96 3.81 1.0 3.72.97 4.09.97
EXECUTIVE 4.38.71 4.25.91 4.71 . 40 4.84.28

33
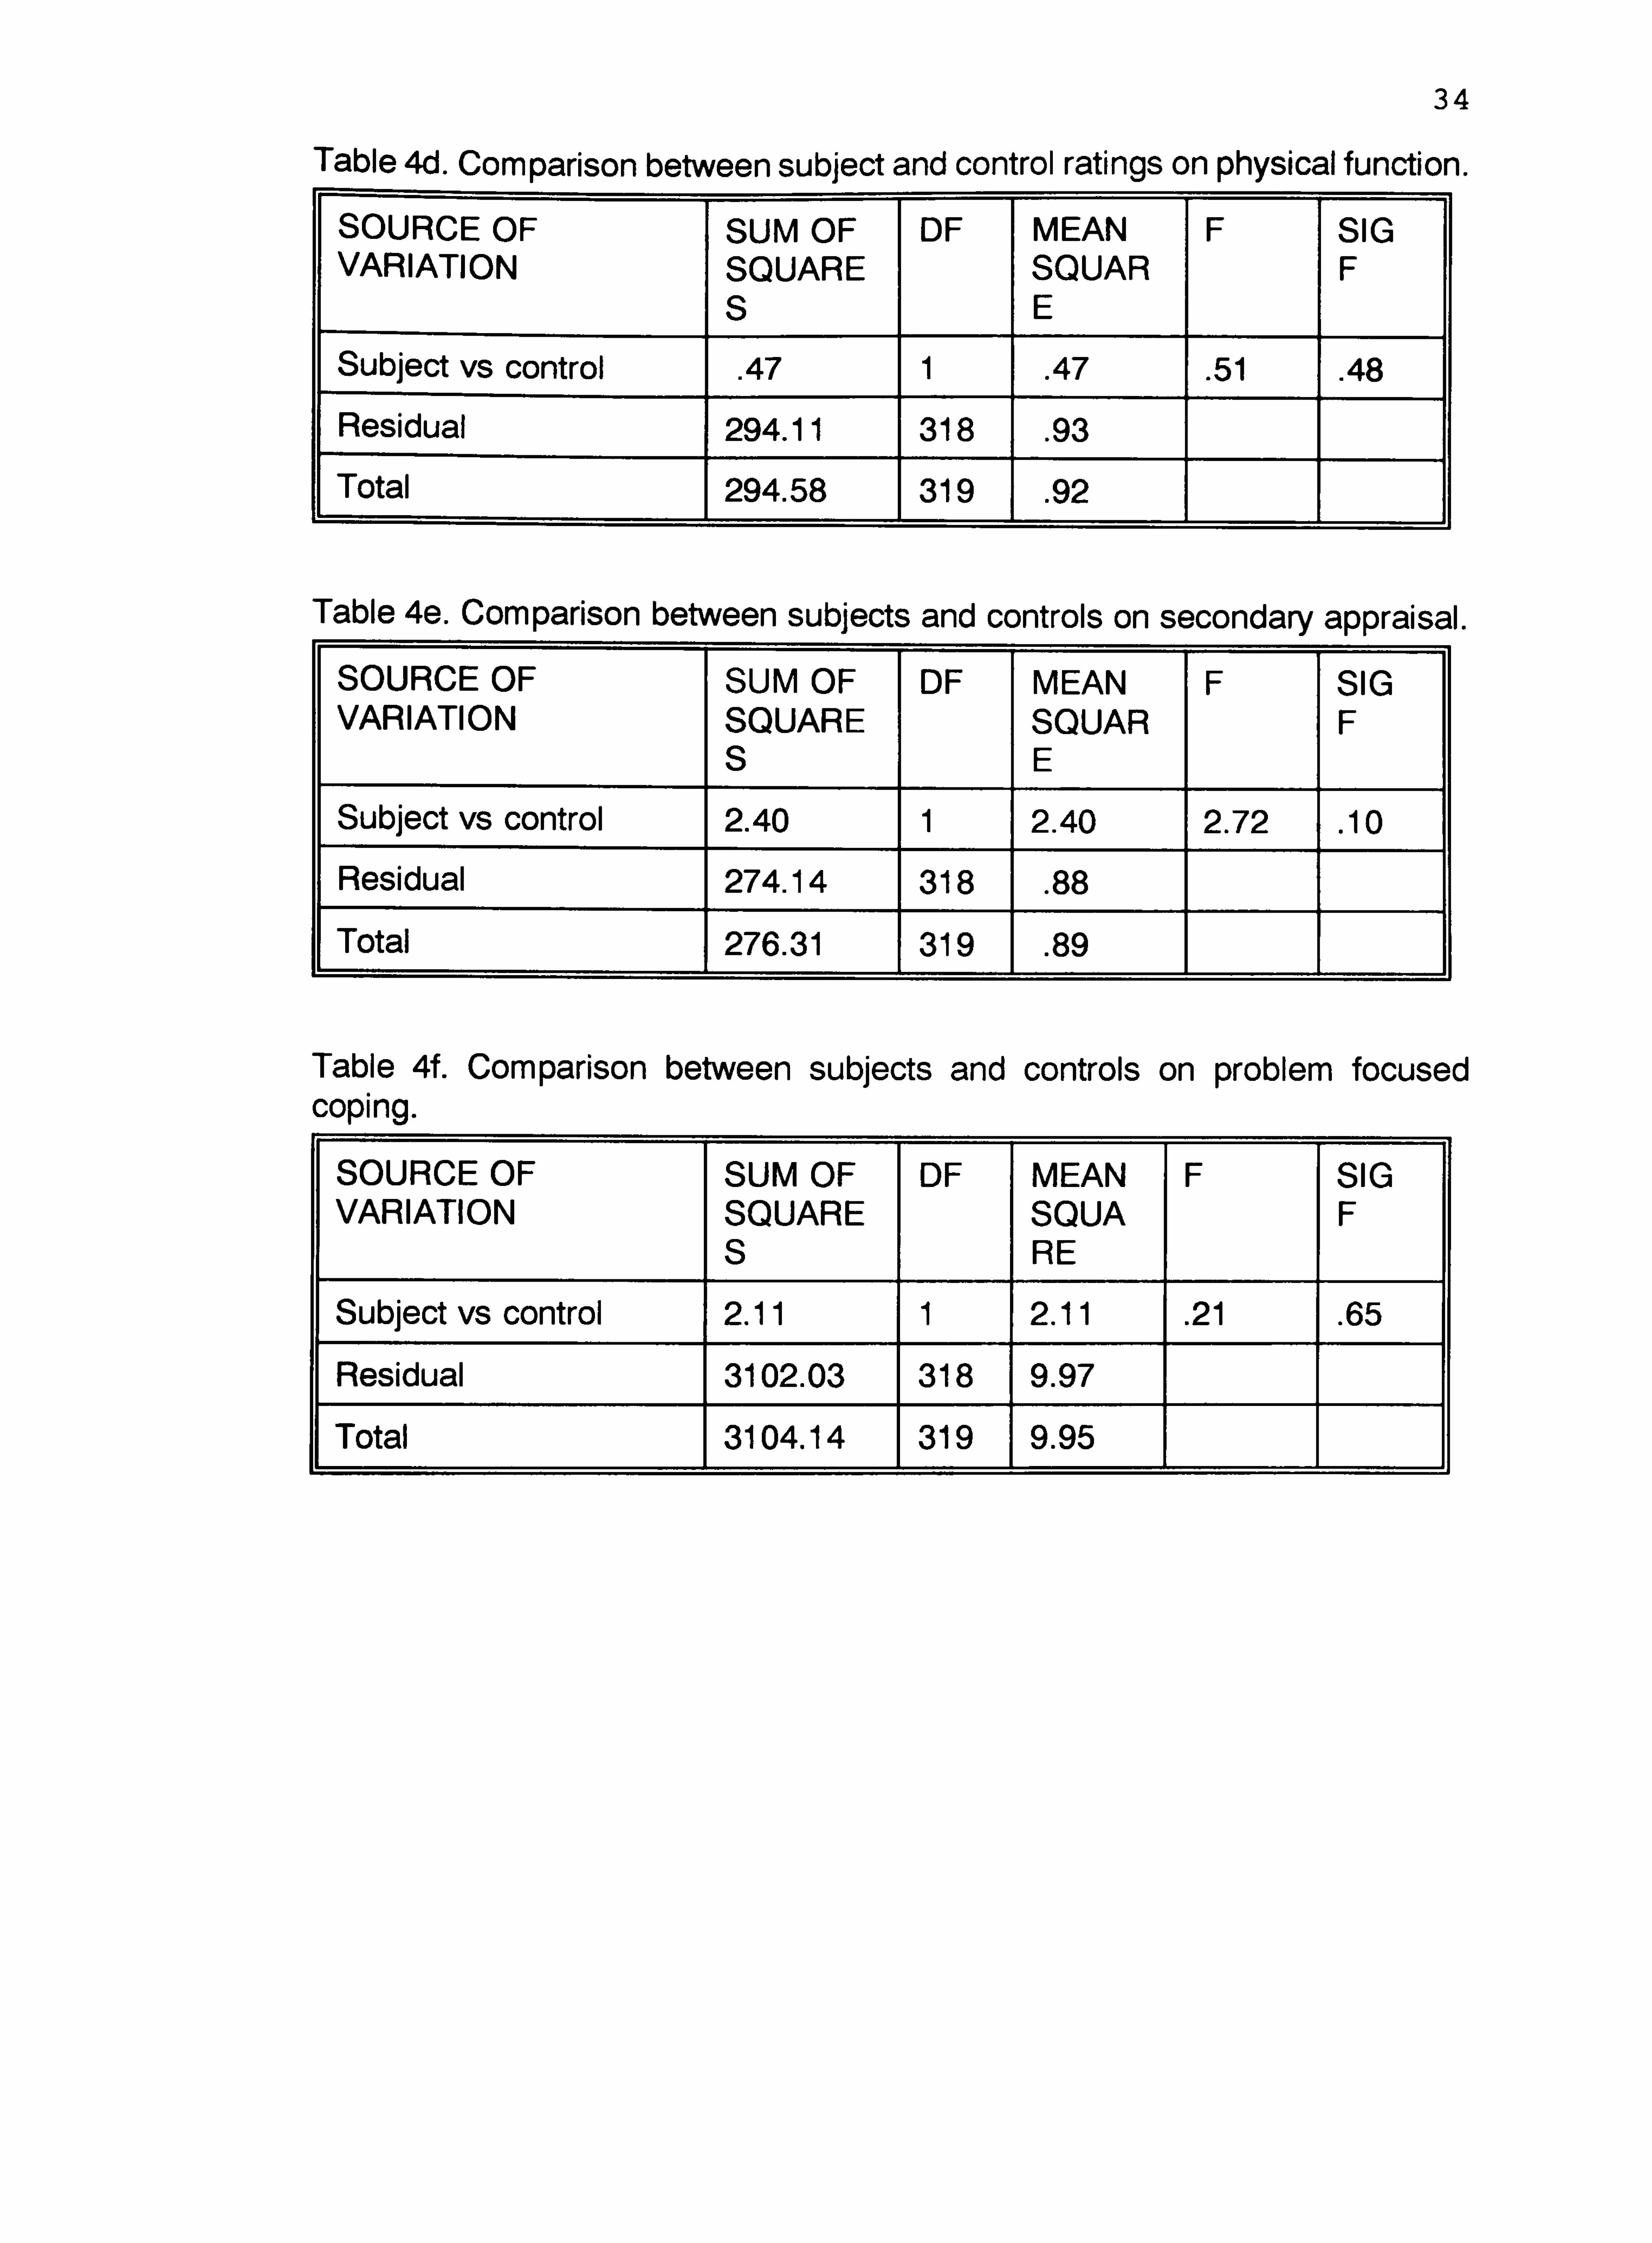
3.3.2 Comparisons between subjects and controls.
The results from the subjects were compared with those from the controls,
using Analysis of Variance. Significant differences were found on all variables,
except for physical function, easy going disposition, optimism, neuroticism,
secondary appraisal and problem focused coping, Tables 4a - 4f. Results from
the relatives broadly support these findings.
Table 4a. Comparison between subject and control ratings on easy going disposition.
SOURCE OF VARIATION
SUM OF SQUARE S
DF MEAN SQUAR E
F SIG F
Subject vs control 2.67 1 2.67 2.92 . 089
Residual 284.50 318 . 92
Total 287.16 319 . 92
Table 4b. Comparison between subject and control ratings on optimism.
SOURCE OF VARIATION
SUM OF SQUARE S
DF MEAN SQUAR E
F SIG F
Subject vs control 16.60 1 16.60 2.88 . 09
Residual 1789.65 318 5.76
Total 1806.25 319 5.79
Table 4c. Comparison between subject and control ratings on neuroticism.
SOURCE OF VARIATION
SUM OF SQUARE S
DF MEAN SQUAR E
F SIG F
Subject vs control 74.68 1 74.68 2.49 . 12
Residual 9318.97 318 29.97
Total 9393.66 319 30.11
34
Table 4d. Comparison between subject and control ratings on physical function.
SOURCE OF VARIATION
SUM OF SQUARE S
DF MEAN SQUAR E
F SIG F
Subject vs control . 47 1 . 47 . 51 . 48
Residual 294.11 318 . 93
Total 294.58 319 . 92
Table 4e. Comparison between subjects and controls on secondary appraisal.
SOURCE OF VARIATION
SUM OF SQUARE S
DF MEAN SQUAR E
F SIG F
Subject vs control 2.40 1 2.40 2.72 . 10
Residual 274.14 318 . 88
Total 276.31 319 . 89
Table 4f. Comparison between subjects and controls on problem focused coping.
SOURCE OF VARIATION
SUM OF SQUARE S
DF MEAN SQUA RE
F SIG F
Subject vs control 2.11 1 2.11 . 21 . 65
Residual 3102.03 318 9.97
Total 3104.14 319 9.95

35
3.3.3 Reliability
The Cronbach Alpha scores of reliability for the subjects and controls are
adequate, ranging from moderately low to moderately high. (Presented in Table
5).
Table 5. CRONBACH ALPHA SCORES OF RELIABILITY FOR ALL MEASURES.
SUBJECTS RELATIVE CONTROL RELATIVE S
PRIMARY . 88
. 86 APPRAISAL
SECONDARY . 42
. 42 APPRAISAL
WAYS OF COPING Problem
. 78 . 70 Emotion
. 67 . 65 Avoidance
. 59 . 60 Wishful
. 69 . 62
OPTIMISM . 74 . 55 . 75 . 44
EASY GOING . 70 . 80 . 69 . 78
DISPOSITION
LOCUS OF . 71 . 68 . 75 . 78 CONTROL
USE OF HUMOUR . 80 . 86 . 81 . 82
PHYSICAL . 87 . 91 . 77 . 77 FUNCTION
COGNITIVE . 82 . 87 . 73 . 72
FUNCTION
EXECUTIVE . 78 . 88 . 68 . 74 FUNCTION
EXTROVERSION . 76 . 75
NEUROTICISM . 87 . 85
PSYCHOSOCIAL . 94 . 95 . 94 . 90 FUNCTION

36
3.3.4 Accuracy of self reports
In order to check the accuracy of subject reports against those of the
relative, 2 tailed T-tests were computed between the subject and relative
ratings for each of the variables. This analysis was repeated for the longitudinal
study and the cross sectional study subjects.
The results from the longitudinal study show that the ratings of locus of
control, optimism and executive function were not rated the same by the
relatives and the subjects. The subjects rated themselves as having less of an
external locus of control, being more optimistic in outlook and having better
executive function than did the relatives. However the control group were less
accurate! The controls rated themselves as less easy going, more optimistic
and as having poorer psychosocial, cognitive, physical and executive function
compared with relatives. (Table 6a).
Table 6a. ACCURACY OF AWARENESS. COMPARING RATINGS BETWEEN SUBJECTS AND RELATIVES USING 2 TAILED T-TESTS.
SUBJECTS pre post
CONTROLS pre post
EASY GOING DISPOSITION -1.04 -. 85 2.40* 3.52***
LOCUS OF CONTROL -2.39*** -4.38*** 1.21 . 96
OPTIMISM 12.23*** 13.61 *** 8.08*** 13.47***
USE OF HUMOUR -1.12 -. 88 1.70 1.44
PSYCHOSOCIAL FUNCTION . 19 -. 64 -. 68 -3.74*** COGNITIVE FUNCTION
. 06 1.0 . 56 -2.16* PHYSICAL FUNCTION -1.23 -. 15 -. 97 -5.09*** EXECUTIVE FUNCTION 1.40 2.15* . 63 -3.76***
*= p<. 05 ** = p<. 01 *** = p<. 001

37
The results from the cross sectional study support this finding that the
subjects were more accurate than the controls when compared with relative
ratings. These results indicate a good level of awareness on the part of the
brain injured subjects, in fact better than the non neurologically damaged
controls!
This result lends support to the view that brain injured people can supply self
ratings with at least the same accuracy as non neurologically injured people.
Given the importance of this result it was examined in more detail. Accuracy,
as measured by comparing the subject and relative ratings, is a complex topic,
involving different ways of dealing with the data (Malia and Powell 1993). For
instance the size of the discrepancy between the subject and relative ratings
can be used. This was calculated by subtracting the subject ratings from the
relative ratings. This result was then compared with the absolute relative
ratings using 2-Tailed T-Tests (Table 6b). In addition comparison of means can
mask differences so the data was reanalysed using 2-Tailed Pearson
Correlations, (Table 6b).

38
Table 6b. ACCURACY OF AWARENESS. COMPARING RATINGS BETWEEN SUBJECTS AND RELATIVES USING AMOUNT OF DISCREPANCY AND PEARSON CORRELATIONS.
SUBJECTS CONTROLS Pre Post Pre Post
EASY GOING DISPOSITION
discrepancy -10*** -19.8*** -3.8*** -11.1 *** correlation . 36** . 65**
. 15 . 39**
LOCUS OF CONTROL -12.9*** -27.2*** -7.7*** -17.3*** discrepancy
. 18 . 35** . 30 . 51
correlation
OPTIMISM discrepancy -. 15 2.48*
. 36 3.15** correlation . 26* . 22**
. 20 . 32**
USE OF HUMOUR discrepancy -24.91 *** -31.5*** -11.5*** -27.9*** correlation . 40** . 53** . 16 . 44**
PSYCHOSOCIAL FUNCTION
discrepancy -59.4*** -51.4*** -41.7*** -91.7*** correlation . 44** . 39** . 07 . 24**
COGNITIVE FUNCTION
discrepancy -63.4*** -36.8*** -51.9*** -101 *** correlation . 12 . 53** . 24 . 23*
PHYSICAL FUNCTION
discrepancy -96.3*** -33.2*** -56.3*** -33*** correlation . 13 . 66** . 18 . 64**
EXECUTIVE FUNCTION
discrepancy -37.76*** -35.4*** -33.9*** -98.3*** correlation . 13 . 52** 1 00 . 33**
*= p<. 05 ** = p<. 01 *** = p<. 001
The results from these analyses demonstrate significant differences between
subjects and relatives on all the post trauma ratings, and on most of the pre
trauma ratings. However these results are entirely supported by the control
group, indicating there is no reason to suppose neurologically damaged people

39
are any less able to rate themselves accurately than matched controls.
The results do throw doubt on the measurement of accuracy of self report
by comparing subject with relative ratings. As already stated relatives may also
be inaccurate. The present study was unable to incorporate professional
ratings.
3.3.5 Changes between pre and post trauma personality ratings.
In order to examine changes between pre and post trauma personality
ratings paired 2 tailed T-tests were computed between the pre injury ratings
and the post injury ratings for the whole subject group included in the
longitudinal study. All personality variables were significantly different compared
with pre trauma. Subjects rated themselves as less easy going, less optimistic,
using less humour and having a less internal locus of control. The neuroticism
and extroversion measures did not contain pre injury versions as it was felt that
these would be too complex and would therefore be unreliable. This result was
confirmed with the relative ratings. The control ratings also showed changes
but only easy going disposition and optimism were significantly different.
Nevertheless all the changes were in the same direction as those reported by
the subjects. Relative ratings broadly confirm this. Table 7.

40
Table 7. COMPARISONS BETWEEN PRE AND POST TRAUMA PERSONALITY RATINGS FOR PARTICIPANTS IN THE LONGITUDINAL STUDY DESIGN. USING 2 TAILED T-TESTS.
SUBJECTS RELATIVES CONTROL RELATIVES S
EASY GOING 6.29*** 5.64*** 2.53* 5.12*** DISPOSITION
LOCUS OF 2.36* 2.08* . 49 2.18* CONTROL
OPTIMISM -4.01*** -5.43*** -3.10** -1.97 USE OF -3.65*** -3.60*** -1.75 -2.01 * HUMOUR
*= p<. 05 ** = p<. 01 *** = p<. 001
In order to examine changes over time after the brain injury, a oneway
analysis of variance was computed for each of the post trauma personality
variables against each of the 6 monthly time points. Since different numbers
of subjects were included at each time point these analyses were performed
separately between each of the time points and only included those subjects
who were assessed at both time points. No significant differences were found
(Tables 8 to 11), indicating a stability of post trauma personality with little
change over a 30 month period post injury. The results are supported by the
relative and control ratings.
Table 8a. CHANGES IN EASY GOING DISPOSITION BETWEEN 6 AND 12 MONTHS POST BRAIN INJURY, USING ANOVA.
SOURCE OF VARIATION
SUM OF SQUARE S
DF MEAN SQUARE
F SIG F
Time post injury . 35 1 . 35 . 25 . 62
Residual 41.86 30 1.39
Total 42.21 31 1.36

41
Table 8b. CHANGES IN LOCUS OF CONTROL BETWEEN 6 AND 12 MONTHS POST BRAIN INJURY, USING ANOVA.
SOURCE OF VARIATION
SUM OF SQUARE S
DF MEAN SQUARE
F SIG F
Time post injury 132.92 1 132.92 . 76 . 39
Residual 5282.37 30 176.08
Total 5415.29 31 174.69
Table 8c. CHANGES IN OPTIMISM BETWEEN 6 AND 12 MONTHS POST BRAIN INJURY, USING ANOVA.
SOURCE OF VARIATION
SUM OF SQUARE S
DF MEAN SQUARE
F SIG F
Time post injury . 78 1 . 78 . 11 . 74
Residual 207.19 30 6.91
Total 207.97 31 6.71
Table 8d. CHANGES IN NEUROTICISM BETWEEN 6 AND 12 MONTHS POST BRAIN INJURY, USING ANOVA.
SOURCE OF VARIATION
SUM OF SQUARE S
DF MEAN SQUARE
F SIG F
Time post injury 42.78 1 42.78 1.19 . 28
Residual 1076.94 30 35.9
Total
11
1119.72 31 36.12
Table 8e. CHANGES IN EXTROVERSION BETWEEN 6 AND 12 MONTHS POST BRAIN INJURY, USING ANOVA.
SOURCE OF VARIATION
SUM OF SQUARE S
DF MEAN SQUARE
F SIG F
Time post injury 11.28 1 11.28 . 56 . 46
Residual 605.69 30 20.19
Total 616.97 31 19.9

42
Table 8f. CHANGES IN USE OF HUMOUR BETWEEN 6 AND 12 MONTHS POST BRAIN INJURY, USING ANOVA.
SOURCE OF VARIATION
SUM OF SQUARE S
DF MEAN SQUARE
F SIG F
Time post injury . 16 1 . 16 . 34 . 57
Residual 14.61 30 . 49
Total 14.77 31 . 48
Table 9a. CHANGES IN EASY GOING DISPOSITION BETWEEN 12 AND 18 MONTHS POST BRAIN INJURY, USING ANOVA.
SOURCE OF VARIATION
SUM OF SQUARE S
DF MEAN SQUARE
F SIG F
Time post injury . 24 1 . 24 . 20 . 66
Residual 65.65 54 1.22
Total 65.89 55 1.20
Table 9b. CHANGES IN LOCUS OF CONTROL BETWEEN 12 AND 18 MONTHS POST BRAIN INJURY, USING ANOVA.
SOURCE OF VARIATION
SUM OF SQUARE S
DF MEAN SQUARE
F SIG F
Time post injury 8.44 1 8.44 . 03 . 87
Residual 16618.3 54 307.75
Total 16626.7 55 302.3
Table 9c. CHANGES IN OPTIMISM BETWEEN 12 AND 18 MONTHS POST BRAIN INJURY, USING ANOVA.
SOURCE OF VARIATION
SUM OF SQUARE S
DF MEAN SQUARE
F SIG
Time post injury . 88 1 . 88 . 18 . 67
Residual 262.68 54 4.86
Total 263.55 55 4.79

43
Table 9d. CHANGES IN NEUROTICISM BETWEEN 12 AND 18 MONTHS POST BRAIN INJURY, USING ANOVA.
SOURCE OF VARIATION
SUM OF SQUARE S
DF MEAN SQUARE
F SIG F
Time post injury 6.45 1 6.45 . 18 . 68
Residual 1953.11 54 36.17
Total 1959.55 55 35.63
Table 9e. CHANGES IN EXTROVERSION BETWEEN 12 AND 18 MONTHS POST BRAIN INJURY, USING ANOVA.
SOURCE OF VARIATION
SUM OF SQUARE S
DF MEAN SQUARE
F SIG F
Time post injury . 64 1 . 64 . 04 . 85
Residual 945.36 54 17.51
Total 946.0 55 17.2
Table 9f. CHANGES IN USE OF HUMOUR BETWEEN 12 AND 18 MONTHS POST BRAIN INJURY, USING ANOVA.
SOURCE OF VARIATION
SUM OF SQUARE S
DF MEAN SQUARE
F SIG F
Time post injury . 19 1 . 19 . 38 . 54
Residual 27.68 54 . 51
Total 27.88 55 . 51
Table 1 Oa. CHANGES IN EASY GOING DISPOSITION BETWEEN 18 AND 24 MONTHS POST BRAIN INJURY, USING ANOVA.
SOURCE OF VARIATION
SUM OF SQUARE S
DF MEAN SQUARE
F SIG F
Time post injury . 18 1 . 18 . 16 . 69
Residual 81.51 74 1.1
Total 81.69 75 1.09

44
Table 10b. CHANGES IN LOCUS OF CONTROL BETWEEN 18 AND 24 MONTHS POST BRAIN INJURY, USING ANOVA.
SOURCE OF VARIATION
SUM OF SQUARE S
DF MEAN SQUARE
F SIG F
Time post injury 2.24 1 2.24 . 006
. 94
Residual 27733.1 74 374.77
Total 27735.3 75 369.8
Table 10c. CHANGES IN OPTIMISM BETWEEN 18 AND 24 MONTHS POST BRAIN INJURY, USING ANOVA.
SOURCE OF VARIATION
SUM OF SQUARE S
DF MEAN SQUARE
F SIG
Time post injury . 05 1 . 05 . 009 . 92
Residual 410.90 74 5.55
Total 410.95 75 5.48
Table 10d. CHANGES IN NEUROTICISM BETWEEN 18 AND 24 MONTHS POST BRAIN INJURY, USING ANOVA.
SOURCE OF VARIATION
SUM OF SQUARE S
DF MEAN SQUARE
F SIG F
Time post injury . 33 1 . 33 . 01 . 92
Residual 2242.55 74 30.31
Total 2242.88 75 29.91
Table 1 Oe. CHANGES IN EXTROVERSION BETWEEN 18 AND 24 MONTHS POST BRAIN INJURY, USING ANOVA.
SOURCE OF VARIATION
SUM OF SQUARE S
DF MEAN SQUARE
F SIG F
Time post injury 2.58 1 2.58 . 14 . 71
Residual 1326.58 74 17.93
Total 1329.16 75 17.72

45
Table 1 Of. CHANGES IN USE OF HUMOUR BETWEEN 18 AND 24 MONTHS POST BRAIN INJURY, USING ANOVA.
SOURCE OF VARIATION
SUM OF SQUARE S
DF MEAN SQUARE
F SIG F
Time post injury . 07 1 . 07 . 14 . 71
Residual 36.57 74 . 49
Total 36.64 75 . 49
Table 11 a. CHANGES IN EASY GOING DISPOSITION BETWEEN 24 AND 30 MONTHS POST BRAIN INJURY, USING ANOVA.
SOURCE OF VARIATION
SUM OF SQUARE S
DF MEAN SQUARE
F SIG F
Time post injury . 60 1 . 60 . 63 . 43
Residual 99.80 104 . 96
Total 100.41 105 . 96
Table 11 b. CHANGES IN LOCUS OF CONTROL BETWEEN 24 AND 30 MONTHS POST BRAIN INJURY, USING ANOVA.
SOURCE OF VARIATION
SUM OF SQUARE S
DF MEAN SQUARE
F SIG F
Time post injury 149.98 1 149.98 . 39 . 53
Residual 39984.3 104 384.46
Total 40134.3 105 382.23t
Table 11 c. CHANGES IN OPTIMISM BETWEEN 24 AND 30 MONTHS POST BRAIN INJURY, USING ANOVA.
SOURCE OF VARIATION
SUM OF SQUARE S
DF MEAN SQUARE
F SIG
Time post injury 4.16 1 4.16 . 66 . 42
Residual 651.96 104 6.27
Total 656.12 105 6.25
46
Table 11 d. CHANGES IN NEUROTICISM BETWEEN 24 AND 30 MONTHS POST BRAIN INJURY, USING ANOVA.
SOURCE OF VARIATION
SUM OF SQUARE S
DF MEAN SQUARE
F SIG F
Time post injury 20.84 1 20.84 . 68 . 41
Residual 3172.15 104 30.5
Total 3192.99 105 30.41
Table 11 e. CHANGES IN EXTROVERSION BETWEEN 24 AND 30 MONTHS POST BRAIN INJURY, USING ANOVA.
SOURCE OF VARIATION
SUM OF SQUARE S
DF MEAN SQUARE
F SIG F
Time post injury . 24 1 . 24 . 01 . 92
Residual 2144.42 104 20.62
Total 2144.65 105 20.43
Table 11f. CHANGES IN USE OF HUMOUR BETWEEN 24 AND 30 MONTHS POST BRAIN INJURY, USING ANOVA.
SOURCE OF VARIATION
SUM OF SQUARE S
DF MEAN SQUARE
F SIG F
Time post injury . 15 1 . 15 . 31 . 58
Residual 50.66 104 . 49
Total 50.81 105 . 48
3.3.6 Personality and injury related factors with psychosocial outcome
Analysis was carried out at each of the 6 monthly time intervals using two
tailed Pearson Correlations. The results from the longitudinal study show that
better psychosocial outcome is related to less neuroticism, greater
extroversion, more easy going disposition, greater use of humour and better
cognitive, psychosocial and executive skills at most stages post injury (Tables
12a and 12b). No pre trauma variables were important, and location of injury

47
and severity of injury as measured by coma and PTA duration were not
significant.
Table 12a. THE RELATIONSHIP OF PRE TRAUMA PERSONALITY AND INJURY RELATED VARIABLES TO PSYCHOSOCIAL OUTCOME, USING 2 TAILED PEARSON CORRELATIONS. RATINGS BY SUBJECTS IN THE LONGITUDINAL STUDY.
6 12 18 24 30 MONTHS MONTH MONTHS MONTH MONTHS
S S EASY GOING -. 02 . 08 -. 36 . 17 -. 11 DISPOSITION
LOCUS OF -. 38 . 19 -. 55* -. 16 . 38 CONTROL
OPTIMISM . 30 -. 52* . 71 . 32 -. 56
USE OF HUMOUR -. 28 -. 15 . 30 -. 02 . 85**
PHYSICAL -. 17 -. 10 . 44 -. 06 . 43 FUNCTION
COGNITIVE . 01 . 02 . 20 -. 09 . 15
FUNCTION
EXECUTIVE -. 07 . 75** -. 14 -. 01 . 11 FUNCTION
PSYCHOSOCIAL . 05 . 23 . 56* . 11 . 20 FUNCTION
*= p<. 05 ** = p<. 01

48
Table 12b. THE RELATIONSHIP OF POST TRAUMA PERSONALITY AND INJURY RELATED VARIABLES TO PSYCHOSOCIAL OUTCOME, USING 2 TAILED PEARSON CORRELATIONS. RATINGS BY SUBJECTS IN THE LONGITUDINAL STUDY.
6 12 18 24 30 MONTHS MONTH MONTHS MONTH MONTHS
S S EASY GOING -. 49** -. 65** -. 50** -. 49** -. 58** DISPOSITION
LOCUS OF -. 29 -. 05 -. 19 -. 15 -. 17 CONTROL
OPTIMISM . 40 . 23 . 31 * . 37' . 32**
NEUROTICISM -. 57** -. 30 -. 40** -. 45** -. 49**
EXTROVERSION . 43* . 62** . 60' . 58** . 63**
USE OF HUMOUR . 09 . 47** . 53** . 54** . 64**
PHYSICAL . 24 -. 06 . 34** . 19 . 38**
FUNCTION
COGNITIVE . 44' . 46** . 59** . 57** . 59'
FUNCTION
EXECUTIVE . 35
. 52** . 57** . 53** . 61 FUNCTION
PSYCHOSOCIAL . 50** . 69** . 84** . 80' ----
FUNCTION
= r<. u5 -= r<. uui
This is broadly supported by the relative and control ratings. However results
from the cross sectional study indicate that better psychosocial outcome is only
related consistently to more easy going disposition and current psychosocial
function. (Tables 13a and 13b).
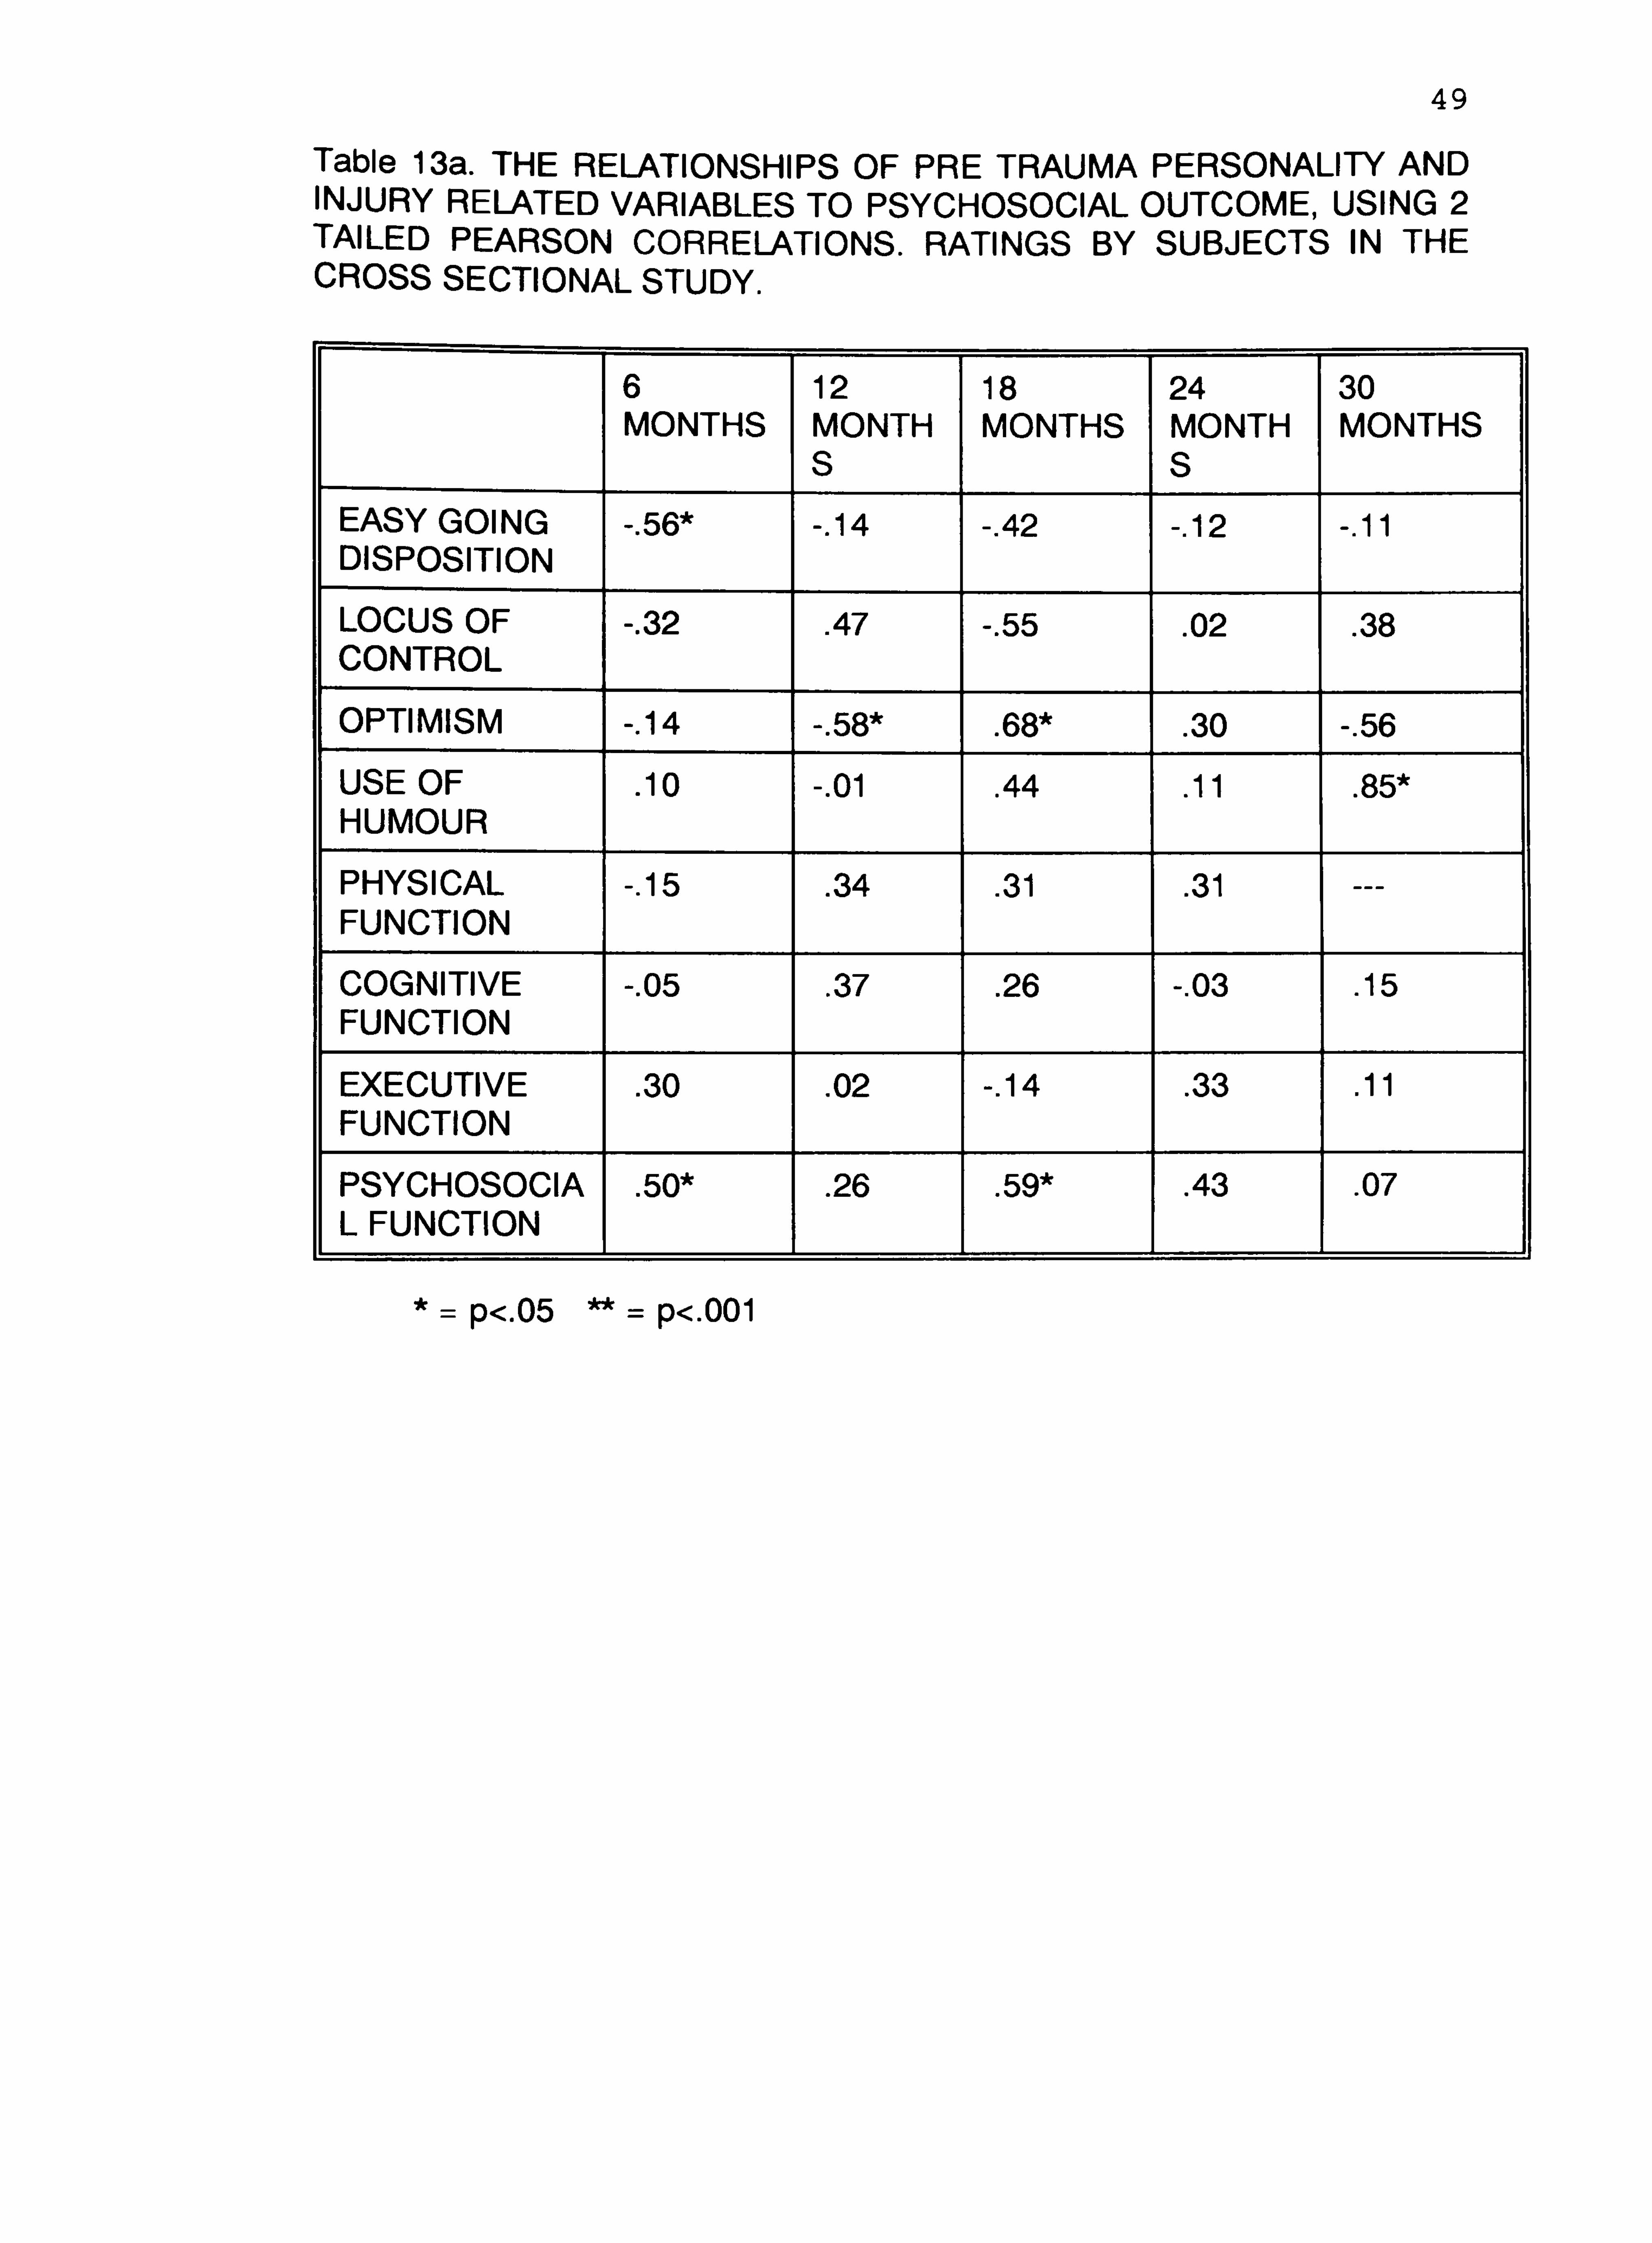
49
Table 13a. THE RELATIONSHIPS OF PRE TRAUMA PERSONALITY AND INJURY RELATED VARIABLES TO PSYCHOSOCIAL OUTCOME, USING 2 TAILED PEARSON CORRELATIONS. RATINGS BY SUBJECTS IN THE CROSS SECTIONAL STUDY.
6 12 18 24 30 MONTHS MONTH MONTHS MONTH MONTHS
S S EASY GOING -. 56* -. 14 -. 42 -. 12 -. 11 DISPOSITION
LOCUS OF -. 32 . 47 -. 55 . 02 . 38 CONTROL
OPTIMISM -. 14 -. 58* . 68* . 30 -. 56
USE OF . 10 -. 01 . 44 . 11 . 85*
HUMOUR
PHYSICAL -. 15 . 34 . 31 . 31 --- FUNCTION
COGNITIVE -. 05 . 37 . 26 -. 03 . 15 FUNCTION
EXECUTIVE . 30 . 02 -. 14 . 33 . 11 FUNCTION
PSYCHOSOCIA . 50* . 26 . 59* . 43 . 07 L FUNCTION
*= p<. 05 ** = p<. 001

50
Table 13b. THE RELATIONSHIPS OF POST TRAUMA PERSONALITY AND INJURY RELATED VARIABLES TO PSYCHOSOCIAL OUTCOME, USING 2 TAILED PEARSON CORRELATIONS. RATINGS BY SUBJECTS IN THE CROSS SECTIONAL STUDY.
6 12 18 24 30 MONTHS MONTH MONTHS MONTH MONTHS
S S EASY GOING -. 75** -. 61 * -. 69* -. 73** -. 42 DISPOSITION
LOCUS OF -. 15 . 19 -. 45 -. 18 . 22
CONTROL
OPTIMISM . 23 . 51* . 39 . 12 -. 27
NEUROTICISM -. 55* -. 22 -. 40 -. 50* -. 03
EXTROVERSION . 25 . 22 . 67* . 68* . 42
USE OF HUMOUR . 22 . 35 . 60* . 78** . 07
PHYSICAL . 40 . 23 . 63* . 57* . 04
FUNCTION
COGNITIVE . 73** . 38 . 81 . 73** . 29
FUNCTION
EXECUTIVE . 82** . 73** . 50 . 89** . 71
FUNCTION
PSYCHOSOCIAL . 53** . 82** . 67** . 57* ---
FUNCTION -= p<. u3 -- = p<. uu i
The other correlations present as a confusing picture with no readily
interpretable pattern, indicating that reliance upon a single time slice or upon
cross sectional designs will provide different results than from longitudinal
designs. Given the advantages of the latter (Edwards and Cooper 1988), it is
reasonable to conclude that results from cross sectional studies will be less
accurate.

51
3.4 Discussion
3.4.1 Insight
The results from both the cross sectional and longitudinal designs indicate
that insight - measured as accuracy of subject compared with relative ratings -
is good. In fact the brain injured subjects were more accurate than the
controls. This may be due to the way that Headley Court is structured; the
brain injured relatives are much more closely involved with the rehabilitation
process and for a longer period of time than the control relatives. The controls
are admitted to Headley Court for physical rehabilitation, it is therefore likely
that the relatives assume that there will be few, if any, emotional, personality
or cognitive concerns. In fact the results of the present study demonstrate that
this is not necessarily true. A more distant involvement with the patient and
assumptions about the effects of the injury would certainly go some way
towards explaining less accuracy in the control group. Analysis comparing the
discrepancy between subject and relative ratings, and analysis using
correlations, demonstrate significant differences between subject and relative
on all post trauma variables. This does not support the initial findings. However
the results from the controls showed the same pattern, indicating that
neurologically damaged people are at least as accurate as other traumatised
groups in self ratings. This result suggests that self rating scales need to be
treated with caution.
The methods used in the present study assume that relative ratings will be
accurate. In fact insight is a difficult concept which should perhaps incorporate
professional ratings as well wherever possible.
In addition insight for current status is only one aspect; insight for predicted
outcome could also be measured. Insight can also be defined in terms of

52
direction, since an individual can be optimistic or pessimistic in comparison with
the relative. There is some evidence that being optimistic in rehabilitation leads
to better outcome (Herbert and Powell 1989), although these results were not
replicated in a brain injured subject group (Malia and Powell 1993).
In conclusion then, it would appear that this group of brain injured people
can be relied on at least as well as other traumatised groups, to provide
accurate self reports. There is, however, a need for a great deal more research
into the nature of insight.
3.4.2 Personality changes
The results demonstrate that changes do occur after brain injury in the areas
of locus of control, easy going disposition, use of humour and optimism.
However they do not continue to change over time post injury, certainly up to
30 months post injury. It is significant that some personality changes were also
noted in the control group. There are two possible explanations for this; firstly,
emotional and personality changes occur as a result of injury trauma, or
secondly, the questionnaire approach is an inaccurate method of examining
changes in personality. In any case caution should be exercised in attributing
personality changes solely to the brain injury.
3.4.3 Injury related factors with psychosocial outcome
The results from both study designs demonstrate no relationships between
location of injury and the general measures of severity of injury with
psychosocial outcome. However the longitudinal study results demonstrated
significant relationships between cognitive, physical and executive skills with
psychosocial outcome. This may be because these measures provide a more

53
sensitive individualised assessment on level of severity. After all, severity as
measured by PTA or coma duration is predictive of problems, whereas severity
as measured by actual current difficulties is reflective of problems.
These results would also indicate that psychosocial outcome is more
influenced by current factors than past stable aspects. The results from the
cross sectional study were not consistent, reflecting the difficulties inherent in
interpretations from time slice studies.
3.4.4 Personality variables with psychosocial outcome
The results from the longitudinal study demonstrate significant relationships
between most, but not all, of the personality attributes. Locus of control and
optimism are not consistently linked. This may be because of methodological
considerations; the measures of locus of control and optimism were rated
significantly differently by the subjects compared with the relatives, indicating
the present results may be due to inaccurate self ratings of these two
personality attributes, although this was also true of all the other personality
variables. Perhaps more important is the complexity of the questionnaire;
certainly the most complex questionnaire included is the locus of control scale,
and previous researchers who found a relationship used different methods for
measuring locus of control (Moore et al 1992, Stephens 1991).
These results may also be explained by the method of measuring
psychosocial outcome. It is possible that measures of specific aspects of
psychosocial outcome would be correlated with locus of control and optimism.
The studies by Moore et al (1992), and Stephens (1991) did use a specific
measure of depression.
In fact, principal components factor analysis with orthogonal rotation, was

54
performed on the psychosocial rating scale in order to examine the existence
of different aspects. Despite a7 factor model emerging, a single factor
explained the majority of the variance, as indicated in table 14. Analysis using
separate aspects from this scale was therefore not performed. The results
were supported by the relative ratings.

55
Table 14. Principal Components Factor Analysis on the psychosocial rating scale, using subjects in the longitudinal study. Rotated Factor Matrix.
PSYCHOSOCI AL RATING SCALE ITEMS
FACT OR 1
FACT OR 2
FACT OR 3
FAC TO R4
FACT OR 5
FACT OR 6
FACT OR 7
1 . 21 . 57 . 35 . 43 -. 09 . 01 . 07
2 . 37 . 57 . 25 . 30 -. 08 . 07 . 34
3 . 12
. 14 . 13 . 07
. 17 . 05 . 82
4 . 55
. 29 -. 07 . 05 . 13
. 27 . 14
5 . 18
. 04 . 71 . 02 . 08
. 15 -. 01
6 . 53 . 08 . 42 . 02 . 05 . 37 -. 05
7 . 64
. 28 . 32
. 25 . 15 . 08 . 26
8 . 58
. 29 . 29
. 20 . 27 -. 01 . 21
9 . 54
. 55 . 24 . 18 . 02 . 24 . 20
10 . 58 . 38 . 28 . 35 -. 07 . 10 . 13
11 . 73 . 15 . 17 . 29 -. 13 . 13 . 02
12 . 06 -. 08 . 10 . 75 . 01 . 29 . 24
13 . 38 . 26 . 17 . 67 . 19 -. 01 -. 27
14 . 26 . 33 . 18 . 72 . 11 -. 02 -. 01
15 . 51 . 12 . 15
. 39 . 41 -. 10 . 17
16 . 45 . 61 . 26 . 10 . 04 . 24 . 06
17 . 15 . 16 . 78 . 28
. 13 -. 07
. 12
18 . 23 . 49 . 43 . 28 -. 09 . 27 -. 09
19 . 26 . 24 . 63 . 10 -. 01 . 04 . 32
20 . 11 -. 01 . 09 . 15 . 79 . 26 . 08
21 . 37 . 09 . 16 . 21 . 41 . 45 . 26
22 . 05 . 23 . 09 . 20 . 15 . 76 . 02
23 . 30 . 26 . 57 . 26 . 15 . 14 . 14
24 . 01 . 57 . 19 . 30 . 28 . 28 -. 32
25 . 52 . 61 . 11 . 06 -. 02 . 01 . 01
26 . 22 . 75 . 05
. 02 . 21 . 06
. 19
27 -. 01 . 35 . 43 . 07 . 44 -. 28
. 11
28 . 74 . 16 . 27 . 04 . 20 -. 14 -. 07
CUM PCT 40 46 52 57 61 65 69

56
The results from the cross sectional study design support these findings - but
only demonstrate consistent links between easy going disposition and
psychosocial outcome. This again highlights the difficulties in making full
interpretations from such studies. The present results indicate that longitudinal
studies not only allow the direction of causality to be inferred but also provide
a more detailed picture of relationships between variables. However it should
not be forgotten that the results from the longitudinal study design may be less
accurate than those from the cross sectional design. Further research is
needed to supplement the results before firm conclusions can be reached on
which design is more accurate in the present study.
It is very interesting that no pretrauma personality variables are linked in
either study design. This again would support the idea that psychosocial
outcome is more influenced by current abilities than past abilities. Given that
all personality variables changed after the injury it is perhaps not surprising that
the pre trauma variables exert no influence on later outcome. This is
contradictory to beliefs commonly expressed in the literature (Deaton 1993).
However the lack of relationship between pre trauma personality, post
trauma locus of control and optimism with psychosocial outcome may be due
to looking for a direct link. It is possible that they are linked but only through
a moderating variable. It has been suggested that coping could act as such a
moderator (Van Zomeren et al 1984, Hinkeldey and Corrigan 1990, Klonoff et
al 1986, O'Shanick 1989). The next two studies were designed to explore this
idea further.

57
4 STUDY TWO. ESTABLISHING THE FACTOR STRUCTURE FOR THE WAYS
OF COPING CHECKLIST
4.1 Introduction and statement of the problem
4.1.1 Introduction
The only way to assess coping skills is by self rating scales. The most widely
used scale is the Ways of Coping Checklist (WCCL) (Lazarus and Folkman
1984, Vitaliano et al 1987), perhaps because of its good methodological
reviews (Tennen and Herzberger 1985). This questionnaire is relatively lengthy,
consisting of 42 items, and it is common practice to simplify these into
categories for subsequent analysis, by using factor analytical techniques.
Factor analysis allows the questionnaire items to be grouped into a smaller
number of related items. Each grouping is referred to as a factor, which is
given a label according to the common characteristics of its items. The factors
are then used in subsequent analysis.
Factor structures on the WCCL vary between researchers, although they do
retain the same overall pattern. There is agreement on the broad two factor
structure suggested by Lazarus and Folkman (1984), consisting of problem
focused and emotion focused coping. Further work has broken down these
items into other factors, although no consensus has been reached, for instance
Vitaliano et al (1987) proposed a5 factor model, Scheier et al (1986) a7 factor
model and Moore et al (1989) a3 factor model. Consequently it is
recommended by Tennen and Herzberger (1985) that factor analysis is
performed when using the questionnaire - particularly with new populations,
such as in the current study.
There has been limited reported research linking coping skills and brain
injury, and the factor structure for this group is not clearly established. This

58
study was designed to establish a factor structure for the revised Ways of
Coping Checklist (WCCLR) (Vitaliano et al 1987) with this subject group.
4.1.2 Questions to be addressed
1. What factor structure does the Ways of Coping Checklist yield for brain
injured people?
2. Is this comparable with the factor structures obtained for other health
related problem groups?
4.2 Method
4.2.1 Measures used
The WCCL(R) (Vitaliano et al 1987) was used in this study. It is described
more fully in chapter 3.
4.2.2 Procedures
The 74 subjects from the cross sectional study were sent the WCCL(R) by
post, as described in chapter 3.
4.3 Analysis and Results
The 42 items from the WCCL(R) needed to be grouped into more
manageable chunks for further analysis. Due to the relatively low numbers of
subjects in the study the reliable use of factor analysis was not feasible, so a
Multi Dimensional Scaling Technique (MDS), called ALSCAL, was selected
(Schiffman, Reynolds and Young 1981, Kruskal and Wish 1978, Coxon 1982).
This analysis produces a scatter plot based on the relative similarity of items
to each other, and generally yields stable spaces with only a few subjects.
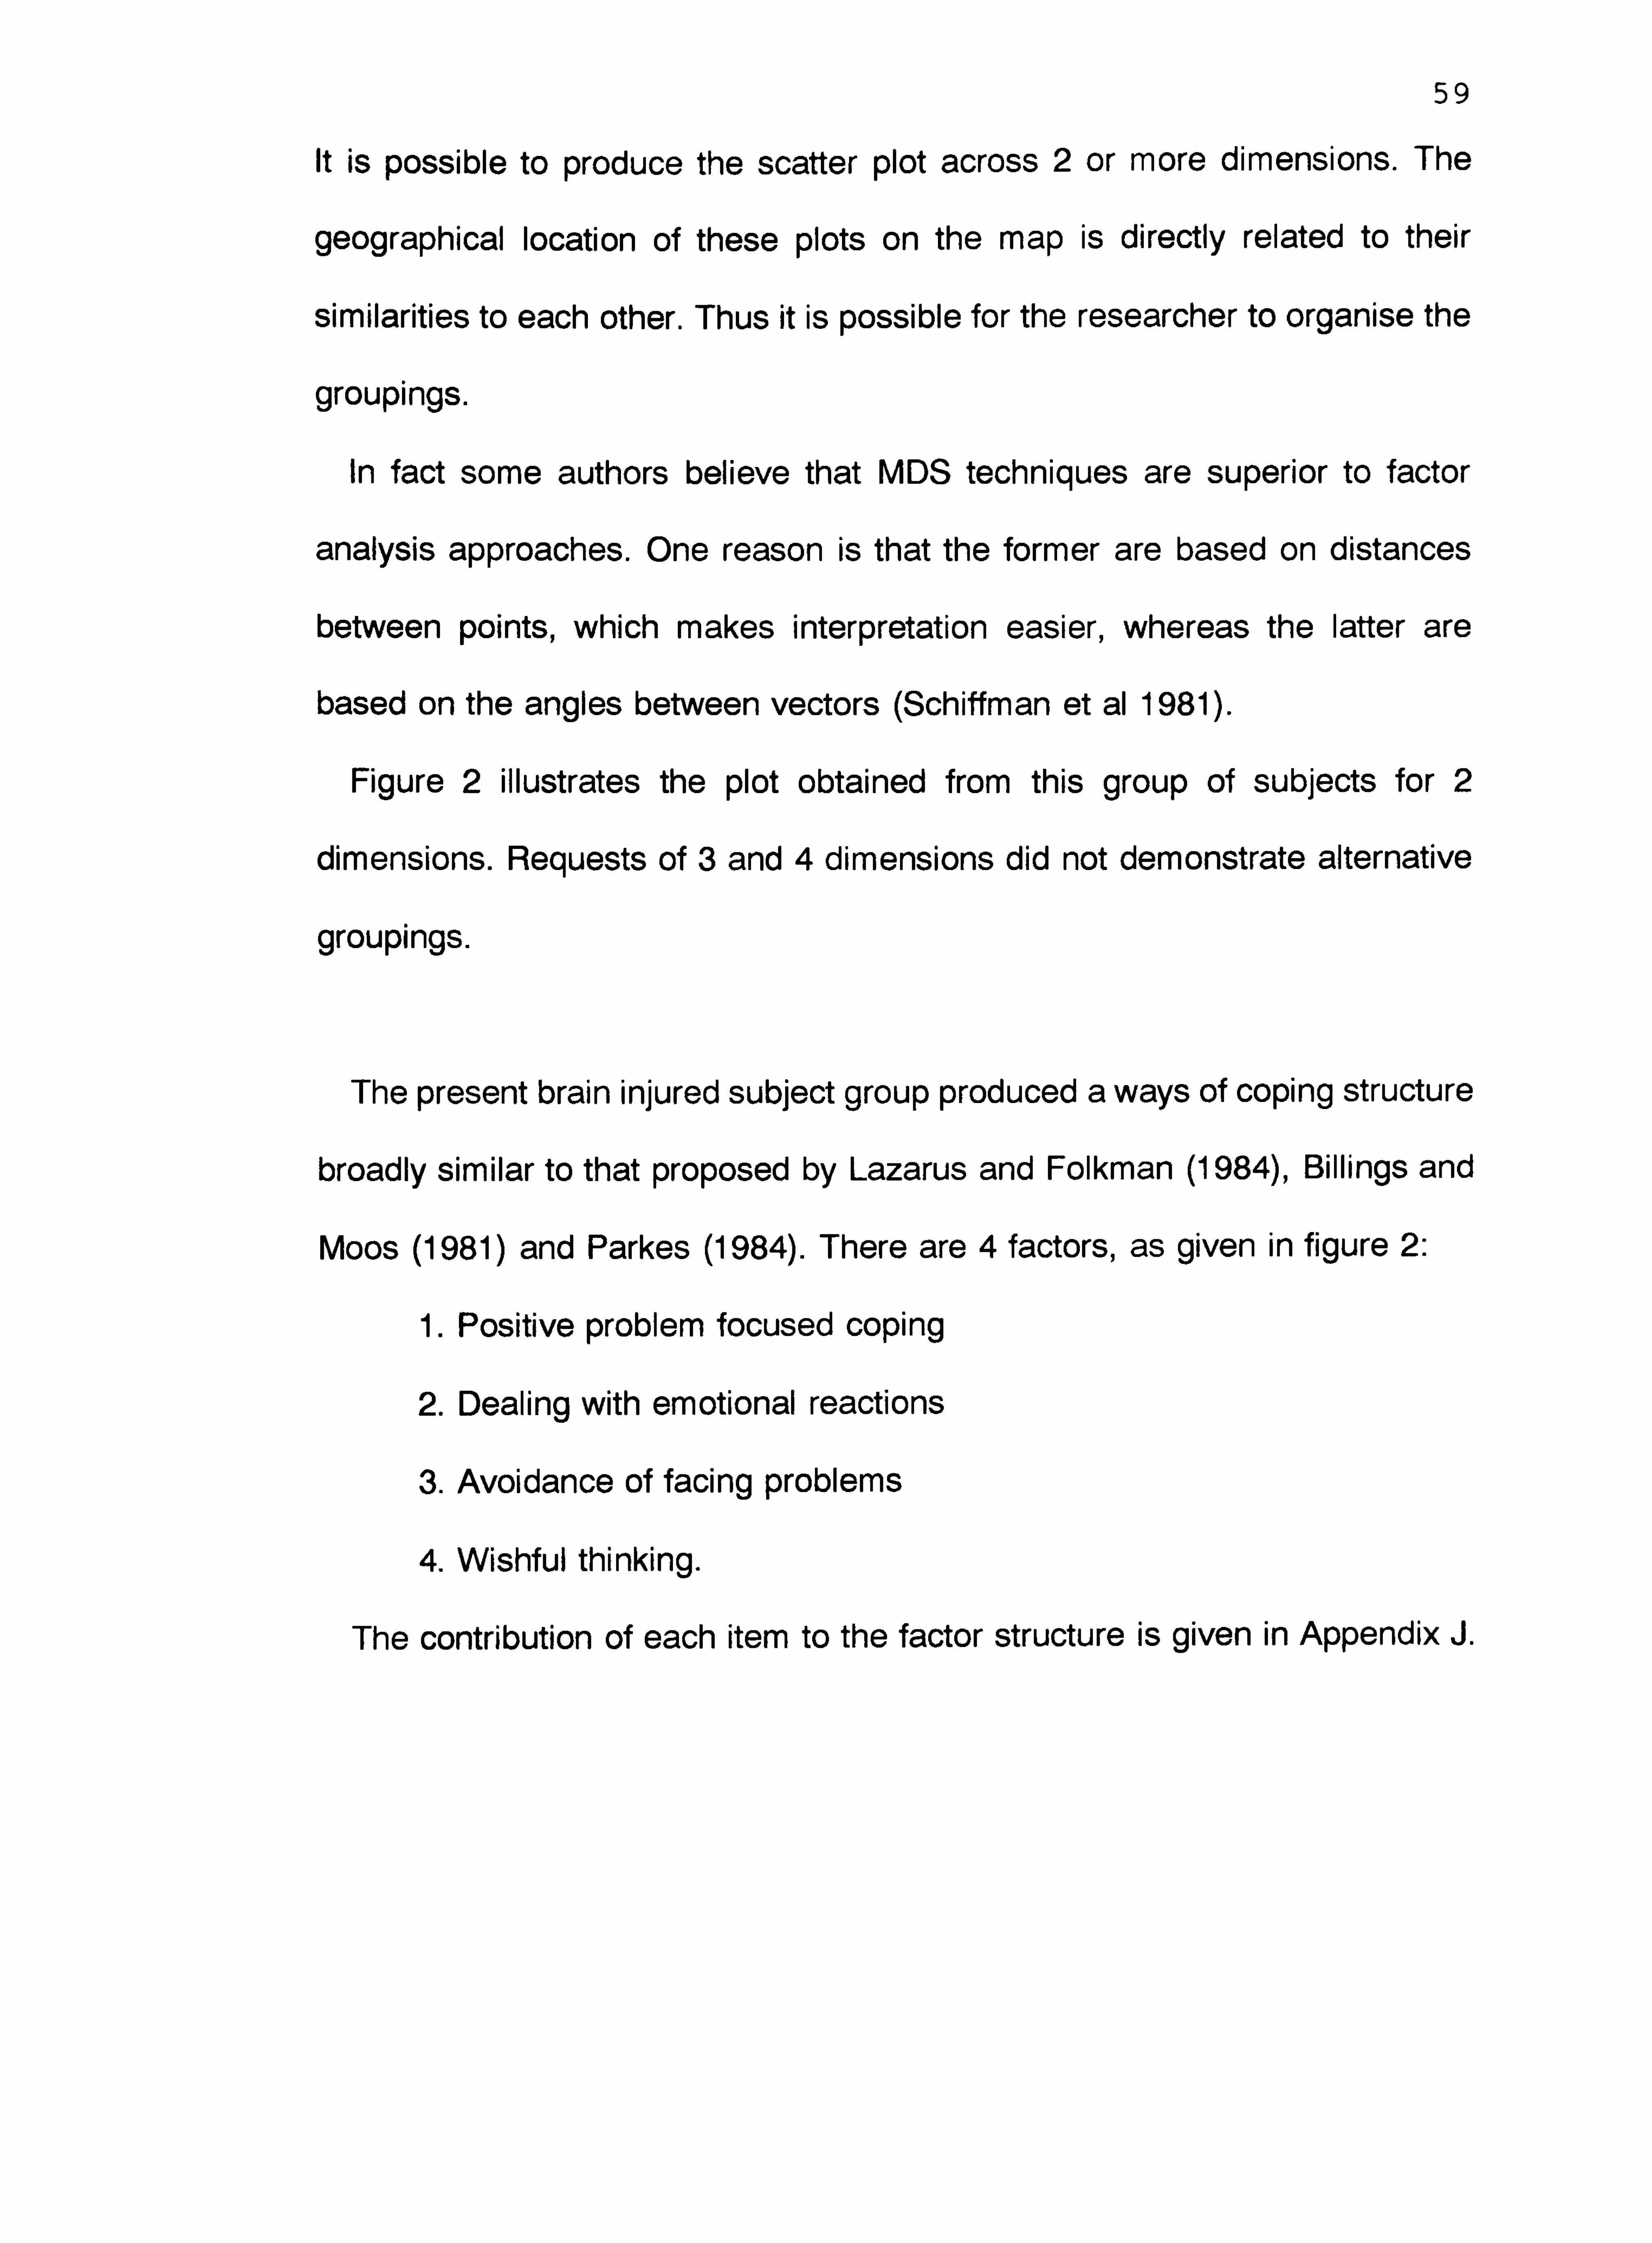
59
It is possible to produce the scatter plot across 2 or more dimensions. The
geographical location of these plots on the map is directly related to their
similarities to each other. Thus it is possible for the researcher to organise the
groupings.
In fact some authors believe that MDS techniques are superior to factor
analysis approaches. One reason is that the former are based on distances
between points, which makes interpretation easier, whereas the latter are
based on the angles between vectors (Schiffman et al 1981).
Figure 2 illustrates the plot obtained from this group of subjects for 2
dimensions. Requests of 3 and 4 dimensions did not demonstrate alternative
groupings.
The present brain injured subject group produced a ways of coping structure
broadly similar to that proposed by Lazarus and Folkman (1984), Billings and
Moos (1981) and Parkes (1984). There are 4 factors, as given in figure 2:
1. Positive problem focused coping
2. Dealing with emotional reactions
3. Avoidance of facing problems
4. Wishful thinking.
The contribution of each item to the factor structure is given in Appendix J.

60
all
W 1 /0 (ý M
"ýN
F/
()M 10
ýr� M ^ý N
COD t7l
14, ol
3ö W Cam' 0
FO. a0. ß ,ýUON GA Gý CSS -OO
/
ýU+ nO 'Ö OM
._ O . fl ÜU
o ý, 3 an ý
CIO
-h
cCC U -ý' t
M--1 bb U UN WýN
UT bA "d ( `v v,
E" ýW -ßö3 Xý

61
4.4 Discussion
This is the first reported factor structure for the WCCL(R) with brain injured
subjects, which supports the structures reported after other health related
problems. The only other reported factor structure (Moore et al 1989,1992)
showed 3 factors, which bear little resemblance to those reported elsewhere:
1. Subjects who made little use of any coping strategy
2. Subjects who made a wide and relatively indiscriminant use of coping
strategies
3. Subjects who relied on relatively specific coping styles
The present results did not yield 3 factors comparable to these. Yet it is
important since it demonstrates that despite brain injury and impaired cognition
individuals can make use of a similar pattern of coping styles as do non
neurologically injured people.
These 4 factors are used in all subsequent analysis in study three. However
it is clear that there is a need for more research on larger groups to help
establish the appropriate factor structure for this group more definitely.
62
5 STUDY THREE. EXPLORING THE RELATIONSHIPS OF INJURY RELATED
VARIABLES AND PERSONALITY TO COPING STYLE AND COPING STYLE
TO PSYCHOSOCIAL OUTCOME
5.1 Introduction and summary of problem
5.1.1 Introduction
The transactional process model of coping (Lazarus and Folkman 1984)
emphasised the interactive, adaptive nature of coping. Styles of coping are
selected by cognitive appraisal processes; primary appraisal assesses the
degree of threat in a given situation, and secondary appraisal assesses what
can be done and how effective this might be. Some researchers argue that
such appraisal processes are not necessarily always rational, rather relying on
heuristics, biases and habits (Edwards and Cooper 1988). Figure 3 is a
graphical representation of this model, based on Moos and Schaefer (1984).

63
tb
O U
O
O E c CA N U O
cri O
U
cc3
4J
O
O
cý
N
; --r ýQ
M 4)
bQ . - F+-1
it
i
ý Z: 94 Q ai ýi
CCM
o o
U
a
.u Cý
0 C/]
4. ) 0-. 4
4-4
0
4. ) ý--i
u
/
14F
4) Ct
I--1
Ct
CCM
Cý

64
It can be seen that there are 3 parts to this model; firstly personality and
injury related factors, secondly styles of coping and cognitive appraisal
processes, and thirdly psychosocial outcome. Coping acts as a moderator
variable on the relationship between personality and injury related variables
with psychosocial outcome (Van Zomeren et al 1984, Klonoff et al 1986,
O'Shanick 1989, Fugel-Meyer and Fugel-Meyer 1988). This relationship has not
been explored with regard to brain injury through empirical research.
Coping and appraisal skills have been shown to be related to both
personality and outcome after a variety of other health related problems (Moos
and Billings 1982, Holahan and Moos 1985,1986,1987, Miller et al 1988,
Vitaliano et al 1985 and Folkman et al 1986). There is a limited amount of
reported research which has examined these relationships after brain injury,
and in most cases they have not established a factor structure for coping style
(Frank et al 1990, Willer et al 1991, Moore et al 1989, Moore and Stambrook
1992).
This study then is designed to explore the relationships of coping to
personality and injury related variables and of coping to psychosocial outcome.
6.1.2 Summary of problem
1. Are personality and injury related variables linked to coping style, and in
what way?
2. Is coping style related to psychosocial outcome, and in what way?
3. Can psychosocial outcome be predicted better when coping style is
included as a moderator variable?

65
5.2 Method
5.2.1 Measures used
The personality, psychosocial and injury related measures of severity of
injury are used, as described in chapter 3. In addition the 4 factors established
from Study two are used as styles of coping and the measures of primary and
secondary appraisal are used as described in chapter 3.
5.2.2 Procedures
The participants in the cross sectional and longitudinal studies were used,
as detailed in chapter 3.
5.3 Analysis and results
5.3.1 Reliability and Distribution
These results have already been described in Study 1. In summary the
distributions were normal enough to justify use of parametric statistics. The
reliability scores ranged from moderately low to moderately high. Results from
the relatives and controls support these findings.
5.3.2 Personality and injury related variables with coping skills.
2 tailed Pearson Correlations were computed between each of the
personality measures and injury related variables with each of the 4 coping
styles. Results from the longitudinal study show that no variables were
consistently related to problem focused or emotion focused coping styles
across each of the 5 time points. This is broadly supported by the control
ratings.
More use of wishful thinking as a coping strategy is related to less

66
extroversion, less optimism and higher incidence of psychosocial problems at
most stages post injury. These results are broadly supported by the control
ratings.
More use of avoidance coping as a strategy is related to a less easy going
disposition, less optimism, more neuroticism, less extroversion, less use of
humour and more cognitive and executive problems at most stages post injury.
Tables 15a and 15b. No pre trauma personality attributes or general injury
related factors were significantly related with coping. These results are broadly
supported by the control ratings.

67
Table 15a. THE RELATIONSHIP OF PRE TRAUMA PERSONALITY AND INJURY RELATED VARIABLES TO COPING SKILLS. USING 2 TAILED PEARSON CORRELATIONS. RATINGS BY SUBJECTS IN THE LONGITUDINAL STUDY.
6 12 18 24 30 MONTHS MONTH MONTHS MONTH MONTHS
S S EASY GOING p . 06 p -. 16 p . 02 p -. 11 p . 83* DISPOSITION e . 26 e -. 09 e . 27 e -. 32 e . 33
a . 19 a . 32 a . 35 a . 23 a -. 24
w-. 24 w. 41 w. 19 w. 14 w. 56
LOCUS OF p -. 26 p . 50 p . 05 p -. 31 p -. 09 CONTROL e . 27 e . 45 e . 17 e -. 08 e -. 69
a . 38 a -. 16 a . 28 a . 14 a -. 60 w . 20 w . 12 w . 09 w. 53* w -. 54
OPTIMISM p -. 17 p -. 51 p -. 23 p -. 24 p . 04 e . 06 e -. 06 e . 16 e -. 32 e . 35 a . 28 a . 30 a -. 14 a . 61 * a . 55 w . 19 w . 04 w -. 25 w -. 26 w . 24
USE OF p -. 28 p -. 28 p -. 15 p . 31 p -. 07 HUMOUR e -. 43 e -. 50 e -. 19 e . 01 e -. 25
a -. 18 a -. 24 a -. 27 a -. 14 a . 15 w -. 18 w -. 01 w -. 06 w -. 17 w -. 03
PHYSICAL p . 12 p -. 34 p -. 23 p . 29 p . 28 FUNCTION e . 13 e . 12 e -. 68** e . 31 e . 30
a -. 04 a -. 44 a -. 82** a . 05 a -. 41 w . 11 w -. 11 w -. 59 w -. 21 w -. 15
COGNITIVE p -. 26 p -. 03 p -. 21 p -. 10 p -. 83* FUNCTION e . 01 e . 13 e . 09 e -. 25 e -. 12
a -. 08 a -. 50 a . 22 a -. 12 a . 31 w -. 14 w -. 22 w . 39 w -. 04 w -. 39
EXECUTIVE p . 26 p . 44 p -. 24 p . 30 p -. 71 FUNCTION e . 03 e . 21 e . 00 e . 27 e -. 15
a-. 30 a . 01 a . 19 a . 00 a . 38 w . 07 w . 16 w . 18 w -. 13 w -. 39
PSYCHOSOCIA p . 29 p . 10 p -. 22 p . 12 p -. 09 L FUNCTION e -. 04 e -. 23 e -. 34 e . 06 e . 41
a -. 24 a -. 29 a -. 40 a -. 41 a . 51 L w .
25 w -. 32 w . 01 w -. 33 w . 41
p= problem focused coping e= emotion focused coping a= avoidance coping w= wishful thinking coping
*= p<. 05 ** = p<. 01
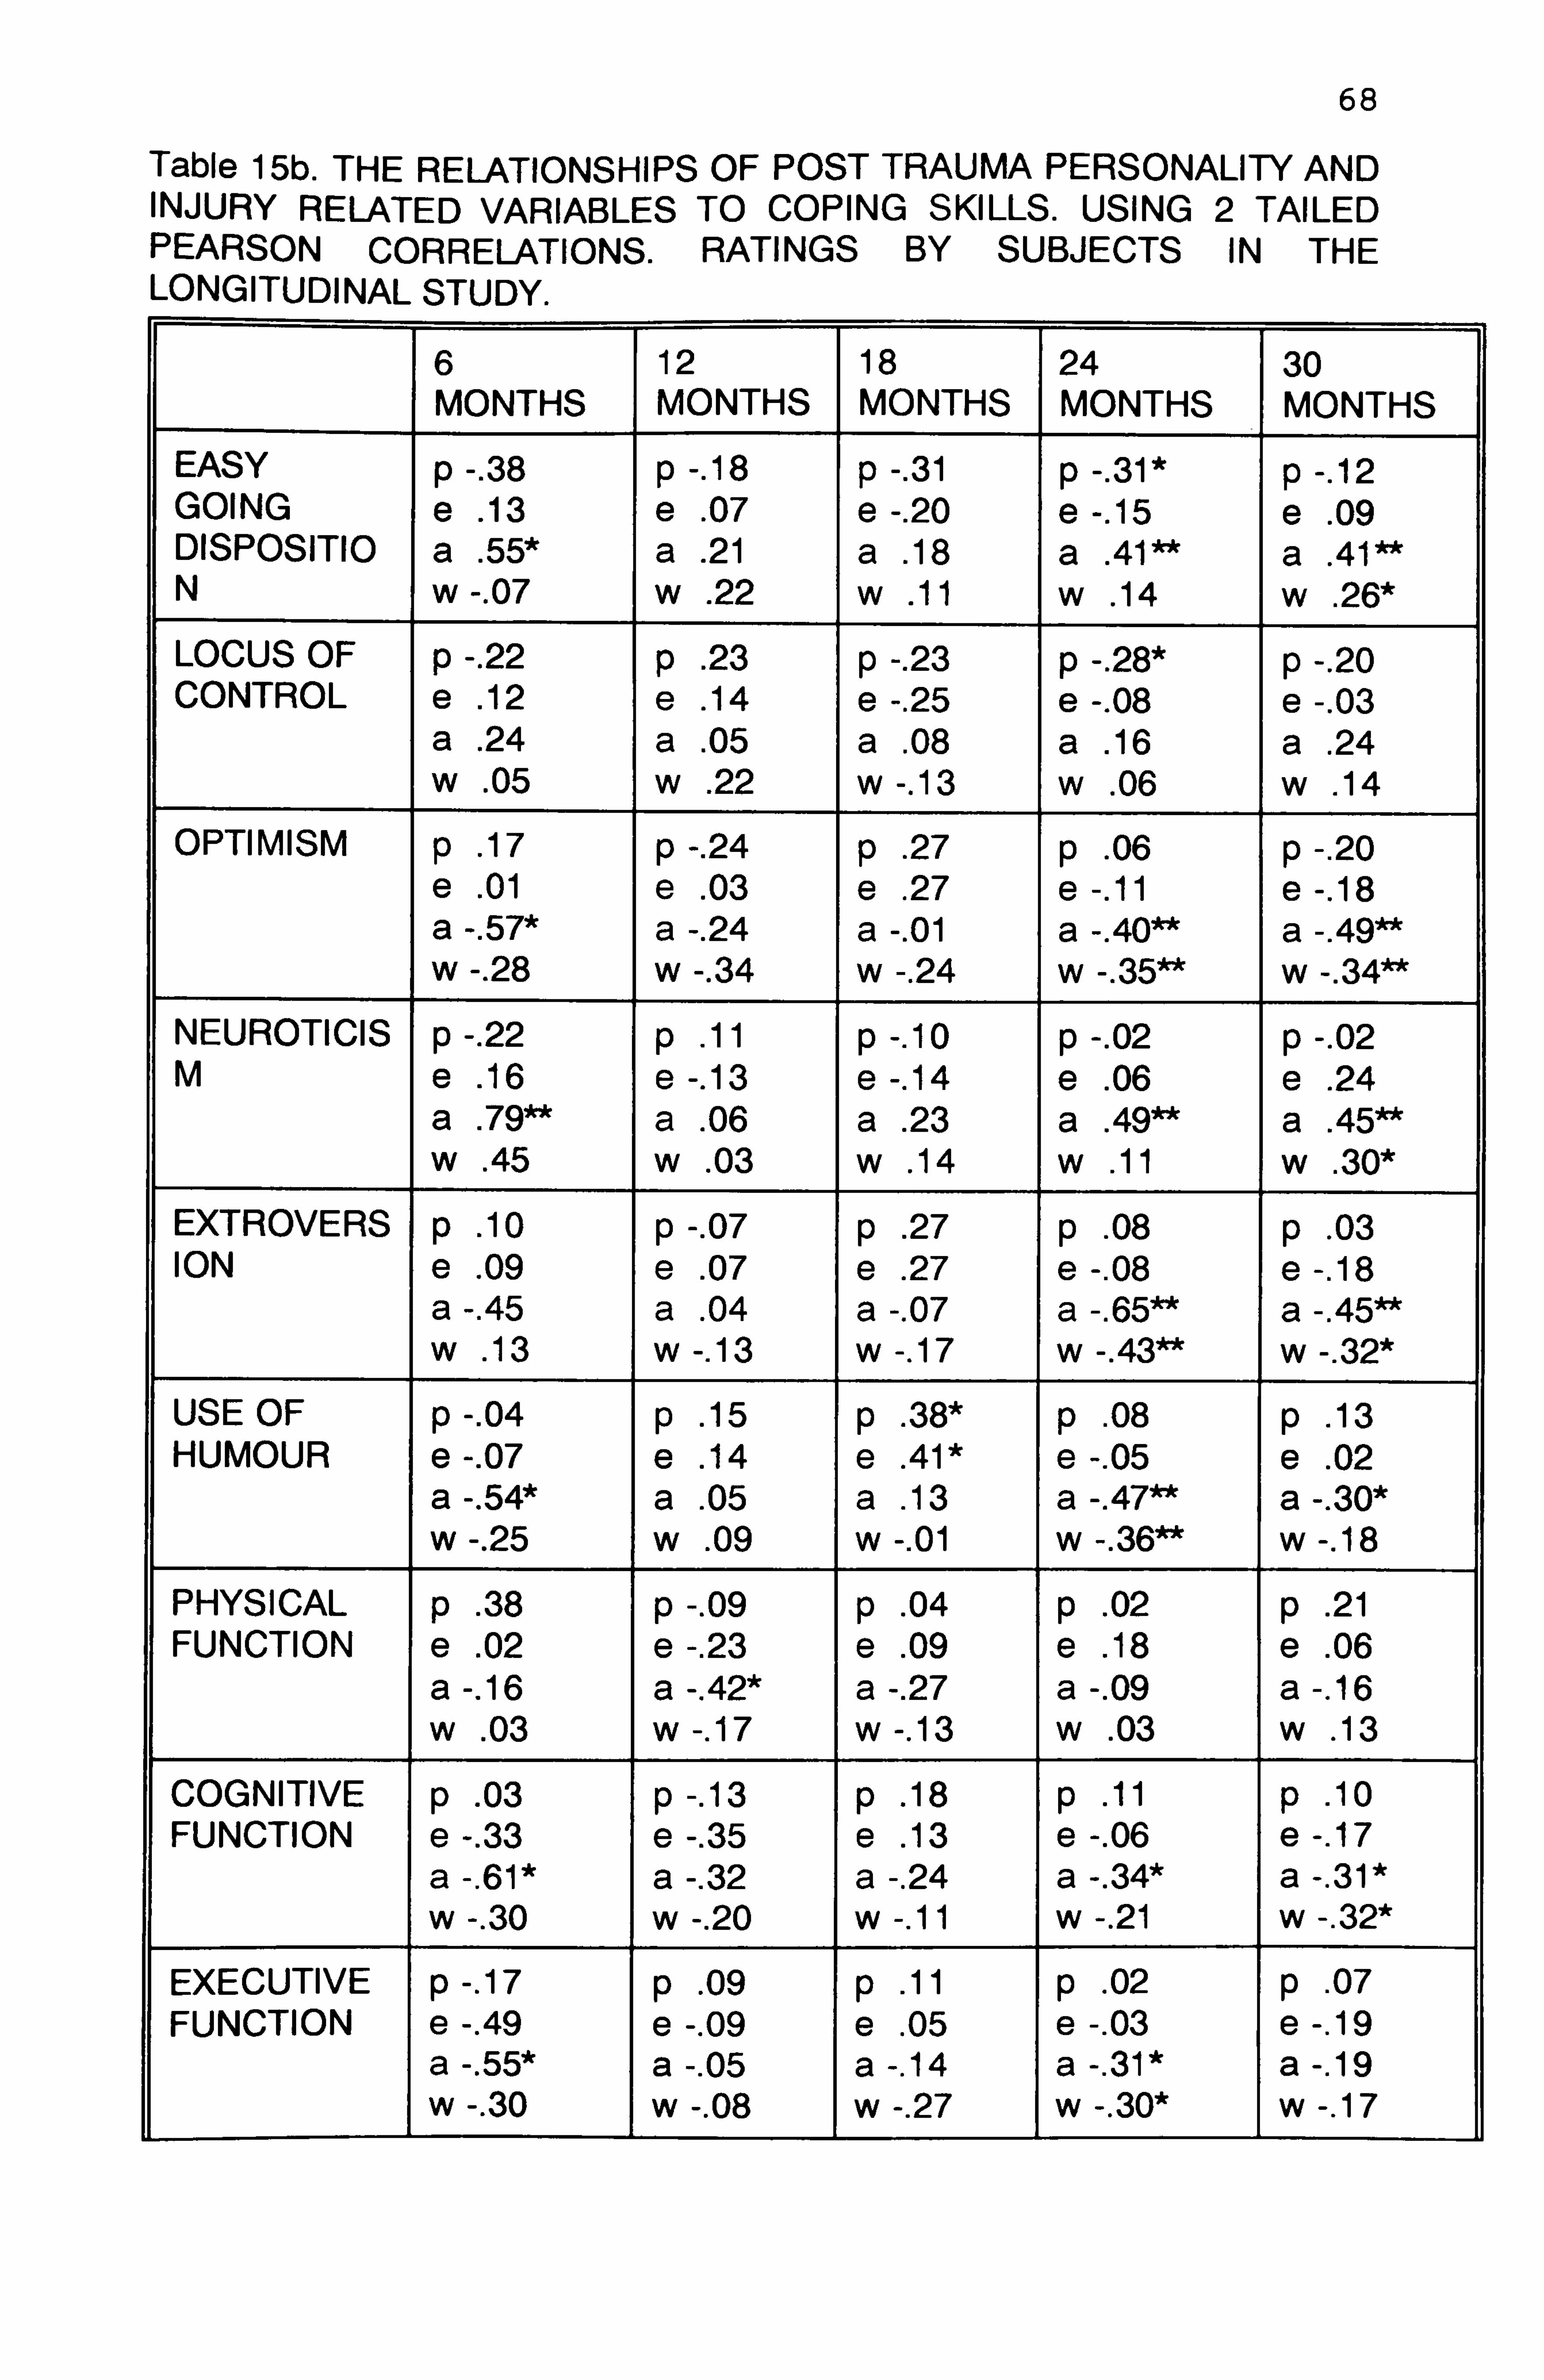
68
Table 15b. THE RELATIONSHIPS OF POST TRAUMA PERSONALITY AND INJURY RELATED VARIABLES TO COPING SKILLS. USING 2 TAILED PEARSON CORRELATIONS. RATINGS BY SUBJECTS IN THE LONGITUDINAL STUDY.
6 12 18 24 30 MONTHS MONTHS MONTHS MONTHS MONTHS
EASY p -. 38 p -. 18 p -. 31 p -. 31* p -. 12 GOING e . 13 e . 07 e -. 20 e -. 15 e . 09 DISPOSITIO a . 55* a . 21 a . 18 a . 41 a . 41 N w -. 07 w . 22 w . 11 w . 14 w . 26*
LOCUS OF p -. 22 p . 23 p -. 23 p -. 28* p -. 20 CONTROL e . 12 e . 14 e -. 25 e -. 08 e -. 03
a . 24 a . 05 a . 08 a . 16 a . 24 w . 05 w . 22 w -. 13 w . 06 w . 14
OPTIMISM p . 17 p -. 24 p . 27 p . 06 p -. 20 e . 01 e .
03 e . 27 e -. 11 e -. 18 a -. 57* a -. 24 a -. 01 a -. 40** a -. 49** w -. 28 w -. 34 w -. 24 w -. 35** w -. 34**
NEUROTICIS p -. 22 p . 11 p -. 10 p -. 02 p -. 02 M e . 16 e -. 13 e -. 14 e . 06 e . 24
a . 79** a . 06 a . 23 a . 49** a . 45** w . 45 w . 03 w . 14 w . 11 w . 30*
EXTROVERS p . 10 p -. 07 p . 27 p . 08 p . 03 ION e . 09 e . 07 e . 27 e -. 08 e -. 18
a -. 45 a . 04 a -. 07 a -. 65** a -. 45** w . 13 w -. 13 w -. 17 w -. 43** w -. 32*
USE OF p -. 04 p . 15 p . 38* p . 08 p . 13 HUMOUR e -. 07 e . 14 e . 41 * e -. 05 e . 02
a -. 54* a . 05 a . 13 a -. 47** a -. 30* w -. 25 w . 09 w -. 01 w -. 36** w -. 18
PHYSICAL p . 38 p -. 09 p . 04 p . 02 p . 21 FUNCTION e . 02 e -. 23 e . 09 e . 18 e . 06
a -. 16 a -. 42* a -. 27 a -. 09 a -. 16 w . 03 w -. 17 w -. 13 w . 03 w . 13
COGNITIVE p . 03 p -. 13 p . 18 p . 11 p . 10 FUNCTION e -. 33 e -. 35 e . 13 e -. 06 e -. 17
a -. 61* a -. 32 a -. 24 a -. 34* a -. 31* w -. 30 w -. 20 w -. 11 w -. 21 w -. 32*
EXECUTIVE p -. 17 p . 09 p . 11 p . 02 p . 07 FUNCTION e -. 49 e -. 09 e . 05 e -. 03 e -. 19
a -. 55* a -. 05 a -. 14 a -. 31* a -. 19 w -. 30 w -. 08 w -. 27 w -. 30* w -. 17

69
PSYCHOSO p -. 06 p . 14 p . 24 p . 09 p . 08 CIAL e -. 49 e -. 13 e . 10 e -. 18 e -. 20 FUNCTION a . 74** a -. 12 a -. 18 a -. 52** a -. 36**
w -. 26 w -. 19 w -. 23 w -. 32* w -. 30*
p= problem focused coping e= emotion focused coping a= avoidance coping w= wishful thinking coping *= p<. 05 ** = p<. 01
Results from the cross sectional study show little consistency in pattern.
5.3.3 Coping style and psychosocial outcome.
2 tailed Pearson Correlations were computed between each of the 4 coping
factors with psychosocial outcome. Results from the longitudinal study showed
that better psychosocial outcome is related to less use of avoidance coping,
which is however only significant at 24 (. 46 p<. 01) and 30 months (. 36 p<. 01)
post injury. Table 16.

70
Table 16. TWO TAILED PEARSON CORRELATIONS BETWEEN COPING AT EACH TIME POINT POST INJURY AND PSYCHOSOCIAL OUTCOME. RATINGS BY SUBJECTS IN THE LONGITUDINAL STUDY.
6 12 18 24 30 MONTHS MONTHS MONTHS MONTHS MONTHS
PROBLEM . 03 . 19 . 11 . 13 . 08 FOCUSED
EMOTION -. 17 -. 01 . 10 -. 10 -. 20 FOCUSED
AVOIDANC -. 46 -. 09 -. 18 -. 46** -. 36** E COPING
WISHFUL -. 32 -. 08 -. 23 -. 22 -. 30* THINKING
PRIMARY -. 48** -. 40* -. 56** -. 45** -. 49** APPRAISAL
SECONDAR -. 06 . 26 . 26 . 13 . 07 Y APPRAISAL
*= p<. 05 ** = p<. 01
The control ratings indicate that better psychosocial outcome is related to
less use of avoidance and wishful thinking coping strategies at 24 and 30
months post injury.
In addition better psychosocial outcome is related to a lower perceived threat
(primary appraisal) at most stages post injury (Table 16). This is broadly
supported by the control ratings.
The results from the cross sectional study broadly support these findings
when the whole group are examined together, with better psychosocial
outcome related to less use of emotion focused, avoidance and wishful thinking
coping strategies. However the results are not supportive when each time
group is examined separately - demonstrating the difficulties with
interpretations from cross sectional designs (Table 17). Control ratings support
the subject ratings.

71 Table 17. TWO TAILED PEARSON CORRELATIONS BETWEEN COPING STYLE AND PSYCHOSOCIAL OUTCOME. RATINGS BY SUBJECTS FROM THE CROSS SECTIONAL STUDY.
PROBLEM FOCUSED
EMOTION FOCUSED
AVOIDANCE WISHFUL THINKING
WHOLE SUBJECT GROUP
-. 01 -. 27* -. 47*** -. 29**
6 MONTHS -. 20 -. 56** -. 75** -. 36
12 MONTHS . 03 . 04 -. 26 -. 08
18 MONTHS . 08 -. 16 -. 49 -. 32
24 MONTHS -. 01 . 02 -. 48 -. 32
30 MONTHS -. 17 -. 57 -. 10 -. 35
*= p<. 05 ** = p<. 01 *** = P<. 001
5.3.4 Prediction of psychosocial outcome
Having established significant relationships between personality, injury
related variables, coping and psychosocial outcome the next logical step is to
examine how much of the psychosocial outcome can be predicted.
Regressions were only calculated using the longitudinal data.
Four multiple regressions were computed:
1. Pre trauma personality as rated at each of the 6 monthly time points with
psychosocial outcome. Individuals were included in the study at different time
points post injury. Those who were included at 6 and 12 months post injury
represent a large part of the group (n=28), and yet their ratings of pre trauma
personality show no predictive value with psychosocial outcome. The
individuals included in the study at 18 months post injury onwards (n=10) show
that ratings of higher pre injury optimism and greater levels of pre injury easy
going disposition predict 82% of psychosocial outcome. Individuals included at
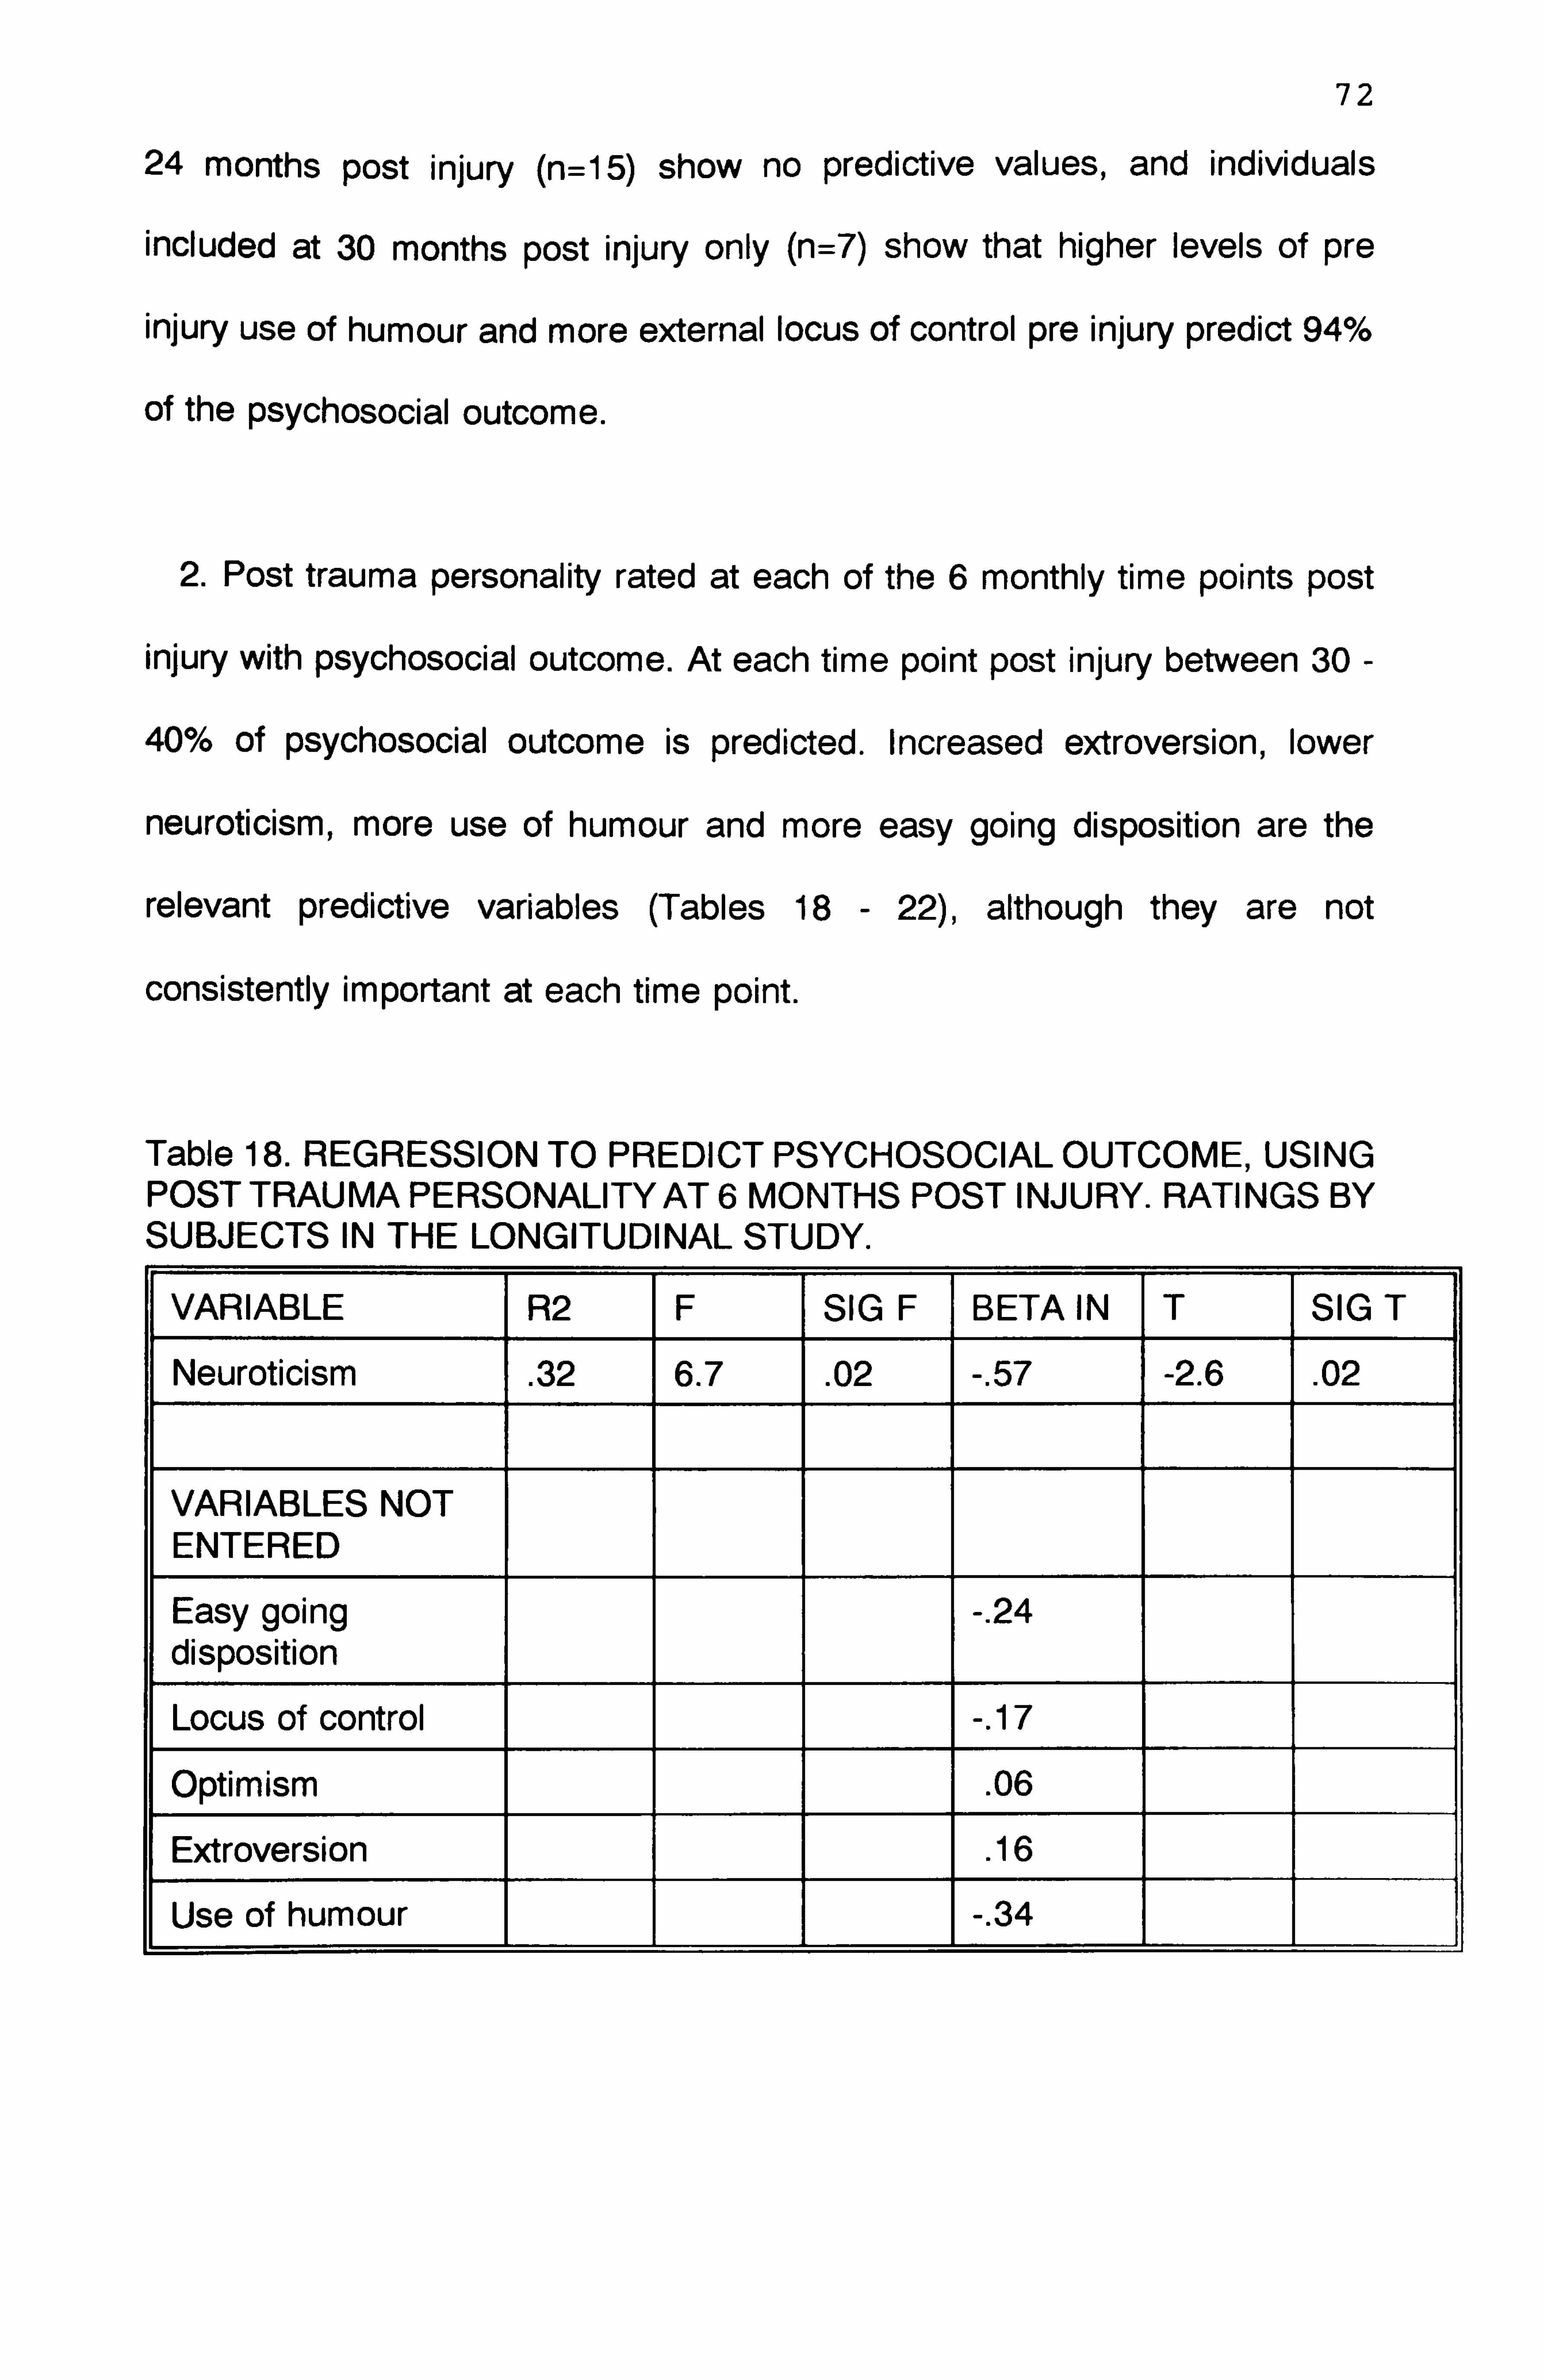
72
24 months post injury (n=15) show no predictive values, and individuals
included at 30 months post injury only (n=7) show that higher levels of pre
injury use of humour and more external locus of control pre injury predict 94%
of the psychosocial outcome.
2. Post trauma personality rated at each of the 6 monthly time points post
injury with psychosocial outcome. At each time point post injury between 30 -
40% of psychosocial outcome is predicted. Increased extroversion, lower
neuroticism, more use of humour and more easy going disposition are the
relevant predictive variables (Tables 18 - 22), although they are not
consistently important at each time point.
Table 18. REGRESSION TO PREDICT PSYCHOSOCIAL OUTCOME, USING POST TRAUMA PERSONALITY AT 6 MONTHS POST INJURY. RATINGS BY SUBJECTS IN THE LONGITUDINAL STUDY.
VARIABLE R2 F SIG F BETA IN T SIG T
Neuroticism . 32 6.7 . 02 -. 57 -2.6 . 02
VARIABLES NOT ENTERED
Easy going disposition
-. 24
Locus of control -. 17
Optimism . 06
Extroversion . 16
Use of humour -. 34

73
Table 19. REGRESSION TO PREDICT PSYCHOSOCIAL OUTCOME, USING POSTTRAUMA PERSONALITYAT 12 MONTHS POST INJURY. RATINGS BY SUBJECTS IN THE LONGITUDINAL STUDY.
VARIABLE R2 F SIG F BETA IN T SIG T
Easy going disposition . 43 19.35 . 00 -. 65 -4.4 . 0002
VARIABLES NOT ENTERED
Locus of control . 14
Optimism . 001
Neuroticism -. 10
Extroversion . 31
Use of humour . 18
Table 20. REGRESSION TO PREDICT PSYCHOSOCIAL OUTCOME, USING POSTTRAUMA PERSONALITYAT 18 MONTHS POST INJURY. RATINGS BY SUBJECTS IN THE LONGITUDINAL STUDY.
VARIABLE R2 F SIG F BETA IN T SIG T
Extroversion . 36 20.58 . 00 . 60 4.54 . 0001
VARIABLES NOT ENTERED
Easy going disposition
-. 16
Locus of control -. 07
Optimism . 05
Neuroticism -. 25
Use of humour . 30
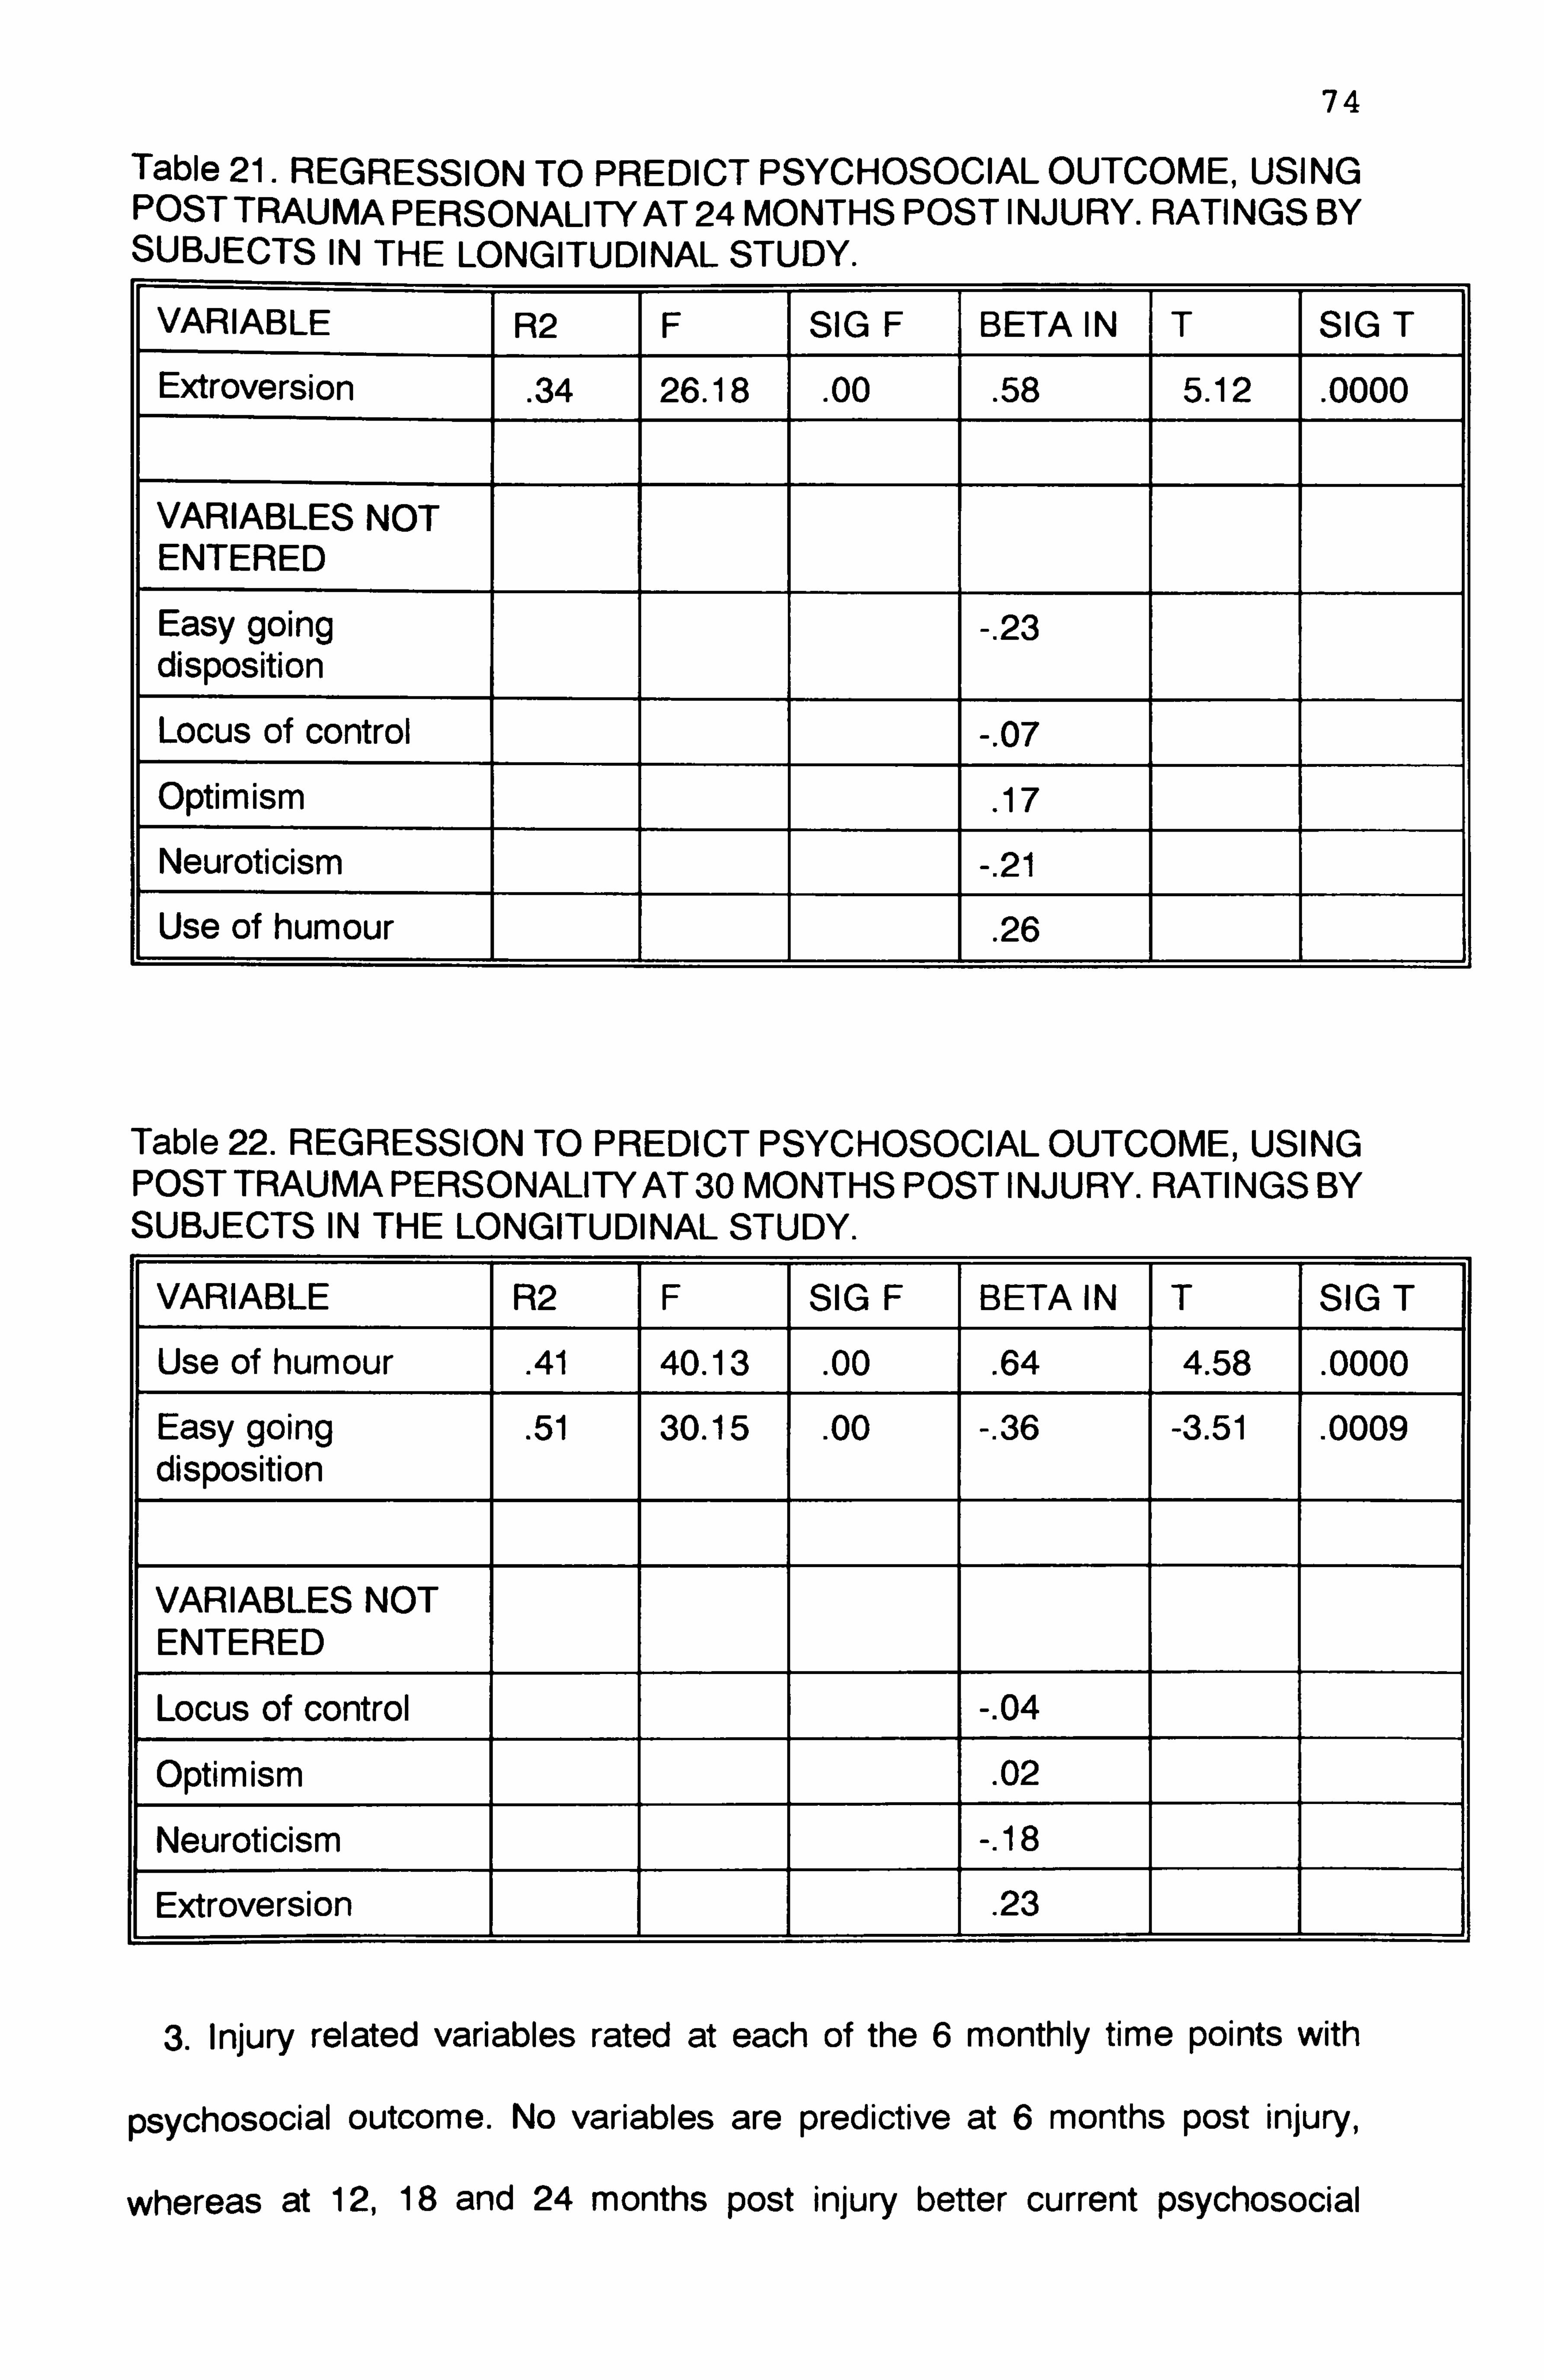
74
Table 21. REGRESSION TO PREDICT PSYCHOSOCIAL OUTCOME, USING POST TRAUMA PERSONALITY AT 24 MONTHS POST INJURY. RATINGS BY SUBJECTS IN THE LONGITUDINAL STUDY.
VARIABLE R2 F SIG F BETA IN T SIG T
Extroversion . 34 26.18 . 00 . 58 5.12 . 0000
VARIABLES NOT ENTERED
Easy going disposition -. 23
Locus of control -. 07
Optimism . 17
Neuroticism -. 21
Use of humour . 26
Table 22. REGRESSION TO PREDICT PSYCHOSOCIAL OUTCOME, USING POST TRAUMA PERSONALITY AT 30 MONTHS POST INJURY. RATINGS BY SUBJECTS IN THE LONGITUDINAL STUDY.
VARIABLE R2 F SIG F BETA IN T SIG T
Use of humour . 41 40.13 . 00 . 64 4.58 . 0000
Easy going disposition . 51 30.15 . 00 -. 36 -3.51 . 0009
VARIABLES NOT ENTERED
Locus of control -. 04
Optimism . 02
Neuroticism -. 18
Extroversion . 23
3. Injury related variables rated at each of the 6 monthly time points with
psychosocial outcome. No variables are predictive at 6 months post injury,
whereas at 12,18 and 24 months post injury better current psychosocial

75
function predicts between 44 and 67% of final psychosocial outcome. At 30
months post injury better executive and cognitive function predict 44% of the
psychosocial function - of course at this stage psychosocial function cannot be
used to predict itself. Tables 23-26)
Table 23. REGRESSION TO PREDICT PSYCHOSOCIAL OUTCOME, USING INJURY RELATED VARIABLES AT 12 MONTHS POST INJURY. RATINGS BY SUBJECTS FROM THE LONGITUDINAL STUDY.
VARIABLE R2 F SIG F BETA IN T SIG T
Psychosocial function . 44 16.54 . 001 . 66 4.07 . 0006
VARIABLES NOT ENTERED
Physical function -. 27
Cognitive function -. 03
Executive function -. 23
Coma -. 27
Post traumatic amnesia
-. 05
Table 24. REGRESSION TO PREDICT PSYCHOSOCIAL OUTCOME, USING INJURY RELATED VARIABLES AT 18 MONTHS POST INJURY. RATINGS BY SUBJECTS FROM THE LONGITUDINAL STUDY.
VARIABLE R2 F SIG F BETA IN T SIG T
Psychosocial function . 67 59.00 . 000 . 82 7.68 . 0000
VARIABLES NOT ENTERED
Physical function . 08
Cognitive function -. 02
Executive function . 04
Coma -. 05
Post traumaic . 01

76
Table 25. REGRESSION TO PREDICT PSYCHOSOCIAL OUTCOME, USING INJURY RELATED VARIABLES AT 24 MONTHS POST INJURY. RATINGS BY SUBJECTS FROM THE LONGITUDINAL STUDY.
VARIABLE R2 F SIG F BETA IN T SIG T
Psychosocial function . 56 52.70 . 000 . 75 7.84 . 0000
Physical function . 60 31.06 . 000 -. 23 -2.16 . 04
VARIABLES NOT ENTERED
Cognitive function . 13
Executive function -. 06
Coma . 01
Post traumatic amnesia
-. 04
Table 26. REGRESSION TO PREDICT PSYCHOSOCIAL OUTCOME, USING INJURY RELATED VARIABLES AT 30 MONTHS POST INJURY. RATINGS BY SUBJECTS FROM THE LONGITUDINAL STUDY.
VARIABLE R2 F SIG F BETA IN T SIG T
Executive function . 33 23.28 . 000 . 57 3.02 . 004
Cognitive function . 44 18.70 . 000 -. 26 2.54 . 015
VARIABLES NOT ENTERED
Physical function . 013
Coma . 16
Post traumatic amnesia
-. 14
4. Coping skills rated at each of the 6 monthly time points with psychosocial
outcome. Less use of avoidance coping predicted small amounts of
psychosocial outcome, but only at 24 and 30 months post injury: 24 months
(22%) and 30 months (13%).

77 5.3.5 Coping as a moderator variable on the relationships between
psychosocial outcome with personality.
Multiple regressions were computed to examine the additional amounts of
prediction made possible by the inclusion of coping skills to the personality
regressions. Two regressions were computed:
1. Pre trauma personality and coping skills with psychosocial outcome. No
additional variance was accounted for.
2. Post trauma personality and coping skills with psychosocial outcome. No
additional variance was accounted for.
So the prediction of psychosocial outcome is not improved by including
coping style in the regression.
Given the importance of appraisal in the transactional process model the
regressions were recomputed separately to include primary and secondary
appraisal. This resulted in 4 further regressions:
1. Pre trauma personality and primary appraisal with psychosocial outcome.
No additional variance was accounted for.
2. Pre trauma personality and secondary appraisal with psychosocial
outcome. No additional variance was accounted for.
3. Post trauma personality and primary appraisal with psychosocial outcome.
Only small amounts of extra variance were accounted for. (15% at 18
months, 8% at 24 months and 5% at 30 months post injury).
4. Post trauma personality and secondary appraisal with psychosocial
outcome. No additional variance was accounted for.

78
Again the prediction of psychosocial outcome is not significantly increased
by including appraisal in the regression.
It was felt that the nature of the relationships should be explored in more
detail so the regressions were performed again between personality and coping
style with psychosocial outcome redefined as the amount of rated improvement
as opposed to the absolute values previously used. This was computed by
subtracting the initial rating from the final rating. No increase in the amount of
explained variance was noted.
One possible explanation for the lack of increase in prediction is that the
effects are being averaged out. For instance an individual with high levels of
neuroticism and high levels of avoidance coping could be balanced by an
individual with low levels in both of these so that no effects are statistically
significant. This idea was explored by recalculating the regression for some of
the variables. The variables used were neuroticism and avoidance. High and
low levels were differentiated in these variables by calculating the median for
each variable and then creating a high level and low level variable depending
on which side of the median the rating fell. Thus it could be examined whether
a person with high neuroticism and high avoidance had a worse psychosocial
outcome than an individual with high neuroticism but low avoidance. In this way
it could be ascertained if effects were being averaged out. In fact no increase
in variance was explainable.
79
5.4 Discussion
In summary the results of this study can be split into 3 parts:
1. Relationships between psychosocial outcome and coping.
This is the first time that a study with longitudinal design has explored the
relationships between coping and psychosocial outcome after brain injury using
an established factor structure for the WCCL(R).
Only one of the established coping factors proved to be significant in this
study: less use of avoidance coping is related to better psychosocial outcome.
When taken in conjunction with Hinkeldey and Corrigan's (1990) report of
relatively greater use of avoidance coping after brain injury, this result lends
support to their view that brain injured people appear to employ coping
strategies that are ineffective. (The direction of valence of the other 3 coping
strategies indicates less use of emotion focused and wishful thinking coping
and more use of problem focused coping leads to better psychosocial outcome,
although these relationships were not significant). It is interesting to note that
this factor was only significant at 24 and 30 months post injury. No other
significant relationships were found at any other time post injury. This result
may be seen as supportive of the view expressed by Willer et al (1991) that
adjustment is best examined after 1 year post injury since progress will have
stabilised by this time, and support services will not be so prominent. It may be
that it is only then that the brain injured individual perceives the extent and
ramifications of their remaining problems, prompting an increase in denial or
avoidance coping strategies (Frank et al 1990).

80
2. Relationships between personality, injury related variables and appraisal
with coping.
This is the first time that a study with longitudinal design has explored the
relationships between several personality attributes and coping style after brain
injury. Results can be summarised as follows: The use of problem focused
coping is not significantly related to any variables. More use of emotion
focused coping is significantly related to greater perceived threat. More use of
wishful thinking as a coping strategy is related to lower extroversion, less
optimism, higher incidence of psychosocial problems, greater perceived threat
and lower perceived control over the threat. More use of avoidance as a coping
strategy is related to less easy going disposition, less optimism, more
neuroticism, lower extroversion, less use of humour, more cognitive, executive
and psychosocial problems and to greater perceived threat.
The four coping strategies can be characterised in the following way:
problem focused coping attempts to face up to the problem and overcome it,
it is therefore direct and positive; emotion focused coping attempts to deal with
the emotional difficulties resulting from the problem, as such it is partly positive,
but it also has a negative aspect in that it does not target the root cause of
these emotional difficulties; in contrast both avoidance and wishful thinking
coping strategies try to run away from or repress the problem, and are
therefore negative in their approach.
The results indicate very strongly that the negative coping strategies are
strongly related to less intact brain function, greater perception of threat, belief
that little can be done to overcome the problem and to less outgoing
personality types.
It is interesting that the same personality traits are linked with negative

81
coping strategies and worse psychosocial outcome. This would indicate that
negative coping strategies should be related to worse psychosocial outcome.
In fact results do not entirely support this since only avoidance coping is
significantly related and only then at later stages post injury. This would imply
that there are other modifying factors to take into account in this model, after
brain injury.
3. Prediction of psychosocial outcome at 30 months post injury.
The results indicate high levels of prediction of psychosocial outcome from
pre trauma personality variables - but this is not consistent and no relationships
were found when Pearson correlations were calculated. Due to the numbers
involved at the time points when these predictive relationships were so high it
is best to attribute this result to a statistical error and therefore to discount it.
So in conclusion, there is no consistent pattern of prediction of outcome from
pretrauma personality factors, whereas post trauma personality predicts
between 30-40% of outcome. The following personality variables are important:
more extroversion, less neuroticism, more use of humour and a more easy
going disposition. There is a lack of consistency in these results, with none of
the personality variables predicting significantly at all stages post injury. This
is most likely due to the relatively small numbers in the time groups post injury
and the fact that each group contains different numbers of participants.
Obviously further research is needed on larger group studies in order to
examine the present results in more detail.
Of all the injury related factors psychosocial function predicts a significant
amount of the final outcome, at each stage post injury. Coping skills do not
predict large amounts of psychosocial function at any stage post injury and do

82
not add significantly to the predictive value of personality. This indicates that
coping does not provide an appropriate framework to understand the
development of psychosocial problems after brain injury. However it is
important to be aware of other possible explanations for these results. The
particular sample of subjects included for this study is relatively small (although
large by most brain injury study standards). Given the complex subject matter
of this study a larger study group may yield more consistent and conclusive
results. Perhaps more important is the statistical consideration that multiple
regression can only reliably be used with 100 or more subjects and when the
number of variables is 1/3 of the number of subjects. Both of these rules were
broken in this study - lending support to the need for more research on a much
larger study group before firm conclusions can be drawn. Also the inclusion of
other variables in this kind of research may lend greater support to the use of
the transactional process model of coping. For instance the level of social
support, family situation, type of injury, future outlook, financial stability,
employability and the quality and quantity of rehabilitation are some of the
many other variables which may affect these relationships. Future research will
need to examine these variables in relation to the coping model. At this stage
it can be concluded that the variables as examined in this study are not
sufficient to explain the development of psychosocial problems after brain
injury, although they do go some way towards it. The concept of appraisal is
central to the transactional process model of coping. The results demonstrate
significant relationships between primary and secondary appraisal and the
more negative coping strategies, yet the inclusion of either coping or appraisal
in the regressions does not increase the predictive value of the personality
variables. The relationships between coping and appraisal after brain injury

83
may prove to be an important focus for further study.
There is a view that prediction of brain injury outcome may never be perfect
anyway due to the myriad of variables which are needed (Deaton 1993). In
addition Parkes (1984) comments that the excellence of the coping model is
offset by the limitations of current research methods to encompass its full
theoretical and empirical complexity. This is supported by Smith, Smoll and
Ptacek (1990), who comment on the need to know more about how
moderators might function in combination with each other. Conjunctive
relationships require the moderators to be in a specific ratio to each other, so
that each is necessary but not sufficient by itself to produce the maximum
moderator effect; disjunctive relationships require any one of the moderators
to operate at a specific magnitude and once this level is attained the effect is
not significantly enhanced by contributions from other moderators. The
implications of this concept for statistical analysis are important since Smith et
al indicate that moderator effects of practical importance are likely to be judged
non significant when using regression analyses. More powerful methods are
needed - and, according to Smith et al, these are yet to be developed!
Nevertheless a gradual increase in knowledge in this area is being gained.

84
6 CONCLUSIONS AND RECOMMENDATIONS
6.1 Summary of findings
1. A factor structure was established for brain injured people using the
WCCL(R). The 4 factors of problem focused coping, emotion focused coping,
avoidance coping and wishful thinking coping are similar to those reported in
a range of other health related problem groups.
2. The accuracy of self reports from brain injured people was found to be as
good as those from a matched control group. This lends support to the
continued use of this approach as an assessment tool. However further
research is needed to clarify this insight issue since the relative reports may
also be inaccurate.
3. Changes in locus of control, optimism, easy going disposition and use of
humour were noted after brain injury. However some changes were also noted
in the control goup. This result demonstrates the dangers with attributing such
personality alterations to the brain injury itself. It is likely that some change can
also be explained by reaction to the trauma.
4. It was shown that once these changes take place they remain relatively fixed
- neither improving nor deteriorating.
5. Pre injury variables of personality, coma, pta, location of injury, age and
years in education were not shown to be significantly related to either coping
skills or psychosocial outcome at any stage post injury.

85
6. Severity of injury as measured by level of cognitive, executive, physical and
psychosocial skills post trauma were significantly related to psychosocial
outcome and coping skills.
7. A more easy going disposition, greater use of humour, less neuroticism and
more extroversion are all significantly related to better psychosocial outcome
at all stages post injury. Greater optimism is not consistently linked, and locus
of control is never linked.
8. More use of avoidance coping and wishful thinking coping is significantly
related to lower extroversion, lower optimism, less easy going disposition, more
neuroticism, less use of humour and more cognitive, executive and
psychosocial skills problems, at most stages post injury.
9. Less use of avoidance coping is significantly related to better psychosocial
outcome.
10. Post trauma personality variables consistently predict between 30-40% of
psychosocial outcome.
11. Less problems with cognitive, physical, executive and psychosocial skills
predicts between 44-67% of psychosocial outcome.
12. The inclusion of coping skills or appraisal skills in the regression do not
significantly improve these predictions, indicating coping, as examined in the
present study, does not act as a moderator variable. However reasons for this

86
are discussed.
13. Results from the longitudinal study are shown to provide greater detail and
enable inferences to be made on the direction of causality between
relationships, when compared with the cross sectional study.
6.2 Recommendations
Obviously a great deal of further work is needed to examine the relationships
between coping, personality and psychosocial outcome. The present results
indicate that it is necessary to use studies with a longitudinal design, involving
large numbers of subjects. A matched control group should also be included
if possible.
Studies could focus on the following aspects:
1. The factor structure of the WCCL(R).
2. The relationships between cognitive appraisal and coping skills.
3. The role that other variables not included in the present study may play, for
instance social support, motivation and duration and type of rehabilitation.
4. The generalisability of the present results to females (the sample consisted
almost exclusively of males).
6.3 Conclusion
This study was exploratory in nature, constrained by time and numbers of
subjects. It has perhaps raised more questions than it answers, yet it has
demonstrated some interesting links between personality, coping skills and
psychosocial outcome.

87
REFERENCES
Alexander A, Colombo F and Nertempi P et al. (1983). Cognitive outcome and ear indices of severity of head injury. Journal of Neurosurgery, 59.751-761.
Anderson CR. (1977). Locus of control, coping behaviour and performance in a stress setting. A longitudinal study. Journal of Applied Psychology, 62.446- 451.
Basgall JA and Snyder CR. (1988). Excuses in waiting: Locus of control and reactions to success-failure feedback. Journal of Personality and Social Psychology, 54.4.656-662.
Ben-Yishay Y and Diller L. (1983). Cognitive remediation. In Rosenthal M, Griffiths ER, Bond MR, Miller JD (Eds), Rehabilitation of the head injured adult. FA Davis Co. Philadelphia. Ch. 26.
Beck AT and Beck RW. (1972). Screening depressed patients in family practice. Postgraduate medicine. December, 81-85.
Bergquist TF and Jacket MP. (1993). Awareness and goal setting with the traumatically brain injured. Brain Injury, 7.3.275-282.
Billings AG and Moos RH. (1981). The role of coping responses and social resources in attenuating the stress of life events. Journal of Behavioural Medicine, 4.2: 139-157.
Bond MR and Brooks DN. (1976). Understanding the process of recovery as a basis for the investigation of rehabilitation for the brain injured. Scandinavian Journal of Rehabilitation and Medicine, 8: 127-133.
Brooks DN. (1984). Cognitive deficits after head injury. In Brooks N (Ed). Psychological, Social and Family consequences of closed head injury. Oxford University Press. pp 4-73.
Brooks N. (1991). The effectiveness of post acute rehabilitation. Brain Injury 5.2.103-9.
Brooks N, Campsie L, Symington C et al. (1986). The five year outcome of severe blunt head injury: A relative's view. Journal of Neurology, Neurosurgery and Psychiatry. 49.764-770.
Brooks N, McKinlay W, Symington C et al. (1987). Return to work within the first 7 years of severe head injury. Brain Injury, 1.1.5-19.
Bulman RJ and Wortman CB. (1977). Attributions of blame and coping in the real world. Journal of Personality and Social Psychology, 35.5.351-63.
Burke JM, Smith SA and Imhoff CL. (1989). The response styles of post-acute traumatic brain-injured patients on the MMPI. Brain Injury, 3.1.35-40.

88
Carver CS, Scheier MF and Weintraub JK. (1989). Assessing coping strategies: a theoretically based approach. Journal of Personality and Social Psychology, 56.2: 267-283.
Cohadon F. (1981). The importance of rehabilitation programmes in the prevention and alleviation of head injury sequelae. Prog Neurol Surg 10.344- 384.
Cohen S. (1980). After effects of stress on human performance and social behaviour. Psychological Bulletin, 88.1.82-108.
Conder RL. (1989). Recommendations for clinical and research evaluation of vocational reentry programmes for survivors of traumatic brain injury. Brain Injury, 2.4.365-85.
Cope ON, Cole JR, Hall KM and Barkan H. (1991). Brain injury: analysis of outcome in a post acute rehabilitation system, parts 1 and 2. Brain Injury, 5.2.111-139.
Coxon APM. (1982). The users guide to Multidimensional Scaling. Heinemann Educational Books.
Deaton AV. (1993). Predicting outcomes: the slippery slope. Brain Injury, 7.2.99-100.
DeLongis A, Folkman S and Lazarus RS. (1988). The impact of daily stress on health and mood: psychological and social resources as mediators. Journal of Personality and Social Psychology, 54.3.484-495.
Dikmen S, Machamer J and Temkin N. (1993). Psychosocial outcome in patients with moderate to severe head injury: 2 year follow up. Brain Injury, 7.2.113-124.
Edwards JR and Cooper CL. (1988). Research in stress, coping and health: theoretical and methodological issues. Psychological Medicine, 18.15-20.
Eslinger PJ and Domasio AR. (1985). Severe disturbance of higher cognition following bilateral frontal lobe ablation. Neurology, 35.1731-41.
Eysenck HJ. (1970). The structure of human personality. Methuen.
Eysenck HJ and Eysenck SBG. (1975). Manual of the Eysenck Personality Questionnaire. Hodder and Stoughton.
Functional Assessment Measure (unpublished) - The State University of New York at Buffalo, USA. (1987).
Folkman S and Lazarus RS. (1980). An analysis of coping in a middle aged community sample. Journal of Health and Social Behaviour, 21: 219-239.

89
Folkman S, Lazarus AS, Gruen RJ and DeLongis A (1986). Appraisal, coping, health status and psychological symptoms. Journal of Personality and Social Psychology, 50.3: 571-579.
Fordyce DJ, Roueche JR and Prigatano GP. (1983). Enhanced emotional reactions in chronic head trauma patients. Journal of Neurology, Neurosurgery and Psychiatry, 46.620-624.
Frank RG, Haut AE, Smick M et al. (1990). Coping and family functions after closed head injury. Brain Injury, 4.3: 289-295.
Fugel-Meyer AR and Fugel-Meyer KS. (1988). The coping process after traumatic brain injury. Scandinavian Journal of Rehabilitation Medicine Supplement 17; 51-3.
Hagan C, Malkmus D and Durham P. (1979). Levels of cognitive functions. In Downey CA (Ed). Rehabilitation of the head injured adult; comprehensive physical management. Professional Staff Association of Rancho Los Amigos Hospital Inc.
Herbert CM and Powell GE. (1989). Insight and progress in rehabilitation. Clinical Rehabilitation, 3: 125-130.
Hinckle LE. (1974). The effect of exposure to culture change, social change and changes in interpersonal relations on health. In Dohrenwend BS and Dohrenwend BP (Eds). Stressful life events; their nature and effects. New York. Wiley. pp 9-44.
Hinkeldey NS and Corrigan JD. (1990). The structure of head injured patient's neurobehavioural complaints: a preliminary study. Brain Injury, 4.2.115-133.
Holahan CJ and Moos RH. (1985). Life stress and health. Personality coping and family support. Journal of Personality and Social Psychology, 49.3: 739- 747.
Holahan CJ and Moos RH. (1986). Personality, coping and family resources in stress resistance. Journal of Personality and Social Psychology, 51.2: 389-395.
Holahan CJ and Moos RH. (1987). Personal and contextual determinants of coping strategies. Journal of Personality and Social Psychology, 52.5: 946-955.
Jennet B and Bond M. (1975). Assessment of outcome after severe brain damage. Lancet i: 480-484.
Johnston MV. (1992). Outcomes of community re entry programmes for brain injury survivors, Parts 1 and 2. Brain Injury, 5.2.141-168.
Klonoff PS, Snow WG and Costa LD. (1986). Quality of life in patients 2 to 4 years after closed head injury. Neurosurgery, 19.5.735-743.
Kruskal JB and Wish M. (1978). Multidimensional scaling. Sage Publications Ltd.

90
Lazarus RS. (1978). A strategy for research on psychological and social factors in hypertension. Journal of Human Stress, 4.3.35-40.
Lazarus RS and Folkman S. (1984). Stress, appraisal and coping. New York, Springer. p. 141.
Lefcourt HM, Miller RS, Ware EE and Sherk D. (1981). Locus of control as a modifier of the relationship between stressors and moods. Journal of Personality and Social Psychology, 41.357-369.
Levin HS, Grossman RG, Rose JE and Teasdale G. (1979). Long term neuropsychological outcome of closed head injury. Journal of Neurosurgery, 50.412-22.
Lezak MD. (1978). Living with the characterologically altered brain injured patient. The Journal of Clinical Psychiatry, July pp592-598.
Lezak MD. (1989). Assessment of psychological dysfunctions resulting from head trauma. In Lezak MD (Ed). Assessment of the behavioural consequences of head trauma. Alan R Liss Inc. pp. 113-143.
Lishman WS. (1968). Brain damage in relation to psychiatric disability after head injury. British Journal of Psychiatry, 114.373-410.
Livingston MG and Livingston HM. (1985). The Glasgow Assessment Schedule. International Rehabilitation Medicine, 7: 145-149.
Livingston MG, Brooks DN and Bond MR. (1 985a). Three months after severe head injury: Psychiatric and social impact on relatives. Journal of Neurology, Neurosurgery and Psychiatry, 48.870-875.
Livingston MG, Brooks DN and Bond MR. (1 985b). Patient outcome in the year following severe head injury and relatives' psychiatric and social functioning, Journal of Neurology, Neurosurgery and Psychiatry, 48.876-881.
Lynn R. (Ed). (1981). Dimensions of personality. Pergamon Press.
McCrae RR and Costa PT. (1986). Personality, coping and coping effectiveness in an adult sample. Journal of Personality and Social Psychology, 46.919-928.
McKinlay WW and Brooks DN. (1984). Methodological problems in assessing psychosocial recovery following severe head injury. Journal of Clinical Neuropsychology, 6.1: 87-99.
MacNiven E and Finlayson MAJ. (1993). The interplay between emotional and cognitive recovery after closed head injury. Brain Injury, 7.3.241-6.
Malia KB and Powell GE. (1993). Insight and progress in rehabilitation after brain injury. Clinical Rehabilitation, 7; 35-41.

91
Martin RA and Lefcourt HM. (1983). The sense of humour as a moderator of the relationship between stressors and moods. Journal of Personality and Social Psychology, 47.145-155.
Matthews KA. (1982). Psychological perspectives on the type A behaviour pattern. Psychological Bulletin, 91.2.293-323.
Mauss-Clum N and Ryan M. (1981). Brain injury and the family. Journal of Neurosurgical Nursing, 13.4.165-9.
Miller L. (1991). Psychotherapy of the brain injured patient: principles and practices. Cognitive Rehabilitation. March-April p24-30.
Miller SM, Brody DS and Summerton J. (1988). Styles of coping with threat: implications for health. Journal of Personality and Social Psychology, 54.1: 142- 148.
Moore AD, Stambrook M and Peters LC. (1989). Coping strategies and adjustment after closed head injury: a cluster analytical approach. Brain Injury, 3.2: 171-175.
Moore AD and Stambrook M. (1992). Coping strategies and locus of control following traumatic brain injury: relationship to long term outcome. Brain Injury, 6.1: 89-94.
Moos RH and Billings AG. (1982). Conceptualising and measuring coping resources and processes. In Goldberger L and Breznitz S (Eds). Handbook of stress: theoretical and clinical aspects. Free Press, New York. pp 212-230.
Moos RH and Schaefer A. (1984). The crisis of physical illness. In Moos RH (Ed), Coping with physical illness. Plenum Medical Book Co. Ch. 1.
Nezu AM, Nezu CM and Blissett SE. (1988). Sense of humour as a moderator of the relation between stressful events and psychological distress: a prospective analysis. Journal of Personality and Social Psychology, 54.3.520- 525.
O'Carroll RE, Woodrow J and Maroun F. (1991). Psychosexual and psychosocial sequelae of closed head injury. Brain Injury, 5.3.303-313.
O'Shanick GJ. (1989). Behaviour change following head injury: clinical assessment and intervention. Psychiatric Medicine, 7.1.1-9.
Oddy M, Humphrey ME and Utley D. (1978). Subjective impairment and social recovery after closed head injury. Journal of Neurology, Neurosurgery and Psychiatry, 41.611-6.
Oddy M, Coughlan T, Tyerman A and Jenkins D. (1985). Social adjustment after closed head injury: A further follow up 7 years after injury. Journal of Neurology, Neurosurgery and Psychiatry, 48.564-568.
92
Parkes KR. (1984). Locus of control, cognitive appraisal and coping in stressful episodes. Journal of Personality and Social Psychology, 46.3: 655-668.
Parkes KR. (1986). Coping in stressful episodes: the role of individual differences, environmental factors and situational characteristics. Journal of Personality and Social Psychology, 51.6.1277-1292.
Peters LC, Stambrook M, Moore AD, Esses L. (1990). Psychosocial sequelae of closed head injury: effects on the marital relationship. Brain Injury, 4.1.39-47.
Prigatano GP. (1986). Neuropsychological rehabilitation after brain injury. John Hopkins University Press.
Prigatano GP. (1992). Personality disturbances associated with traumatic brain injury. Journal of Consulting and Clinical Psychology, 60.3.360-368.
Prigatano GP, Fordyce DJ, Zeiner HK et al. (1984). Neuropsychological rehabilitation after closed head injury in young adults. Journal of Neurology, Neurosurgery and Psychiatry, 47: 505-513.
Prigatano GP, Pepping M and Kionoff P. (1986). Cognitive, personality and psychosocial factors in the neuropsychological assessment of brain injured patients. In Uzzell BP and Gross Y (eds). Clinical neuropsychology of intervention. Boston: Martinus Nijhoff Publishing. pp 136-166.
Rappaport M, Hall KM, Hopkins K et al. (1982). Disability Rating Scale for severe head trauma; coma to community. Archives of Physical Medicine Rehabilitation, Vol 63, March.
Ranseen J. (1990). Positive personality change following traumatic head injury; four case studies. Cognitive Rehabilitation, March-April pp 8-12.
Revenson TA and Felton BJ. (1989). Disability and coping as predictors of psychological adjustment to rheumatoid arthritis. Journal of Consulting and Clinical Psychology, 57.3.344-348.
Rimel RW, Giordani B, Barth JT et al. (1981). Disability caused by mild head injury. Neurosurgery, 9.3.221-8.
Rimel RW, Giordani B, Barth JT and Jane JA. (1982). Moderate head injury: completing the clinical spectrum of brain trauma. Neurosurgery, 11.3.344-51.
Rosenbaum M and Najenson T. (1976). Changes in life patterns and symptoms of low mood as reported by wives of severely brain injured soldiers. Journal of Consulting and Clinical Psychology, 44.6.881-6.
Rosenthal M. (1983). Behavioural sequelae. In Rosenthal M, Griffiths ER, Bond MR and Miller JD (Eds). Rehabilitation of the head injured adult. FA Davis Co, Philadelphia. pp 197-209.
Rotter JB. (1966). Generalised expectancies for internal vs external control of reinforcment. Psychol Monographs: Gen Applied, 80.1.609.

93
Roueche JR and Fordyce DJ. (1983). Perception of deficits following brain injury and their impact on psychosocial adjustment. Cognitive Rehabilitation, 1.4-7.
Ruff RM, Marshall LF, Crouch J et al. (1993). Predictors of outcome following severe head trauma: follow up data from the Traumatic Coma Data Bank. Brain Injury, 7.2.101-11
Scheier MF and Carver CS. (1983). Cognition, affect and self regulation. In, Clarke MS and Fiske ST (Eds), Affect and cognition, p157-183. Lawrence Erlbaum Associates Inc.
Scheier MF and Carver CS. (1985). Optimism, coping and health: assessment and implications of generalised outcome expectancies. Health Psychology, 4.3.219-247.
Scheier MF, Weintraub JK and Carver CS. (1986). Coping with stress: divergent strategies of optimists and pessimists. Journal of Personality and Social Psychology, 51.6: 1257-1264.
Schiffman SS, Reynolds ML and Young FW. (1981). Introduction to multimensional scaling. Academic Press.
Sensky T. (1990). Patient's reactions to illness. British Medical Journal, 300.622-623.
Shadish WR, Hickman D and Arrick MC. (1981). Psychological problems of spinal cord injury patients: emotional distress as a function of time and locus of control. Journal of Consulting and Clinical Psychology, 49.2.297.
Slaby AE and Glickman AS. (1985). Adapting to life threatening illness. Praeger, New York. pp22-112.
Slagle DA. (1990). Psychiatric disorders following closed head injury: An overview of biopsychosocial factors in their etiology and management. International Psychiatry in Medicine, 20.1.1-35.
Smith RE, Smoll FL and Ptacek JT. (1990). Conjunctive moderator variables in vulnerability and resiliency research. Journal of Personality and Social Psychology, 58.2.360-370.
Spielberger CD, Goursch RL and Lushene R. (1968). State Trait Anxiety Inventory. Consulting Psychol Press.
Stephens CK. (1991). Personality and emotional coping in traumatic brain injured adults undergoing rehabilitation. Dissertation Abstracts Int, 51,10.50446.
Stern JM. (1985). The psychotherapeutic process with brain injured patients. Journal of Psychiatry Related Science, 22.1-2.83-7.

94
Tanck RH and Robbins PR. (1979). Assertiveness, locus of control and coping behaviour used to diminsh tension. Journal of Personality Assessment, 43.4.396-400.
Tate RL, Lulham JM, Broe GA et at. (1989). Psychosocial outcome for the survivors of severe blunt head injury: The results from a consecutive series of 100 patients. Journal of Neurology, Neurosurgery and Psychiatry, 52.1128- 1134.
Teasdale G and Jennet B. (1976). Assessment and prognosis of coma after head injury. Acta Neurochir, 34.45.
Tennen H and Herzberger S. (1985). The Ways of Coping Scale. In Keyser DJ and Sweetland RC (Eds). Test Critiques Vol 3. Test Corporation of America. pp 686-697.
Thomsen IV. (1974). The patient with severe head injury and his family. Scandinavian Journal of Rehabilitation Medicine, 6.180-183.
Thomsen IV. (1984). Late outcome of very severe blunt head trauma: A 10-15 year second follow up. Journal of Neurology, Neurosurgery and Psychiatry, 47.260-268.
Turk DC, Sobel HJ, Follick MJ and Youkilis HD. (1980). A sequential criterion analysis for assessing coping with chronic illness. Journal of Human Stress, June pp35-40.
Tyerman A and Humphrey M. (1984). Changes in self concept following severe head injury. International Journal of Rehabilitation Research, 7.1.11-23.
Van Zomeren AH, Brouwer WH and Deelman BG. (1984). Attentional deficits: the riddles of selectivity, speed and alertness. In Brooks DN (Ed). Closed Head Injury. Oxford University Press.
Vitaliano PP, Maiuro RD, Russo J and Becker J. (1987). Raw versus relative scores in the assessment of coping strategies. Journal of Behaioural Medicine, 10.1: 1-18.
Vitaliano PP, Russo J, Carr JE et al. (1985). The Ways of Coping Checklist. Revision and psychometric properties. Multivariate behavioural research, 20: 3-26.
Vogenthaler DR. (1988). An overview of head injury: its consequences and rehabilitation. Brain Injury, 1.1.113-127.
Weddell R, Oddy M and Jenkins D. (1980). Social adjustment after rehabilitation: a two year follow up of patients with severe head injury. Psychol Med, 10.257-63.
Willer BS, Allen KM, Liss M and Zicht MS. (1991). Problems and coping strategies of individuals with traumatic brain injury and their spouses. Archives of Physical Medical Rehabilitation, Vol 72, June: 460-465.

95
Zigmond AT and Snaith RP. (1983). HAD Scale. Acta Psychiatr. 86.1-10.

APPENDIX A:
PSYCHOSOCIAL RATING SCALE.
96
Rate your level of functioning as you believe it is now in the following areas:
1. Motivation
2. Confidence
3. Independence
4. Emotional lability (cries or laughs very easily) 5. Impulsive
6. Disinhibited (ie inappropriate in social situations)
7. Self esteem
S. Self evaluation/appraisal
9. Anxiety/tension
10. Irritability
11. Aggressiveness
12. Childishness/silliness
13. Indifference
14. Apathy/passivity
15. Empathy/consideration for others 16. Depression
17. Initiative
18. Have aims and goals which are worked towards
19. Decision making abilities
20. Care for own appearance
21. Sexual behaviour
22. Alcohol or medication use
23. Flexibility of thoughts
24. Reliability
25. Ability to relax
26. Level of energy/fatigueability
27. Awareness of own problems
28. Getting on with people
Very severe problem
Severe problem
Moderate problem
Mild problem
No problem

APPENDIX B:
WAYS OF COPING CHECKLIST
Tick those items from the following list which apply to you.
1. Wishing I could change what has happened
2. Wishing I could change the way I feel
3.1 have fantasies or wishes about how things might turn out
4. Wishing the situation would go away or somehow be finished
5. Deliberately changed or grown as a person in a good way
6. Accepting the next best thing to what I wanted
7. Trying to come out of the experience better than when I went in
8. Trying not to act too hastily or follow my own hunch
9. Changed something so things will turn out all right
10. Accepting my strong feelings, and not letting them interfere too much
11. Changed something about myself so I can deal with the situation better
12. Blaming myself
13. Criticising or lecturing myself
14. Realised that I brought the problem on myself
15. Hoping a miracle will happen
16. Wishing I was a stronger person, more optimistic and forceful
17.. Carrying on as if nothing has happened
18. Feeling bad that I cannot avoid the problem
19. Getting mad at the people or things that caused the problem
20. Trying to forget the whole thing
21. Trying to make myself feel better by eating, drinking or smoking
22. Refusing to believe it has happened
97
F-I Q F-I 1-1
Q Q
F-I
F-I 1-1
F-I F-I
F-I
Q

98
23. Bargaining to get something positive from the situation 171
24. Daydreaming or imagining a better time or place than the one I am in
25. Thinking about fantastic things that make me feel better
26. Keeping my feelings to myself F-I 27. Sleeping more than usual
28. Avoiding being with people in general
29. Kept others from knowing how bad things are
30. Concentrating on something good that can come out of the whole thing
31. Trying not to burn my bridges behind me but leaving things open somewhat
32. Making a plan of action and following it
33. Just taking things one step at a time F-I 34. Doubling my efforts to try to make things work
35. Coming up with a couple of different solutions to the problem F-I 36. Standing my ground and fighting for what I want F1
37. Talking to someone to find out about the situation F-I 38. Accepting sympathy and understanding from someone F]
39. Getting professional help and doing what they recommend
40. Talking to someone who can do something about the problem F]
41. Asking someone I respect for advice and following it
42. Talking to someone about how I am feeling 1-1
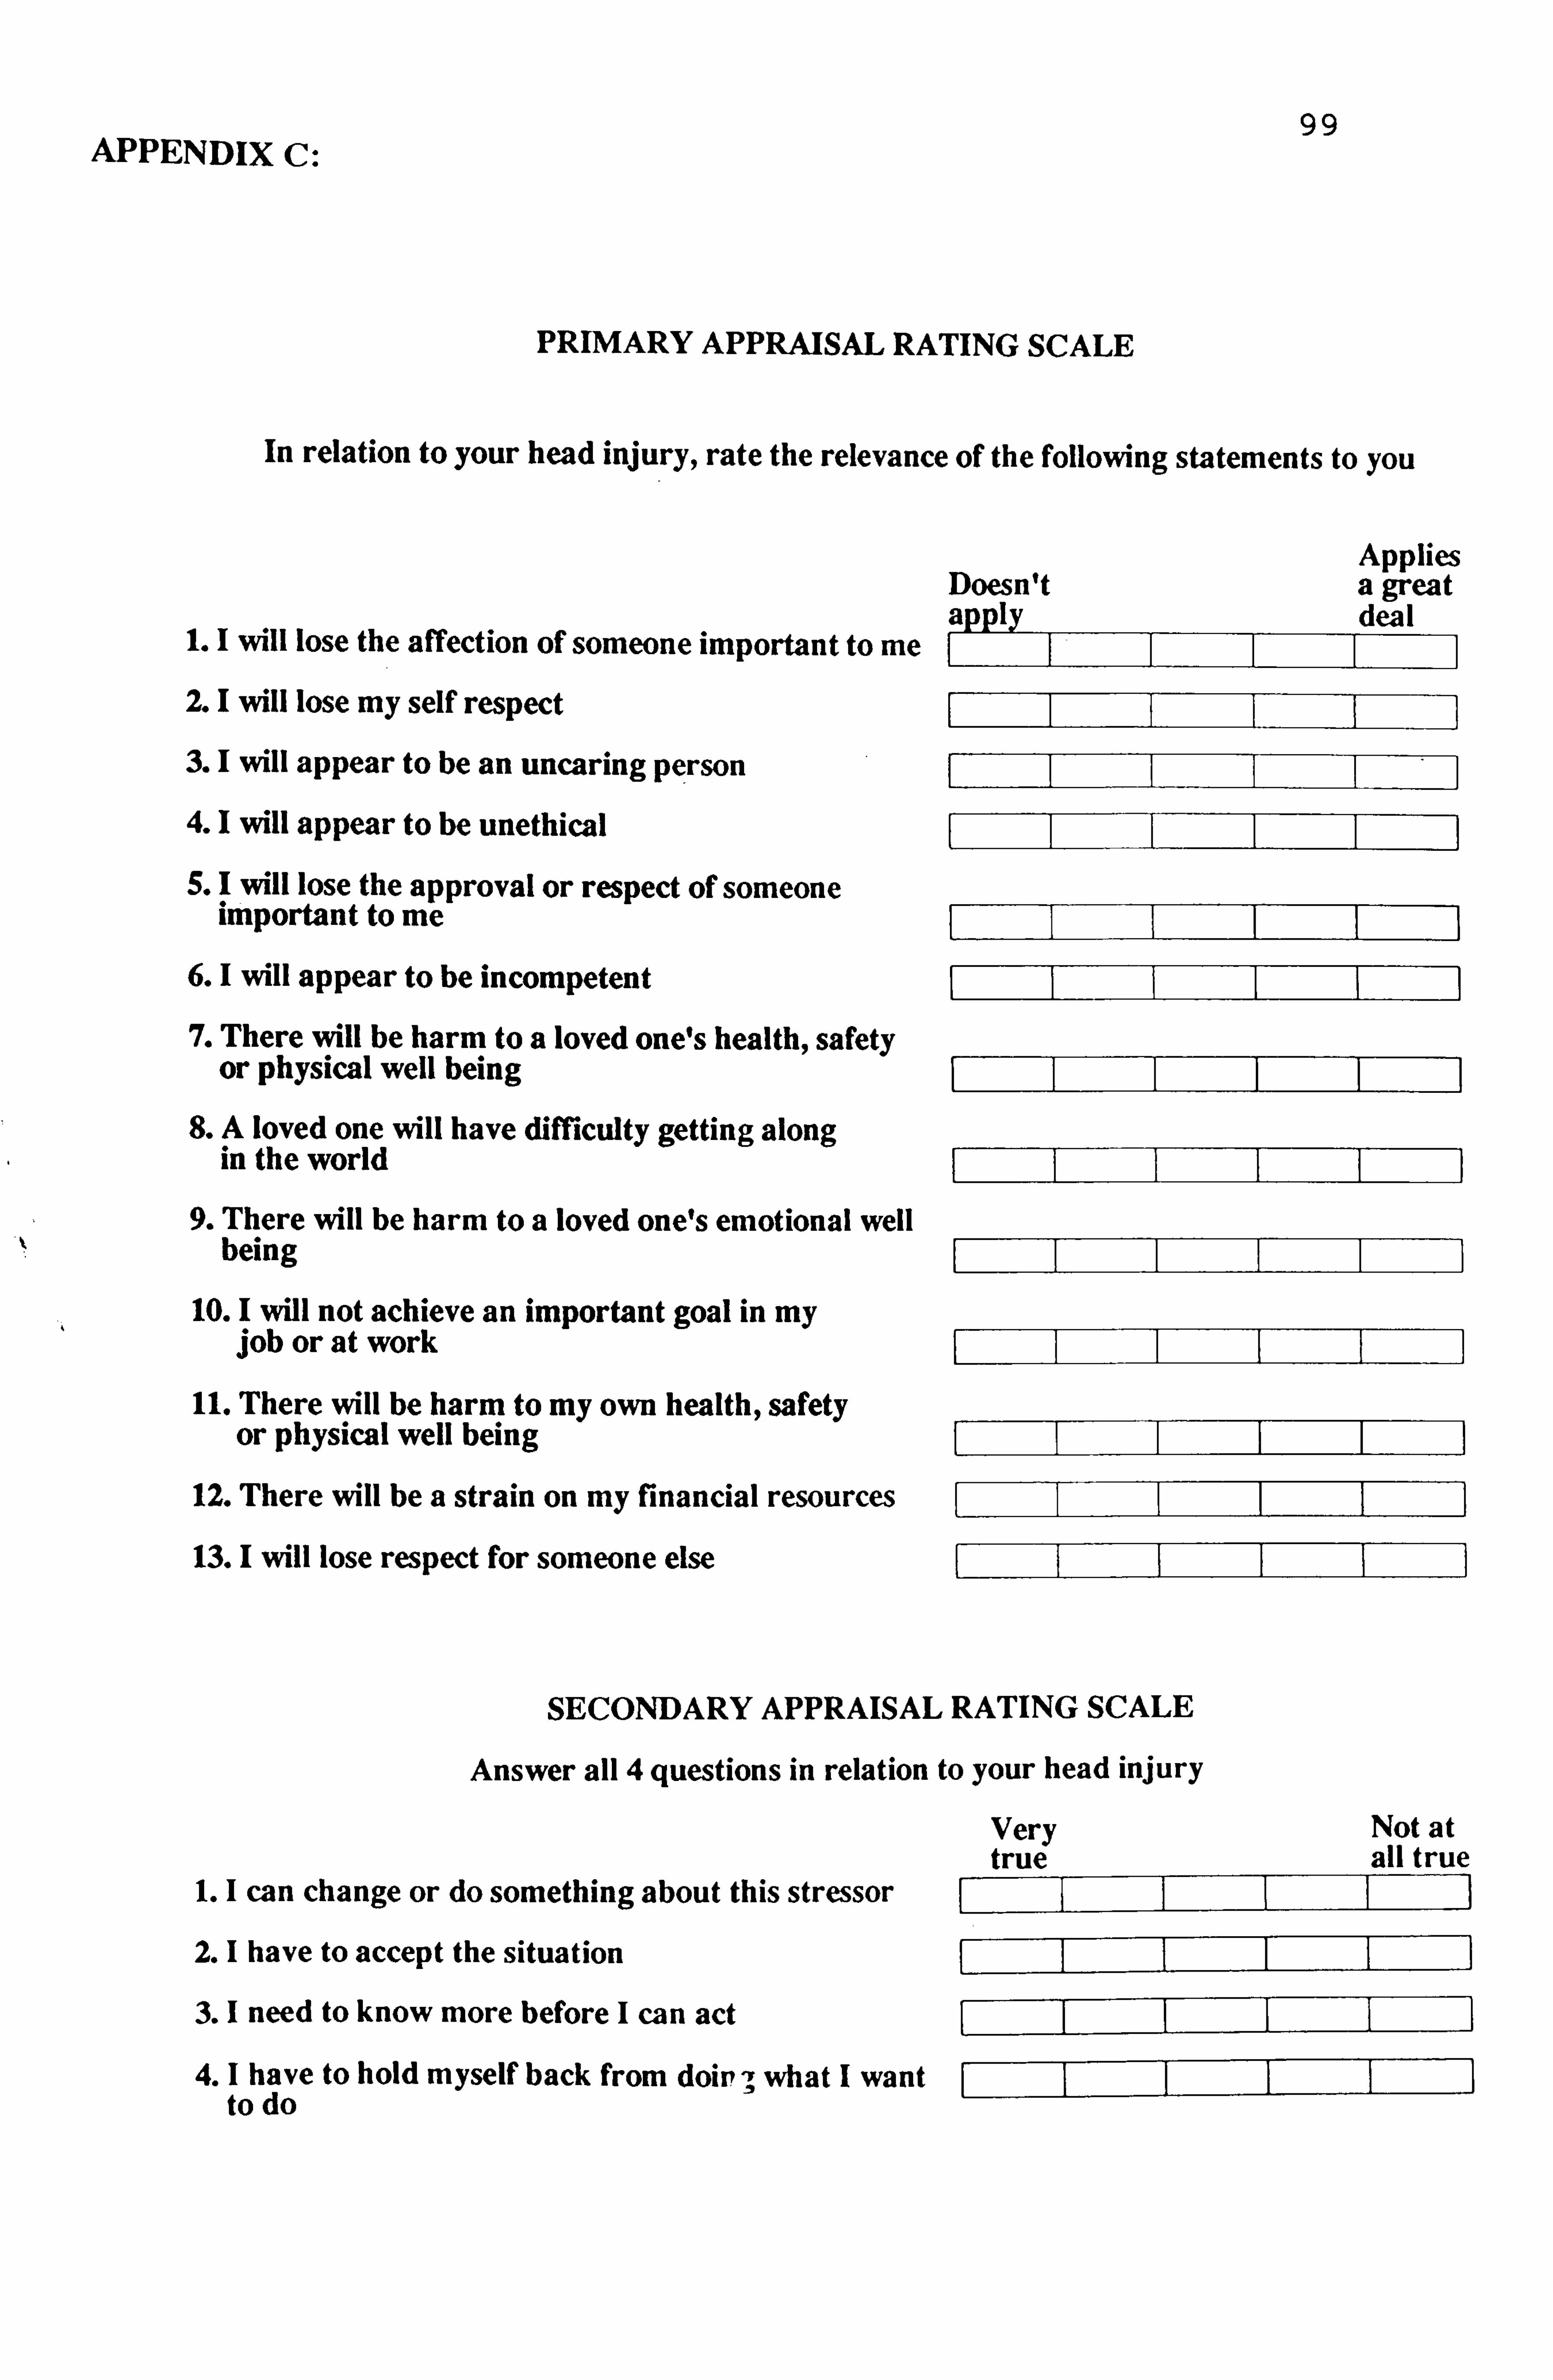
APPENDIX C: 99
PRIMARY APPRAISAL RATING SCALE
In relation to your head injury, rate the relevance of the following statements to you
Applies Doesn't a great apply deal
1.1 will lose the affection of someone important to me 2. I will lose my self respect
3. I will appear to be an uncaring person
4. I will appear to be unethical
5. I will lose the approval or respect of someone important to me
6. I will appear to be incompetent
7. There will be harm to a loved one's health, safety or physical well being
8. A loved one will have difficulty getting along in the world
9. There will be harm to a loved one's emotional well being
10. I will not achieve an important goal in my job or at work
11. There will be harm to my own health, safety or physical well being
12. There will be a strain on my financial resources
13. I will lose respect for someone else
SECONDARY APPRAISAL RATING SCALE
Answer all 4 questions in relation to your head injury
1. I can change or do something about this stressor
2.1 have to accept the situation
3. I need to know more before I can act
4. I have to hold myself back from doin ; what I want to do
Very Not at true all true

100
APPENDIX D: LOCUS OF CONTROL RATING SCALE
SELECT THE ONE STATEMENT OF EACH PAIR (AND ONLY ONE) WHICH YOU MORE STRONGLY BELIEVE TO BE THE CASE NOW AS FAR AS YOU ARE CONCERNED.
IF YOU FIND IT DIFFICULT TO DECIDE, CHOOSE THE ANSWER WHICH IS CLOSEST TO YOUR BELIEFS.
1. a. Children get into trouble because their parents punish them Q
too much.
b. The trouble with most children nowadays is parents are too Q
easy with them.
2. a. Many of the unhappy things. in people's lives are partly due Q
to bad luck.
b. People's misfortunes result from the mistakes they make. Q
3. a. One of the major reasons why we have wars is because Q
people don't take enough interest in politics.
b. There will always be wars no matter how hard people try to Q
prevent them.
4. a. In the long run people get the respect they deserve in this Q
world. b. Unfortunately an individuals worth often passes unrecognised
Q
no mauer how hard he tries.
5. a. The idea that teachers are unfair to students is nonsense. Q
b. Most students don't realise the extent to which their grades Q
are influenced by accidental happenings.
6. a. Without the right breaks one cannot be an effective leader, Q
b. Capable people who fail to become leaders have not taken Q
advantage of their opportunities.
7. a. No mauer how hard you try some people just don't like you. Q
b. People who cant getothers to like them don't understand how Q
to get along with others.
8. a. Heredity plays the major role in determining ones personality. Q
b. It is ones experiences in life which determine what they're Q
like.
9. a. I have often found that what is going to happen will happen. Q
b. Trusting to fate has never turned out as well for me as making Q
a decision to take a definite course of action.
10. a. In the case of a well prepared student there is rarely if ever Q
such a thing as an unfair test.
b. Many times exam questions tend to be so unrelated to course Q
work that studying is really useless.
.ý

101
11. a. Becoming a success is a matter of hard work, luck has little L]
or nothing to do with it.
b. Getting a job depends mainly on being in the right place at the right time.
12. a. The average citizen can have an influence in government F-I decisions.
b. This world is run by the few people in power and there is not much the little guy can do about it.
13. a. When I make plans I am almost certain that I can make them Q
work. b. It is not always wise to plan too far ahead because many
Q
things turn out to be a matter of good or bad fortune anyhow.
14. a. There are certain people who are just no good. Q
b. There is some good in everybody. Q
15. a. In my case getting what I want has little or nothing to do with Q
luck.
b. Many times we. might just as well decide what to do by Q
flipping a coin.
16. a. Who gets to be the boss often depends on who was lucky Q
enough to be in the right place fist.
b. Getting people to do the right thing depends upon ability, Q
luck has We or nothing to do with it.
17. a. As far as world affairs are concerned, most of us are the Q
victims of forces we can neither understand nor control.
b. By taking an active part in political and social affairs the Q
people can control world events.
18. a Most people don't realise the extent to which their lives are Q
controlled by accidental happenings.
b. There really is no such thing as "luck" Q
19. a. One should always be willing to admit mistakes. Q
b. It is usually best to cover up ones mistakes. Q
20. a. It is hard to know whether or not a person really likes you. Q
b. How many friends you have depends upon how nice a person Q
you are.
21. a. In the long run the bad things that happen to us are balanced Q
b, the good ones.
b. Most misfortunes are the result of lack of ability, ignorance, Q
laziness or all three.
.^

102
22. a. With enough effort we can wipe out political corruption. b. It is difficult for people to have much control over the things 0
politicians do in office.
23. a. Sometimes I cant understand how teachers arrive at the Q
grades they give.
b. There is a direct connection between how hard I study and Q
the grades I get.
24. a. A good leader expects people to decide for themselves what Q
they should do.
b. -A good leader makes it clear to everybody what their jobs Q
are.
25. a. Many times I feel that I have little influence over the things Q
that happen to me. b. It is impossible for me to believe that chance or luck plays an
Q
important role in my life.
26. a. People are lonely because they don't try to be friendly. Q
b. There's not much use in trying too hard to please people, if Q
they like you they like you.
27. a. There is too much emphasis on athletics in school. Q
b. Team sports are an excellent way to build character. Q
28. a. What happens to me is my own doing. Q
b. Sometimes I feel that I don't have enough control over the Q
direction my life is taking.
29. a. Most of the time I can't understand why politicians behave Q
the way they do.
b. In the long run the people are responsible forbad government on a national as well as on a local level.
.ý

103 APPENDIX E:
USE OF HUMOUR RATING SCALE
Rate the following items in relation to how you feel
1.1 often lose my sense of humour when I am having problems
2. I often find that my problems are greatly reduced when I try to find something funny in them
II usually look for something comical to say when I am in tense situations
4. I must admit my life would probably be easier if I had more of a sense of humour
S. I have often felt that if I am in a situation where I have to either cry or laugh it"s better for me to laugh
6.1 usually find something to laugh or joke about even in trying situations
Strongly disagree
Mildly disagree
Mildly agree
Strongly agree
7. It is my experience that humour is often a very effective way of coping with

104 APPENDIX F:
OPTIMISM RATING SCALE
Tick only those answers which apply to you from the following list
1. In uncertain times I usually expect the best
2. It's easy for me to relax
3. If something can go wrong for me it will
4.1 always look on the bright side of things
S. I'm always optimistic about my future
6.1 enjoy my friends a lot
7. It's important for me to keep busy
8.1 hardly ever expect things to go my way
9. Things never work out the way I want them to
10.1 don't get upset too easily
11. I'm a believer in the idea that "every cloud has a silver lining"
12.1 rarely count on good things happening to me
APPENDIX G
EASY GOING DISPOSITION SCALE
Rate how you generally view yourself, using the following adjectives
Quite Not at all accurate accurate
1. Easy going
2. Calm
3. Happy
F-I F-I 1-1 F-I F-I F-I F-I F-I 1: 1 F-I El F-I

105
APPENDIX H: EYSENCK PERSONALITY INVENTORY
ANSWER THESE QUESTIONS IN RELATION TO HOW YOU FEEL NOW
HERE ARE SOME QUESTIONS REGARDING THE WAY YOU BEHAVE, FEEL AND ACT. AFTER EACH QUESTION IS A SPACE FOR ANSWERING "YES" OR "NO".
TRY TO DECIDE WHETHER "YES"OR"NO" REPRESENTS YOUR USUAL WAY OF ACTING OR FEELING. THEN PUT A CROSS IN THE BOX UNDER THE COLUMN HEADED "YES" OR "NO". WORK QUICKLY, AND DON'T SPEND TOO MUCH TIME OVER ANY QUESTION; WE WANT YOUR FIRST REACTION, NOT A LONG-DRAWN OUT THOUGHT PROCESS. THE WHOLE QUESTIONNAIRE SHOULDN'T TAKE MORE THAN A FEW MUNUTES. BE SURE NOT TO OMIT ANY QUESTIONS.
WORK QUICKLY, AND REMEMBER TO ANSWER EVERY QUESTION. THERE ARE NO RIGHT OR WRONG ANSWERS, AND THIS ISN'T A TEST OF INTELLIGENCE OR ABILITY, BUT SIMPLY A MEASURE OF THE WAY YOU BEHAVE.
Yes No
1. Do you like plenty of excitement and bustle around you? o0 2. Have you oftengotarestlessfeelingthatyouwantsomethingbut
do not know what?
3. Do you nearly always have a "ready answer" when people talk F-I to you?
4. Do you sometimes feel happy, sometimes sad, without any real reason?
5. Do you usually stay in the background at parties and "get-togethers"?
6. As a child, did you always do as you were told immediately and without grumbling?
7. Do you sometimes sulk? C
8. When you are drawn into a quarrel, do you prefer to "have it out" to being silent, hoping things will blow over?
9. Are you moody? QQ
10. Do you like mixing with people? QQ
11. Have you often lost sleep over your worries? QQ
12. Do you sometimes get cross? QQ
13. Would you call yourself happy-go-lucky? El
14. Do you often make up your mind too late? El
15. Do you like working alone?
16. Have you often felt listless and tired for no good reason" 77
17. Are you rather lively?

106
Yes No
18. Do you sometimes laugh at a dirty joke? F-I 1-1 19. Do you often feel "fed-up"? F-I 20. Do you feel uncomfortable in anything but everyday clothes?
21. Does your mind often wander when you are trying to attend closely to something?
22. Can you put your thoughts into words quickly? L]
23. Are you often "lost in thought"? M
24. Are you completely free from prejudices of any kind? F-I 25. Do you like practical jokes? F-I M
26. Do you often think of your past?
27. Do you very much like good food?
28. When you get annoyed, do you need someone friendly to talk to F F-I about it?
29. Do you mind selling things or asking people for money for some C F-I
good cause?
30. Do you sometimes boast a little? QQ
31. Are you touchy about some things? QQ
32. Would you rather be at home on your own than go to a boring ü 1-1
Pty?
33. Do you sometimes get so restless that you cannot sit long in aC chair?
34. Do you like planning things carefully, well ahead of time? 1: 1 1: 1
35. Do you have dizzy turns? QQ
36. Do you always answer a personal letter as soon as you can after T El
you have read it?
37. Can you usually do things better by figuring them out alone than by talking to others about it?
38. Do you ever get short of breath without having done heavy
work?

107
Yes No
39. Are you an easy-going person, not generally bothered about F-I LI having everything "just-so"?
40. Do you suffer form "nerves"? F]
41. Would you rather plan things than do things? F-I 42. Do you sometimes put off until tomorrow what you ought to do F-I
today? 43. Do you get nervous in places like lifts, trains or tunnels? F-I 1-1 44. When you make new friends, is it usually you who makes the
first move, or does the inviting?
45. Do you get very bad headaches?
46. Do you generally feel that things will sort themselves out and come right in the end somehow?
47. Do you find it hard to fall asleep at bedtime? C
48. Have you sometimes told lies in your life? F
49. Do you sometimes say the first thing that comes into your head?
77 50. Do you worry too long after an embarrassing experience? rj
51. Do you usually keep "yourself to yourself' except with very close friends? F-I
52. Do you often get into a jam because you do things without F-I thinking?
53. Do you like cracking jokes and telling funny stories to your El El
friends?
54. Would you rather win than lose a game? QQ
55. Do you often feel self-conscious when you are with superiors? QQ
56. When the odds are against you, do you still usually think it QQ
worth taking a chance?
F-I Q 57. Do you often get "butterflies in your tummy" before an important occasion?
PLEASE CHECK TO SEE THAT YOU HAVE ANSWERED ALL THE QUESTIONS

108
APPENDIX I:
Rate your level of ability in each of the following areas
PHYSICAL FUNCTION RATING SCALE
Very oeverc Severe Moderate Mild No probkm probkm problem probkm problem
1. Speed in physical tasks
2. Accuracy in physical tasks
3. Walking ability
4. Movement in arms or legs
5. Sight or hearing
COGNITIVE FUNCTION RATING SCALE
1. Ability to explain self verbally
2. Concentration
3. Memory
4. Reasoning
5. Speed of thought
Very severe Severe Moderate Mild No problem problem problem problem problem
EXECUTIVE FUNCTION RATING SCALE
1. Independence in looking after self
2. Self organisation
3. Ability to organise others
4. Creativity
Very severe Severe Moderate Mild No problem problem problem problem problem

APPENDIX J. CONTRIBUTIONS OF COPING ITEMS TO FACTOR STRUCTURE 109
PROBLEM FOCUSED COPING
2. Concentrated on something good that could come out of the whole thing
3. Tried not to burn my bridges behind me but left things open somewhat
5. Made a plan of action and followed it
10. Just took things one step at a time
IM know what had to be done, so I doubled my efforts and tried to make things
work
12. Came up with a couple of different solutions to the problem
15. Stood my ground and fought for what I wanted
16. Talked to someone to find out about the situation
17. Accepted sympathy and understanding from someone
18. Got professional help and did what they recommended
19. Talked to someone who could do something about the problem
20. Asked someone I respected for advice and followed it
21. Talked to someone about how I was feeling
EMOTION FOCUSED COPING
4. Changed or grew as a person in a good way
6. Accepted the next best thing to what I
wanted
7. Came out of the experience better than when I went in
8. Tried not to act too hastily or follow my
APPENDIX J. CONTRIBUTIONS OF COPING ITEMS TO FACTOR STRUCTURE 110
own hunch
9. Changed something so things would turn out all right
13-Accepted my strong feelings, but didn't let them interfere with other things too much
14-Changed something about myself so I could deal with the situation better
22. Blamed myself
23. Criticised or lectured myself
24. Realised that I brought the problem on myself
25. Hoped a miracle would happen
26. Wished I was a stronger person - more optimistic and forceful
33. Went on as if nothing had happened
34. Felt bad that I couldn't avoid the problem
37. Got mad at the people or things that caused the problem
38. Tried to forget the whole thing
39. Tried to make myself feel better by eating, drinking, smoking or taking medication
42. Refused to believe it had happened
AVOIDANCE COPING
1. Bargained or compromised to get something positive from the situation
29. Daydreamed or imagined a better time or place than the one I was in
31. Though about fantastic or unreal things that made me feel better
35. Kept my feelings to myself
36. Slept more than usual

APPENDIX J. CONTRIBUTIONS OF COPING ITEMS TO FACTOR STRUCTURE 111
40. Avoided being with people in general
41. Kept others from knowing how bad things were
WISHFUL THINKING
27. Wished I couold change what had happened
28. Wished I could change the way I felt
30. Had fantasies or wishes about how things might turn out
32. Wished the situation would go away or

APPENDIX K:
Papers from this investigation
112
1. Malia KB, Powell GE and Torode S. Coping and psychosocial function after brain injury. Accepted for publication in Brain Injury.
2. Mafia KB, Powell GE and Torode S. Personality and psychosocial
function after brain injury. Submitted for publication in Brain Injury.
3. Malia KB, Powell GE and Torode S. An examination into the
relationships between personality, coping and psychosocial
function after brain injury. A longitudinal study. Submitted to
the RAF Medical Research Council for permission to publish.


