Perspectives on the Forest Products Industry CONFIDENTIAL AND PROPRIETARY Any use of this material without specific permission of McKinsey & Company is strictly prohibited Québec City – May 24, 2012 Québec Forest Industry Council
Transcript
Perspectives on the Forest Products Industry
CONFIDENTIAL AND PROPRIETARYAny use of this material without specific permission of McKinsey & Company is strictly prohibited
Québec City – May 24, 2012
Québec Forest Industry Council
McKinsey & Company 1|
Contents
▪ Trends and developments in the
North American and global markets
▪ Competitiveness of the Quebec forest sector
▪ Potential responses and ways forward
McKinsey & Company 2|
Changed consumption patterns▪ Stagnation in developed countries▪ Growth in new economies
Changed production base▪ Production follows consumption
– China/Asia (paper/board)– Other emerging markets– (India)
▪ South America (pulp)
Changed raw material dynamics▪ Fundamental land use issues▪ Biomass for energy▪ Recycled fiber scarcity
Increasing requirements on sustainability and interest in green products
Three fundamental forces drive the most important trends in the forest products industry today
Demographic changes
Fundamental forces General trends Key forest-industry trends
New opportunities for construction wood – Asia & domestic industrialized building
Technology and knowledge development
Experiencing Earth’s limits
Growing healthcare sector
New consumers
Growing public sector
Second agricultural revolution
Increased connection between world economies
Growing infrastructure problems
Urbanization and megacities
Changed economic centers
Accelerating green economy
Changed social values
Increased regulation
McKinsey & Company 3|
90
95
100
105
110
115
120
125
130
135
140
145
40
60
80
100
120
140
160
180
200
220
240
260
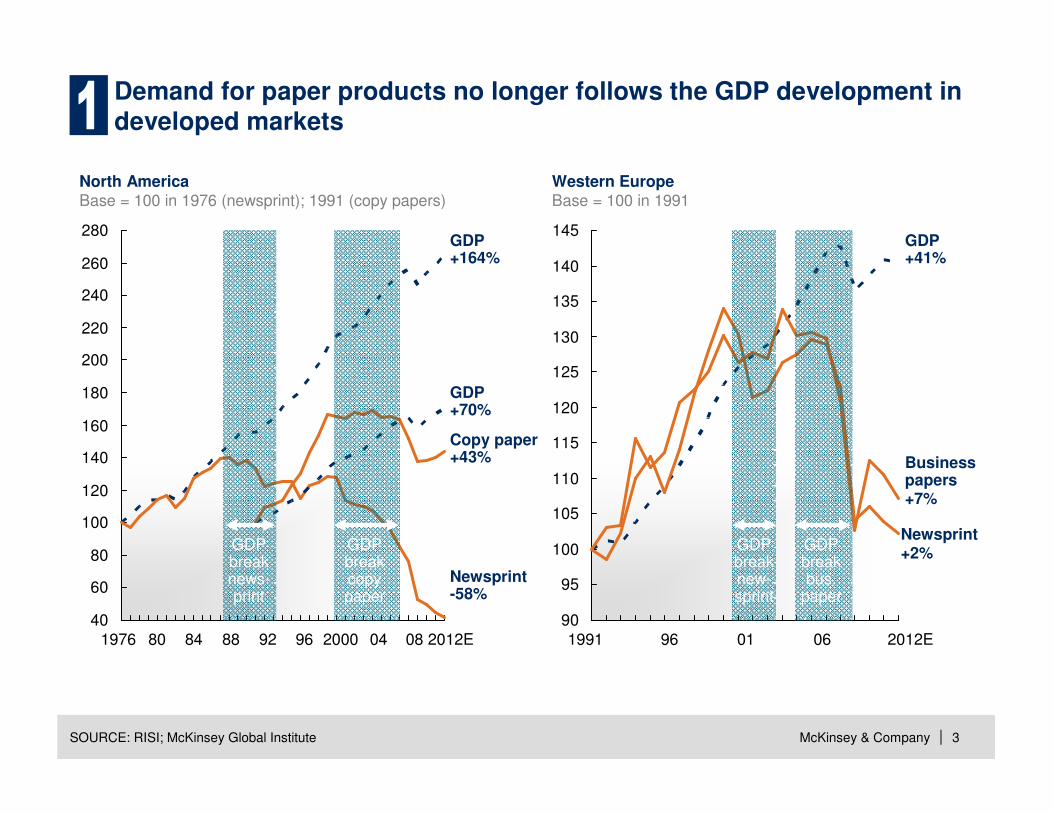
280GDP+164%
GDP+70%
Copy paper+43%
Demand for paper products no longer follows the GDP development in developed markets
SOURCE: RISI; McKinsey Global Institute
North AmericaBase = 100 in 1976 (newsprint); 1991 (copy papers)
Western EuropeBase = 100 in 1991
1991 96 2012E
Newsprint+2%
Business papers+7%
1976 80 84 88 92 96 2000 04 2012E
GDP+41%
Newsprint-58%
08
GDP break news-print
GDP break copy paper
01 06
GDP break bus.
paper
GDP break new-sprint
McKinsey & Company 4|SOURCE: Audit Bureau of Circulations, PaidContent
2.2
2.0
1.8
1.6
1.4
1.2
1.0
0.8
0.6
0.4
0.2
0
2011201020092008
0.60
0.50
0.40
0.30
0.20
0.10
0
2011201020092008
0.05
0.15
0.25
0.35
0.45
0.55
0.65
Print
Digital
Print down 6%
Average Daily Circulation; Daily copies; Millions
0
0.1
0.2
0.3
0.4
0.5
0.6
0.7
0.8
0.9
1.0
1.1
1.2
201008060402001998
Large American newspapers have begun the shift to digital circulation
Print down 25% Print down 31%
McKinsey & Company 5|
3.03.3
3.1
1.6
-1.6%
2015201020001990
Copy paper consumption is expected to decrease –Western Europe example
1 Estimate based on UWF cut-size consumption, actual values slightly higher (estimate 1–3% missing)
SOURCE: EMGE; expert interviews
Apparent consumption of copy paper in Western Europe1; Million tonnes
McKinsey & Company 6|
0
5
10
15
20
25
30
0908 201514131211102007
Tablet penetration is expected to grow rapidly, further impacting graphical papers
1 Installed based/total population
SOURCE: Yankee; Press search; McKinsey analysis
Tablets population penetration1; Percent
Forecast 2012–15
North America
Western Europe
Eastern Europe
McKinsey & Company 7|SOURCE: National Bureaus of Statistics; US Census; Hindustan Unilever investor presentations Sep2008; Freedonia;Euromonitor; McKinsey
In packaging changing consumer demographics and shopping behaviors create positive dynamics
Changing
demographics
Changing shopping
behaviors
Higher “churn”; increasing volumes
Opportunities for
differentiation and higher margins
New
requirements on packaging
New demands on packaged
foods and goods
Substrate
choice and dynamics
Technology development
McKinsey & Company 8|
What’s next?▪ China’s next development step?▪ Will southern hemisphere fiber continue to be low-cost?
Relative production capacity is experiencing significant shifts out of Europe/North America
SOURCE: RISI; McKinsey
Production capacity; Millions tonnes
0
10
20
30
40
50
60
70
80
90
100
20151005001995
0
50
100
150
200
20151005001995
0
10
20
30
40
50
60
70
80
05 10 2015001995
Freesheet (UFS + CFS)1 Containerboard Market pulp
North America
Latin America
Europe
Asia/ Oceania
RoW
1 Woodfree capacity for 1995 to 1999 based on actual production and 2000 utilization rate
Forecast Forecast Forecast
McKinsey & Company 9|
90
Wind
Hydro
2020 scenario
3,030
1,650
380
280
370
350
Biomass and Waste
Biofuels
Sun, Geothermal,Wave, and Tidal
310
2007
1,330
800
30 100
Energy growth from biomass2
850
Growth in other renewables
850
In the European Commission’s scenarios, biomass plays a crucial role
to secure the EU’s RES targets – threat or opportunity?
EU-27 Final energy consumption1; TWh
SOURCE: 2010 report ‘Biomass for heat and power’ by ECF, Södra, Sveaskog, and Vattenfall (Capros et al (2008):Model-based Analysis of the 2008 EU Policy Package on Climate Change and Renewables; IEA)
1 Aveage of ‘EC proposal with RES trading’ and ‘EC proposal with CDM and RES trading’ scenarios2 Varies between 839 and 886 TWh depending on scenario
Direct use
HeatPower
Direct use
Heat/cooling
Power
McKinsey & Company 10|
Increasing biomass trade (due to RES targets) will create new wood-fiber dynamics
SOURCE: Hawkins Wright; WRQ; RISI; Canadian Biomass Magazine; Press search
Planned new large scale (>350 kt/y) wood pellets mills, as of January 2012
Capacity000 t/yCompany Start-up
RWE InnogyGerman PelletsCanadian Bio PelletEnvivaEnvivaPoint EnergyEnviva
Total NA
750500450
450400400350
~3,300
201120122011
2013201220132012
Capacity000 t/yCompany Start-up
Suzano
Suzano
3,000
2,000
2014
2019
Capacity000 t/yCompany Start-up
VyborgskayaCellulose
German Pellets
900
400
2011/12
TBD
NOT EXHAUSTIVE
McKinsey & Company 11|
Global recovered paper supply is tightening, as paper consumption declines and recovery rates reach practical limits in key export regions
Continued increase in demand for RCF in Asia, while reduced ‘production’of RCF in North America/Europe
Expect increased prices for RCF
Opportunity for fresh fiber, particularly long fiber
Potential competition for RCF from bio-energy
Reduced quality of RCF▪ Increasing RCF share in total furnish▪ Next level of sources used
Innovation needed on further reducing fiber share
McKinsey & Company 12|
Sustainability is a ticket to play but its impact is yet unclear
Sustainability increasingly important –must be integral part of product strategy
Impact on volumes unclear
Important to shape individual
situations
‘Sustainability’ often just a way to uncover new opportunities for cost reduction in the value chain
Don’t expect premium for green products – but they can be differentiator to secure business
Innovation needed to ride the wave
McKinsey & Company 13|
There is uncertainty around the timing of the anticipated recovery of annual housing starts
Annual housing startsMillions of units
08070605040302012000
0.4
0.2
0
1.5
201709 151413121110
2.2
2.0
1.8
1.6
1.4
1.2
1.0
0.8
0.6
16
McGraw Hill forecast
Bureau of Census; Moody’s Analytics
Actual
McKinsey & Company 14|
Contents
▪ Trends and developments in the North American and global markets
▪ Competitiveness of the Quebec forest sector
▪ Potential responses and ways forward
McKinsey & Company 15|
-5
0
5
10
15
20
25
30
1992 1996 2000 2004 2008 2012
0
5
10
15
20
25
1990 1995 2000 2005 2010 2015
SOURCE: McKinsey CPAT database
1 Average across ~30 North American paper/board producers
EBIT margin1
PercentROCE1
Percent
North American paper and paperboard producers’ margins and returns have seen a declining trend over the past 10–15 years
McKinsey & Company 16|
-4
-2
0
2
4
6
8
10
4 8 12 16 20 24 28 32 36 40 44
Organic growth outlook trajectory 2011–211
Percent CAGR
Average EBITDA margin 2012–142
PercentTypical margin to cover maintenance and strategic capex and capital cost
Average global paper and board growth
North American and European paper producers are generally not well positioned for future growth
1 Outlook weighted based on each company’s regional production base and product range, measured in volume (Europe seen as one region)2 Based on current earnings estimates
SOURCE: Company reports; RISI; Hawkins Wright; EMGE; Bloomberg; McKinsey analysis
Improve operations to earn the right to grow
Fundamental restructuring
Expand to global champion
Expand beyond regional market
Asia
South America
North America
Europe
NOT EXHAUSTIVE
McKinsey & Company 17|
How Quebec does on major competitive thrusts?
Product momentum
Asset competitiveness
▪ Wood costs
▪ Other costs
– Energy price
– Energy usage
– Labour productivity
McKinsey & Company 18|
1 Demand growth in North America for QC, Canada and US, global demand growth for market pulp
Inherent growth by world regionWeighted average annual demand growth1, 2011–16e; %
4.1
3.1
0.60.50.2
-1.6
AsiaRest of World
EuropeRest of Canada
USQC
Quebec’s asset base is skewed towards segments with poor growth
McKinsey & Company 19|
Rest of Canada lumber exportsCAD billion
Quebec lumber exportsCAD billion
SOURCE: Statistics Canada
2.4
2.2
2.0
1.8
1.6
1.4
1.2
1.0
0.8
0.6
0.4
0.2
0
-72%
111009080706050403020100 03020100
10
9
8
7
6
5
4
3
2
1
0
-53%
1110090807060504
Other
Europe
Asia
USQC and Canada lumber exports collapsed with US housing crisis – other provinces have been more successful developing new markets
McKinsey & Company 20|
Canadian wood costs are mid-range in an international comparison; but high in a North American comparisonAverage delivered prices for pulpwood logs, US dollar per dry tonne
71
84
90
97
100
106
107
107
109
151
162
163
166
176
185
US South
Chile
Russia, NW
NZ
Australia
Brazil
Spain
Canada West
US NW
France
Canada East
Germany
Finland
Sweden
Norway
55
58
69
72
82
93
98
110
119
130
131
134
135
161
253
Brazil, cost1Russia, NW
US South
US NW
Chile
Canada East
Indonesia
France
Brazil
Australia
Finland
Sweden
Spain
Germany
China
1 Integrated cash costs of forestry, harvesting and transport for company with own forests – much lower than prices on the (limited) open market
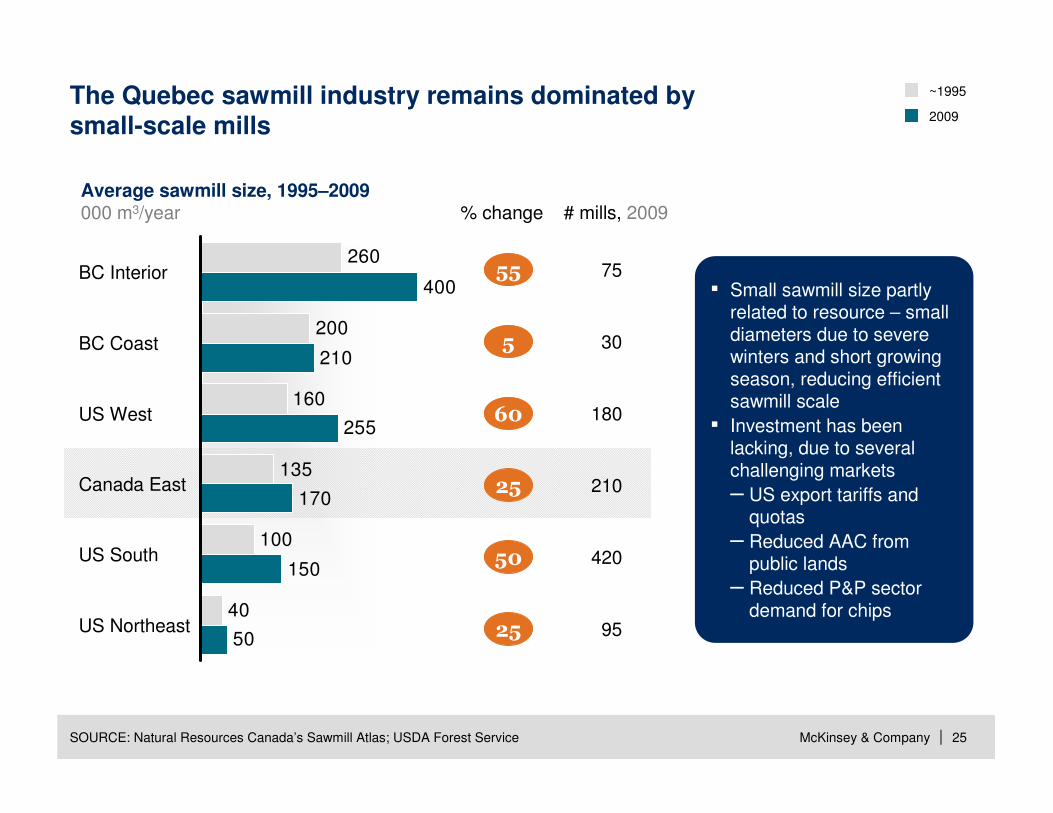
▪ Small sawmill size partly related to resource – small diameters due to severe winters and short growing season, reducing efficient sawmill scale
▪ Investment has been lacking, due to several challenging markets
– US export tariffs and quotas
– Reduced AAC from public lands
– Reduced P&P sector demand for chips
25
50
25
210
420
95
McKinsey & Company 26|
Canadian mills tend to be less labor and energy efficient
LaborTonne/employee
1,700
1,600
1,500
1,400
1,300
0.38
1,200
0
Energy (fuel and purchased power)Tonne/MWh
0.480.460.440.420.400.360.340.320
New Zealand
Austria
Russia
Germany
US
Chile
SwedenCanada
Average BSKP1 production efficiency, 2011
SOURCE: Fisher International; McKinsey analysis
0.5m tonnes/yr
2.0m tonnes/yr
1 Including fluff pulp
McKinsey & Company 27|
But labor productivity has improved over the last decade
SOURCE: Statistics Canada; Coal Association Canada; FAO; RISI
-2.3
-1.6-1.2
-0.2
1.4
3.4
4.04.2
Chemicals Oil and gasLoggingAluminumP&PSawmills CementCoal
Development of production per employee, Canadian basic materials sectorsAnnual percentage change, 1999–2010
McKinsey & Company 28|
Contents
▪ Trends and developments in the North American and global markets
▪ Competitiveness of the Quebec forest sector
▪ Potential responses and ways forward
McKinsey & Company 29|
Four potential elements of an industry-wide transformation
There is no silver bullet!
Structural changesInevitable! But consolidation per se not certain to help
Productivity and functional excellence
Cost will continue to be king!
New S-curve for markets – new and old
Enthusiasm and realism; focus on what you are good at
Business environmentValue creation drives jobs –not the other way around
McKinsey & Company 30|
The Canadian newsprint industry has made great efforts to balance the market by closing capacity – but we need to expect more is to come
Canadian newsprint closures1
Thousand tonnesCanadian newsprint demand and operating rates
Thousand tonnes
Percent
Total
5540
2010-2011
1258
2008-2009
1509
2006-2007
977
2004-2005
1168
2002-2003
628
0
1,000
2,000
3,000
4,000
5,000
6,000
7,000
8,000
9,000
10,000
0
10
20
30
40
50
60
70
80
90
100
2012E10864201998
Exports
Demand
Operating rate
1 Including closures of indefinitely idled machines
SOURCE: RISI; McKinsey analysis
Canada,non QC
QC
McKinsey & Company 31|
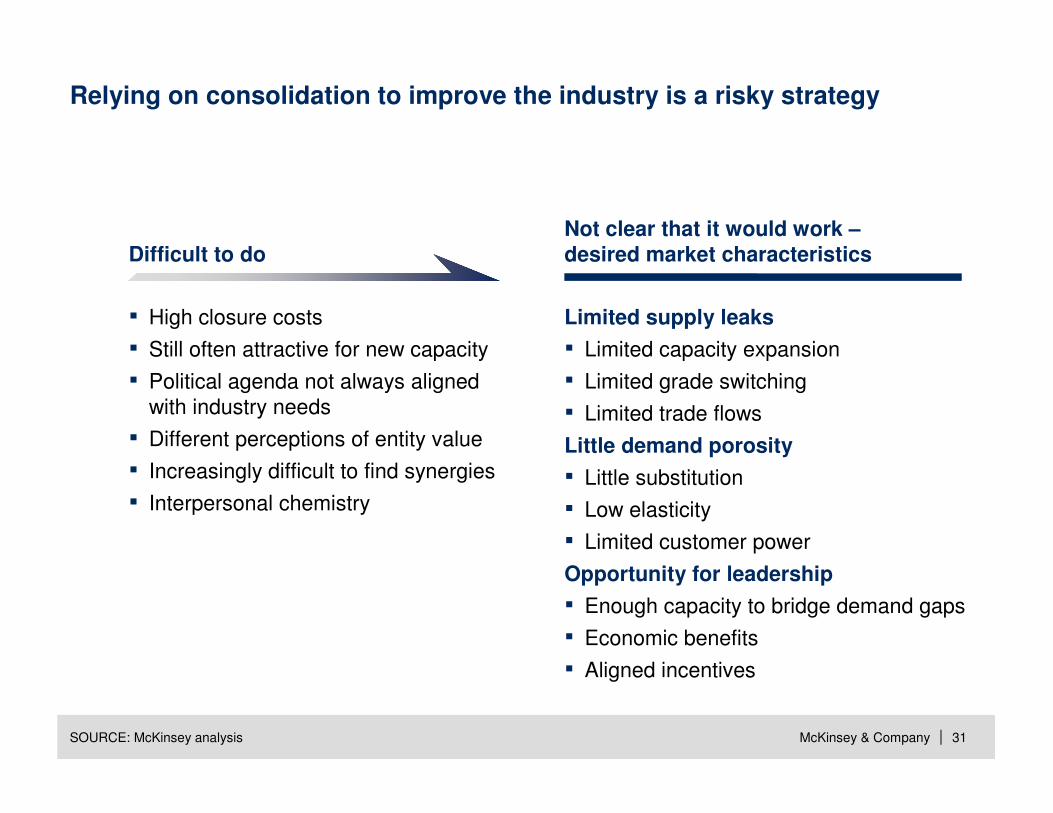
Relying on consolidation to improve the industry is a risky strategy
SOURCE: McKinsey analysis
Difficult to do
▪ High closure costs
▪ Still often attractive for new capacity
▪ Political agenda not always aligned with industry needs
▪ Different perceptions of entity value
▪ Increasingly difficult to find synergies
▪ Interpersonal chemistry
Not clear that it would work –desired market characteristics
Limited supply leaks
▪ Limited capacity expansion
▪ Limited grade switching
▪ Limited trade flows
Little demand porosity
▪ Little substitution
▪ Low elasticity
▪ Limited customer power
Opportunity for leadership
▪ Enough capacity to bridge demand gaps
▪ Economic benefits
▪ Aligned incentives
McKinsey & Company 32|
Potential cash
cost reduction
5–10%
Source: RISI; McKinsey analysis
550
500
450
400
350
300
250
12108765
150
100
50
0
0
200
Introducing the ‘Lean Mill’ can yield significant cost reductions
CapacityMillion metric tonnes
NewsprintEUR/tonne, delivered
Mill starting position
Mill potential position
Typical improvement experience
Productivity/lean
▪ ~5% increased production at same marginal contribution
▪ Variable cost decrease of 2–5%
Fixed cost reduction
▪ 15–20% reduction (production, maintenance, support functions
Procurement
▪ 2–5% reduction on fiber and energy categories and 10–20% on others
SG&A
▪ 25% reduction of SG&A cost
McKinsey & Company 33|
Industry sector
Achieved savings in percent of total energy costs with payback <3 years
0 10 20 30 40 50
Steel
Chemical
Pulp and paper
Consumer goods
Automotive and assembly
Retail
Category
Impact achieved
Min Max
SOURCE: McKinsey
Mining
▪ Integrated upstream
▪ Electric arc furnace
▪ Downstream processing
▪ Continuous processing
▪ Paper production
▪ Packaging
▪ Machining lines
▪ Mechanical/plant engineering
▪ Warehouses
▪ Shops
▪ Liquid goods fabrication
▪ High intensity
▪ Dry goods fabrication
▪ Assembly serial production
▪ Batch processing
▪ Beneficiation plant
Our experience indicates energy efficiency can be improved by 10–15% across all industry sectors, including P&PPercent
McKinsey & Company 34|
Productivity is fundamental even in forest activities (e.g., harvesting)
SOURCE: McKinsey
From… …to
Technical systems
Formal structure and organization
Leadership and mindsets
▪ Standardized, well trained methodology where each harvester reaches ‘best practice’ productivity
▪ Precise and regular control/follow-up with correcting actions taken ‘here and now’
▪ Harvesting groups working towards same target, with same methodology and with leaders that are present and act as role models
McKinsey & Company 35|
Marketing and sales are generally not focus areas of excellence in the forest products industry but can have substantial impact
Enablers
▪ Organization and pivotal roles▪ Talent and skills, mindsets and behaviors▪ Performance management▪ Information and analytical tools
Capabilities
Typical potential▪ 2–3% ROS▪ 2–10% growth
above market
▪ Strategic marketing and go-to-market model
▪ Innovation in products and services▪ Product management▪ Pricing and contract management▪ Customer management▪ Channel management▪ Field sales force management
▪ Tactical optimization of sales and supply
Marketing
Sales
McKinsey & Company 36|
Swedish steel companies survived crisis of the 70’s through specialization
SOURCE: Jernkontoret; McKinsey
▪ Crisis in Swedish steel industry in the 1970s
– Disappearance of the Swedish ship building industry
– Decline of Swedish construction sector
▪ Strong market competition due to liberal Swedish trade policy –leading to an increase in imports
▪ Steel companies pressured to increase profitability in order to survive
Catalyst
▪ Many companies chose specialization to avoid tough price competition in bulk products
▪ Chose to cultivate image of high-quality, expert producers within their respective segments
▪ Close cooperation with end customers enabled R&D to create new products and adjust metallurgical processes to stay in the lead
Bio-refineries to maximize the value of a tree holds a lot of promise –much research still needed before generally attractive
Chips
Glucose Extractives Hemicellulose Lignin
Cellulose Pulp Paper
Gasification
SOURCE: Adapted from P. Axegård, STFI-Packforsk (Innventia), PIRA Energy Management Conference, October 2006
Bark and harvest residues
▪ Methanol▪ DME▪ Bio diesel
▪ Ethanol▪ Butanol
▪ Fatty acids▪ Tannin▪ Anti-oxidizers
▪ Film/barriers▪ Hydrogels▪ Base
chemicals▪ Bio-polymers
▪ Pellets▪ Active carbon▪ Phenols▪ Carbon fiber▪ Emulsifiers
▪ ‘Value-added’ often equals ‘cost-added’ – not necessarily the same as ‘value creating’▪ There is no ‘new economy’ – supply-and-demand laws still apply▪ Other industries are moving too – wood is not the only biomass feedstock
McKinsey & Company 38|
In paper and forest products, value is often created in the upstream and downstream parts of the value chain
X (Y-Z) = Average (min – max)
Position in value chain
Level ofprofitability
1 Average of 8 companies2 Average of 25 companies3 Average of 14 companies4 Average of 15 companies
SOURCE: CPAT; McKinsey analysis; Odin; Company websites; McKinsey
In Sweden, an emerging trend towards more industrialized wood construction is leading to increased penetration in the building market
Type of constructionWood market share%
1 Includes smaller pedestrian bridges
SOURCE: Svenskt Trä (Swedish Wood)
Residential – 1 storey >90
Residential – 2 storey >50
Residential – 3-8 storeys >15
Sports arenas etc >30
Bridges1 >20
McKinsey & Company 41|
Still many obstacles to increased industrialization of wood construction
Few national/international agreements or targets
Small and fragmented wood-product actors (with small voices)
Complex building codes that make standardization difficult
Risk-averse, conservative customers
Lack of knowledge among policy- and decision makers
Increasing competition from other building products
McKinsey & Company 42|
In summary
A paradigm shift▪ Fundamental shifts in consumption patterns, industry
structure, and raw materials dynamics
Quebec/Canada
in challenging position
▪ Western world demand stagnating for many traditional paper products (brighter for wood products)
▪ Quebec in challenged starting position e.g., regarding product portfolio, cost base, and assets; but raw material (virgin fiber) could see revival of fortunes
Actions on several
fronts needed
▪ No silver bullet – combination of restructuring, productivity increases, demand stimulation, and new products required
▪ Possibility to build competitive edge in new products based on virgin fiber – requires sustained efforts and challenges should not be underestimated
▪ Now is the time to bring all stakeholders together