Page 1
THIS REPORT CONTAINS ASSESSMENTS OF COMMODITY AND TRADE ISSUES MADE BY
USDA STAFF AND NOT NECESSARILY STATEMENTS OF OFFICIAL U.S. GOVERNMENT
POLICY
Date:
GAIN Report Number:
Approved By:
Prepared By:
Report Highlights:
Peru’s retail food sales in calendar year (CY) 2013 reached $20 billion, $4 billion (or 20 percent) of
which were in supermarket sales (up 10 percent compared to 2012). Roughly $16 billion of all
purchases occur within Lima alone. The food retail market includes 224 modern food stores (154 in
Lima). Strong consumer demand is forecast for imported food and agricultural products in the short- to
medium-term, driven by a growing middle class. The retail food product trade benefits from the
reduction or tariff elimination that resulted after implementation of the U.S.-Peru Trade Promotion
Agreement. U.S. consumer-oriented food exports to Peru in 2013 are at a record $212 million, up $148
million or 232 percent compared to CY 2009 levels. U.S. exports in CY 2014 (January-September) at
$167 million are already up 10 percent compared to CY 2013 levels.
Alvaro Loza and Mariano J. Beillard
Casey E. Bean
Peruvian Supermarket Expansion Boosts U.S. Export
Opportunities
Retail Foods
Peru
12/02/2014
Required Report - public distribution
Page 2
Section I. Market Summary
President Ollanta Humala’s administration will continue sound fiscal and monetary policies during 2015,
despite economic growth slowing to 2.8 percent during the first eight months of 2014 (compared to
average annual growth of 6.6 percent in 2010-13) and somewhat heightened political tension within the
ruling Gana Peru party. In the run-up to the 2016 general elections, the administration is facing the short-
term challenge of the sharp slowdown in economic growth. The ruling Gana Peru party currently retains
only 36 seats in the national congress, just one more than the main opposition party Fuerza Popular
(Fujimorist party), after seven of its legislators split from the party in July 2014.
Nonetheless, FAS Lima forecasts overall consumer demand for imported food and agricultural products
in the short- to medium-term will remain strong, driven by a growing middle class. Total retail food sales
in 2013 reached $20 billion, $4 billion (20 percent) of which were in supermarket sales (up 10 percent
compared to 2012). Roughly $16 billion (or 80 percent) of all purchases occur within Lima. Domestic
consumption will benefit in the short- to medium-term from government stimulus measures aimed at
boosting consumer spending and investor confidence. The national economy’s heavy reliance on
extractive mining, however, makes consumer and investor demand vulnerable to any prolonged price
downswing for Peru’s main export commodity, copper.
Although Lima accounts for one third of Peru’s population of 30.1 million (Central Intelligence Agency
estimate, July 2014), strong demand in the interior of the country is driving new supermarket openings.
Cuzco, Ucayali, Huanuco, Moquegua and Cajamarca are being targeted by shopping center developers,
utilizing supermarkets as anchor stores. The Peruvian Commercial Center Association (PCCA) reports
the opening in 2013 of twelve new shopping centers with supermarket anchor stores, with eleven of these
openings occurring outside of Lima. At the same time Lima saw the opening of six new standalone
supermarkets, while the interior provinces saw the opening of three new standalone supermarkets.
Demand is strongest for imported food products in the form of canned goods, packaged foods, and ready-
to-eat meals.
Cuzco, with over 100,000 foreign visitors monthly, is Peru’s preeminent tourist destination and as a result
is seeing significant supermarket expansion to meet local and visitor food needs. The Inter-Corp Group
finished construction in 2013 of the Real Plaza Shopping Center. This shopping center counts with a new
4,500 square meter Plaza Vea supermarket, Cuzco’s largest store. Plaza Vea’s large footprint facilitates
the introduction of new products not previously present in Cuzco. Local consumers, long accustomed to
the smaller traditional markets are adapting their purchasing habits to the modern supermarket format.
First year sales totaling over $30 million have exceeded initial projections. An additional Plaza Vea, as
well as a Tottus (Saga Falabella Group) will also open towards the end of 2014. Peru’s three major
retailers (i.e., CENCOSUD, Supermercados Peruanos, and Hipermercados Tottus) are similarly planning
new supermarket openings in nearby Ollantaytambo (the Sacred Valley).
The Peru’s food retail market includes 224 modern retail food stores (154 in Lima). Modern grocery
retailers such as supermarkets chains and convenience stores are expanding into Lima’s lower-middle
income districts as well. Modern retailers are benefitting from consumers’ improved access to credit,
enticing buyers with deep discounts on certain items when utilizing store credit cards.
Page 3
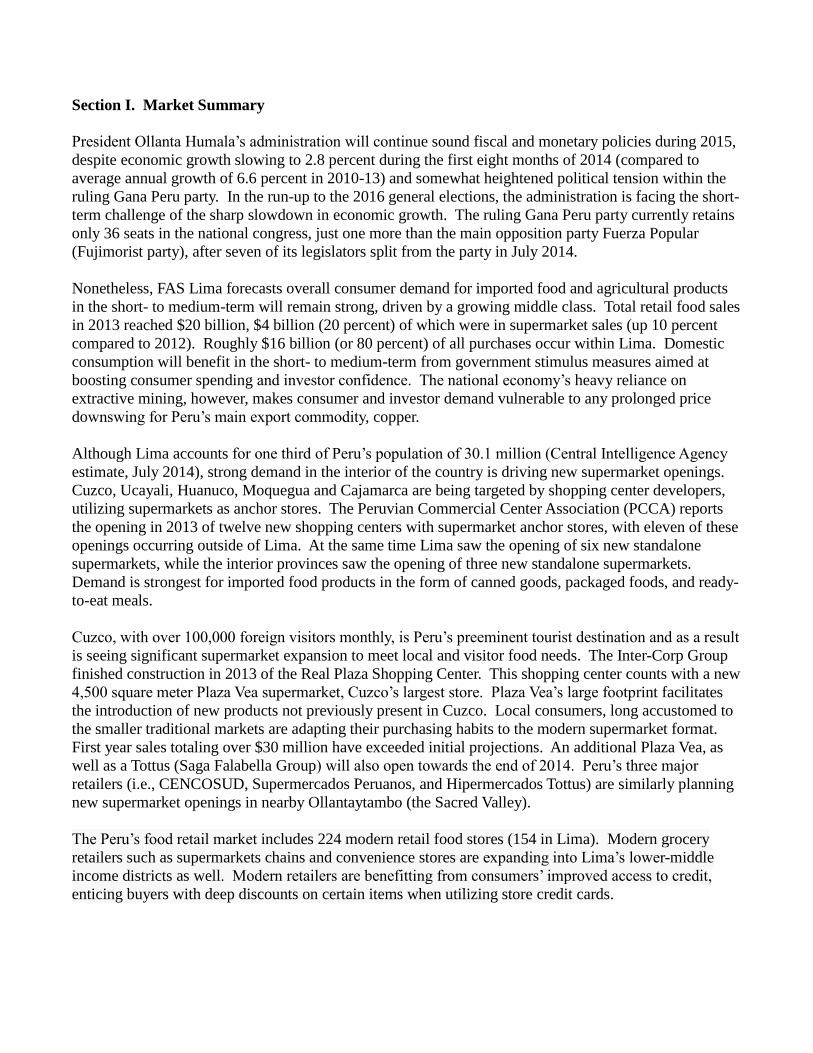
The traditional channel includes corner grocery stores and open markets, which together account for 75
percent of all food purchase sales. These corner stores benefit from proximity to consumers, usually
within walking distance of households. Catering primarily to lower-income groups, Peru’s small
independent grocers specialize in providing a mix of affordably prices goods in smaller retail package
sizes.
Table 1: Peru, Food Retail Sales by Sub-Sector ($ Million)
Sub-Sector 2011 2012 2013
Supermarkets and hypermarkets 3,390 3,790 4,169
Traditional Channel (grocery stores,
wet markets, convenient stores, etc.) 13,560 15,161 16,276
Total 16,950 18,951 20,445
Source: FAS Lima office research.
According to industry sources, supermarket retailers continue to struggle to convince consumers to make
in-store purchases of fresh produce. Consumers traditionally view supermarkets as sources for processed
food products.
A limiting factor for modern supermarket retail expansion, especially within Lima, is the lack of
affordably priced land available for new store construction. Limited land availability forces the
development of compact supermarkets of less than 1,000 square meters. The smaller format is attracting
customers more familiar with the convenience store format.
The consumer-oriented retail food product trade has benefitted from the U.S.-Peru Trade Promotion
Agreement (PTPA). U.S. consumer-oriented food exports to Peru in 2013 have grown to a record $212
million, up $148 million or 232 percent compared to CY 2009 levels. U.S. exports in CY 2014 (January-
September) at $167 million are already up almost 10 percent compared to CY 2013 levels. With a market
share of over 18 percent, the United States follows Chile as Peru’s second largest supplier of consumer-
oriented retail food products.
Best prospects for U.S. exporters within the consumer-oriented category are snacks foods, fruit and
vegetable juices, fresh fruit (i.e., pears, apples, and grapes), and canned fruits and vegetables. Dairy
products (especially cheese), beef and poultry meat and their byproducts, and pet food along with wine
and liquor also offer strong possibilities.
Page 4
Advantages and Challenges Facing U.S. Products in Peru
Advantages
Challenges
- The U.S.-Peru Trade Promotion Agreement
(PTPA) grants duty-free access to two-thirds of
all U.S.-origin food and agricultural products,
including high-value food products.
- An active supermarket industry that is
promoting increased demand for high-value
food products.
- Growth of new supermarket outlets in Lima’s
suburbs of Lima and other cities.
- Appreciation for U.S. food quality and culture.
- Perception of modern retail outlets as cleaner,
convenient and time saving.
- Increased health consciousness among the
Peruvian population.
- Middle-class expansion.
- Consumers prefer to buy fresh produce in
traditional markets.
- Supermarkets, the main source of imported
food products, account for only 30 percent of
the retail food market share in Lima and 14
percent in the provinces.
- New local food brands are appearing in the
market at very low prices.
- Provincial supermarkets are supplied by
Lima-based companies.
- Lack of brand awareness among some
consumers.
- Government organized food promotion
campaign called “Buy Peruvian.”
- Traditional markets dominate retail sales in
secondary cities.
- Domestic producers manufacture more
affordable product according to local taste
preferences.
Section II. Road Map for Market Entry
1. Entry Strategy
Supermarket chains are the main means for reaching middle- and high-income consumers.
Exporters should directly contact importers, wholesalers/distributors or supermarkets.
U.S. exporters can approach Gas Marts, grocery and convenience stores through major suppliers
(wholesalers/distributors).
Be diligent when selecting a partner (an agent or a representative). Visits to Peru and meetings
here are highly recommended. Conduct a background check of the prospective partner before
signing permanent contractual arrangements.
The local partner will provide updated information on consumer trends, as well as identify niche
markets, possible market development activities, and business practices.
Page 5
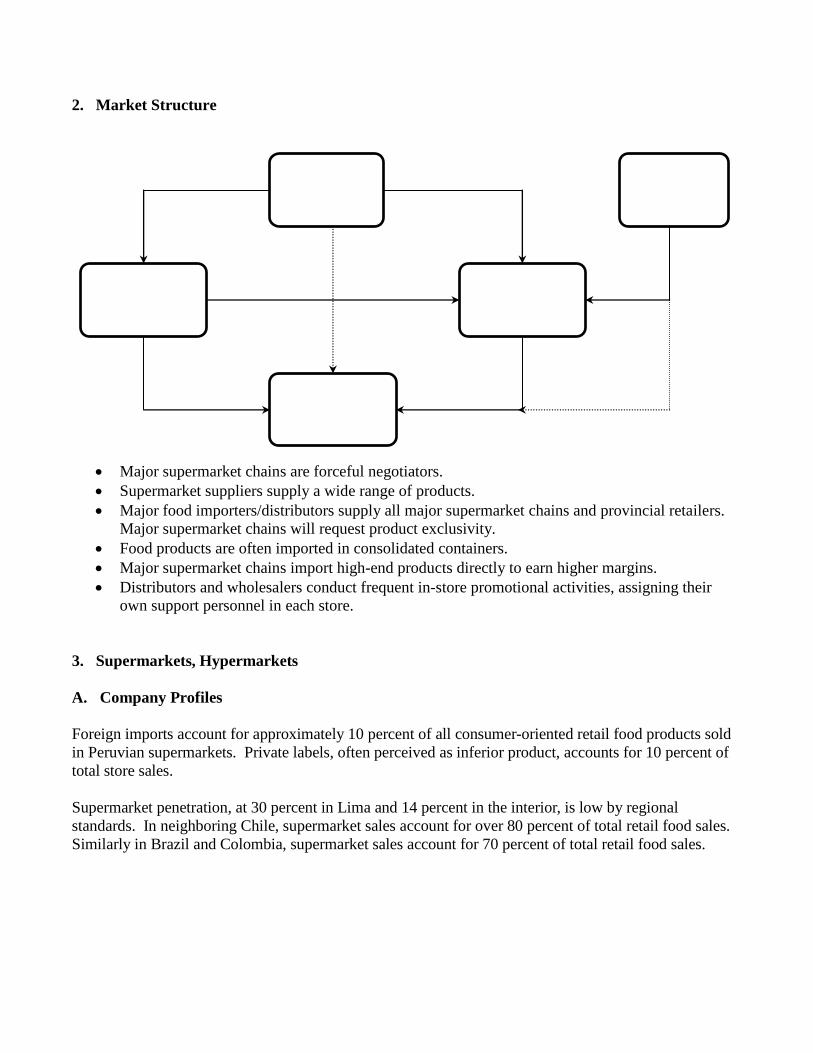
2. Market Structure
Major supermarket chains are forceful negotiators.
Supermarket suppliers supply a wide range of products.
Major food importers/distributors supply all major supermarket chains and provincial retailers.
Major supermarket chains will request product exclusivity.
Food products are often imported in consolidated containers.
Major supermarket chains import high-end products directly to earn higher margins.
Distributors and wholesalers conduct frequent in-store promotional activities, assigning their
own support personnel in each store.
3. Supermarkets, Hypermarkets
A. Company Profiles
Foreign imports account for approximately 10 percent of all consumer-oriented retail food products sold
in Peruvian supermarkets. Private labels, often perceived as inferior product, accounts for 10 percent of
total store sales.
Supermarket penetration, at 30 percent in Lima and 14 percent in the interior, is low by regional
standards. In neighboring Chile, supermarket sales account for over 80 percent of total retail food sales.
Similarly in Brazil and Colombia, supermarket sales account for 70 percent of total retail food sales.
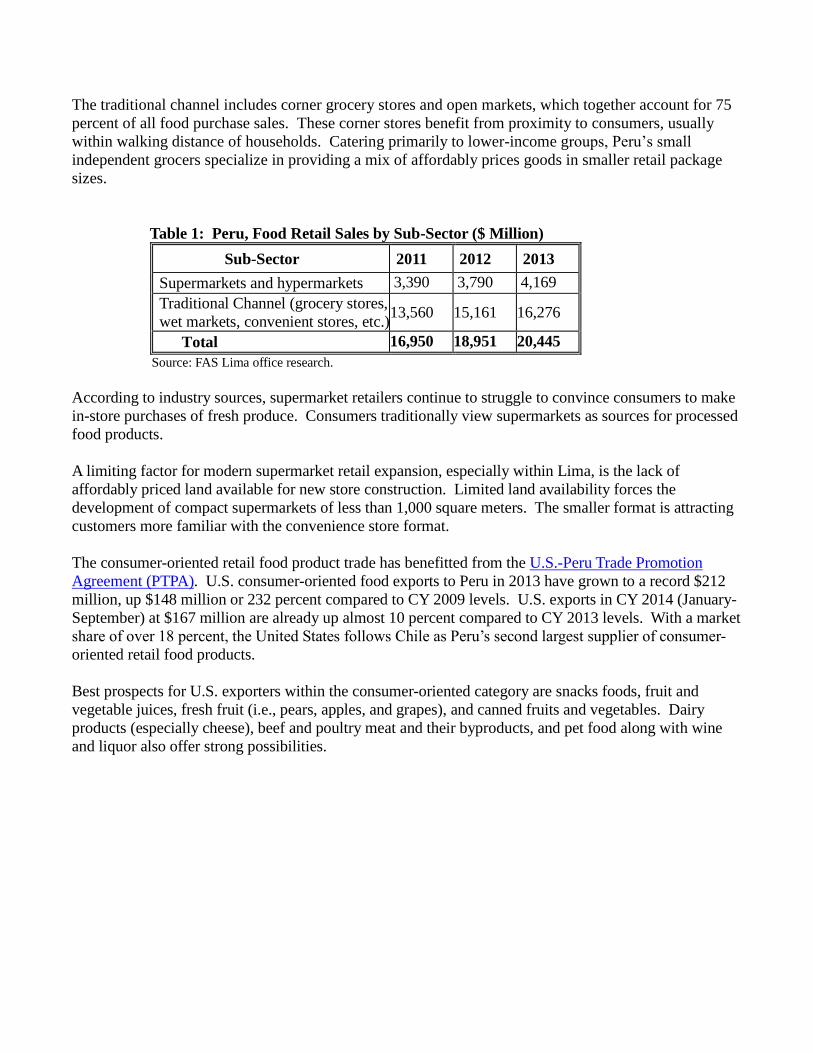
U.S.
Exporter
Wholesaler/
Distributor
Local
Importer
Retail
Market
Domestic
Supplier
Page 6
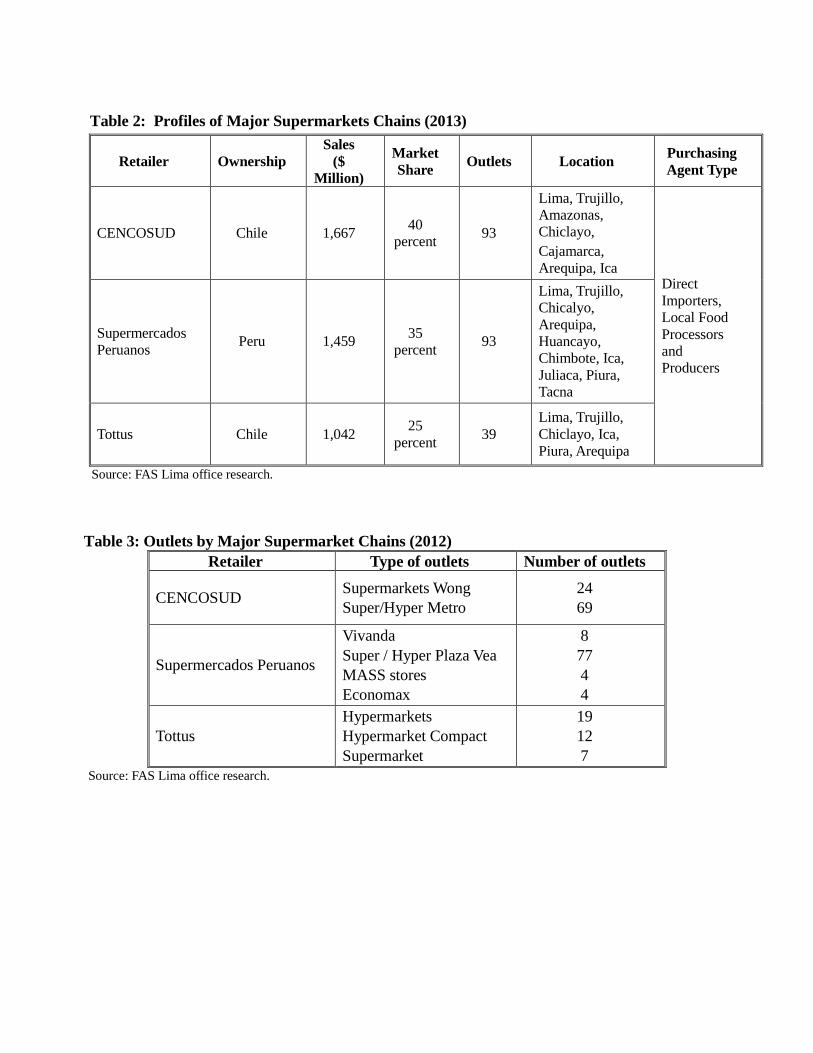
Table 2: Profiles of Major Supermarkets Chains (2013)
Retailer Ownership
Sales
($
Million)
Market
Share Outlets Location
Purchasing
Agent Type
CENCOSUD Chile 1,667 40
percent 93
Lima, Trujillo,
Amazonas,
Chiclayo,
Cajamarca,
Arequipa, Ica Direct
Importers,
Local Food
Processors
and
Producers
Supermercados
Peruanos Peru 1,459
35
percent 93
Lima, Trujillo,
Chicalyo,
Arequipa,
Huancayo,
Chimbote, Ica,
Juliaca, Piura,
Tacna
Tottus Chile 1,042 25
percent 39
Lima, Trujillo,
Chiclayo, Ica,
Piura, Arequipa
Source: FAS Lima office research.
Table 3: Outlets by Major Supermarket Chains (2012)
Retailer Type of outlets Number of outlets
CENCOSUD Supermarkets Wong
Super/Hyper Metro
24
69
Supermercados Peruanos
Vivanda
Super / Hyper Plaza Vea
MASS stores
Economax
8
77
4
4
Tottus
Hypermarkets
Hypermarket Compact
Supermarket
19
12
7
Source: FAS Lima office research.
Page 7
Supermercados Peruanos (SPSA): This chain was established in 2004 when the Interbank Group
acquired the Netherlands-based Disco Ahold International Holdings. Currently, IFH Retail Corp is the
main shareholder of Supermercados Peruanos, while the Interbank Group retains financial control.
Supermercados Peruanos reported sales in excess of $1.4 billion in 2013, up 12 percent compared to
2012 levels thanks to the opening of 10 new stores. The chain’s sales are growing at an annual rate of
over 2 percent. The company operates 92 stores in Peru, of which 48 of these are located in the interior
of the country. The company is in the process of building an additional 39 stores and taking over the
premises of four CENCOSUD Metro stores in 2016 when the current leases expire.
Supermercados Peruanos – Store Profiles
Vivanda Supermarket: Targets high-income consumers, offering specialized customer-oriented
service. Vivanda maintains a customer loyalty card program.
Plaza Vea Supermarket and Market San Jorge: This format replaced Santa Isabel stores.
Launched in 2006, it is smaller in size than the Plaza Vea Hypermarket format, specializing only
in food products. The strategy is to offer affordably priced products.
Plaza Vea Hypermarket: Targets middle-income consumers offering a variety of products at
affordable prices. This format has been chosen as the main format for the SPSA expansion plan.
Economax: Launched in March 2011, Economax is the latest SPSA store type. Operating with
limited sales floor space, the Economax format competes with convenience stores. There were
seven stores by the end of 2012.
MASS: A discount grocery stores offering a limited variety of products for mass consumers. The
four stores in Lima compete with open markets.
Tottus Hypermarkets: Tottus is owned by the Saga Falabella Group (Chile). There are currently 42
Tottus stores throughout Peru. Although it is Peru’s smallest supermarket chain, sales per square meter
are equivalent to those of Peru’s largest retailer CENCOSUD. Tottus is struggling to secure land within
Lima to build larger stores. The challenges of building/operating hypermarkets will ultimately lead to
reduced sales per square meter.
The Saga Falabella Group has located its Tottus stores alongside its SODIMAC Home Centers and Saga
Falabella department stores. This strategy has facilitated the rapid build-up of sales in urban centers. The
company offers quality, low priced products, centralized logistics and purchasing, improved inventory
control, and ongoing management training. Tottus provides a store credit card that rewards customers
with deep discounts; about 80 percent of purchases made at Tottus are made through the store credit card.
B. Local Consumer Profile
Local consumers perceive imported products as providing more variety; local products are seen as
a source of employment. Only one third of consumers care about product origin.
Consumers tend to purchase affordably priced local products.
Lima includes middle and high-income consumers (socio-economic levels A, B and C) and low-
income consumers (socio-economic levels D and E).
Supermarket market share of middle- and high-income consumers is about 80 percent. Expansion
plans are targeting lower-income consumers.
Page 8
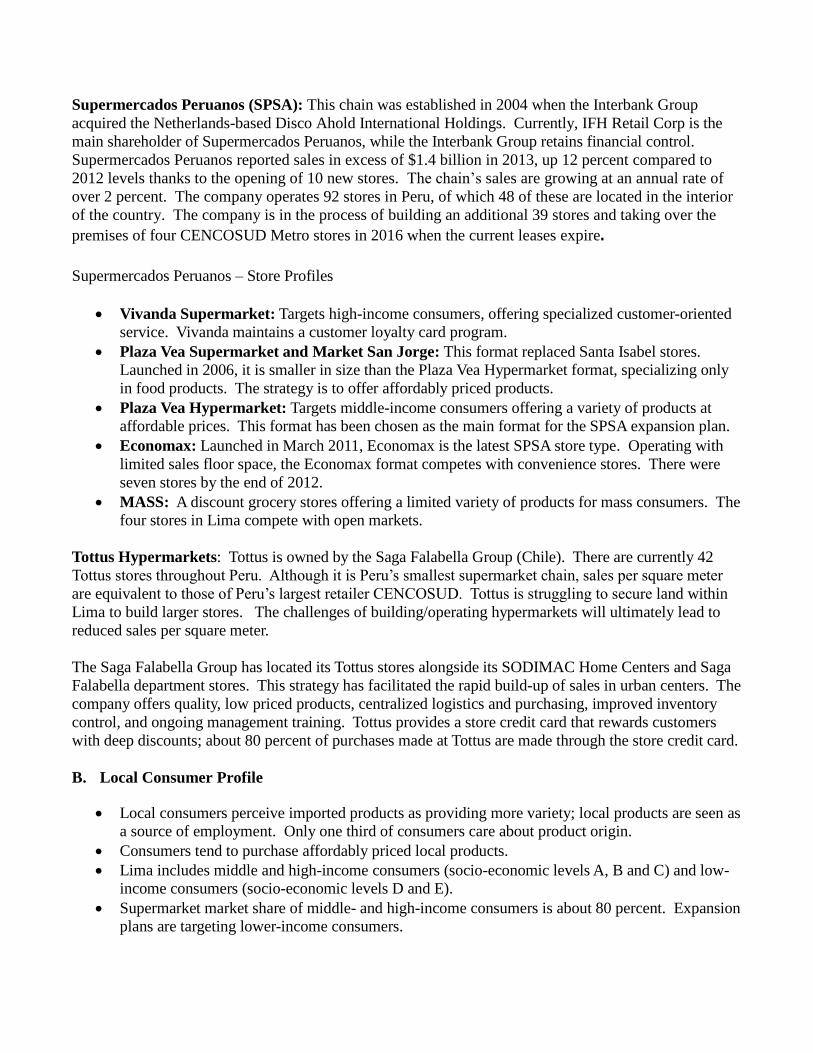
Middle and high-income consumers on average spend $90 per week at supermarkets; low-income
consumers spend roughly $10 per week.
Low-income consumers out number middle- and high-income consumers three to one.
Supermarket chains are targeting the former to grow sales.
Table 4: Per, Lima City, Food Purchasing (2013)
Lima City Middle- and High-
Income Consumers Low-Income Consumers
Population 2.1 million 6.9 million
Families (number) 0.4 million 1.4 million
Family Income
(monthly) $1,500 $320
Food Expenditure
(monthly) $310 $120
Food Purchases
(venue)
Supermarkets: 58
percent Open markets: 73 percent
Supermarket Visits Once a week Once a month (prefer to visit open markets or small
grocery stores daily).
Source: Peru INEI (National Statistics and Information Institute), FAS Lima office research.
4. Convenience Stores and Gas Marts
Convenience store (i.e., grocery stores/bodegas) retail food sales continue their upward trend,
notwithstanding growth in the modern food retail channel during the reporting period. The larger
independent grocery stores are in the process of evolving into a more modern format, offering customers
a wider offering of better displayed products. As these stores evolve into mini-markets, store owners are
experiencing net income increases of about 10 percent.
Bodegas in Peru compliment supermarket sales. These grocery stores’ proximity to consumers, rather
than prices, ultimately influences purchase decisions. These stores nevertheless face an uncertain future
as supermarkets shift to smaller formats in low to middle-income expansion target areas.
Service station retailers rely heavily on middle to high-income consumer impulse purchases, especially
after-hours. These stores offer a limited selection of packaged food products, soft drinks, and alcoholic
beverages, all sold at a substantial mark-up compared to supermarket prices. Service station stores sales
on average increased by 5 percent during 2013.
5. Traditional Markets
Sub-sector Profile
Traditional grocery retailers, with an 80 percent market share, are the most prevalent grocery channel in
Peru. Traditional grocery retailers such as open markets, street vendors, and small grocery stores are
widespread. In many rural areas, traditional grocers are the only outlet available for daily product
Page 9
purchase needs. Most food products sold in traditional markets are locally produced, inexpensive,
perishable products targeting low-income consumers.
Traditional markets include some 200,000 small grocery stores and 2,500 open markets. Lima alone has
about 70,000 grocery stores and almost 1,250 open markets. In 2013, traditional grocers registered
growth of around 5 percent.
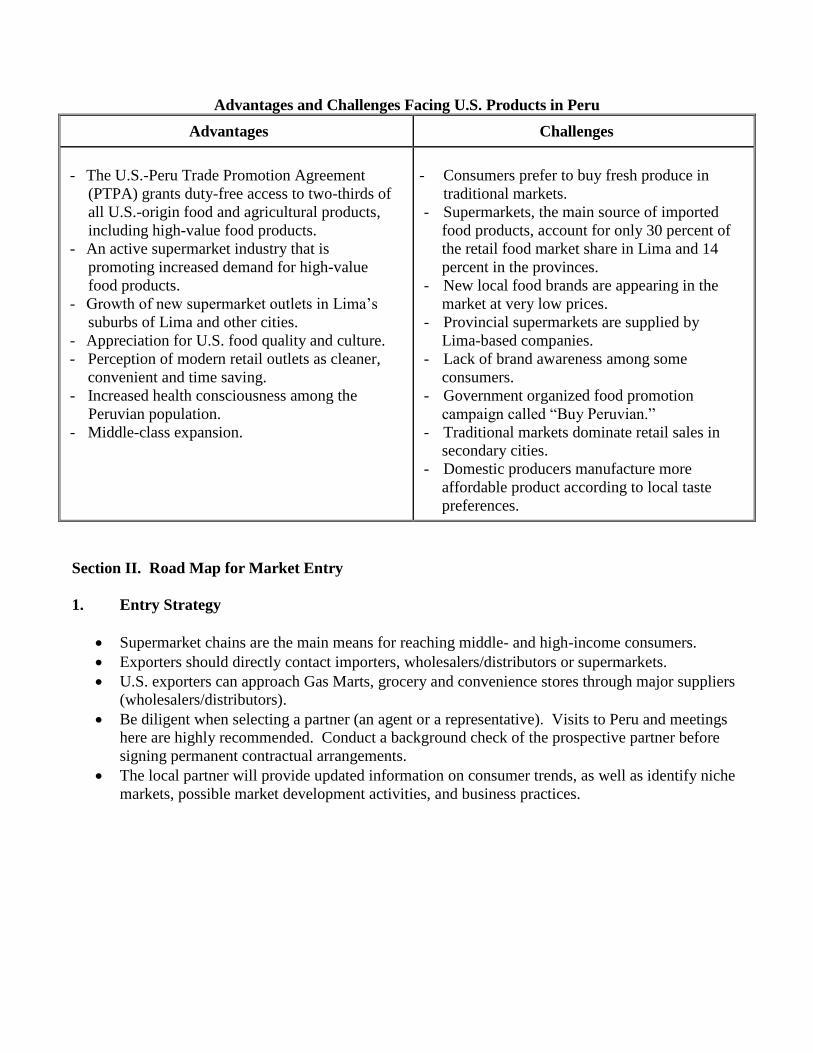
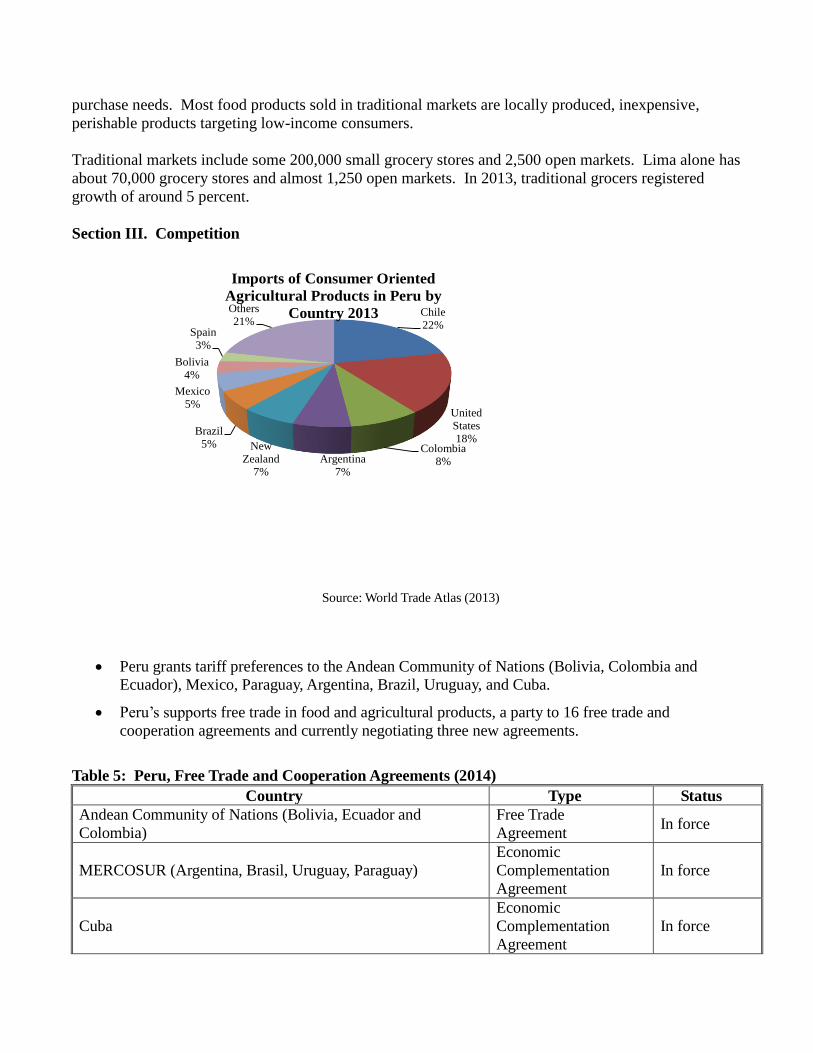
Section III. Competition
Chile
22%
United
States
18%Colombia
8%Argentina
7%
New
Zealand
7%
Brazil
5%
Mexico
5%
Bolivia
4%
Spain
3%
Others
21%
Imports of Consumer Oriented
Agricultural Products in Peru by
Country 2013
Source: World Trade Atlas (2013)
Peru grants tariff preferences to the Andean Community of Nations (Bolivia, Colombia and
Ecuador), Mexico, Paraguay, Argentina, Brazil, Uruguay, and Cuba.
Peru’s supports free trade in food and agricultural products, a party to 16 free trade and
cooperation agreements and currently negotiating three new agreements.
Table 5: Peru, Free Trade and Cooperation Agreements (2014)
Country Type Status
Andean Community of Nations (Bolivia, Ecuador and
Colombia)
Free Trade
Agreement In force
MERCOSUR (Argentina, Brasil, Uruguay, Paraguay)
Economic
Complementation
Agreement
In force
Cuba
Economic
Complementation
Agreement
In force
Page 10
Chile Free Trade
Agreement In force
Mexico Trade Integration
Agreement In force
United States Free Trade
Agreement In force
Canada Free Trade
Agreement In force
Singapore Free Trade
Agreement In force
China Free Trade
Agreement In force
South Korea Free Trade
Agreement In force
European Free Trade Association (EFTA): Germany, Austria,
Belgium, Bulgaria, Cyprus, Denmark, Slovakia, Slovenia,
Estonia, Spain, Finland, France, Greece, Hungary, Ireland,
Italy, Leetonia, Lithuania, Luxemburg, Malta, Netherlands,
Poland, Portugal, UK, Czech Republic, Romania, Sweden.
Free Trade
Agreement In force
European Union Free Trade
Agreement In force
Thailand Third Protocol In force
Japan
Economic
Partnership
Agreement
In force
Costa Rica Free Trade
Agreement In force
Panama Free Trade
Agreement In force
Guatemala Free Trade
Agreement
Under
Negotiation
El Salvador Free Trade
Agreement
Under
Negotiation
Honduras Free Trade
Agreement
Under
Negotiation Source: FAS Lima office research.
Page 11
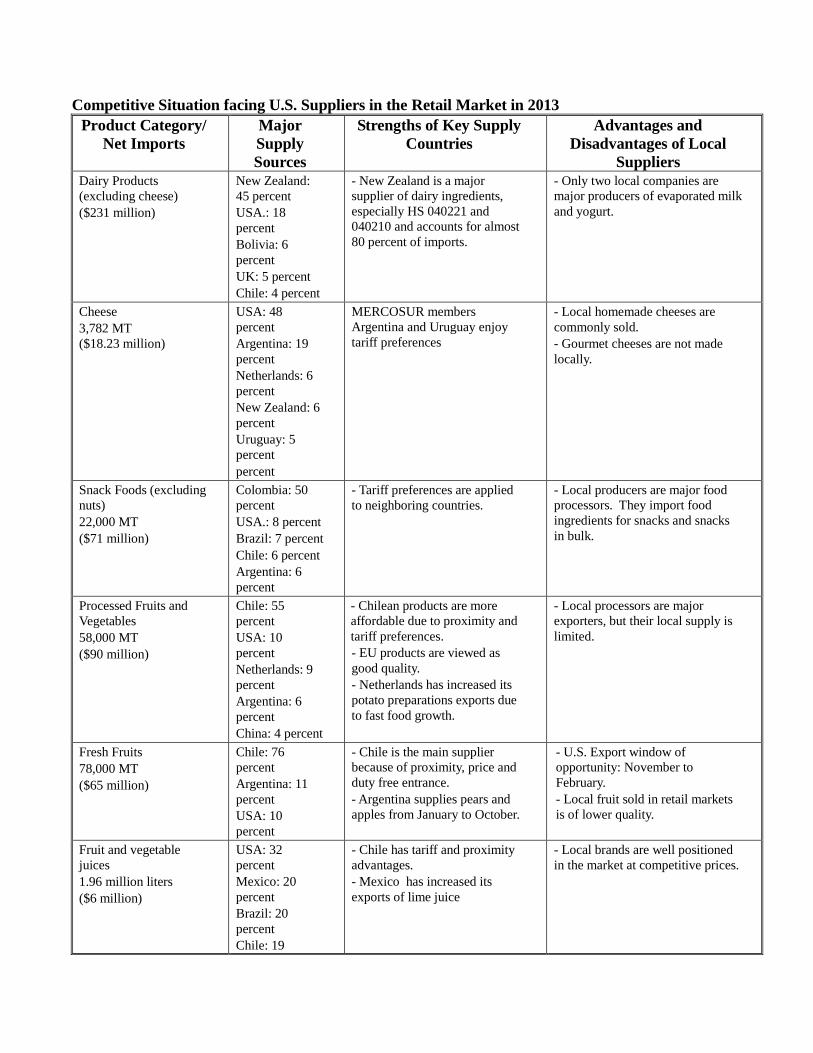
Competitive Situation facing U.S. Suppliers in the Retail Market in 2013
Product Category/
Net Imports
Major
Supply
Sources
Strengths of Key Supply
Countries
Advantages and
Disadvantages of Local
Suppliers
Dairy Products
(excluding cheese)
($231 million)
New Zealand:
45 percent
USA.: 18
percent
Bolivia: 6
percent
UK: 5 percent
Chile: 4 percent
- New Zealand is a major
supplier of dairy ingredients,
especially HS 040221 and
040210 and accounts for almost
80 percent of imports.
- Only two local companies are
major producers of evaporated milk
and yogurt.
Cheese
3,782 MT
($18.23 million)
USA: 48
percent
Argentina: 19
percent
Netherlands: 6
percent
New Zealand: 6
percent
Uruguay: 5
percent
percent
MERCOSUR members
Argentina and Uruguay enjoy
tariff preferences
- Local homemade cheeses are
commonly sold.
- Gourmet cheeses are not made
locally.
Snack Foods (excluding
nuts)
22,000 MT
($71 million)
Colombia: 50
percent
USA.: 8 percent
Brazil: 7 percent
Chile: 6 percent
Argentina: 6
percent
- Tariff preferences are applied
to neighboring countries.
- Local producers are major food
processors. They import food
ingredients for snacks and snacks
in bulk.
Processed Fruits and
Vegetables
58,000 MT
($90 million)
Chile: 55
percent
USA: 10
percent
Netherlands: 9
percent
Argentina: 6
percent
China: 4 percent
- Chilean products are more
affordable due to proximity and
tariff preferences.
- EU products are viewed as
good quality.
- Netherlands has increased its
potato preparations exports due
to fast food growth.
- Local processors are major
exporters, but their local supply is
limited.
Fresh Fruits
78,000 MT
($65 million)
Chile: 76
percent
Argentina: 11
percent
USA: 10
percent
- Chile is the main supplier
because of proximity, price and
duty free entrance.
- Argentina supplies pears and
apples from January to October.
- U.S. Export window of
opportunity: November to
February.
- Local fruit sold in retail markets
is of lower quality.
Fruit and vegetable
juices
1.96 million liters
($6 million)
USA: 32
percent
Mexico: 20
percent
Brazil: 20
percent
Chile: 19
- Chile has tariff and proximity
advantages.
- Mexico has increased its
exports of lime juice
- Local brands are well positioned
in the market at competitive prices.
Page 12
percent
Argentina: 4
percent
Wine and Beer
21 million liters
($43 million)
Argentina:
35percent
Chile: 20
percent
Spain: 10
percent
Italy: 10 percent
Brazil: 10
percent
France: 4
percent
USA: 3 percent
- Proximity and recognized
quality of Chilean and
Argentinean wines.
- Brazil is the major beer
supplier.
- Major local breweries (market
share of 95 percent) are well
positioned, price competitive, and
belong to international companies.
- Local wine is well positioned and
price competitive, but does not
satisfy demand.
Red Meats
(Fresh/Chilled/Frozen)
23,000 MT
($61 million)
USA: 33
percent
Brazil: 29
percent
Chile: 17
percent
Argentina: 11
percent
Bolivia: 4
percent
- Neighboring countries export
lower price cuts.
- Offal accounts for 80 percent
of Brazil’s exports.
- The market for U.S.-origin meats
reopened in October 2006.
- U.S.-origin meat is seen as being
superior in quality.
- Peru imports three times more
offal than meats.
- Local meat production does not
satisfy demand.
Red Meats
(prepared, preserved)
1,480 MT
($7 million)
Bolivia: 43
percent USA 13
percent
Denmark: 11
percent Chile:
10 percent
Italia: 9 percent
Spain: 9 percent
- Bolivia exports in 2013 are up
14 percent compared to.
Bolivian manufacturers have
customized production according
to local demand.
- The pork products industry also
imports prepared meats.
- U.S. product tariffs will decrease
over the next 5 to 7 years.
Poultry Meat
27,000 MT
($38 million)
Brazil: 31
percent
USA 27 percent
Chile: 25
percent
Argentina: 11
percent
Bolivia: 6
percent
- Brazil diversifies its supply
including offal, turkey and
chicken cuts
- Chile is highly competitive in
turkey cuts.
- Imports of U.S. poultry products
reopened in October 2006.
- TRQ for U.S. chicken leg
quarters.
- Local poultry producers are major
suppliers with good distribution
channels.
- Imports are mainly chicken and
turkey parts.
Note: Net imports correspond to the three food sectors: Food Service, Retail and Food Processing.
Source: World Trade Atlas, FAS Lima office research.
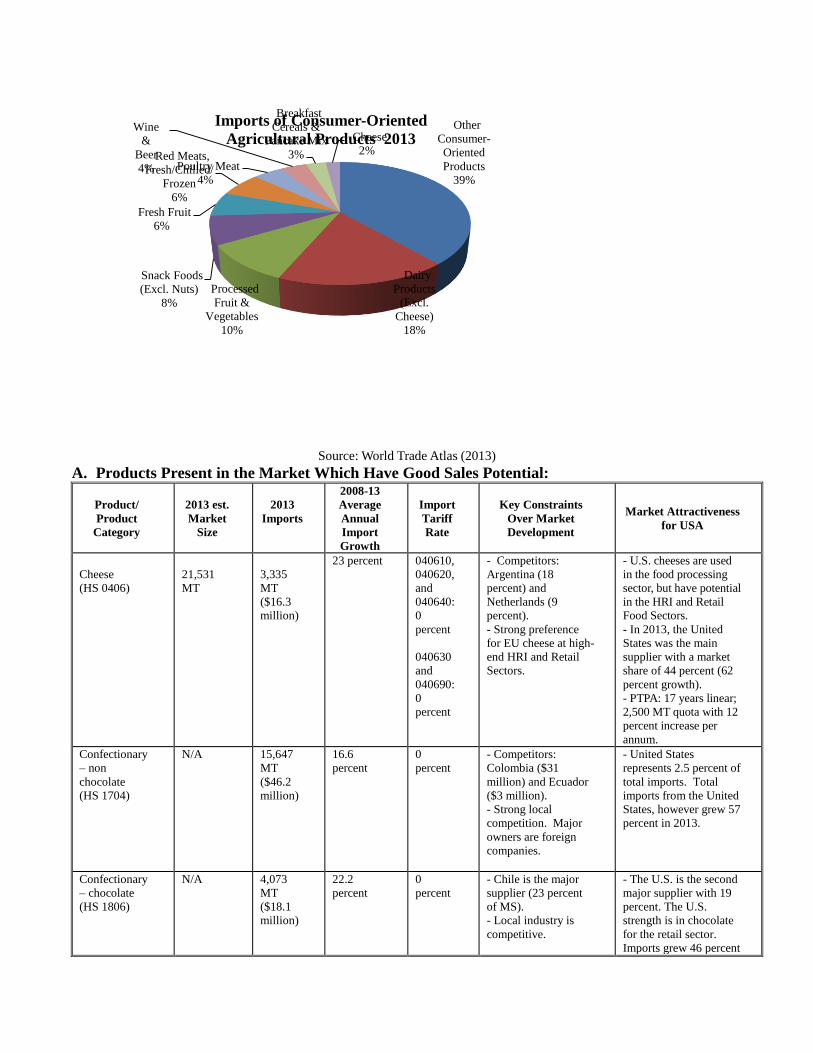
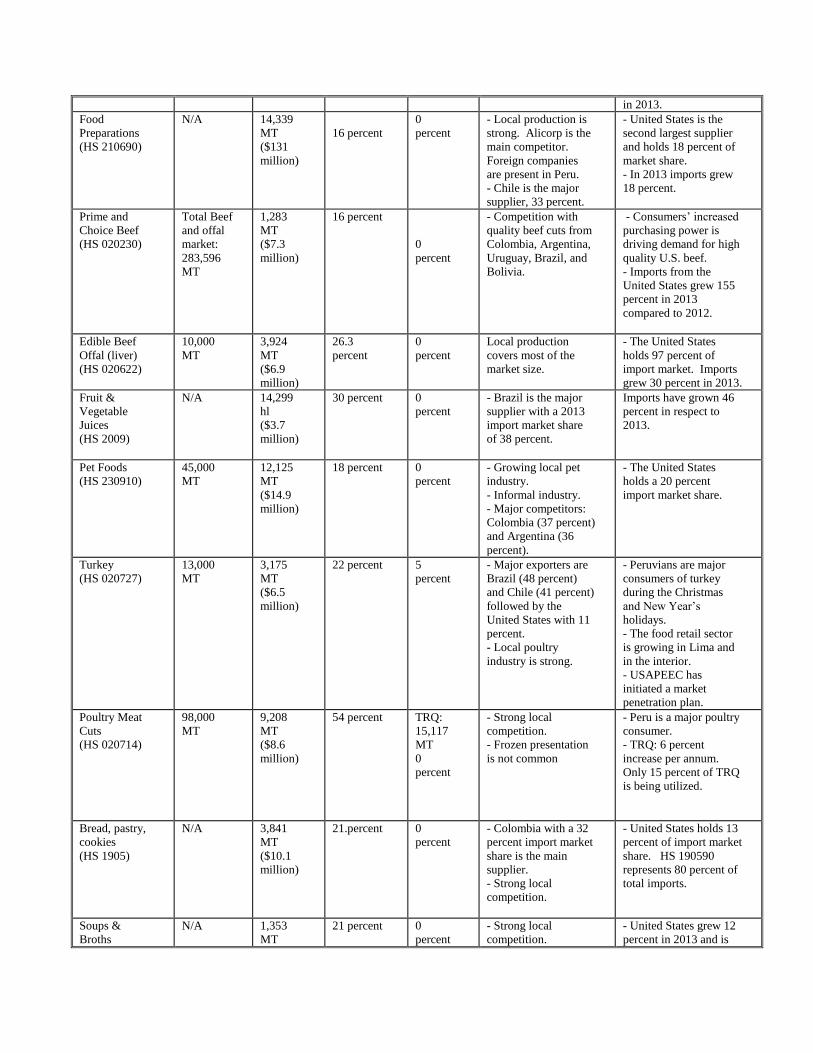
Section IV. Best Product Prospects
Page 13
Other
Consumer-
Oriented
Products
39%
Dairy
Products
(Excl.
Cheese)
18%
Processed
Fruit &
Vegetables
10%
Snack Foods
(Excl. Nuts)
8%
Fresh Fruit
6%
Red Meats,
Fresh/Chilled/
Frozen
6%
Poultry Meat
4%
Wine
&
Beer
4%
Breakfast
Cereals &
Pancake Mix
3%
Cheese
2%
Imports of Consumer-Oriented
Agricultural Products 2013
Source: World Trade Atlas (2013)
A. Products Present in the Market Which Have Good Sales Potential:
Product/
Product
Category
2013 est.
Market
Size
2013
Imports
2008-13
Average
Annual
Import
Growth
Import
Tariff
Rate
Key Constraints
Over Market
Development
Market Attractiveness
for USA
Cheese
(HS 0406)
21,531
MT
3,335
MT
($16.3
million)
23 percent 040610,
040620,
and
040640:
0
percent
040630
and
040690:
0
percent
- Competitors:
Argentina (18
percent) and
Netherlands (9
percent).
- Strong preference
for EU cheese at high-
end HRI and Retail
Sectors.
- U.S. cheeses are used
in the food processing
sector, but have potential
in the HRI and Retail
Food Sectors.
- In 2013, the United
States was the main
supplier with a market
share of 44 percent (62
percent growth).
- PTPA: 17 years linear;
2,500 MT quota with 12
percent increase per
annum.
Confectionary
– non
chocolate
(HS 1704)
N/A 15,647
MT
($46.2
million)
16.6
percent
0
percent
- Competitors:
Colombia ($31
million) and Ecuador
($3 million).
- Strong local
competition. Major
owners are foreign
companies.
- United States
represents 2.5 percent of
total imports. Total
imports from the United
States, however grew 57
percent in 2013.
Confectionary
– chocolate
(HS 1806)
N/A 4,073
MT
($18.1
million)
22.2
percent
0
percent
- Chile is the major
supplier (23 percent
of MS).
- Local industry is
competitive.
- The U.S. is the second
major supplier with 19
percent. The U.S.
strength is in chocolate
for the retail sector.
Imports grew 46 percent
Page 14
in 2013.
Food
Preparations
(HS 210690)
N/A 14,339
MT
($131
million)
16 percent
0
percent
- Local production is
strong. Alicorp is the
main competitor.
Foreign companies
are present in Peru.
- Chile is the major
supplier, 33 percent.
- United States is the
second largest supplier
and holds 18 percent of
market share.
- In 2013 imports grew
18 percent.
Prime and
Choice Beef
(HS 020230)
Total Beef
and offal
market:
283,596
MT
1,283
MT
($7.3
million)
16 percent
0
percent
- Competition with
quality beef cuts from
Colombia, Argentina,
Uruguay, Brazil, and
Bolivia.
- Consumers’ increased
purchasing power is
driving demand for high
quality U.S. beef.
- Imports from the
United States grew 155
percent in 2013
compared to 2012.
Edible Beef
Offal (liver)
(HS 020622)
10,000
MT
3,924
MT
($6.9
million)
26.3
percent
0
percent
Local production
covers most of the
market size.
- The United States
holds 97 percent of
import market. Imports
grew 30 percent in 2013.
Fruit &
Vegetable
Juices
(HS 2009)
N/A 14,299
hl
($3.7
million)
30 percent
0
percent
- Brazil is the major
supplier with a 2013
import market share
of 38 percent.
Imports have grown 46
percent in respect to
2013.
Pet Foods
(HS 230910)
45,000
MT
12,125
MT
($14.9
million)
18 percent 0
percent
- Growing local pet
industry.
- Informal industry.
- Major competitors:
Colombia (37 percent)
and Argentina (36
percent).
- The United States
holds a 20 percent
import market share.
Turkey
(HS 020727)
13,000
MT
3,175
MT
($6.5
million)
22 percent 5
percent
- Major exporters are
Brazil (48 percent)
and Chile (41 percent)
followed by the
United States with 11
percent.
- Local poultry
industry is strong.
- Peruvians are major
consumers of turkey
during the Christmas
and New Year’s
holidays.
- The food retail sector
is growing in Lima and
in the interior.
- USAPEEC has
initiated a market
penetration plan.
Poultry Meat
Cuts
(HS 020714)
98,000
MT
9,208
MT
($8.6
million)
54 percent
TRQ:
15,117
MT
0
percent
- Strong local
competition.
- Frozen presentation
is not common
- Peru is a major poultry
consumer.
- TRQ: 6 percent
increase per annum.
Only 15 percent of TRQ
is being utilized.
Bread, pastry,
cookies
(HS 1905)
N/A 3,841
MT
($10.1
million)
21.percent 0
percent
- Colombia with a 32
percent import market
share is the main
supplier.
- Strong local
competition.
- United States holds 13
percent of import market
share. HS 190590
represents 80 percent of
total imports.
Soups &
Broths
N/A 1,353
MT
21 percent 0
percent
- Strong local
competition.
- United States grew 12
percent in 2013 and is
Page 15
(HS 2104) ($3.2
million)
the major import
supplier in this category
holding 33 percent of
import market share
Sauces
(HS 2103)
N/A 6,597
MT
($12.7
million)
19 percent, 0
percent
- Strong local
competition.
- United States grew 48
percent in 2013 and is
the major import
supplier in this category,
holding 36 percent of
import market share
Nuts and
almonds
(HS 0802)
N/A 479 MT
($2.8
million)
46 percent 0
percent
- Chile is very
competitive in
almonds and walnuts
production. Last year
was major supplier
holding 52 percent of
market share.
- Importers recognize
that U.S. quality of nuts
and almonds is better
than competitors.
Wine
(HS 2204)
41
million
liters
18.8
million
liters
($32
million)
17 percent
0
percent
- Argentina (44
percent), Chile (28
percent), and Spain
(12 percent) are major
exporters.
- Only regular wine
consumers recognize
U.S. wine quality.
- Small niche market
for U.S. wines
- There is a niche market
for quality wines for
which the United States
can be appreciated and
price competitive.
- Peru’s wine
consumption is growing.
Right now is above 1.3
liters.
- Import volume has
grown 120 percent in
respect 2012. However,
value only grew 28.
Low cost wines are
gaining territory.
Note: HS = Harmonized Tariff System. TRQ = Tariff Rate Quota, on a first-come first-serve basis.
Sources: World Trade Atlas, FAS Lima office research, Office of the U.S. Trade Representative (USTR), Ministry of
Agriculture, Gestion and El Comercio (Peru) Newspapers
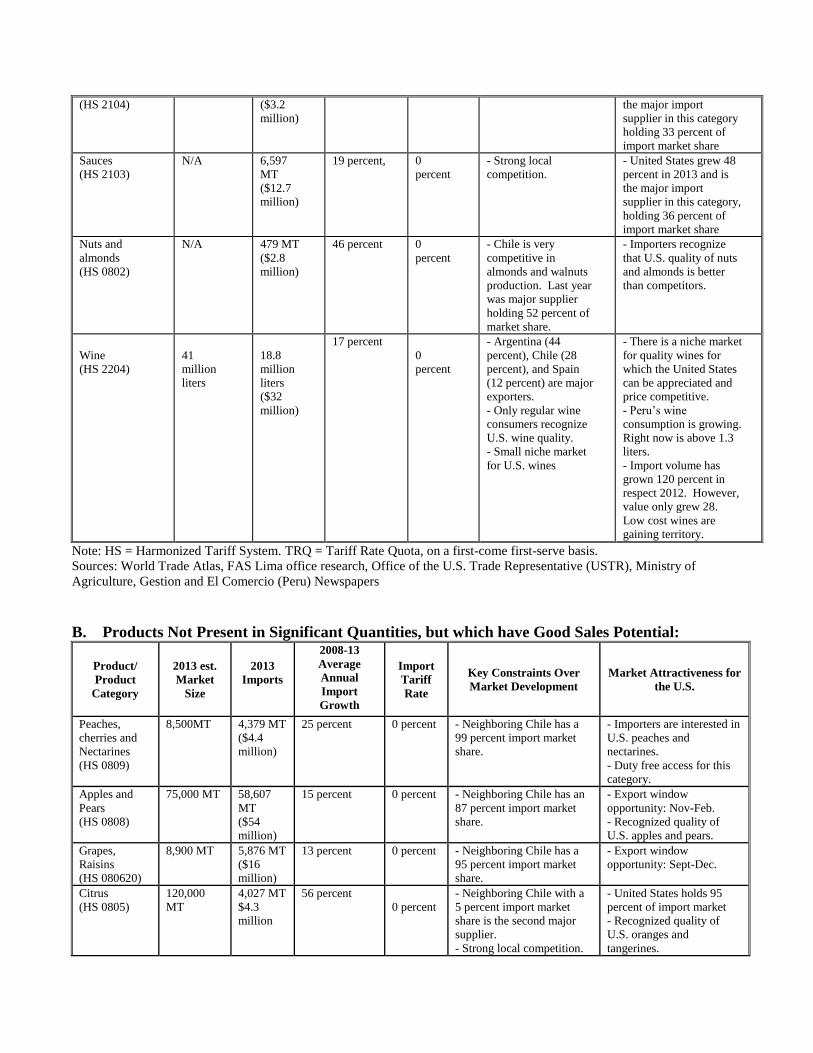
B. Products Not Present in Significant Quantities, but which have Good Sales Potential:
Product/
Product
Category
2013 est.
Market
Size
2013
Imports
2008-13
Average
Annual
Import
Growth
Import
Tariff
Rate
Key Constraints Over
Market Development
Market Attractiveness for
the U.S.
Peaches,
cherries and
Nectarines
(HS 0809)
8,500MT 4,379 MT
($4.4
million)
25 percent 0 percent - Neighboring Chile has a
99 percent import market
share.
- Importers are interested in
U.S. peaches and
nectarines.
- Duty free access for this
category.
Apples and
Pears
(HS 0808)
75,000 MT 58,607
MT
($54
million)
15 percent 0 percent
- Neighboring Chile has an
87 percent import market
share.
- Export window
opportunity: Nov-Feb.
- Recognized quality of
U.S. apples and pears.
Grapes,
Raisins
(HS 080620)
8,900 MT 5,876 MT
($16
million)
13 percent 0 percent
- Neighboring Chile has a
95 percent import market
share.
- Export window
opportunity: Sept-Dec.
Citrus
(HS 0805)
120,000
MT
4,027 MT
$4.3
million
56 percent
0 percent
- Neighboring Chile with a
5 percent import market
share is the second major
supplier.
- Strong local competition.
- United States holds 95
percent of import market
- Recognized quality of
U.S. oranges and
tangerines.
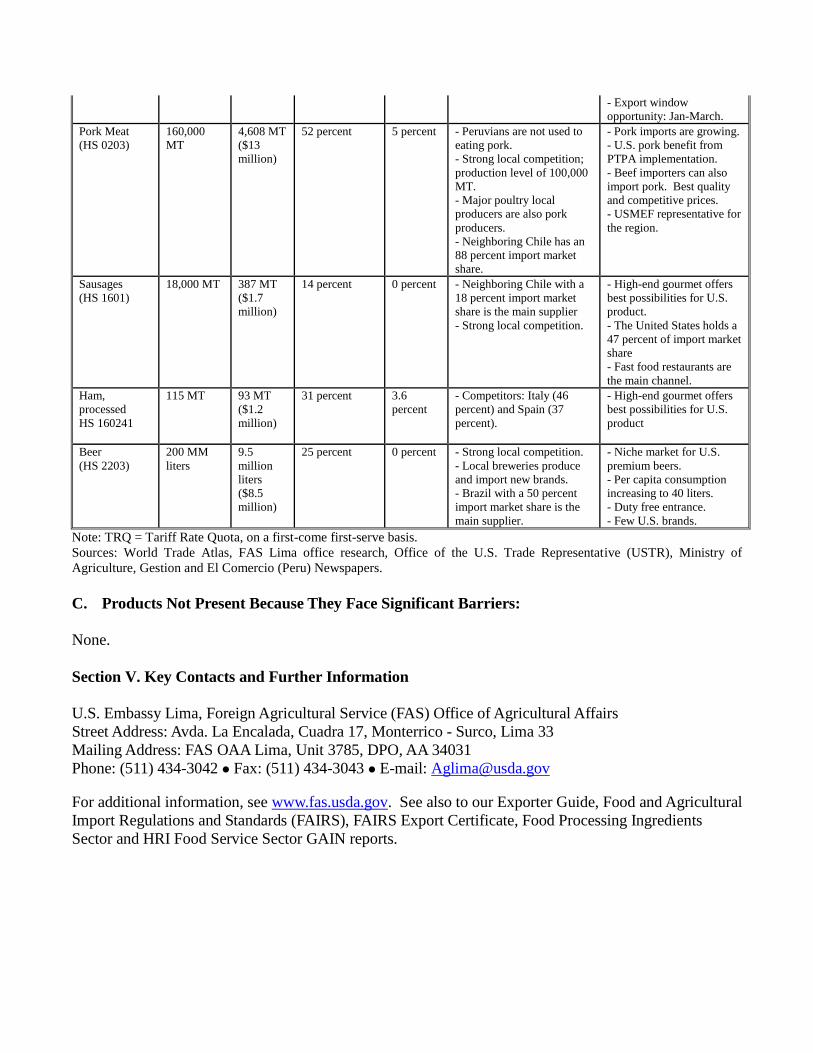
Page 16
- Export window
opportunity: Jan-March.
Pork Meat
(HS 0203)
160,000
MT
4,608 MT
($13
million)
52 percent 5 percent - Peruvians are not used to
eating pork.
- Strong local competition;
production level of 100,000
MT.
- Major poultry local
producers are also pork
producers.
- Neighboring Chile has an
88 percent import market
share.
- Pork imports are growing.
- U.S. pork benefit from
PTPA implementation.
- Beef importers can also
import pork. Best quality
and competitive prices.
- USMEF representative for
the region.
Sausages
(HS 1601)
18,000 MT 387 MT
($1.7
million)
14 percent 0 percent - Neighboring Chile with a
18 percent import market
share is the main supplier
- Strong local competition.
- High-end gourmet offers
best possibilities for U.S.
product.
- The United States holds a
47 percent of import market
share
- Fast food restaurants are
the main channel.
Ham,
processed
HS 160241
115 MT 93 MT
($1.2
million)
31 percent 3.6
percent
- Competitors: Italy (46
percent) and Spain (37
percent).
- High-end gourmet offers
best possibilities for U.S.
product
Beer
(HS 2203)
200 MM
liters
9.5
million
liters
($8.5
million)
25 percent 0 percent - Strong local competition.
- Local breweries produce
and import new brands.
- Brazil with a 50 percent
import market share is the
main supplier.
- Niche market for U.S.
premium beers.
- Per capita consumption
increasing to 40 liters.
- Duty free entrance.
- Few U.S. brands.
Note: TRQ = Tariff Rate Quota, on a first-come first-serve basis.
Sources: World Trade Atlas, FAS Lima office research, Office of the U.S. Trade Representative (USTR), Ministry of
Agriculture, Gestion and El Comercio (Peru) Newspapers.
C. Products Not Present Because They Face Significant Barriers:
None.
Section V. Key Contacts and Further Information
U.S. Embassy Lima, Foreign Agricultural Service (FAS) Office of Agricultural Affairs
Street Address: Avda. La Encalada, Cuadra 17, Monterrico - Surco, Lima 33
Mailing Address: FAS OAA Lima, Unit 3785, DPO, AA 34031
Phone: (511) 434-3042 Fax: (511) 434-3043 E-mail: [email protected]
For additional information, see www.fas.usda.gov. See also to our Exporter Guide, Food and Agricultural
Import Regulations and Standards (FAIRS), FAIRS Export Certificate, Food Processing Ingredients
Sector and HRI Food Service Sector GAIN reports.