Fact Sheet FS-107-96 National Water-Quality Assessment u G U.S. Department of the Interior U.S. Geological Survey Pesticides in Streams of the Western Lake Michigan Drainages, Wisconsin and Michigan, 1993-95 by Daniel J. Sullivan and Kevin D. Richards SUMMARY During 1993-95, water samples were collected at nine sites on eight streams in the Western Lake Michigan Drainages to attempt to determine pesticide concentrations. The sampling effort was part of the U.S. Geological Survey's National Water- Quality Assessment (NAWQA) Program. Pesticides analyzed for were 58 herbicides and 30 insecticides. Pesticides are used extensively in the study area; application of herbicides to corn and soybeans accounts for most of the use. Herbicides were detected more frequently and generally at higher concentrations than insecticides. The herbicide atrazine is applied to more acreage in Wisconsin than all other pesticides and was detected in 142 of 143 samples. The herbicides si- mazine, metolachlor, cyanazine, prometon, and alachlor were detected in more than half of the samples. The presence of these compounds in the sampled streams, is related to agricultural use. Two streams in forested basins in the northern part of the study area were sampled and found to contain low concentra- tions of atrazine. Atmospheric deposition is the likely source; atrazine has been detected in rain fall in northeastern Wisconsin. Herbicide concentrations in agricultural basins were highest in samples collected during storm runoff following application. Concentrations decreased over the growing season as herbi- cides broke down and increased ground cover reduced runoff. The U.S. Environmental Protection Agency (USEPA) drink- ing-water standard for atrazine was exceeded in eight samples, and the standard for alachlor was exceeded in two samples. All exceedances occurred during brief periods of high streamflow in June and July at two streams that drain primarily agricultural basins. Herbicide data for the Western Lake Drainages and other NAWQA study units indicate that concentrations in streams are as much as two orders of magnitude higher in areas where agricultural land contains a high percentage of row crops especially corn and soybeans than in areas where grazing, hay production, and other less herbicide-intensive crops are raised. 88° 89° 87° 46° 44' EXPLANATION l Sampling site basin g Sampling site and site number Figure 1 . Location of sampling sites for pesticides in streams of the Western Lake Michigan Drainages (see table 1 for site information). The Western Lake Michigan Drainages study unit of the National Water-Quality Assessment (NAWQA) Program encompasses a 51,540 square-kilometer area in eastern Wisconsin and the Upper Peninsula of Michigan that drains to Lake Michigan and Green Bay (fig. 1). Dairy operations and grain and vegetable crop growing are the major agricul- tural activities in the study unit. Crop growing and pasturing involve 37 percent of the total land area. The most intensive crop growing is in the southeastern part of the study unit. Table 1 . Selected information for pesticide-sampling sites on streams in the Western Lake Michigan Drainages [USGS, U.S. Geological Survey; km2 , square kilometers; N, number of samples collected; ag, agricultural; fo, forest] Map reference number (seefigurel) 1 2 3 4 5 6 7 8 9 Station name Duck Creek near Oneida, Wis. Duck Creek near Howard, Wis. North Branch Milwaukee River near Random Lake, Wis. Milwaukee River at Milwaukee, Wis. East River at County Highway ZZ near Greenleaf, Wis. Pensaukee River near Krakow, Wis. Tomorrow River near Nelsonville, Wis. Peshekee River near Martins Landing, Mich. Popple River near Fence, Wis. USGS station number 04072050 04072150 040863075 04087000 04085108 04071795 04080798 04062085 04063700 Drainage area (km2) 247 281 133 1,800 117 92.7 114 127 360 Percent dominant land use/land cover in basin 89 ag 88 ag 88 ag 75 ag 92 ag 86 ag 58 ag 88 fo 61 fo N 44 10 37 34 8 4 4 1 1 Years data collected 1993-95 1995 1993-94 1993-94 1994 1994 1994 1993 1993
Transcript
Fact Sheet FS-107-96
National Water-Quality Assessment uG
U.S. Department of the Interior U.S. Geological Survey
Pesticides in Streams of the Western Lake Michigan Drainages, Wisconsin and Michigan, 1993-95by Daniel J. Sullivan and Kevin D. Richards
SUMMARYDuring 1993-95, water samples were collected at nine sites
on eight streams in the Western Lake Michigan Drainages to attempt to determine pesticide concentrations. The sampling effort was part of the U.S. Geological Survey's National Water- Quality Assessment (NAWQA) Program. Pesticides analyzed for were 58 herbicides and 30 insecticides. Pesticides are used extensively in the study area; application of herbicides to corn and soybeans accounts for most of the use.
Herbicides were detected more frequently and generally at higher concentrations than insecticides. The herbicide atrazine is applied to more acreage in Wisconsin than all other pesticides and was detected in 142 of 143 samples. The herbicides si- mazine, metolachlor, cyanazine, prometon, and alachlor were detected in more than half of the samples. The presence of these compounds in the sampled streams, is related to agricultural use.
Two streams in forested basins in the northern part of the study area were sampled and found to contain low concentra tions of atrazine. Atmospheric deposition is the likely source; atrazine has been detected in rain fall in northeastern Wisconsin.
Herbicide concentrations in agricultural basins were highest in samples collected during storm runoff following application. Concentrations decreased over the growing season as herbi cides broke down and increased ground cover reduced runoff.
The U.S. Environmental Protection Agency (USEPA) drink ing-water standard for atrazine was exceeded in eight samples, and the standard for alachlor was exceeded in two samples. All exceedances occurred during brief periods of high streamflow in June and July at two streams that drain primarily agricultural basins.
Herbicide data for the Western Lake Drainages and other NAWQA study units indicate that concentrations in streams are as much as two orders of magnitude higher in areas where agricultural land contains a high percentage of row crops especially corn and soybeans than in areas where grazing, hay production, and other less herbicide-intensive crops are raised.
88°
89° 87°
46°
44'
EXPLANATION
l Sampling site basin
g Sampling site and site number
Figure 1 . Location of sampling sites for pesticides in streams of the Western Lake Michigan Drainages (see table 1 for site information).
The Western Lake Michigan Drainages study unit of the National Water-Quality Assessment (NAWQA) Program encompasses a 51,540 square-kilometer area in eastern Wisconsin and the Upper Peninsula of Michigan that drains to Lake Michigan and Green Bay (fig. 1). Dairy operations and grain and vegetable crop growing are the major agricul tural activities in the study unit. Crop growing and pasturing involve 37 percent of the total land area. The most intensive crop growing is in the southeastern part of the study unit.
Table 1 . Selected information for pesticide-sampling sites on streams in the Western Lake Michigan Drainages [USGS, U.S. Geological Survey; km2 , square kilometers; N, number of samples collected; ag, agricultural; fo, forest]
Map reference number
(seefigurel)
1
2
3
4
56
7
8
9
Station name
Duck Creek near Oneida, Wis.Duck Creek near Howard, Wis.North Branch Milwaukee River near Random Lake, Wis.Milwaukee River at Milwaukee, Wis.East River at County Highway ZZ near Greenleaf, Wis.Pensaukee River near Krakow, Wis.Tomorrow River near Nelsonville, Wis.Peshekee River near Martins Landing, Mich.Popple River near Fence, Wis.
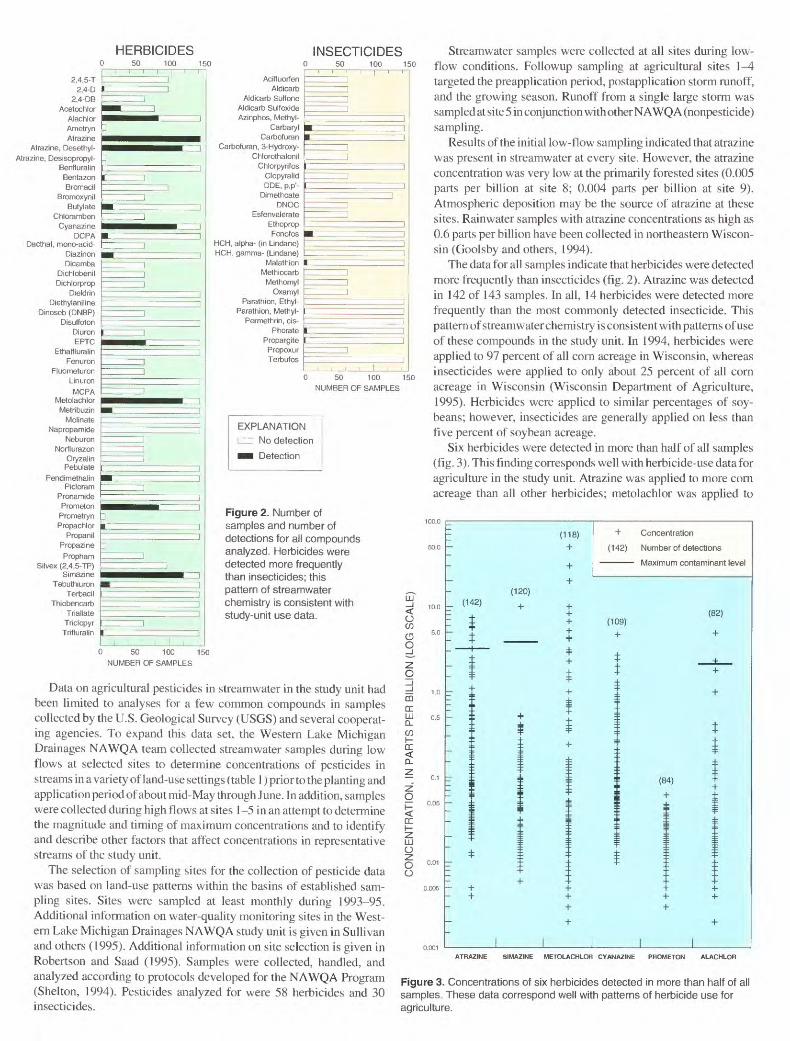
Figure 2. Number of samples and number of detections for all compounds analyzed. Herbicides were detected more frequently than insecticides; this pattern of streamwater chemistry is consistent with ^ study-unit use data. £
o c
0 50 100 150 NUMBER OF SAMPLES
Data on agricultural pesticides in streamwater in the study unit had been limited to analyses for a few common compounds in samples collected by the U.S. Geological Survey (USGS) and several cooperat ing agencies. To expand this data set, the Western Lake Michigan Drainages NAWQA team collected streamwater samples during low flows at selected sites to determine concentrations of pesticides in streams in a variety of land-use settings (table 1) prior to the planting and application period of about mid-May through June. In addition, samples were collected during high flows at sites 1-5 in an attempt to determine the magnitude and timing of maximum concentrations and to identify and describe other factors that affect concentrations in representative streams of the study unit.
The selection of sampling sites for the collection of pesticide data was based on land-use patterns within the basins of established sam pling sites. Sites were sampled at least monthly during 1993-95. Additional information on water-quality monitoring sites in the West ern Lake Michigan Drainages NAWQA study unit is given in Sullivan and others (1995). Additional information on site selection is given in Robertson and Saad (1995). Samples were collected, handled, and analyzed according to protocols developed for the NAWQA Program (Shelton, 1994). Pesticides analyzed for were 58 herbicides and 30 insecticides.
LJJ O
o o
Streamwater samples were collected at all sites during low- flow conditions. Followup sampling at agricultural sites 1-4 targeted the preapplication period, postapplication storm runoff, and the growing season. Runoff from a single large storm was sampled at site 5 in conjunction with other NAWQA (nonpesticide) sampling.
Results of the initial low-flow sampling indicated that atrazine was present in streamwater at every site. However, the atrazine concentration was very low at the primarily forested sites (0.005 parts per billion at site 8; 0.004 parts per billion at site 9). Atmospheric deposition may be the source of atrazine at these sites. Rainwater samples with atrazine concentrations as high as 0.6 parts per billion have been collected in northeastern Wiscon sin (Goolsby and others, 1994).
The data for all samples indicate that herbicides were detected more frequently than insecticides (fig. 2). Atrazine was detected in 142 of 143 samples. In all, 14 herbicides were detected more frequently than the most commonly detected insecticide. This pattern of streamwater chemistry is consistent with patterns of use of these compounds in the study unit. In 1994, herbicides were applied to 97 percent of all corn acreage in Wisconsin, whereas insecticides were applied to only about 25 percent of all corn acreage in Wisconsin (Wisconsin Department of Agriculture, 1995). Herbicides were applied to similar percentages of soy beans; however, insecticides are generally applied on less than five percent of soybean acreage.
Six herbicides were detected in more than half of all samples (fig. 3). This finding corresponds well with herbicide-use data for agriculture in the study unit. Atrazine was applied to more corn acreage than all other herbicides; metolachlor was applied to
Figure 3. Concentrations of six herbicides detected in more than half of all samples These data correspond well with patterns of herbicide use for agriculture.
Duck Creek near Oneida, Wis. (site 1) Duck Creek near Oneida, Wis. (site 1)
approximate period of herbicide application ~
0.01
0.005
Mar Apr May June July Aug Sept
1993
North Branch Milwaukee River near Random Lake, Wis. (site 3)
Aug Sept
3,000
§ 1.000
»*
approximate period of herbicide application =
Mar Apr May July Aug Sept
North Branch Milwaukee River near Random Lake, Wis. (site 3)
^approximate period of herbicide application
- 0.05 Q
0.01 Oz
0.005 R
Sept
EXPLANATION
Discharge
Atrazine
Metolachlor
Cyanazine
o Open symbolindicates compound not detected
Figure 4. Discharge hydrographs and concentrations of herbicides at two agricultural sites during the 1993 and 1994 growing seasons. The data indicate patterns of increased concentra tions following herbicide application, especially during periods of increased streamflow.
fewer acres but at about double the rate per acre (Wisconsin Department of Agriculture, 1995).
Simazine use for agriculture was negligible during the sampling period, and most detections of simazine indicated small concentrations. Simazine is relatively long-lived in the environment; thus, the small concentrations found during the sampling may be residuals from applications in previous years. Nonagricultural use of simazine for genera] weed control also may be a source. The highest concentration of simazine (10 parts per billion) was in a sample collected at site 2 and may have resulted from nonagricultural use.
Comparisons of herbicide concentrations to flow data at sites 1 and 3 (fig. 4) illustrates the relation of streamflow and time of pesticide application to concentrations of these compounds in streamwater. Low concentrations were evident in early spring (March through mid-May) prior to the planting/application period. Periods of increased streamflow after application in May and early June correspond to increased pesti cide concentrations in streams. The progressively lower concentrations in streamwater over the duration of the growing season reflect herbicide breakdown and increased ground cover, which reduces runoff from fields.
The effects that herbicides in streams may have on humans and aquatic biota are difficult to quantify. Drinking-water standards devel oped for some commonly used compounds, such as atrazine and alachlor, can be useful as a reference point (even though the streams of interest may not be drinking-water sources). Atrazine and alachlor concentrations briefly exceeded the maximum contaminant levels (MCL's) established by the U.S. Environmental Protection Agency, levels based on continuous lifetime exposure (Nowell and Resek, 1994). Atrazine concentrations exceeded the MCL of 3 parts per billion in four samples each from sites 1 and 5. Alachlor concentrations exceeded the MCL of 2 parts per billion in two samples from site 1. All
50.0
10.0
5.0
1.0
0.5
0.1
0.05
0.01
0.005
0.001
'-
_
-
I
'-
>
A i.
1
-
D
-
4
-j- Maximum
A Median
-L Minimum
(Minimums not shown are below detection limit)
9 Atrazine
A Metolachlor
B Cyanazine
>
A
1 1
k
< \
A
1
-
_
-
-
II \
L
-
SITE1 SITES SITE 4
Figure 5. Concentrations of atrazine, metolachlor, and cyanzine at three primary stream sampling sites. Higher concentrations at site 1 may be related to texture of surficial deposits, herbicide application rates, and drainage basin size.
100.0
50.0
10.0
5.0
0.1
0.05
0.01
0.005
~ ~~ Maximum
Median
1 Minimum
(Extremes not shown are below detection limit)
Atrazine
A Metolachlor
Cyanazine
O Open symbol indicates median is below detection limit
O A D
B
Figure 6. Concentrations of herbicides in selected streams in NAWQA study units in the Midwest. Concentrations were highest in streams in corn and soybean-growing areas, and lower in areas where grazing and small grains predominate.[A = Duck Creek near Oneida, Wis.; B = Clifty Creek near Hartsville, Ind.; C = Prairie Creek near Ovina, Nebr.; D = Dousinbury Creek near Wall Street, Mo.; E = Snake River near Alvarado, Minn.]
samples in which the MCL was exceeded were collected during high flows in June and early July. The effect of short-term exposure to high concentrations on humans and stream biota is uncertain.
The observed concentrations of commonly detected herbicides were significantly higher (at the 95-percent confidence level) at Duck Creek (sites I and 2) than at North Branch Milwaukee River (site 3), by an order of magnitude at some times (fig. 5). Numerous factors may explain the higher concentrations in water from Duck Creek. Both basins have similar percentages of acreage in corn, but surficial deposits differ: soils in the Duck Creek Basin are underlain by poorly permeable clays, whereas soils in the North Branch Milwaukee River Basin are underlain by highly permeable sands. Thus, more infiltration of precipi tation and thus less runoff would be expected in the North Branch Milwaukee River Basin. In addition, the state of Wisconsin imposed atrazine-application restrictions of 0.75 pound per acre on all coarse soils in the North Branch Milwaukee River Basin during 1993 and 1994. In contrast, farmers were allowed to apply as much as 1.5 pounds of atrazine per acre in the Duck Creek Basin during this period. Finally, although the percent of acreage in corn grown in each basin is approxi mately equal, the ratio of grain corn to sweet corn in the Duck Creek Basin was about 20 to 1, whereas the ratio in the North Branch Milwaukee River Basin was about 5 to 1. Grain corn typically receives heavier herbicide applications than sweet corn does, another factor that may explain higher concentrations in Duck Creek.
The drainage area of Milwaukee River at Milwaukee (site 4) is a mixture of land use/land cover (primarily agriculture but also urban) and surficial deposits (predominantly sand with clay in the lower part of the basin), and is about 7 times the drainage areas of the Duck Creek sites. Concentrations at Milwaukee were also significantly lower than at the Duck Creek sites (at the 95-percent confidence level). In addition to the factors mentioned for the North Branch Milwaukee River, previous studies have shown that pesticide concentrations in areas of similar land use are generally lowest at sites that drain the largest areas (Baker, 1988).
Concentrations of commonly detected herbicides in the Western Lake Michigan Drainages study unit were compared to concentrations in streams in other NAWQA study units in the Midwest that were sampled during the same time period (fig. 6). Concentrations were
highest at sites in Indiana. Wisconsin, and Nebraska where corn and soybean growing is a major agricultural activity. Concentrations were lower in streams in northwestern Minnesota and the Ozark Plateau area of Missouri, where small grains and pastureland, respectively, are more prevalent than row cropping of corn.
NA TIONAL WA TER-QUALITY ASSESSMENT PROGRAM
The Western Lake Michigan Drainages is one of 20 study units started in 1991 as part of the USGS National Water-Quality Assessment Program. The purpose of the NAWQA Program is to assess the quality of a large, representative part of the nation's waters (Hirsch and others, 1988). In all, 60 study units are planned; the first 20 study units are in areas where agriculture is a major land- use activity.
REFERENCES CITEDBaker, D.B., 1988, Sediment, nutrient, and pesticide transport in selected
lower Great Lakes tributaries: U.S. Environmental Protection Agency, EPA-905/4-88-001, 225 p.
Goolsby, D.A., Thurman, E.M., Pommes, M.L., andBattaglin, W.A., 1994, Temporal and geographic distribution of herbicides in precipitation in the midwest and northeast United States, 1990-91, in Weigmann, D.L., ed., New directions in pesticide research, development, management, and policy: Proceedings of the Fourth National Pesticide Conference, Richmond. Virginia. Nov. 1-3. 1993.
Hirsch, R.M., Alley, W.M., and Wilber, W.G., 1988, Concepts for a National Water-Quality Assessment Program: U.S. Geological Survey Circular 1021,42 p.
Nowell, L.H., and Resek, E.A.. 1994, Summary of national standards and guidelines for pesticides in water, bed sediment, and aquatic organisms and their application to water-quality assessments: U.S. Geological Survey Open-File Report 94-44, 115 p.
Robertson, D.M., and Saad, D.A., 1995, Environmental factors used to subdivide the Western Lake Michigan Drainages into relatively homgeneous units for water-quality site selection: U.S. Geological Survey Fact Sheet FS-220-95, 4 p.
Shelton, L.R., 1994, Field guide for collecting and processing stream-water samples for the National Water-Quality Assessment Program: U.S. Geological Survey Open-File Report 94-455, 42 p.
Sullivan, D.J., Peterson, E.M., and Richards, K.D., 1995, Environmental setting of fixed sites in the Western Lake Michigan Drainages, Michi gan and Wisconsin: U.S. Geological Survey Water-Resources Investi gations Report 95-4211-A, 30 p.
Wisconsin Department of Agriculture, 1995, Agricultural chemical use in Wisconsin, 1994: Wisconsin Agricultural Statistics Service WA-0018, 4 p.
Layout and illustrations: Michelle Greenwood Banner graphic: Karen Lonsdorf
For more information, please contact:
NAWQA Chief
U.S. Geological Survey
6417 Normandy Lane
Madison, Wl 53719
(608)276-3810 __
U.S. Department of the InteriorU.S. Geological SurveyFact Sheet FS-107-96