Peter Bajcsy, Ph.D. Research Scientist Adjunct Assistant Professor, CS Department, UIUC Automated Learning Group National Center for Supercomputing Applications University of Illinois [email protected]Supercomputing 2002 Introduction to Data Mining
Transcript
Peter Bajcsy, Ph.D.Research ScientistAdjunct Assistant Professor, CS Department, UIUC
Automated Learning GroupNational Center for Supercomputing ApplicationsUniversity of Illinois
• Data Mining Methods• Association Rules• Decision Trees• Information Visualization
• Summary
alg | Automated Learning Group
Acknowledgement
• Contributions:• Michael Welge, Loretta Auvil, Lisa Gatzke, Automated Learning
Group, National Center for Supercomputing Applications (NCSA), University of Illinois at Urbana-Champaign
• Jiawei Han, Computer Science, University of Illinois at Urbana-Champaign
alg | Automated Learning Group
Literature
Data Mining – Concepts and Techniques by J. Han & M. Kamber, Morgan Kaufmann Publishers, 2001
Pattern Classification by R. Duda, P. Hart and D. Stork, 2nd edition, John Wiley & Sons, 2001
alg | Automated Learning Group
Introduction to Knowledge Discovery in Databases and Data Mining
alg | Automated Learning Group
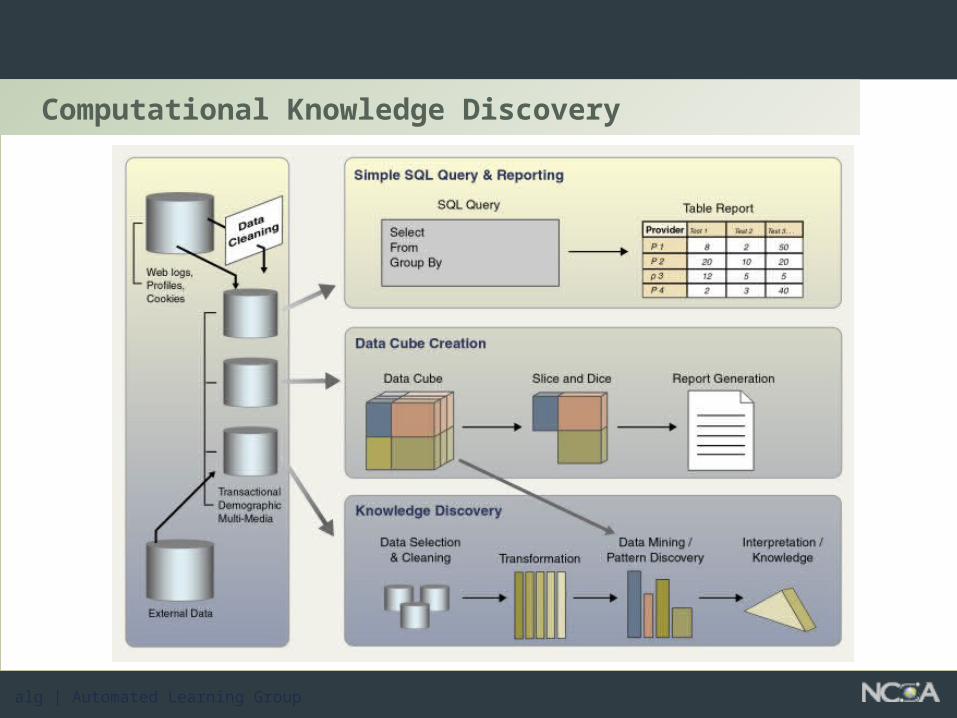
Computational Knowledge Discovery
alg | Automated Learning Group
Terminology
• Data Mining
A step in the knowledge discovery process consisting of particular algorithms (methods) that under some acceptable objective, produces a particular enumeration of patterns (models) over the data.
• Knowledge Discovery Process
The process of using data mining methods (algorithms) to extract (identify) what is deemed knowledge according to the specifications of measures and thresholds, using a database along with any necessary preprocessing or transformations.
alg | Automated Learning Group
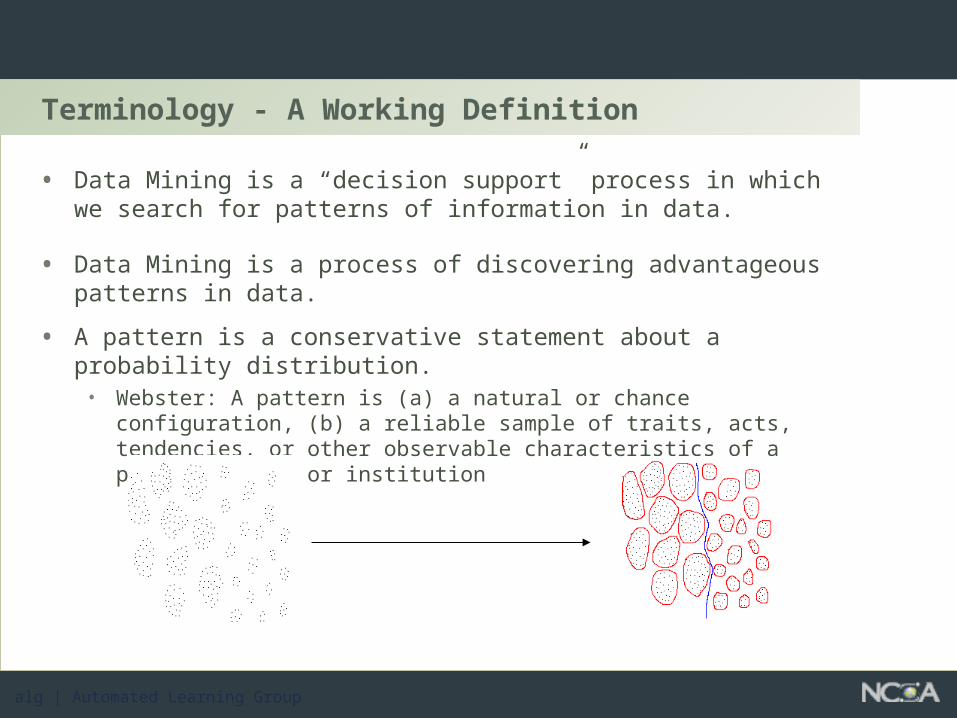
Terminology - A Working Definition
• Data Mining is a “decision support” process in which we search for patterns of information in data.
• Data Mining is a process of discovering advantageous patterns in data.
• A pattern is a conservative statement about a probability distribution.
• Webster: A pattern is (a) a natural or chance configuration, (b) a reliable sample of traits, acts, tendencies, or other observable characteristics of a person, group, or institution
alg | Automated Learning Group
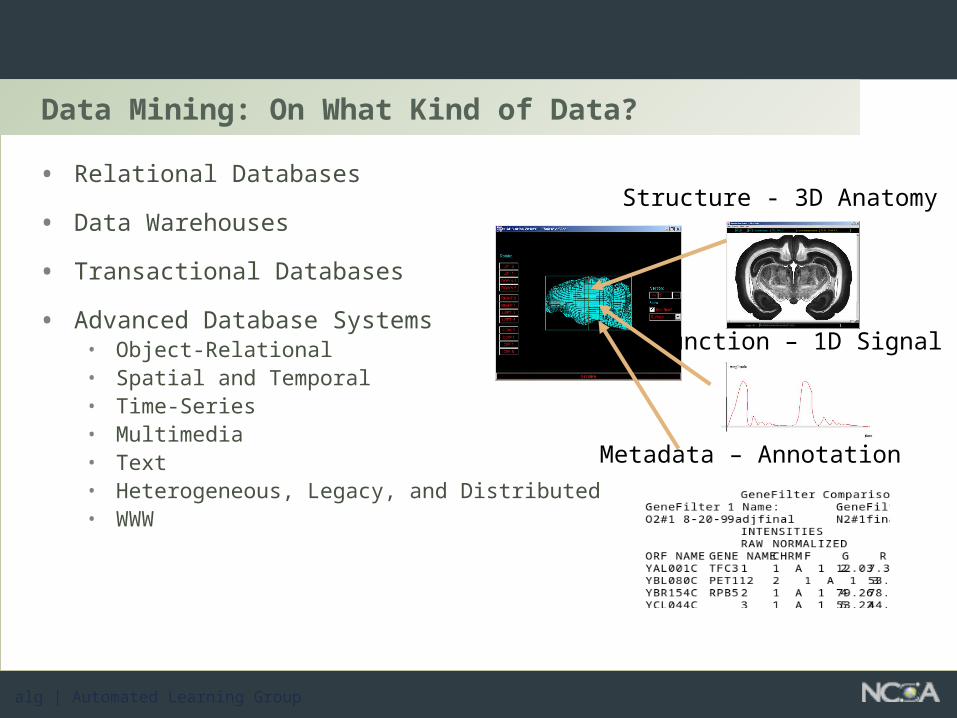
Data Mining: On What Kind of Data?
• Relational Databases
• Data Warehouses
• Transactional Databases
• Advanced Database Systems• Object-Relational• Spatial and Temporal• Time-Series• Multimedia• Text• Heterogeneous, Legacy, and Distributed• WWW
Structure - 3D Anatomy
Function – 1D Signal
Metadata – Annotation
alg | Automated Learning Group
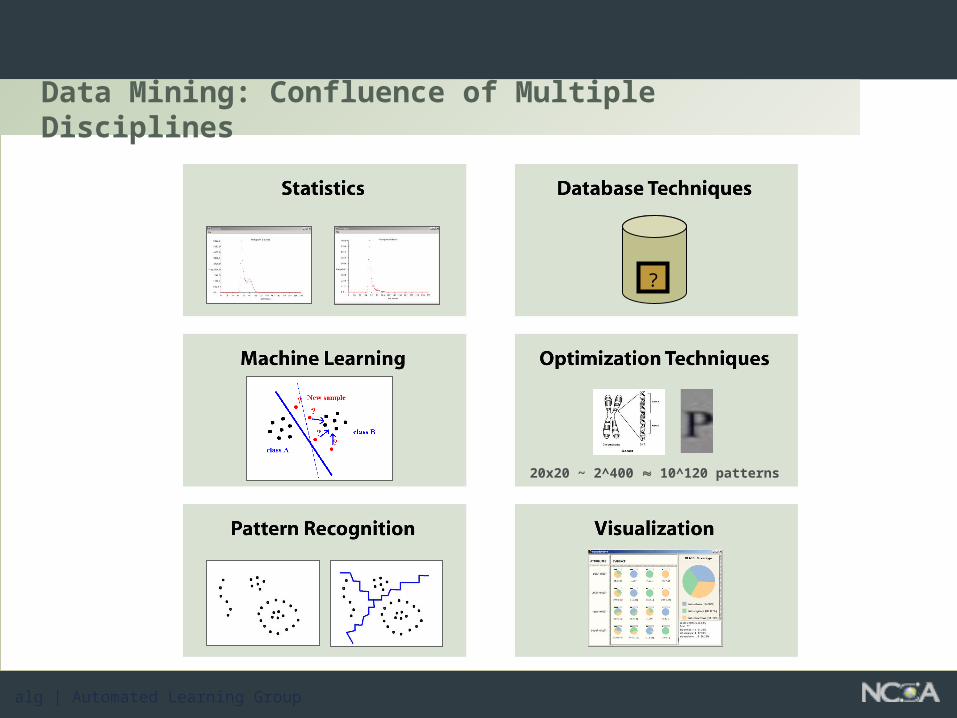
Data Mining: Confluence of Multiple Disciplines
?
20x20 ~ 2^400 10^120 patterns
alg | Automated Learning Group
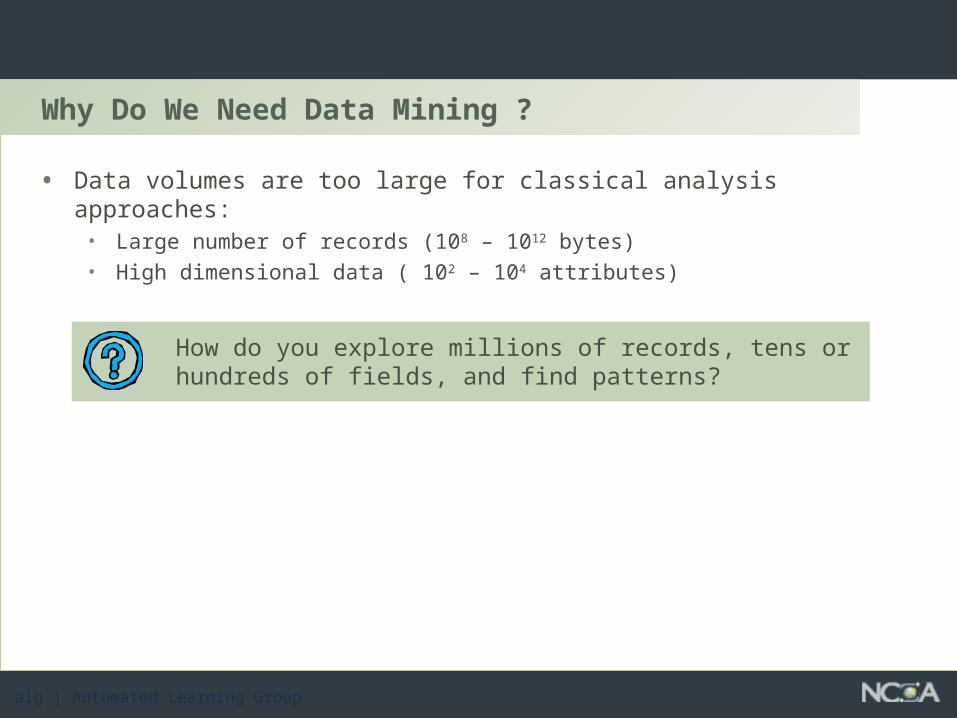
Why Do We Need Data Mining ?
• Data volumes are too large for classical analysis approaches:• Large number of records (108 – 1012 bytes)• High dimensional data ( 102 – 104 attributes)
How do you explore millions of records, tens or hundreds of fields, and find patterns?
alg | Automated Learning Group
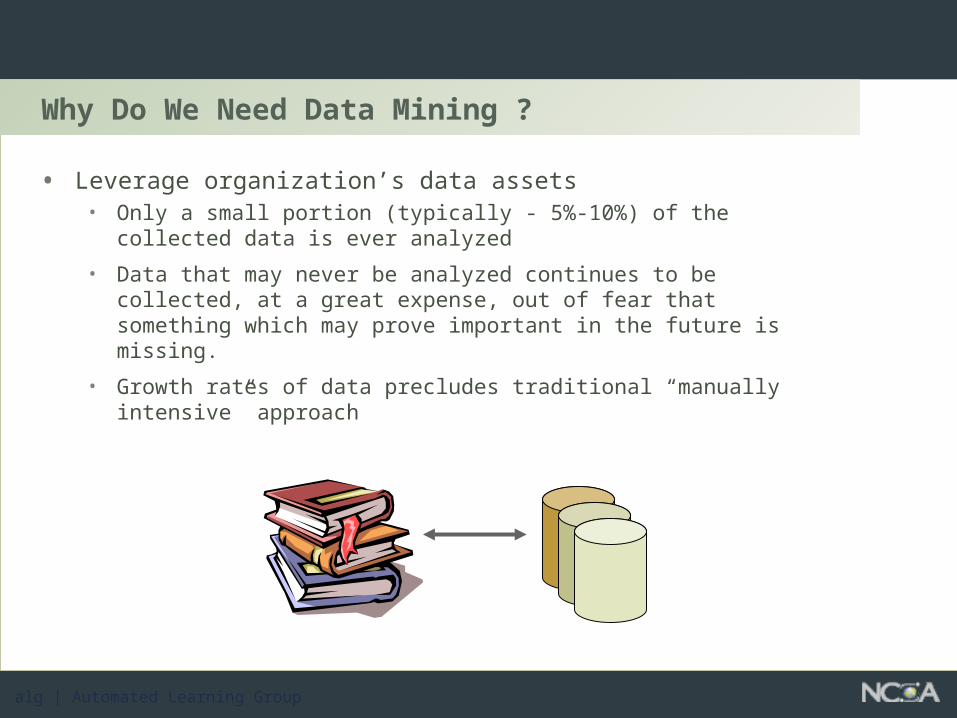
Why Do We Need Data Mining ?
• Leverage organization’s data assets• Only a small portion (typically - 5%-10%) of the collected data is
ever analyzed
• Data that may never be analyzed continues to be collected, at a great expense, out of fear that something which may prove important in the future is missing.
• Growth rates of data precludes traditional “manually intensive” approach
alg | Automated Learning Group
Why Do We Need Data Mining?
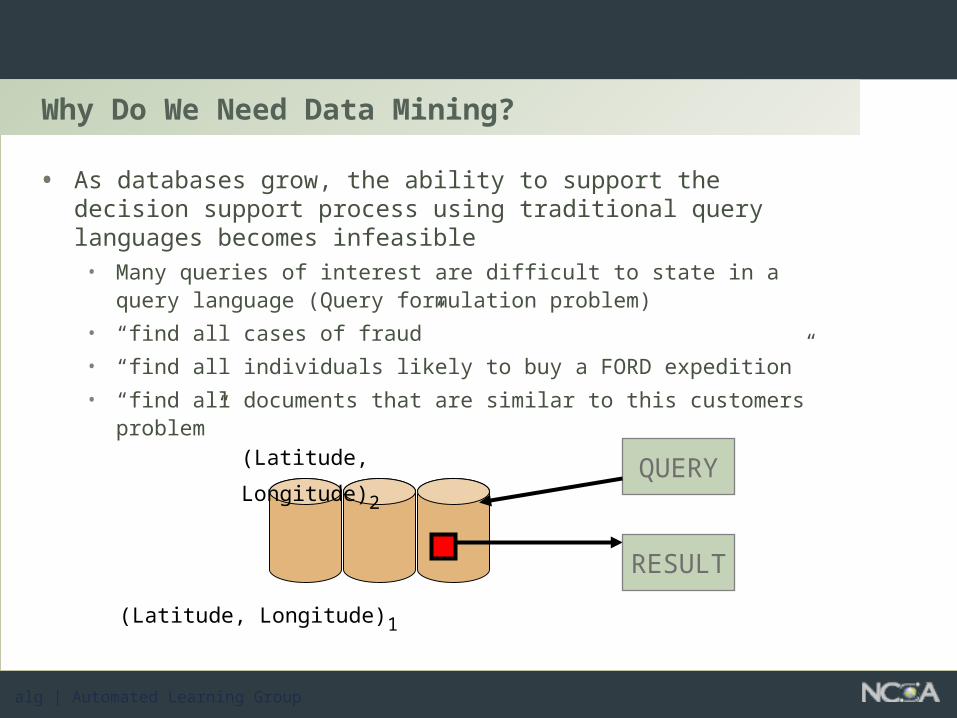
• As databases grow, the ability to support the decision support process using traditional query languages becomes infeasible
• Many queries of interest are difficult to state in a query language (Query formulation problem)
• “find all cases of fraud”
• “find all individuals likely to buy a FORD expedition”
• “find all documents that are similar to this customers problem”
QUERY
RESULT
(Latitude, Longitude)1
(Latitude, Longitude)2
alg | Automated Learning Group
What is It?
Knowledge Discovery in Databases is the non-trivial process of identifying valid, novel, potentially useful, and ultimately understandable patterns in data.
• The understandable patterns are used to:• Make predictions or classifications about new data• Explain existing data• Summarize the contents of a large database to support decision
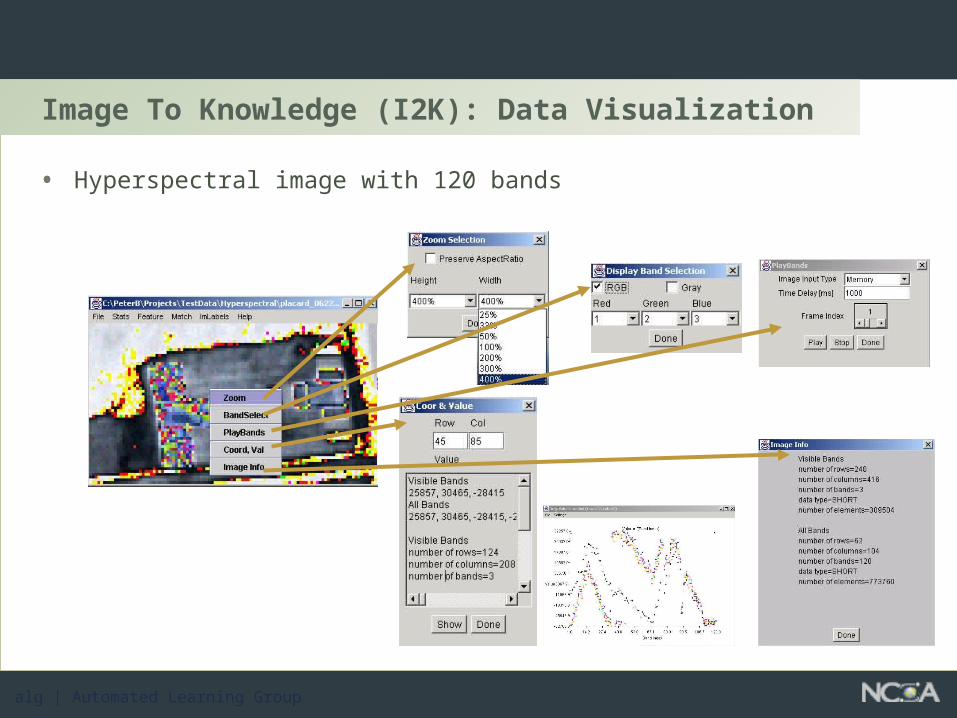
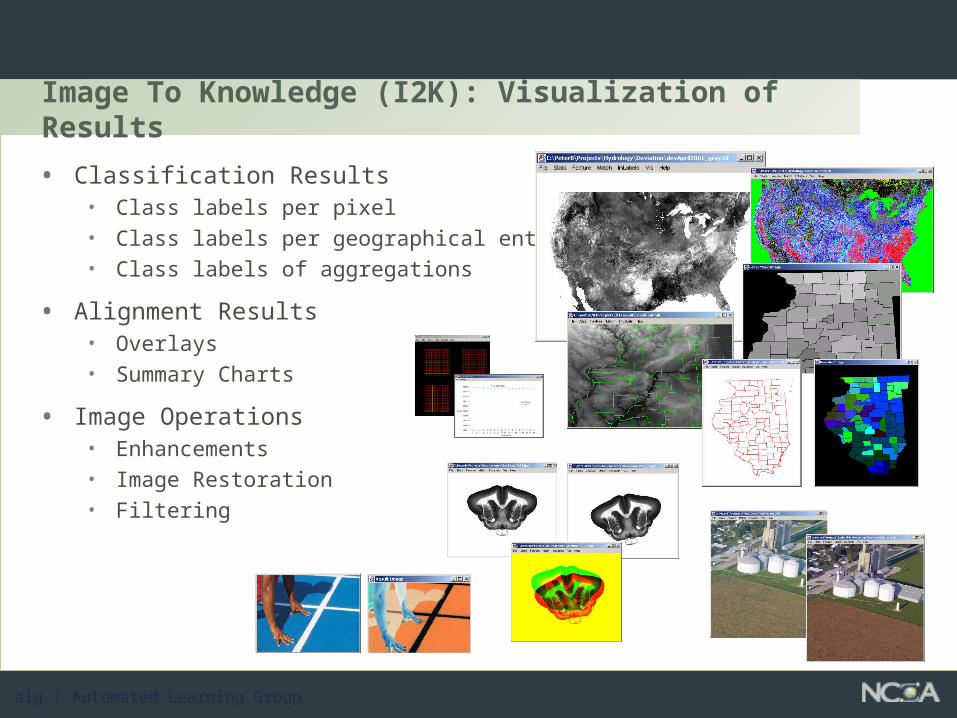
making• Graphical data visualization to aid humans in discovering deeper
patterns
alg | Automated Learning Group
Applications of Data Mining
alg | Automated Learning Group
Data Mining Applications
• Market analysis
• Risk analysis and management
• Fraud detection and detection of unusual patterns (outliers)
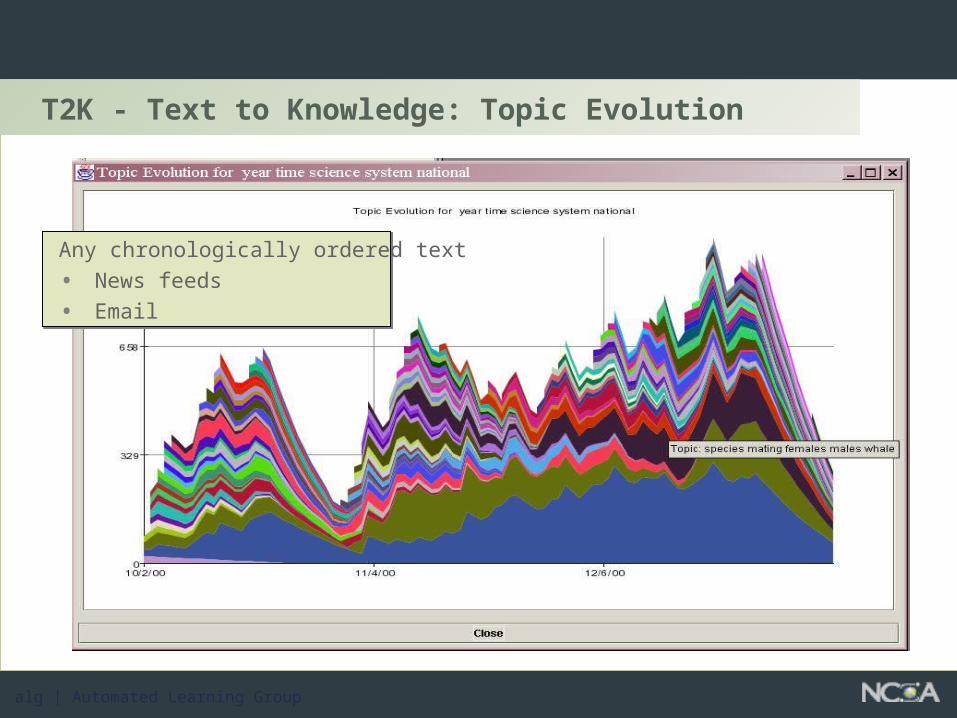
• Text mining (news group, email, documents) and Web mining
• Stream data mining
• DNA and bio-data analysis
alg | Automated Learning Group
Market Analysis
• Where does the data come from?• Credit card transactions, loyalty cards, discount coupons, customer
complaint calls, plus (public) lifestyle studies
• Target marketing• Find clusters of “model” customers who share the same characteristics:
interest, income level, spending habits, etc.• Determine customer purchasing patterns over time
• Cross-market analysis• Associations/co-relations between product sales, & prediction based on
such association
• Customer profiling• What types of customers buy what products (clustering or classification)
• Customer requirement analysis• identifying the best products for different customers• Predict what factors will attract new customers)
alg | Automated Learning Group
Corporate Analysis & Risk Management
• Finance planning and asset evaluation• cash flow analysis and prediction• contingent claim analysis to evaluate assets • cross-sectional and time series analysis (financial-ratio, trend analysis, etc.)
• Resource planning• summarize and compare the resources and spending
• Competition• monitor competitors and market directions • group customers into classes and a class-based pricing procedure• set pricing strategy in a highly competitive market
alg | Automated Learning Group
Fraud Detection & Mining Unusual Patterns
• Approaches: Clustering & model construction for frauds, outlier analysis
• Applications: Health care, retail, credit card service, telecomm.• Auto insurance: ring of collisions • Money laundering: suspicious monetary transactions • Medical insurance
– Professional patients, ring of doctors, and ring of references– Unnecessary or correlated screening tests
• Telecommunications: phone-call fraud– Phone call model: destination of the call, duration, time of day or week.
Analyze patterns that deviate from an expected norm• Retail industry
– Analysts estimate that 38% of retail shrink is due to dishonest employees
• Anti-terrorism
alg | Automated Learning Group
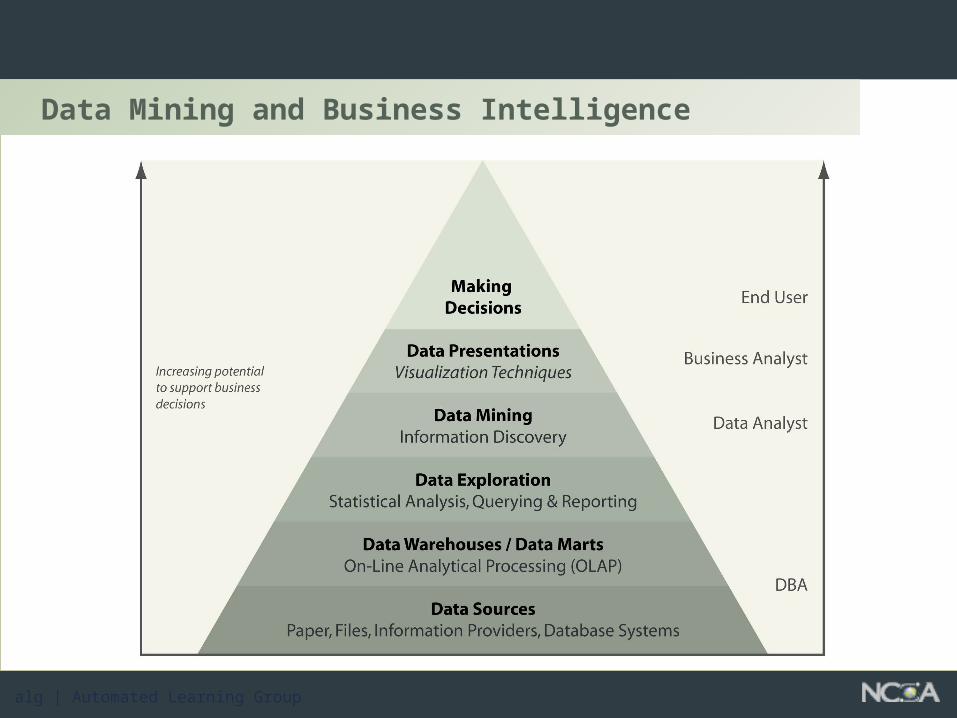
Data Mining and Business Intelligence
alg | Automated Learning Group
Knowledge Discovery in Databases Process
alg | Automated Learning Group
KDD Process
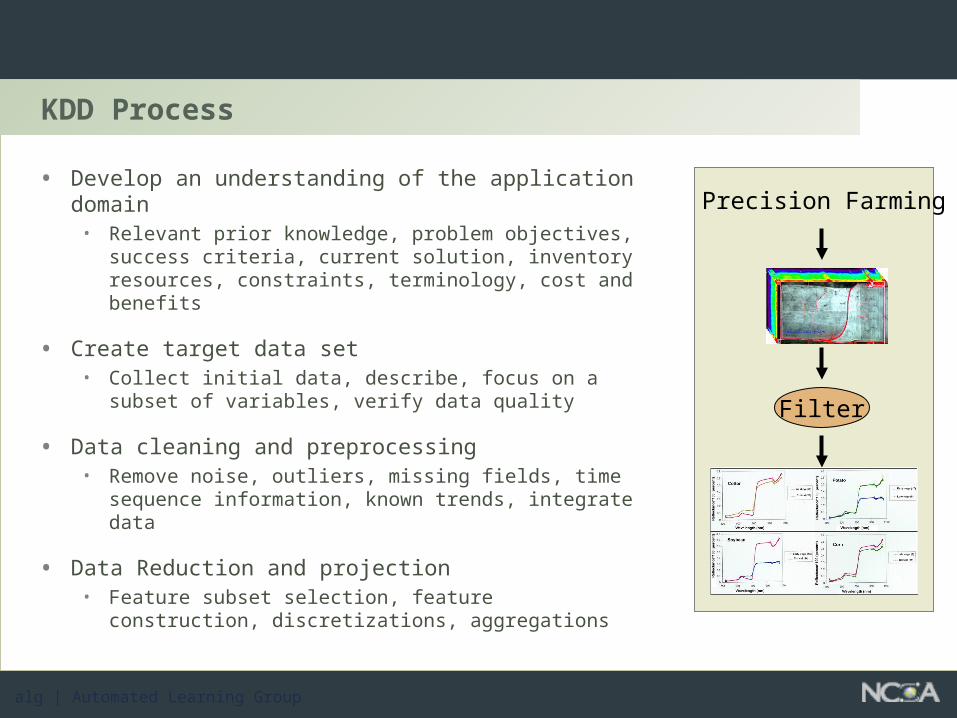
• Develop an understanding of the application domain
• Relevant prior knowledge, problem objectives, success criteria, current solution, inventory resources, constraints, terminology, cost and benefits
• Create target data set• Collect initial data, describe, focus on a subset of
variables, verify data quality
• Data cleaning and preprocessing• Remove noise, outliers, missing fields, time
sequence information, known trends, integrate data
• Data Reduction and projection• Feature subset selection, feature construction,
discretizations, aggregations
Precision Farming
Filter
alg | Automated Learning Group
KDD Process
• Selection of data mining task• Classification, segmentation, deviation detection, link analysis
• Select data mining approach
• Data mining to extract patterns or models
• Interpretation and evaluation of patterns/models
• Consolidating discovered knowledge
alg | Automated Learning Group
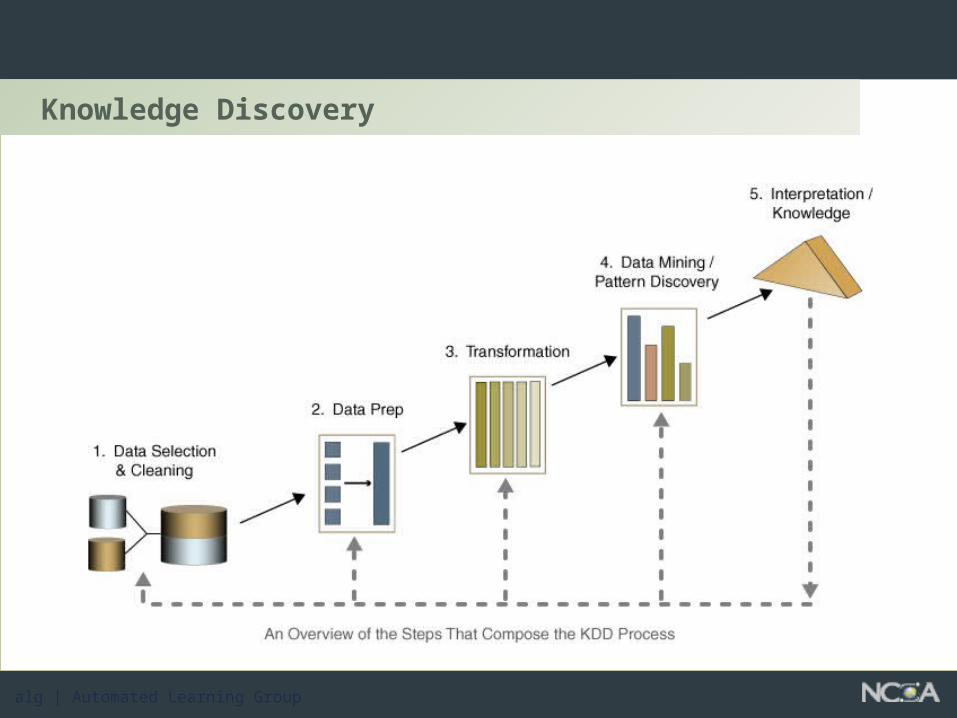
Knowledge Discovery
alg | Automated Learning Group
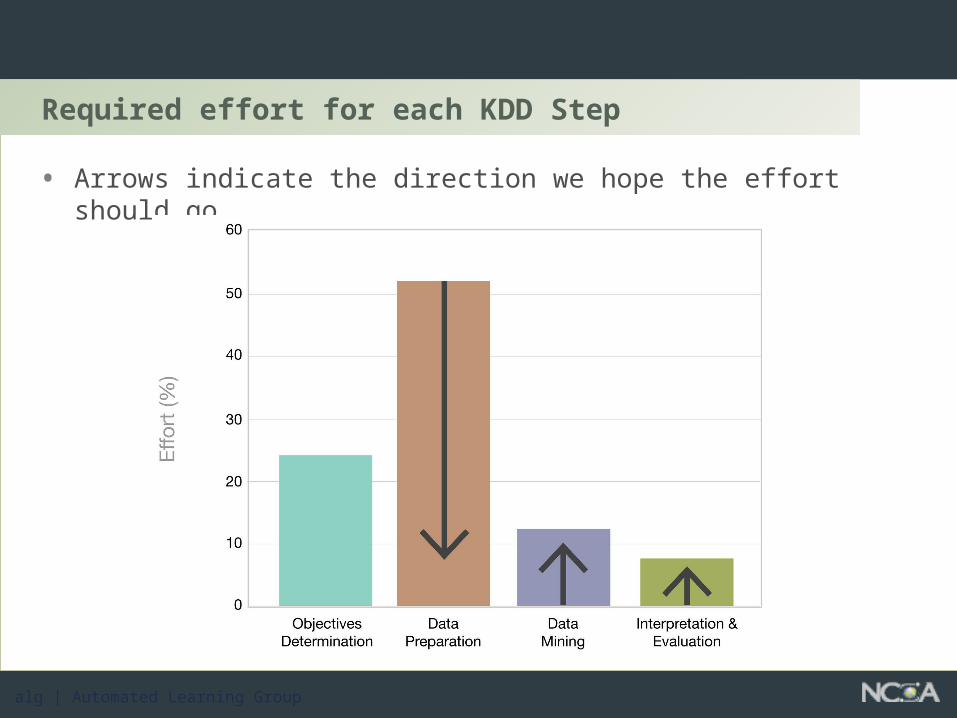
Required effort for each KDD Step
• Arrows indicate the direction we hope the effort should go.
alg | Automated Learning Group
Data Mining Tools
alg | Automated Learning Group
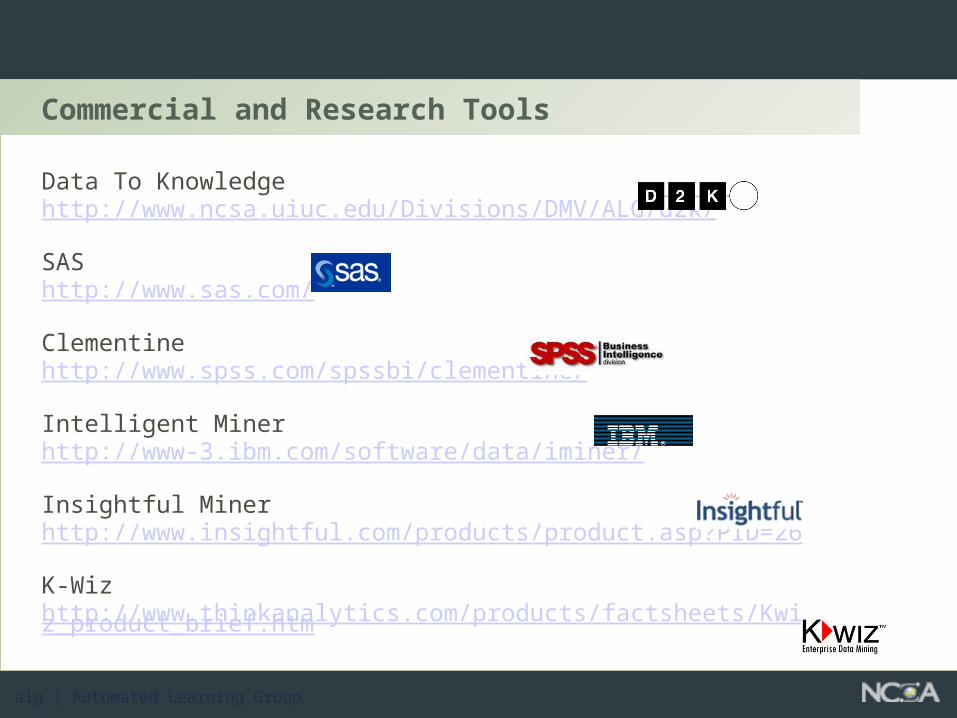
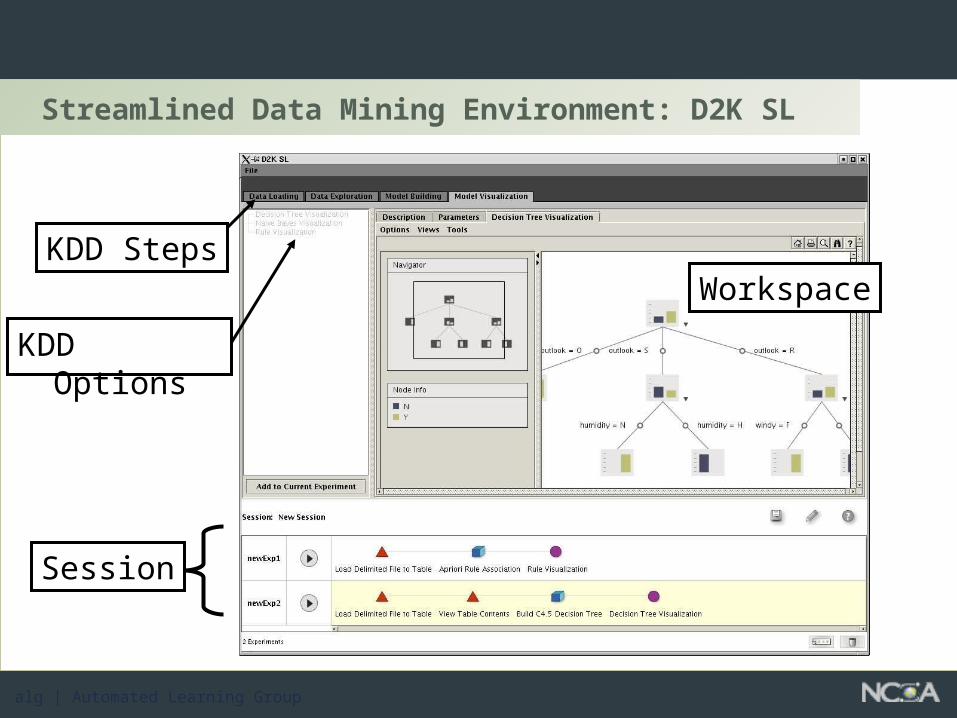
Commercial and Research Tools
Data To Knowledge http://www.ncsa.uiuc.edu/Divisions/DMV/ALG/d2k/
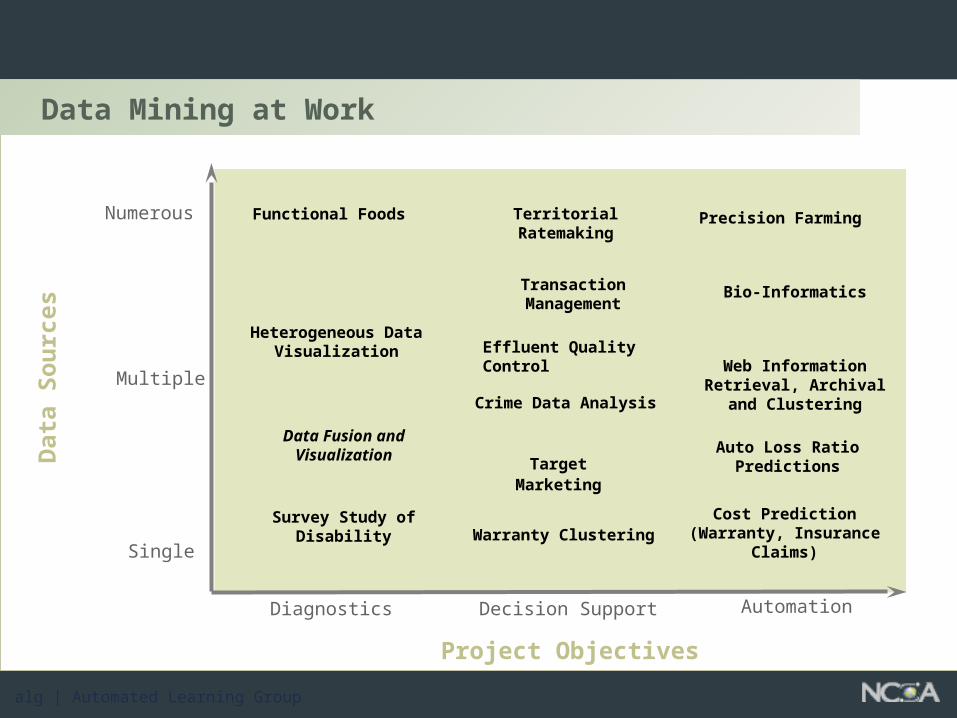
Web Information Retrieval, Archival and Clustering
Auto Loss Ratio Predictions
Precision Farming
Bio-Informatics
Functional Foods
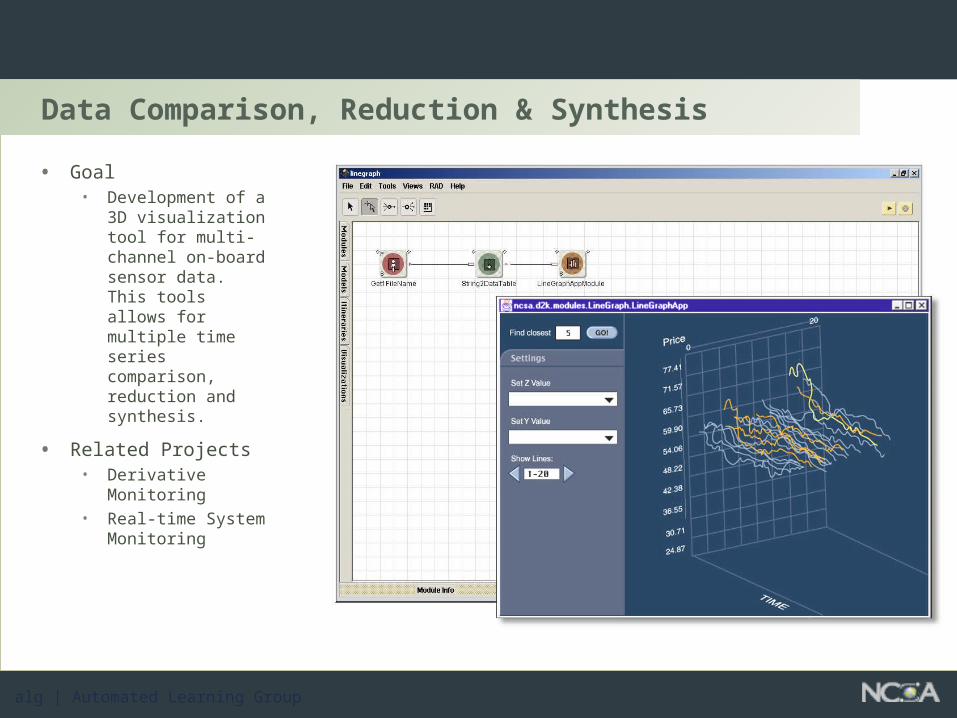
Heterogeneous Data Visualization
Crime Data Analysis
Data Fusion and Visualization
Survey Study of Disability
alg | Automated Learning Group
Examples of Data Mining Methods
alg | Automated Learning Group
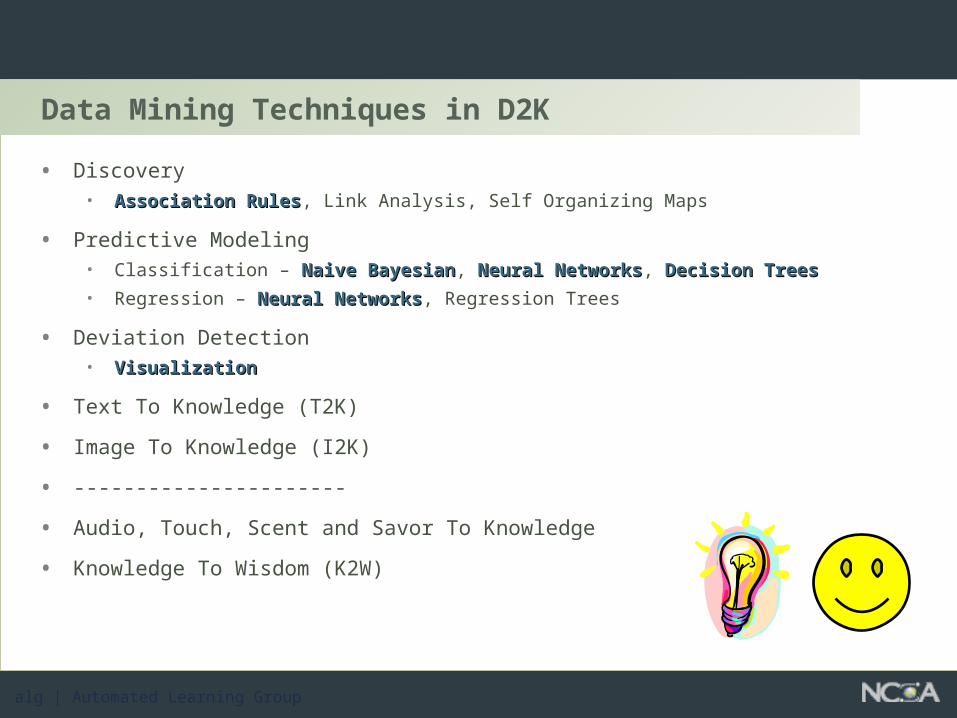
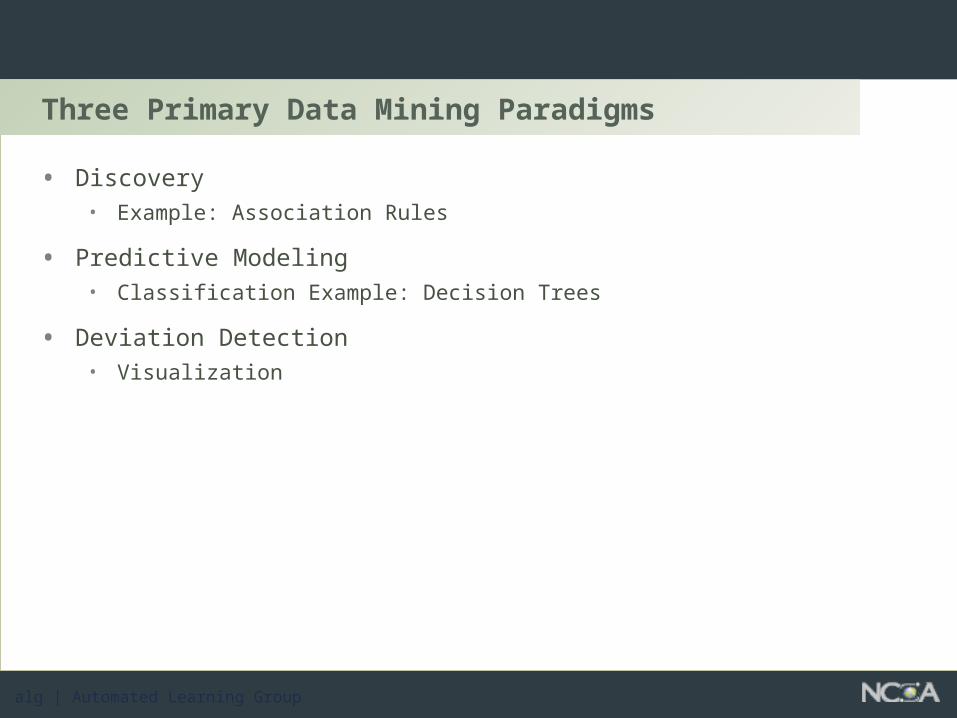
Three Primary Data Mining Paradigms
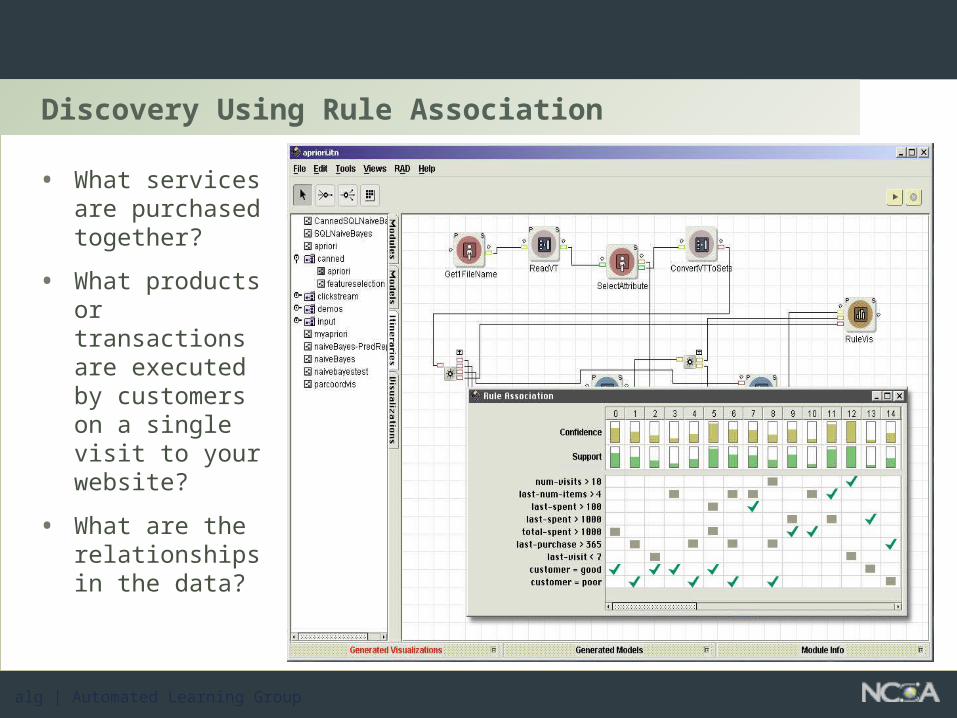
• Discovery• Example: Association Rules
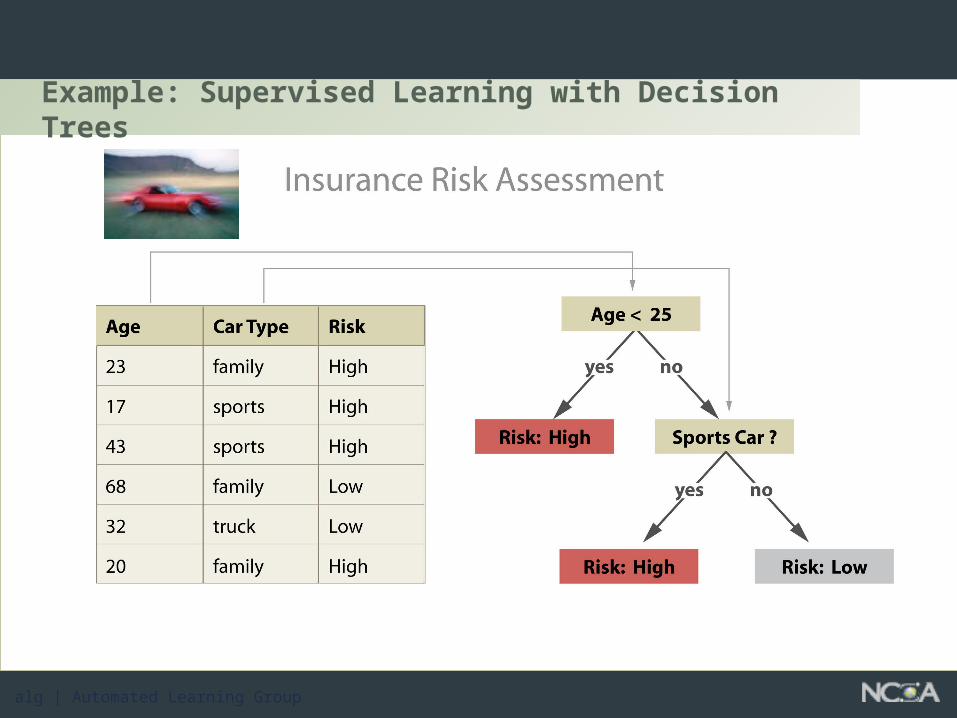
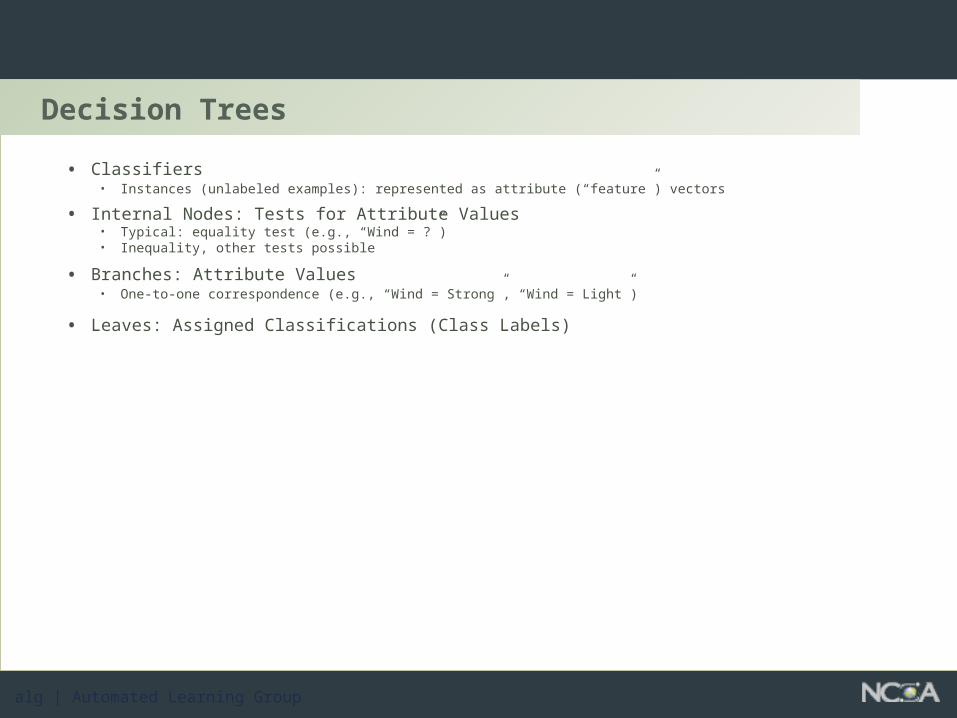
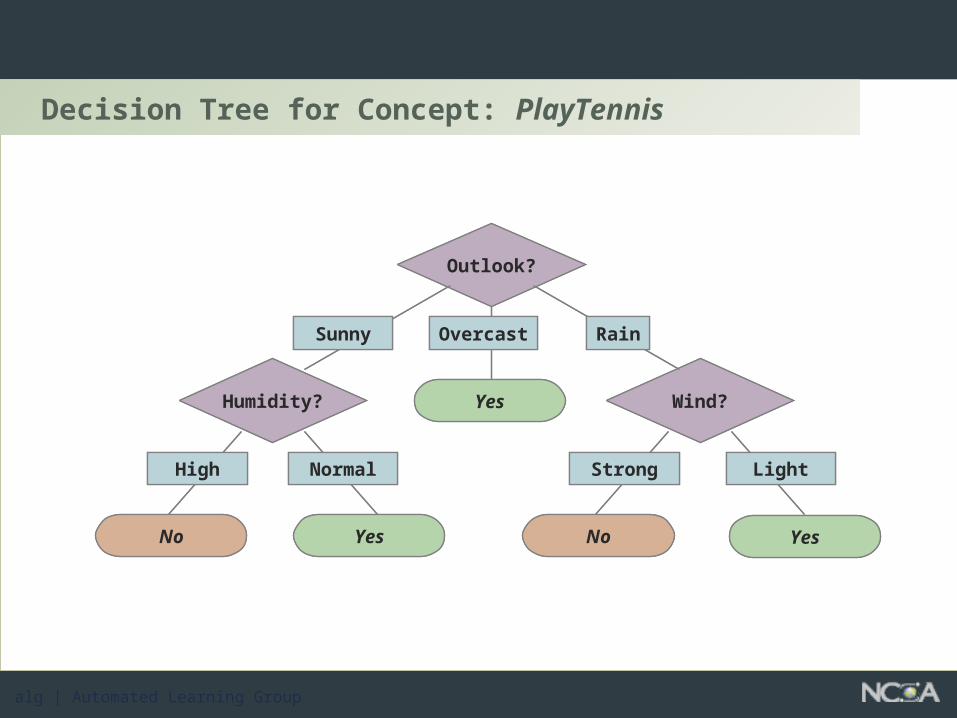
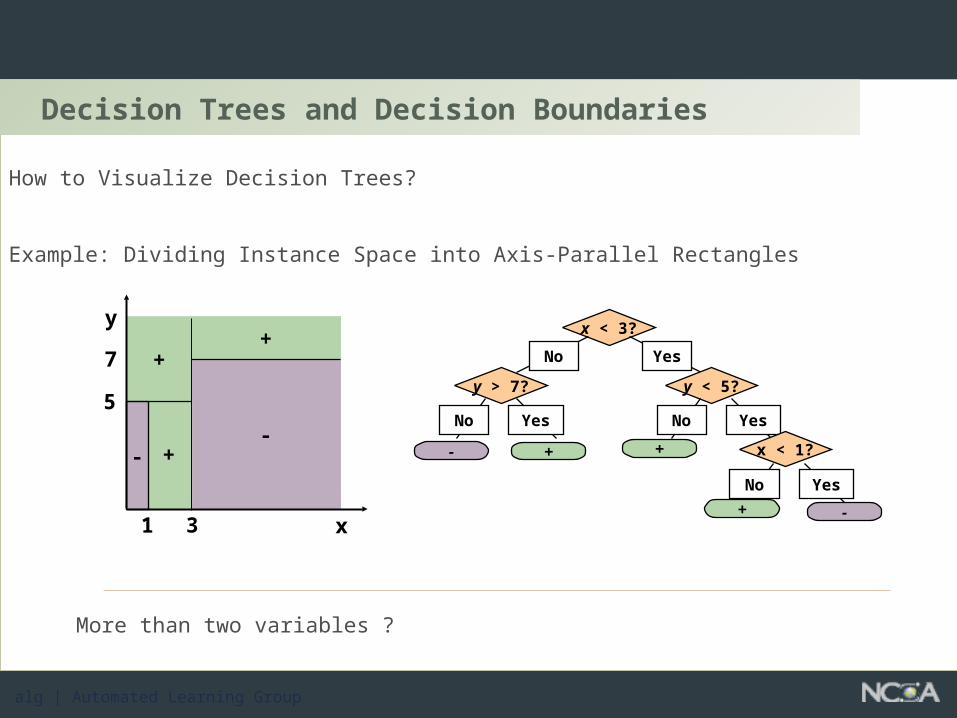
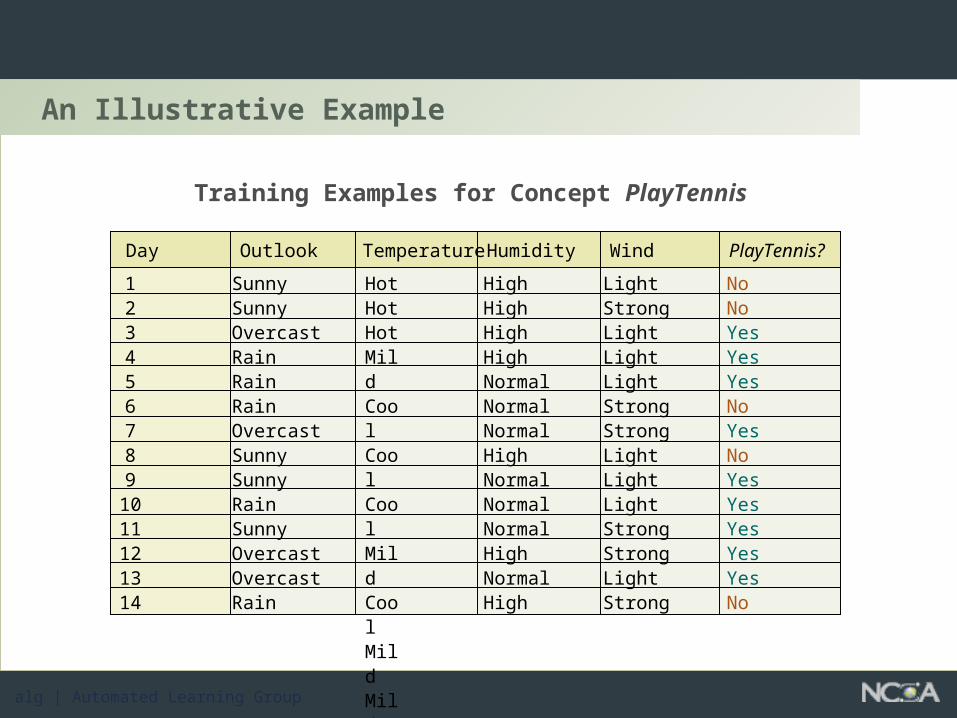
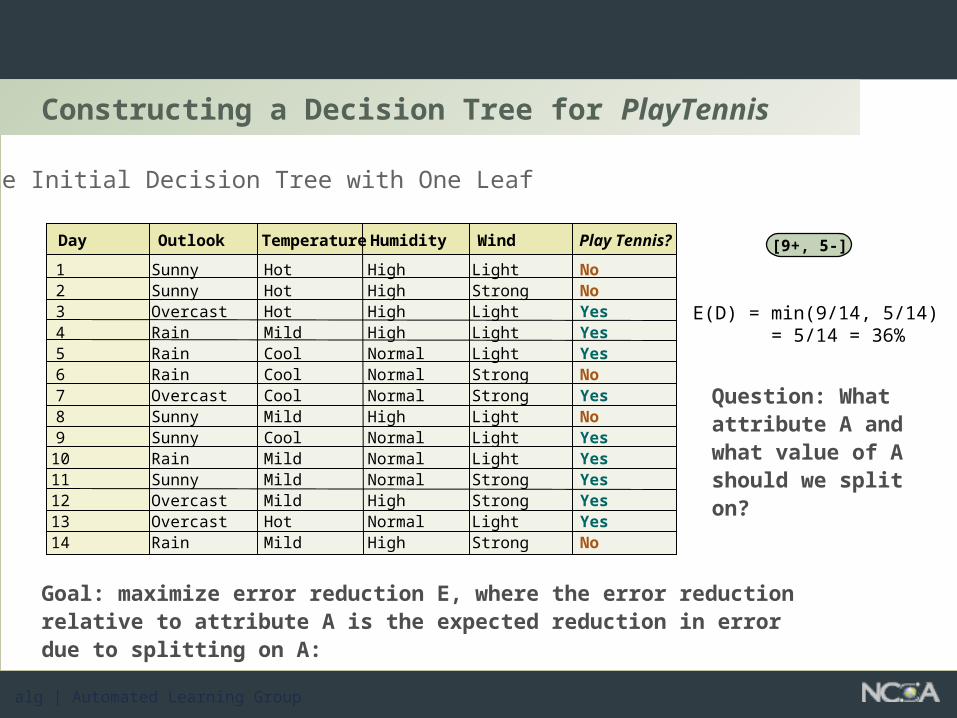
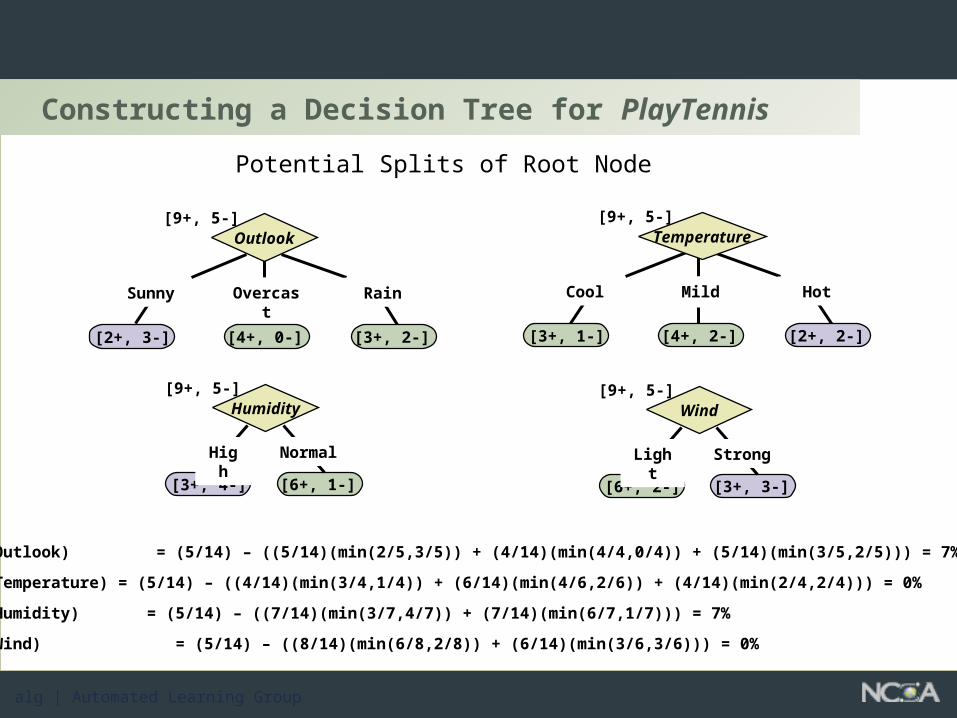
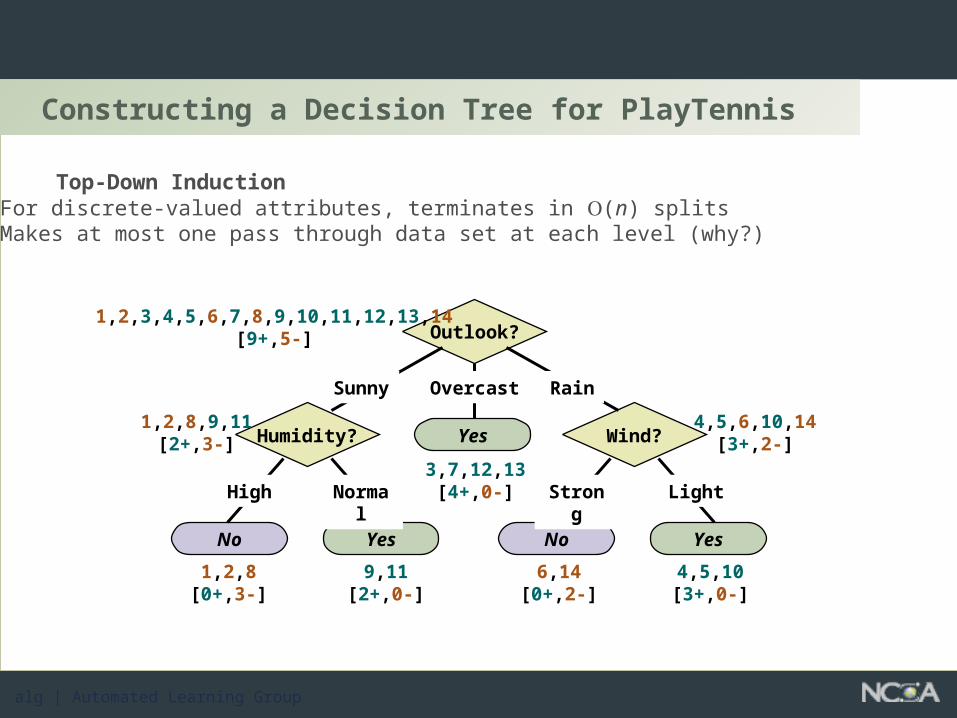
• Predictive Modeling • Classification Example: Decision Trees
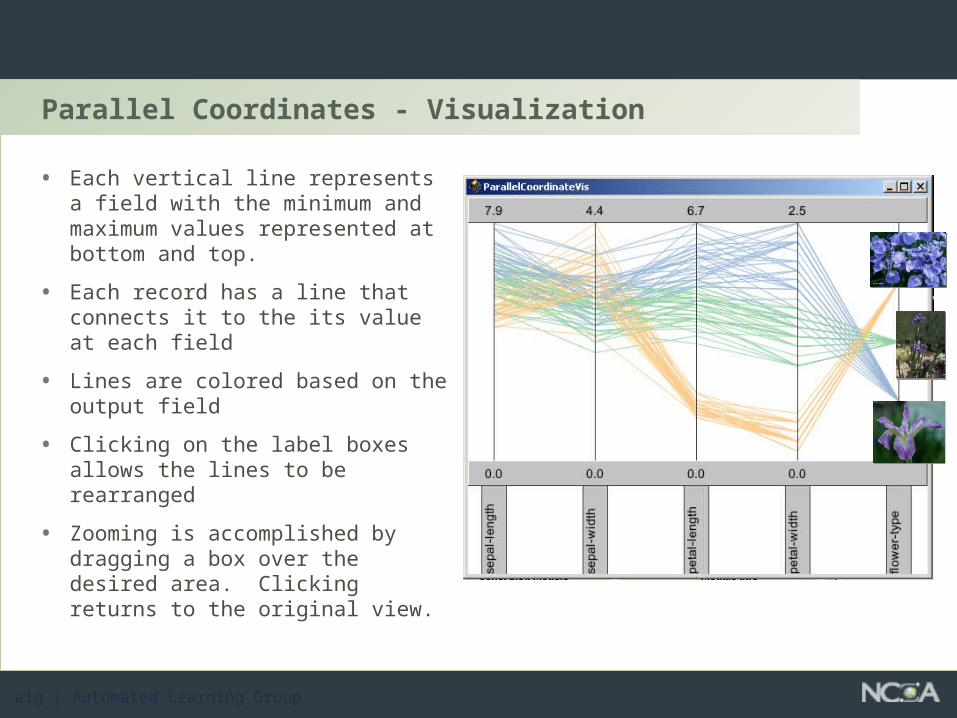
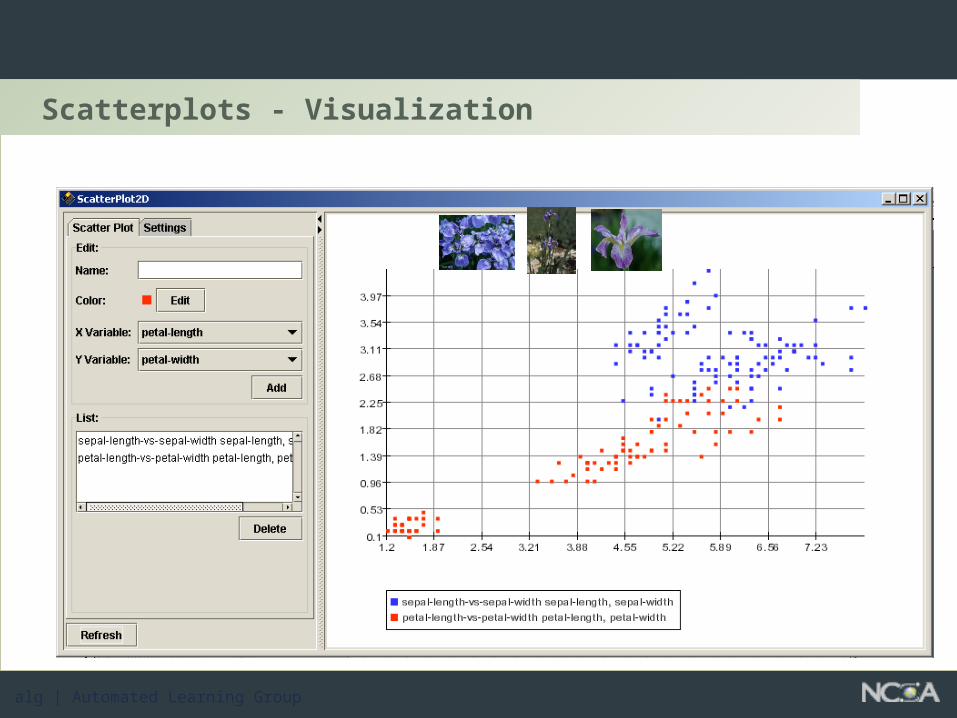
• Deviation Detection• Visualization
alg | Automated Learning Group
Association Rules and Market Basket Analysis
alg | Automated Learning Group
What is Market Basket Analysis?
• Customer Analysis• Market Basket Analysis uses the information about what a
customer purchases to give us insight into who they are and why they make certain purchases.
• Product Analysis• Market basket Analysis gives us insight into the merchandise by
telling us which products tend to be purchased together and which are most amenable to purchase.
alg | Automated Learning Group
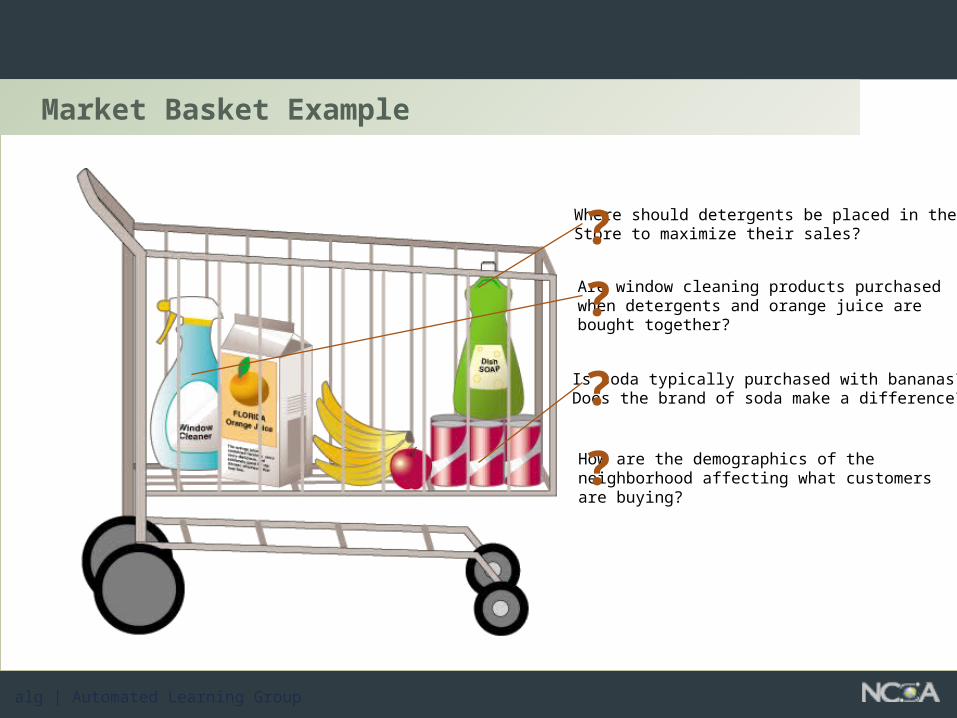
Market Basket Example
Is soda typically purchased with bananas?Does the brand of soda make a difference?
Where should detergents be placed in theStore to maximize their sales?
Are window cleaning products purchased when detergents and orange juice are bought together?
How are the demographics of the neighborhood affecting what customers are buying?
?
?
?
?
alg | Automated Learning Group
Association Rules
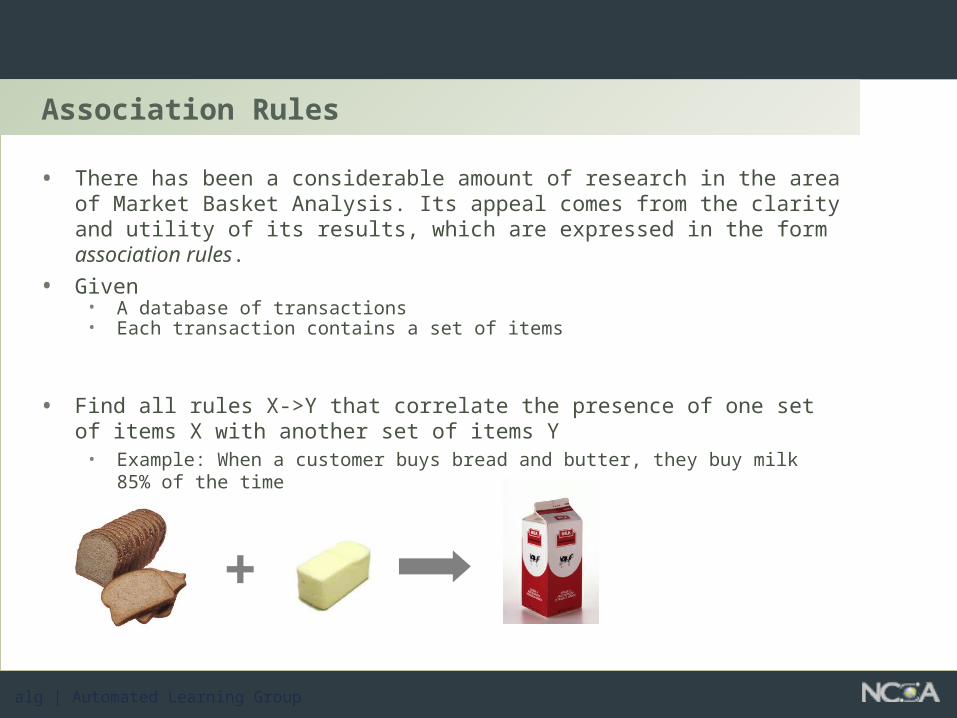
• There has been a considerable amount of research in the area of Market Basket Analysis. Its appeal comes from the clarity and utility of its results, which are expressed in the form association rules.
• Given• A database of transactions• Each transaction contains a set of items
• Find all rules X->Y that correlate the presence of one set of items X with another set of items Y
• Example: When a customer buys bread and butter, they buy milk 85% of the time
+
alg | Automated Learning Group
Results: Useful, Trivial, or Inexplicable?
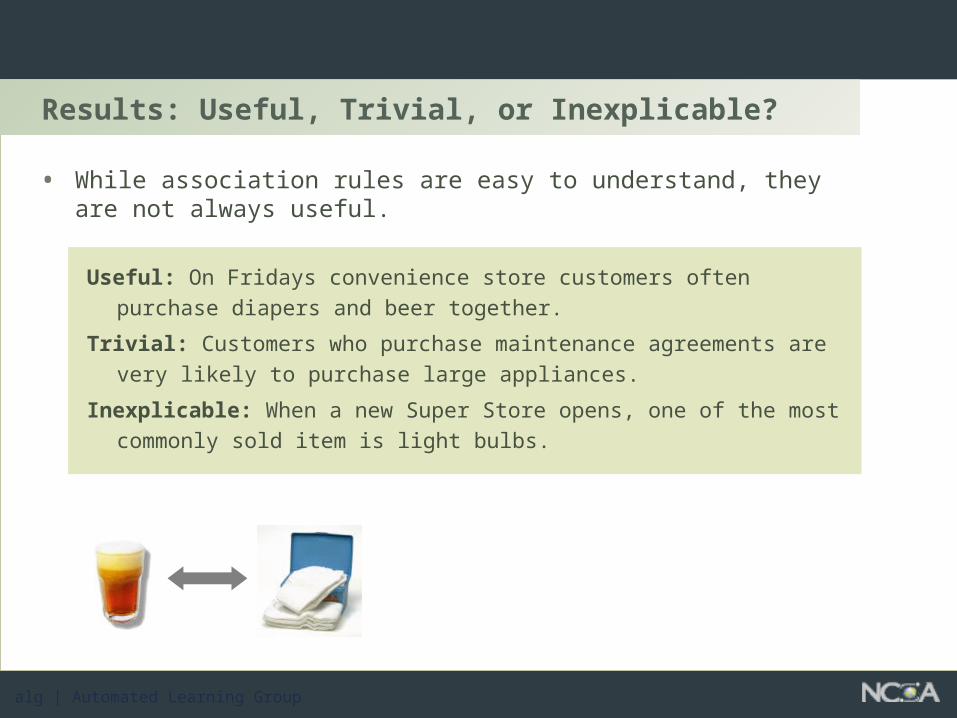
• While association rules are easy to understand, they are not always useful.
Useful: On Fridays convenience store customers often purchase diapers and beer together.
Trivial: Customers who purchase maintenance agreements are very likely to purchase large appliances.
Inexplicable: When a new Super Store opens, one of the most commonly sold item is light bulbs.
alg | Automated Learning Group
How Does It Work?
Orange juice, Soda
Milk, Orange Juice, Window Cleaner
Orange Juice, Detergent
Orange juice, detergent, soda
Window cleaner, soda
OJ
4
1
1
2
1
OJ
Window Cleaner
Milk
Soda
Detergent
1
2
1
1
0
1
1
1
0
0
2
1
0
3
1
1
0
0
1
2
WindowCleaner Milk Soda Detergent
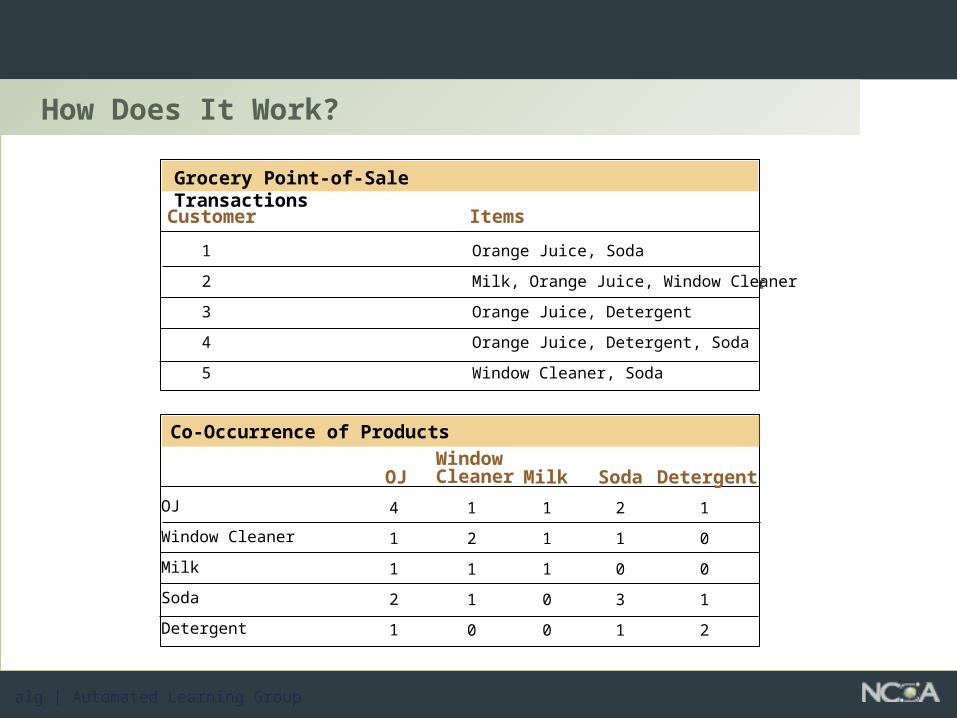
Co-Occurrence of Products
Customer Items
1
2
3
4
5
Grocery Point-of-Sale Transactions
Orange Juice, Soda
Milk, Orange Juice, Window Cleaner
Orange Juice, Detergent
Orange Juice, Detergent, Soda
Window Cleaner, Soda
alg | Automated Learning Group
OJ
Window Cleaner
Milk
Soda
Detergent
1
1
1
0
0
2
1
0
3
1
1
0
0
1
2
OJWindowCleaner Milk Soda Detergent
1
2
1
1
0
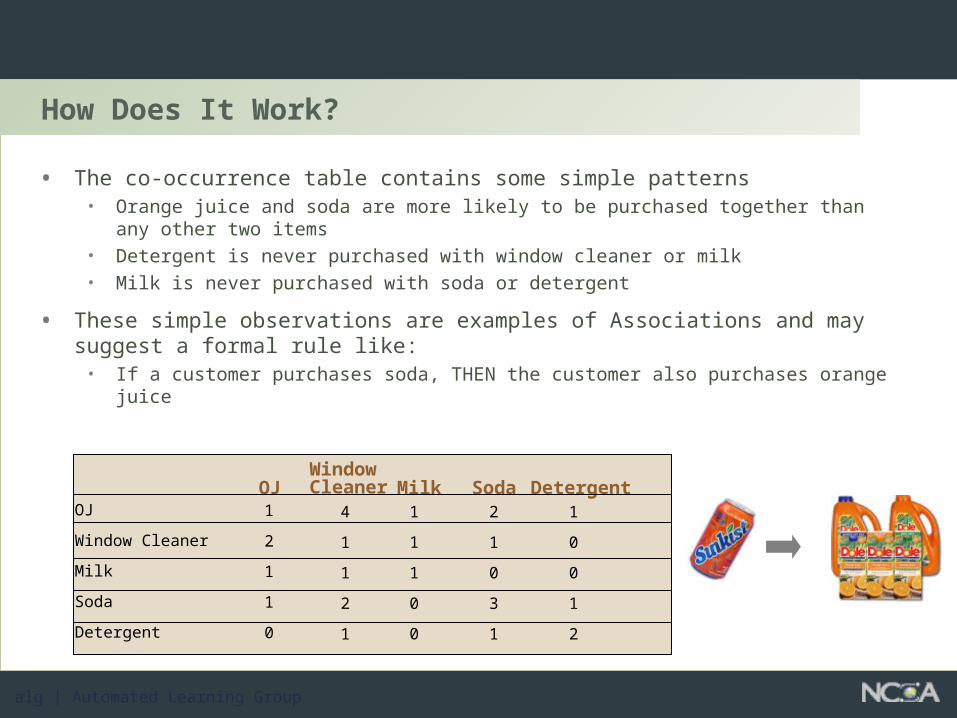
• The co-occurrence table contains some simple patterns• Orange juice and soda are more likely to be purchased together than any other
two items• Detergent is never purchased with window cleaner or milk• Milk is never purchased with soda or detergent
• These simple observations are examples of Associations and may suggest a formal rule like:
• If a customer purchases soda, THEN the customer also purchases orange juice
How Does It Work?
4
1
1
2
1
alg | Automated Learning Group
How Good Are the Rules?
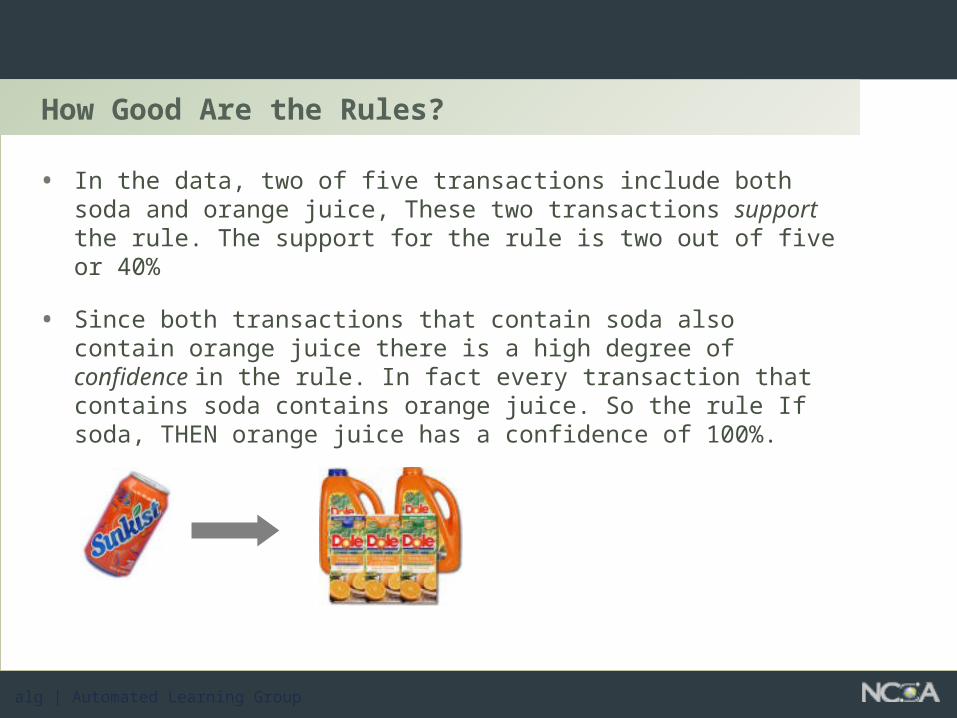
• In the data, two of five transactions include both soda and orange juice, These two transactions support the rule. The support for the rule is two out of five or 40%
• Since both transactions that contain soda also contain orange juice there is a high degree of confidence in the rule. In fact every transaction that contains soda contains orange juice. So the rule If soda, THEN orange juice has a confidence of 100%.
alg | Automated Learning Group
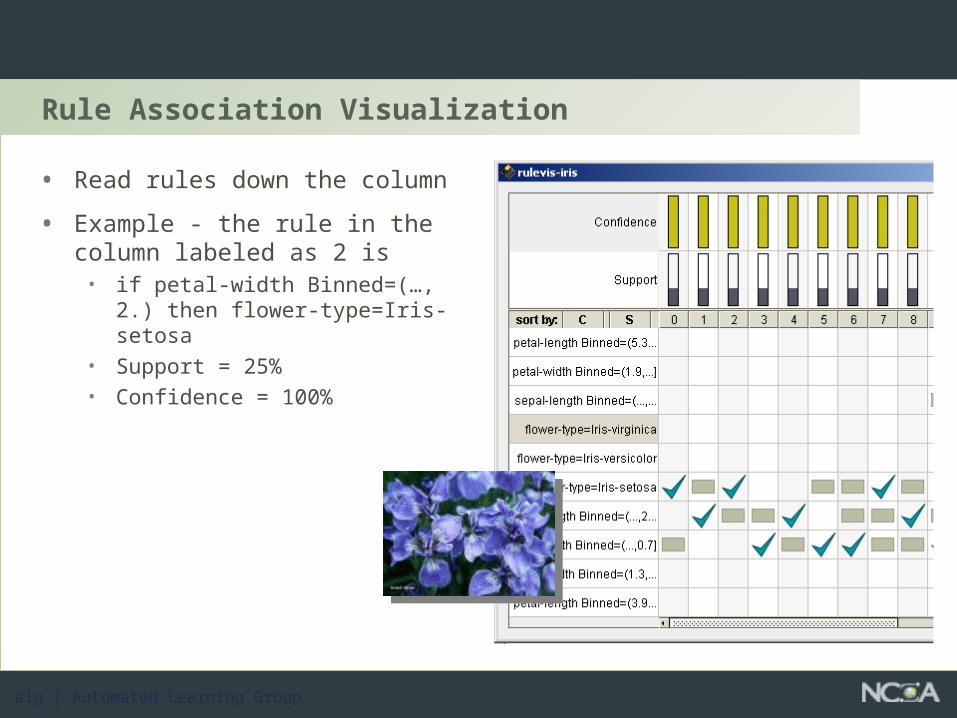
Confidence and Support - How Good Are the Rules
• A rule must have some minimum user-specified confidence• 1 & 2 -> 3 has a 90% confidence if when a customer bought 1 and
2, in 90% of the cases, the customer also bought 3.
• A rule must have some minimum user-specified support• 1 & 2 -> 3 should hold in some minimum percentage of
transactions to have value.
alg | Automated Learning Group
Association Examples
• Find all rules that have “Diet Coke” as a result. These rules may help plan what the store should do to boost the sales of Diet Coke.
• Find all rules that have “Yogurt” in the condition. These rules may help determine what products may be impacted if the store discontinues selling “Yogurt”.
• Find all rules that have “Brats” in the condition and “mustard” in the result. These rules may help in determining the additional items that have to be sold together to make it highly likely that mustard will also be sold.
• Find the best k rules that have “Yogurt” in the result.
alg | Automated Learning Group
The Basic Process
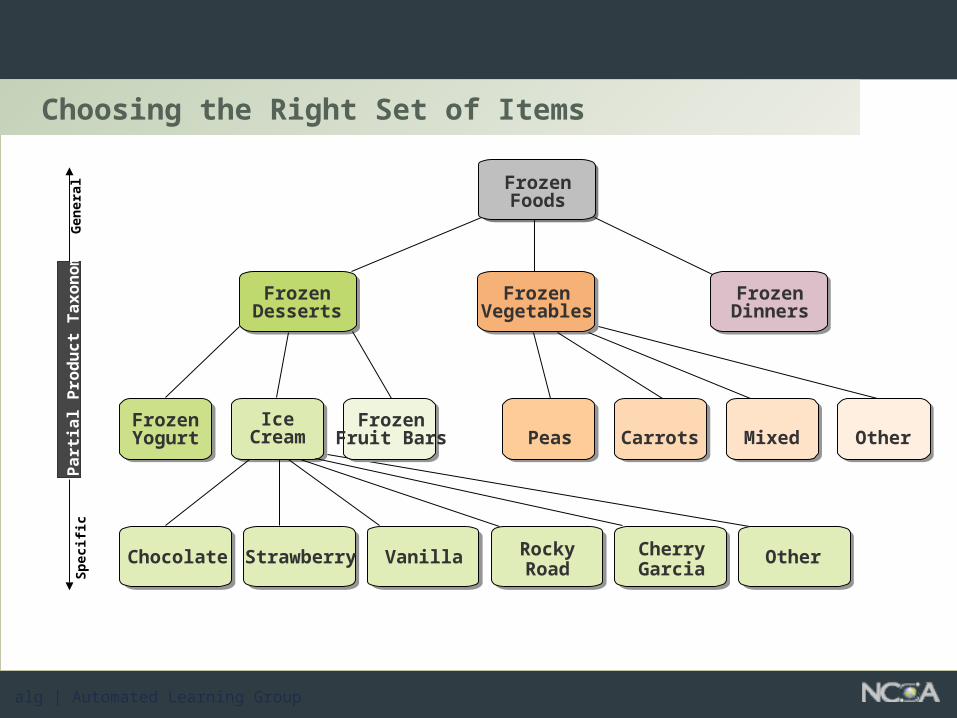
• Choosing the right set of items• Taxonomies
• Generation of rules• If condition Then result
• Negation
• Overcoming the practical limits imposed by thousand or tens of thousands of products
• Minimum Support Pruning
alg | Automated Learning Group
Choosing the Right Set of Items
FrozenFoods
FrozenDesserts
FrozenVegetables
FrozenDinners
FrozenYogurt
FrozenFruit Bars
IceCream Peas Carrots Mixed Other
RockyRoad
Chocolate Strawberry Vanilla CherryGarcia
Other
Part
ial P
rod
uct
Taxon
om
yG
en
era
lS
pecifi
c
alg | Automated Learning Group
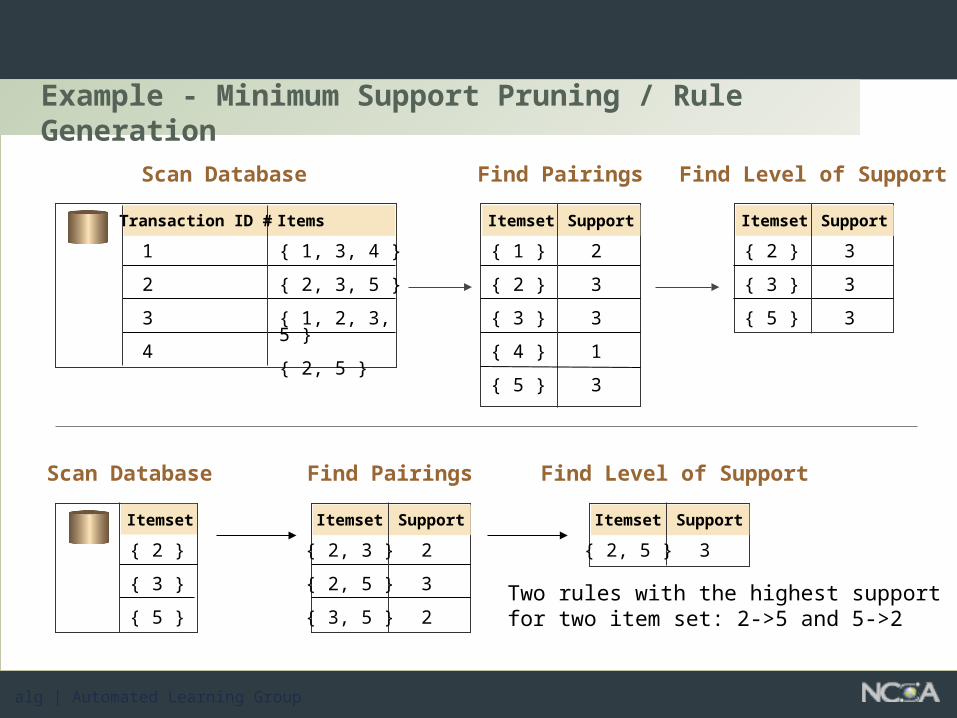
Example - Minimum Support Pruning / Rule Generation
Transaction ID # Items
1
2
3
4
{ 1, 3, 4 }
{ 2, 3, 5 }
{ 1, 2, 3, 5 }
{ 2, 5 }
Itemset Support
{ 1 }
{ 2 }
{ 3 }
{ 4 }
{ 5 }
2
3
3
1
3
Itemset Support
{ 2 }
{ 3 }
{ 5 }
3
3
3
Itemset
{ 2 }
{ 3 }
{ 5 }
Itemset Support
{ 2, 3 }
{ 2, 5 }
{ 3, 5 }
2
3
2
Itemset Support
{ 2, 5 } 3
Scan Database Find Pairings Find Level of Support
Scan Database Find Pairings Find Level of Support
Two rules with the highest supportfor two item set: 2->5 and 5->2
alg | Automated Learning Group
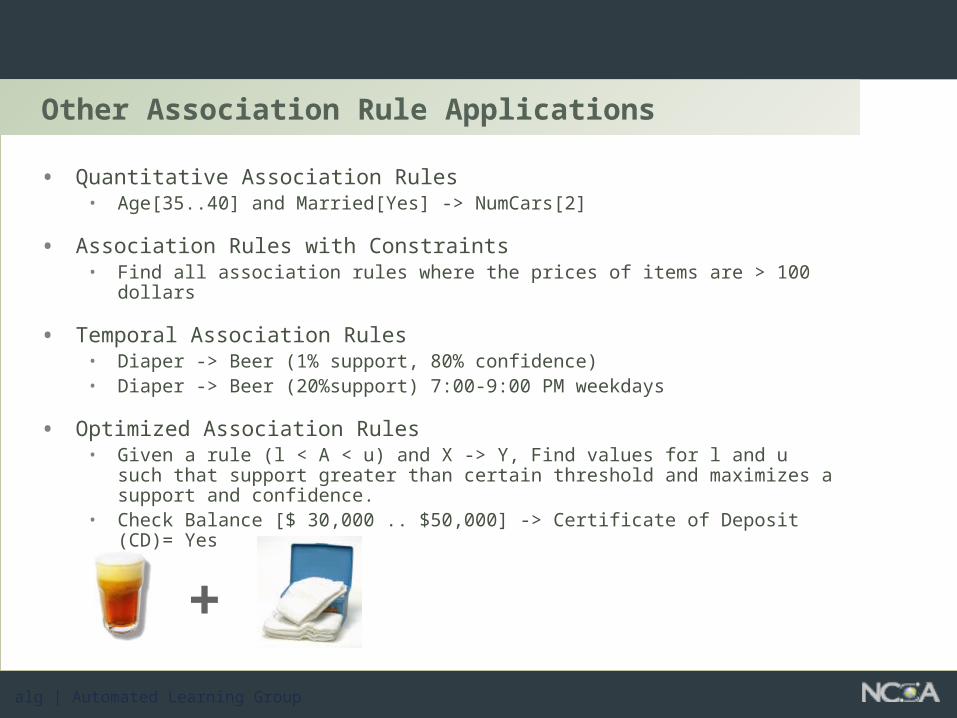
Other Association Rule Applications
• Quantitative Association Rules• Age[35..40] and Married[Yes] -> NumCars[2]
• Association Rules with Constraints• Find all association rules where the prices of items are > 100 dollars