46
Geology and Cu-Ni-PGE mineralization in the South Kawishiwi Intrusion, Duluth Complex, Minnesota Dean M. Peterson Senior Vice President, Exploration
| Date post: | 15-Aug-2015 |
| Category: |
Documents |
| Upload: | dean-peterson |
| View: | 21 times |
| Download: | 0 times |

Geology and Cu-Ni-PGE mineralization in
the South Kawishiwi Intrusion, Duluth
Complex, Minnesota
Dean M. Peterson
Senior Vice President, Exploration

May 5, 2009
2
Forward Looking Statement
No regulatory authority has approved or disapproved the information contained in this presentation. This presentation includes certain statements that may be deemed “forward looking statements”. All statements in this presentation, other than statement of historical facts, that address future production, reserve potential, exploration drilling, exploitation activities and events or developments that the Company expects are forward-looking statements. Although the Company believes the expectations expressed in such forward-looking statements are based on reasonable assumptions, statements are not guarantees of future performance and actual results or developments may differ materially from the forward-looking statements. Factors that could cause actual results to differ materially form those in the forward-looking statements include market prices, exploitation and exploration successes, continued availability of capital and financing, general economic, market or business conditions. Investors should be cautious that any such statements are not guarantees of future performance and that actual results or developments may differ materially from those projected in the forward-looking statements. The company does not undertake to update or revise any forward-looking statements, whether as a result of new information, future events or otherwise, save and except as may be required by applicable securities laws.
No regulatory authority has approved or disapproved the information contained in this presentation.
This presentation includes certain statements that may be deemed “forward looking statements”. All
statements in this presentation, other than statement of historical facts, that address future production,
reserve potential, exploration drilling, exploitation activities and events or developments that the
Company expects are forward-looking statements. Although the Company believes the expectations
expressed in such forward-looking statements are based on reasonable assumptions, statements are
not guarantees of future performance and actual results or developments may differ materially from
the forward-looking statements. Factors that could cause actual results to differ materially form those
in the forward-looking statements include market prices, exploitation and exploration successes,
continued availability of capital and financing, general economic, market or business conditions.
Investors should be cautious that any such statements are not guarantees of future performance and
that actual results or developments may differ materially from those projected in the forward-looking
statements. The company does not undertake to update or revise any forward-looking statements,
whether as a result of new information, future events or otherwise, save and except as may be
required by applicable securities laws.

Outline
3
• Regional Geology
• South Kawishiwi Intrusion
• Crystal-rich Slurries
• Thinking Outside the Gossan
• Details on the Maturi Cu-Ni-PGE Deposit
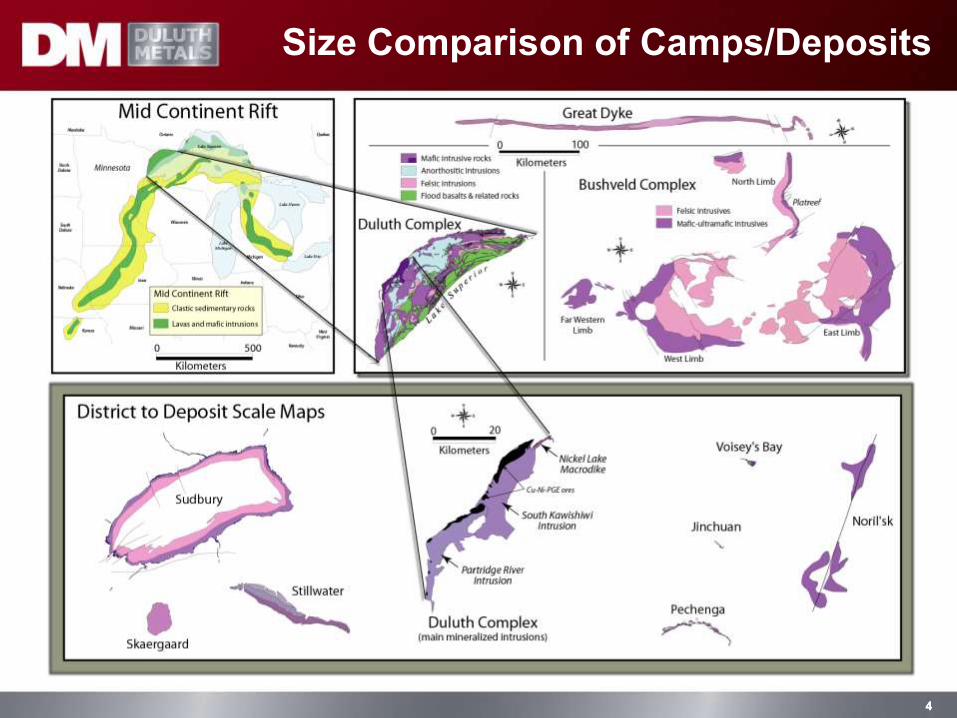
Size Comparison of Camps/Deposits
4 4

Mid-Continent Mantle Plume
The 1.1 billion year old Mid
Continent Rift mantle
plume was centered
on Lake Superior
5

Mineral System Approach
6
The mineral system approach to exploration attempts to
understand ore deposits as the final expression of multi-scale
systems encompassing the Earth that focus mass and
transfer energy to ultimately form ore deposits.
This approach to mineral exploration leads to systematic, scale-
dependent targeting models and allows for the recognition of
the largest-scale footprints of ore-forming systems.

Bedrock Geology, NE Minnesota
7
Virginia Fm.
Sulfur source
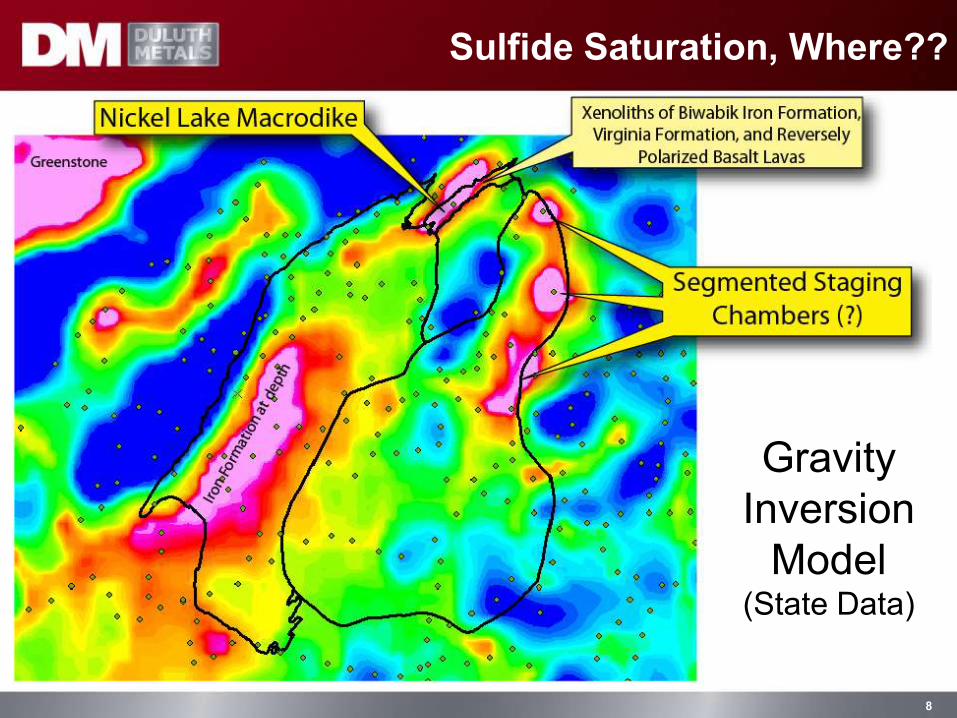
8
Sulfide Saturation, Where??
Gravity
Inversion
Model (State Data)

The Reason Why is Physical Process?
Mantle melts become
sulfur-saturated when
they first encounter
bedded rocks in their
140 km rise from the
mantle, the sulfidic
Virginia Fm.
9
Sulfide-bearing crystal-rich magmas intrude upwards
Sulfide-free crystal-bearing magmas intrude upwards
9

Basic Gravity Field Model
10

Tectonics & Horizontal Magma Injection
11

Exotic Inclusions in the NLM
It is physically impossible for the NLM to carry
very large, high density exotic xenoliths from
great depths to their present position at troctolite
liquid viscosities. The magma must have been
more viscous (ie., a crystal-liquid slurry)
Nonmagnetic Basalt
Biwabik Iron Fm.
12 12
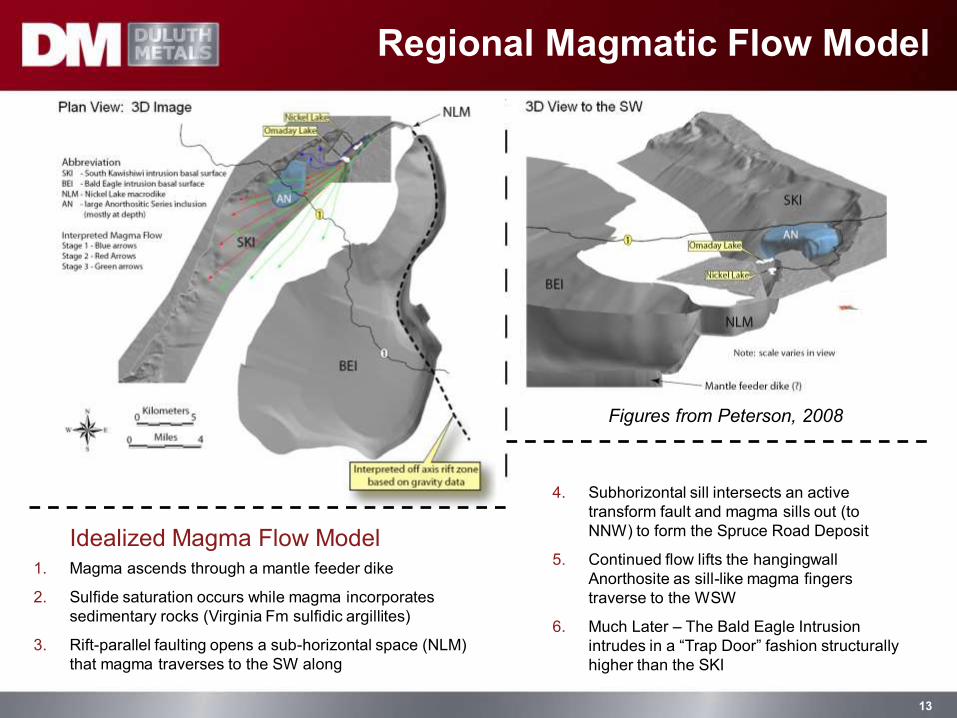
Regional Magmatic Flow Model
1. Magma ascends through a mantle feeder dike
2. Sulfide saturation occurs while magma incorporates
sedimentary rocks (Virginia Fm sulfidic argillites)
3. Rift-parallel faulting opens a sub-horizontal space (NLM)
that magma traverses to the SW along
4. Subhorizontal sill intersects an active
transform fault and magma sills out (to
NNW) to form the Spruce Road Deposit
5. Continued flow lifts the hangingwall
Anorthosite as sill-like magma fingers
traverse to the WSW
6. Much Later – The Bald Eagle Intrusion
intrudes in a “Trap Door” fashion structurally
higher than the SKI
Idealized Magma Flow Model
Figures from Peterson, 2008
13

14
Bedrock Geology Map

A Fundamental Tenet: Describing Rocks
DESCRIPTION OF MAP
UNITS
We attempt to interpret the
magmatic history and
processes that formed the
mafic intrusions of the
Duluth Complex
15

Initial Conditions
• The most critical part of analyzing and understanding
magmatic processes involves a clear and concise knowledge
of the nature of the system at the outset: when it all began !!
• The initial magmatic conditions that we think about include:
The geometry of the system;
The composition and initial state of crystallinity of the
magma;
The sequence of emplacement of the magma; and
The location of channelized magma flow and its resultant
variable ores.
16
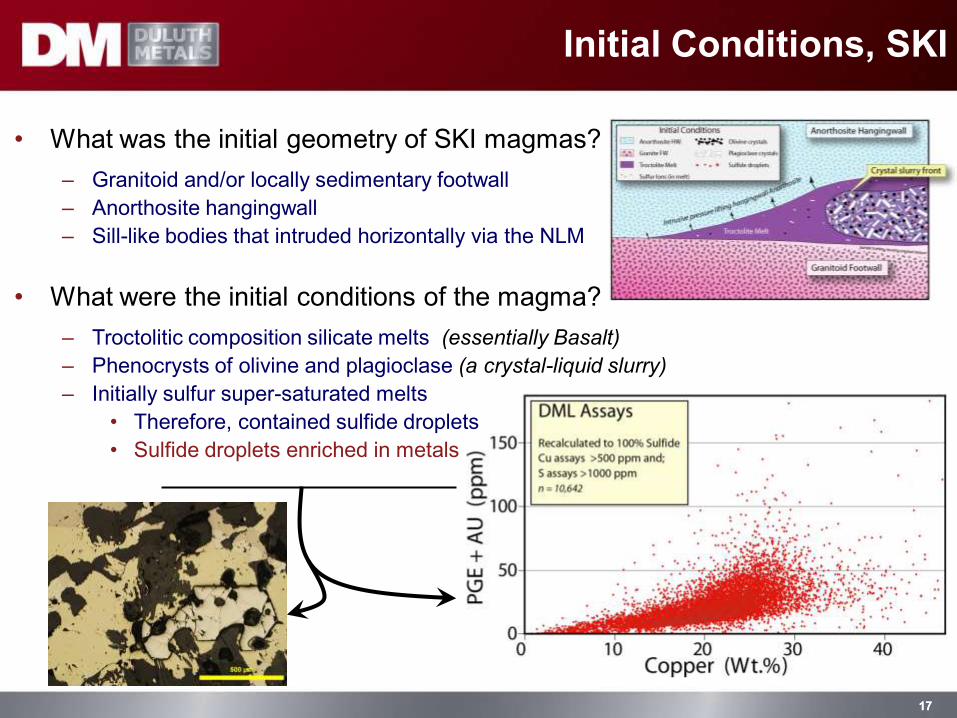
Initial Conditions, SKI
• What was the initial geometry of SKI magmas?
– Granitoid and/or locally sedimentary footwall
– Anorthosite hangingwall
– Sill-like bodies that intruded horizontally via the NLM
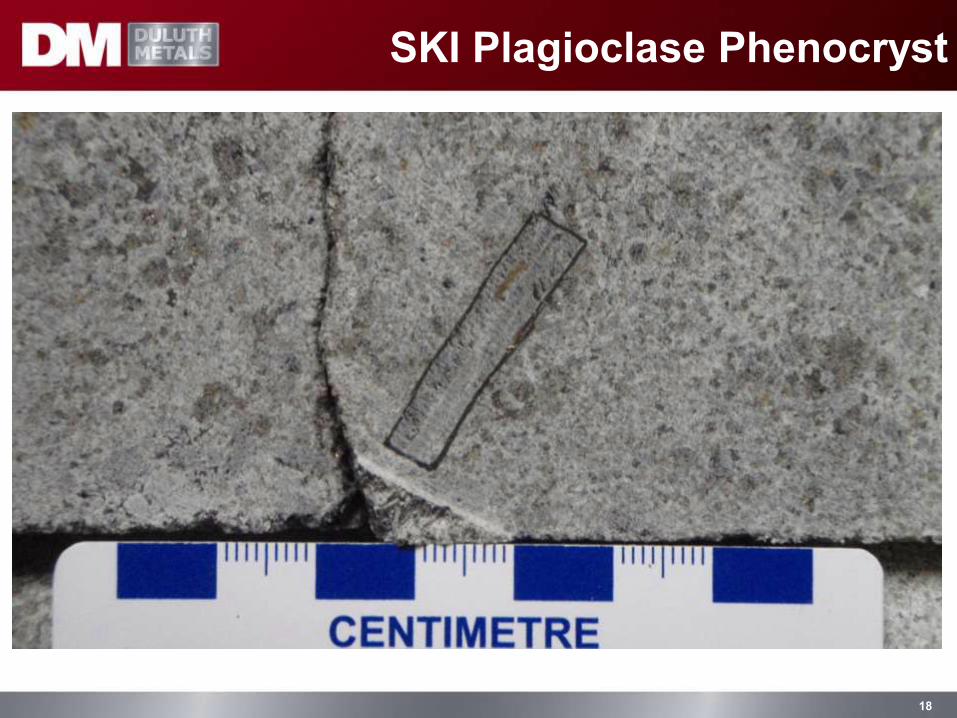
• What were the initial conditions of the magma?
– Troctolitic composition silicate melts (essentially Basalt)
– Phenocrysts of olivine and plagioclase (a crystal-liquid slurry)
– Initially sulfur super-saturated melts
• Therefore, contained sulfide droplets
• Sulfide droplets enriched in metals
17 17
18
SKI Plagioclase Phenocryst

19
Heterogeneous Troctolite

20
Heterogeneous Troctolite

Textures of SKI Rocks & Ores
Back to 1st Principals
21 21
22
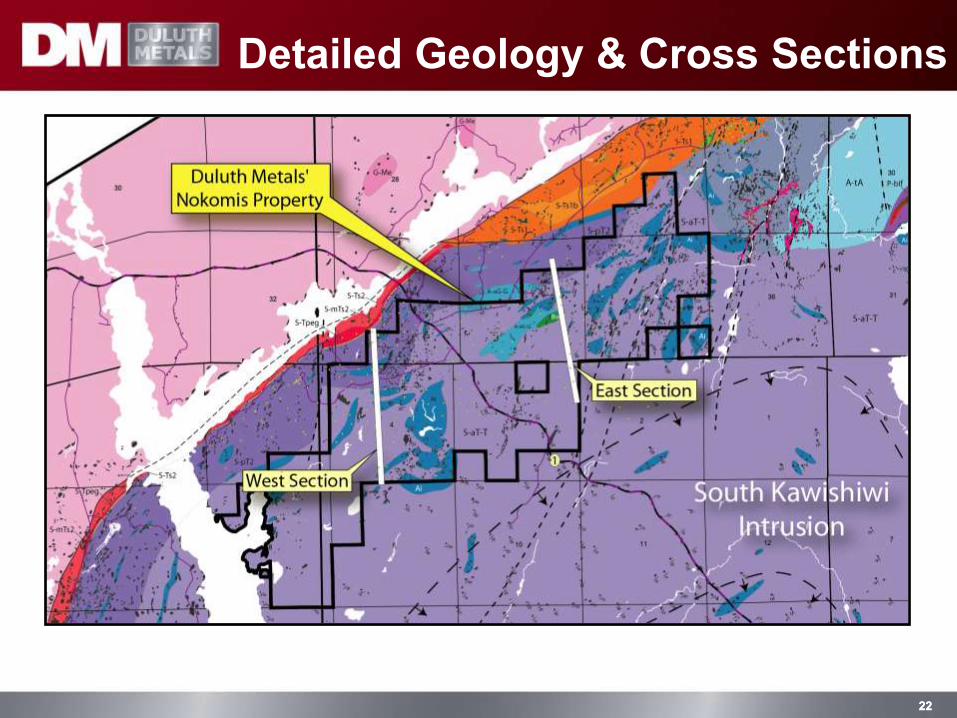
Detailed Geology & Cross Sections
22
23
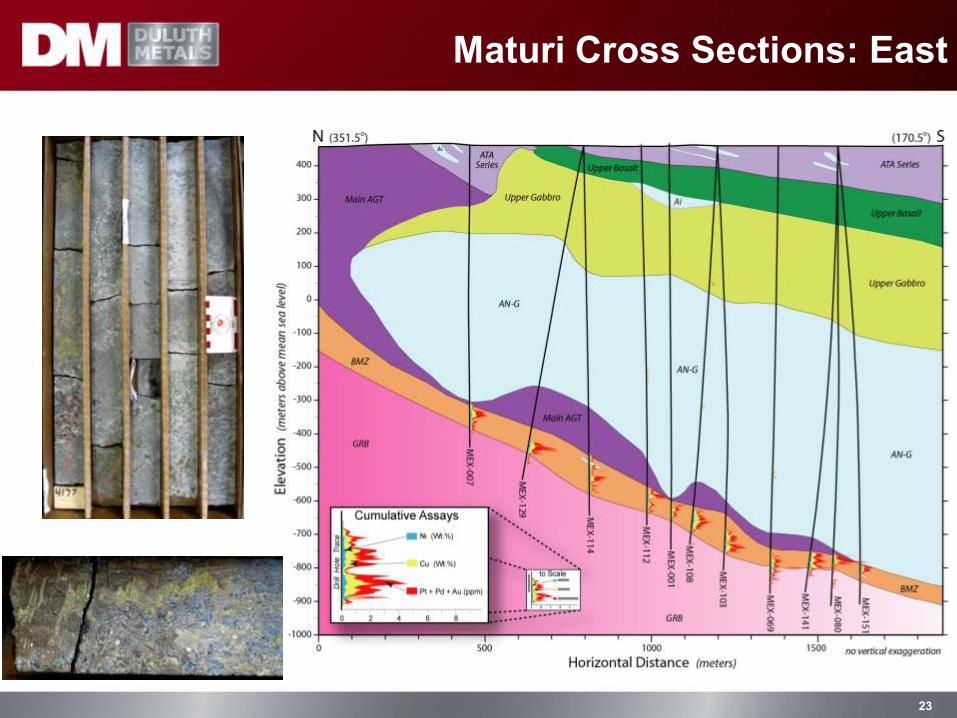
Maturi Cross Sections: East

24
Maturi Cross Sections: West
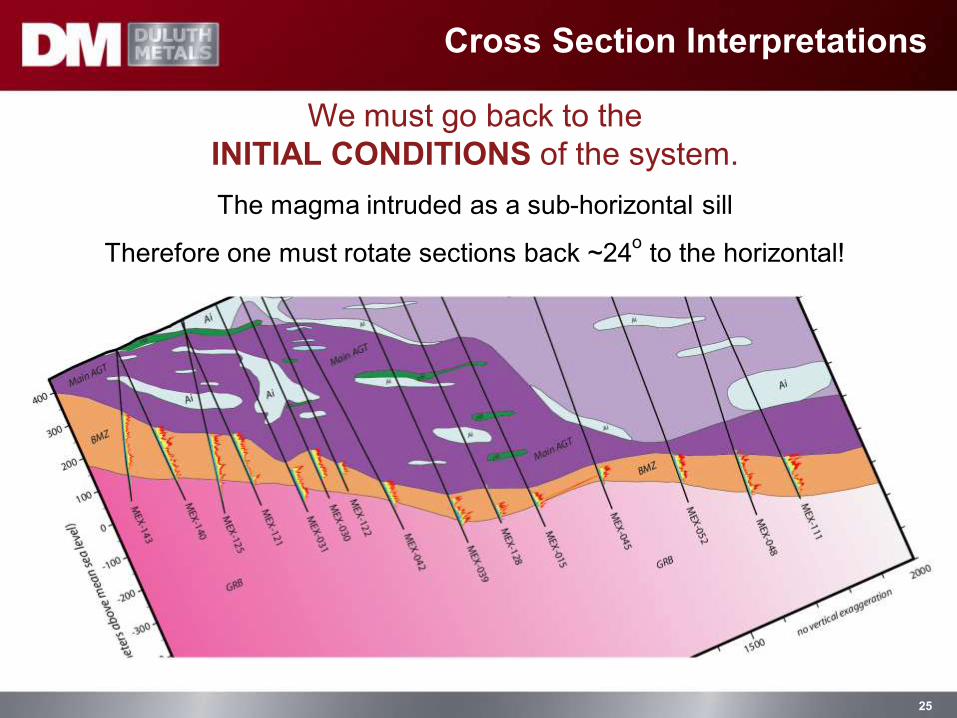
Cross Section Interpretations
We must go back to the
INITIAL CONDITIONS of the system.
The magma intruded as a sub-horizontal sill
Therefore one must rotate sections back ~24o to the horizontal!
25

Now We Can Interpret The Facts
… and understand magma channelization and its effects on
ore types and their associated grades & tonnages
26

Maturi Ore Deposit Model, circa 2009
27

Eastern High-Grade PGE Zone
28

29
Now in 2013, Prefeasibility Drill Holes
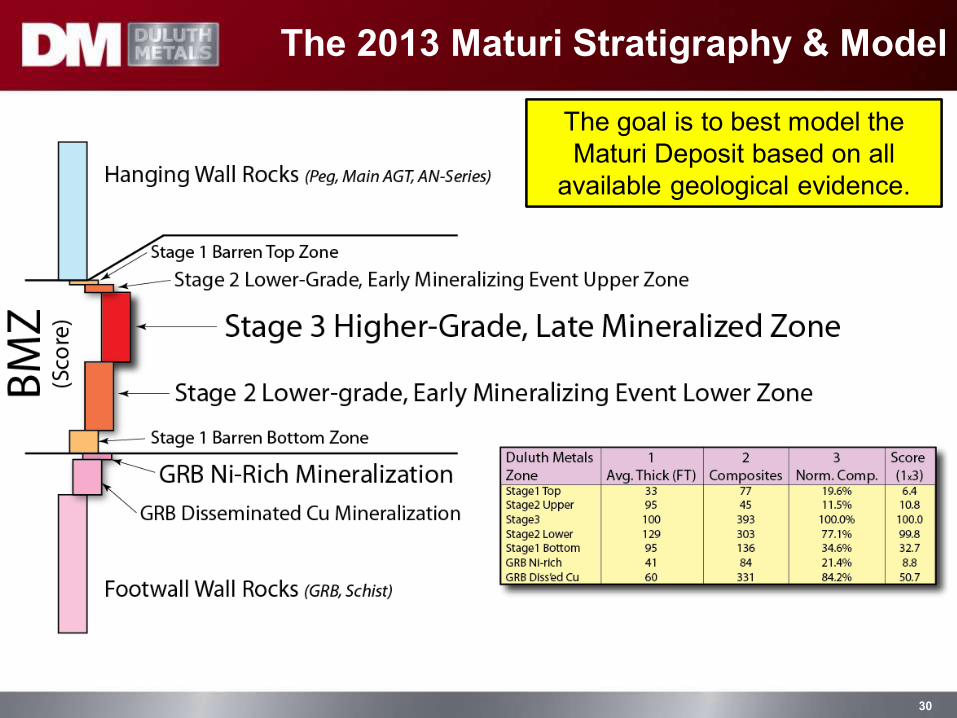
The 2013 Maturi Stratigraphy & Model
30
The goal is to best model the
Maturi Deposit based on all
available geological evidence.
The goal is to best model the
Maturi Deposit based on all
available geological evidence.

Intrusive History Model
31
Stage 1 Barren
Stage 2 Lower Grade
Stage 3 Higher Grade
Stage 1 Barren
Stage 2 Lower Grade
Stage 3 Higher Grade
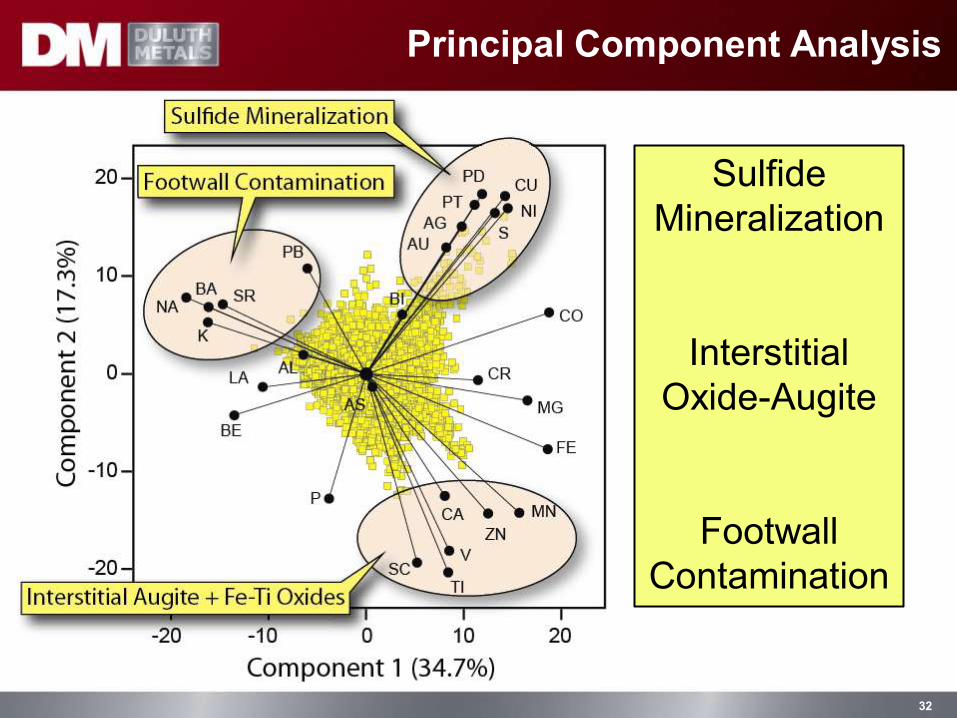
Principal Component Analysis
32
Sulfide
Mineralization
Interstitial
Oxide-Augite
Footwall
Contamination

Mineralogical Control on Ores
33
There clearly are Geometallurgical implications of the new Geological Model
Stage 3 Mineralized Zones Stage 2 Mineralized Zones

Hole by Hole Interpretation
34

35
@0.5% Cu cut-off From (ft.) To (ft.) Length (ft.) Cu (wt%) Ni (wt%) Au (ppm) Pt (ppm) Pd (ppm) Ag (ppm)
4032 4192 160 0.81 0.25 0.14 0.31 0.75 3.15
Distinct Stage 3 Magma Lobes
Lobe 3
Lobe 2
Lobe 1

Stage 1: Thickness of the Zone
36
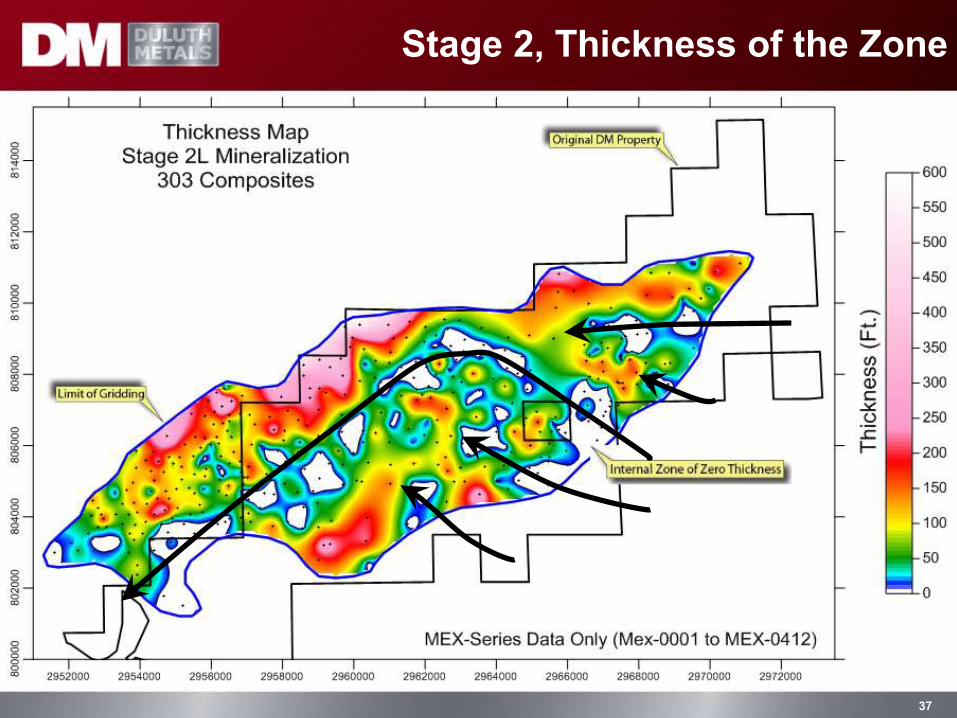
Stage 2, Thickness of the Zone
37

Stage 3, Thickness of the Zone
38
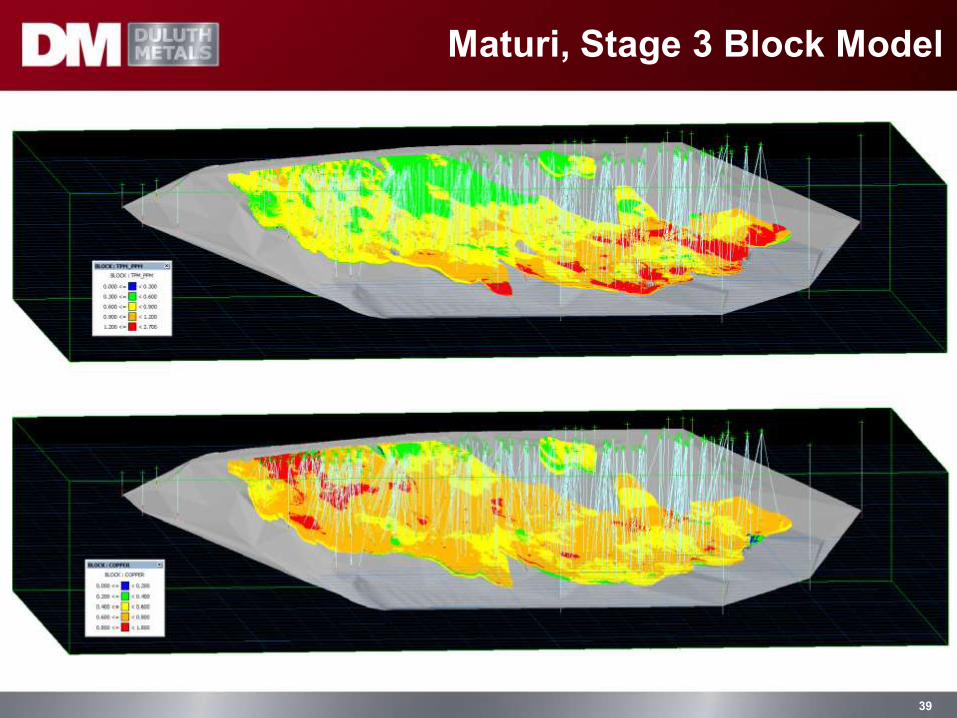
39
Maturi, Stage 3 Block Model
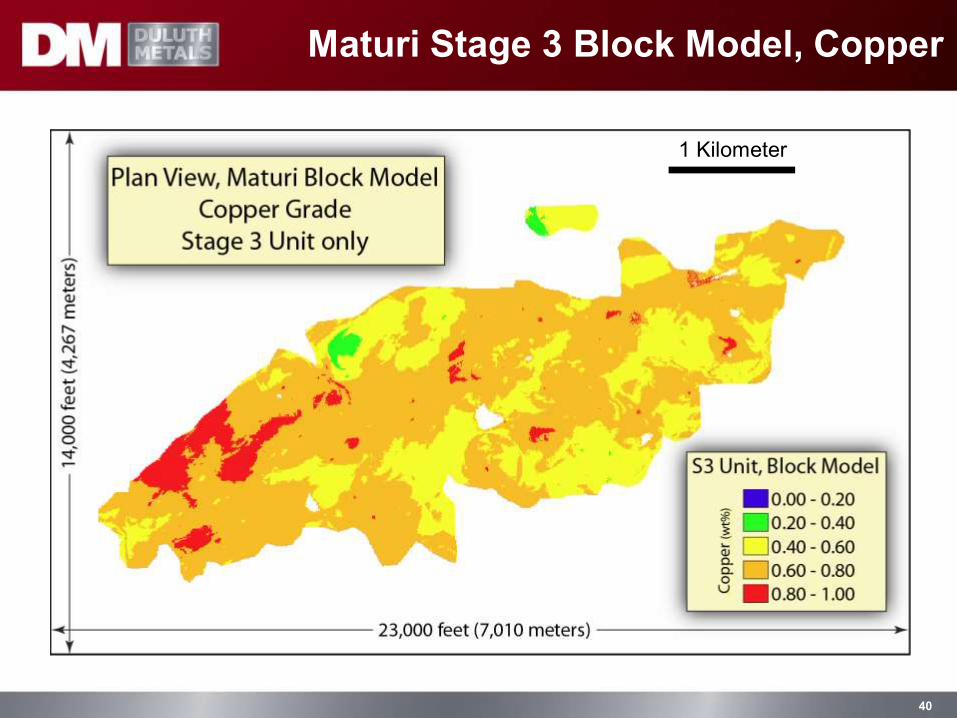
40
1 Kilometer
Maturi Stage 3 Block Model, Copper

41
1 Kilometer
Maturi Stage 3 Block Model, Nickel

42
1 Kilometer
Maturi Stage 3 Block Model, Pt+Pd+Au

43
Maturi Indicated Mineral Resources Cu Cutoff Tons Cu Ni Pt Pd Au
(%) (Mt) (%) (%) (ppm) (ppm) (ppm)
0.2 1,137 0.57 0.18 0.151 0.343 0.081
0.3 1,065 0.59 0.19 0.157 0.356 0.085
0.4 936 0.63 0.20 0.167 0.379 0.090
0.5 739 0.67 0.21 0.185 0.419 0.099
0.6 538 0.72 0.23 0.200 0.454 0.107
Maturi Inferred Mineral Resources Cu Cutoff Tons Cu Ni Pt Pd Au
(%) (Mt) (%) (%) (ppm) (ppm) (ppm)
0.2 782 0.43 0.14 0.118 0.266 0.060
0.3 542 0.51 0.17 0.140 0.320 0.072
0.4 383 0.57 0.19 0.164 0.375 0.083
0.5 256 0.63 0.20 0.197 0.443 0.098
0.6 141 0.70 0.22 0.237 0.531 0.116
Maturi Deposit, NI 43-101 Resources

44
Maturi Stage 3 Indicated Mineral Resources Maturi Stage 2 Indicated Mineral Resources Cu Cutoff Tons Cu Ni Pt Pd Au Cu Cutoff Tons Cu Ni Pt Pd Au
(%) (Mt) (%) (%) (ppm) (ppm) (ppm) (%) (Mt) (%) (%) (ppm) (ppm) (ppm) 0.2 643 0.68 0.22 0.198 0.449 0.105 0.2 440 0.45 0.14 0.092 0.210 0.053
0.3 643 0.68 0.22 0.198 0.449 0.105 0.3 405 0.46 0.15 0.094 0.215 0.054
0.4 641 0.68 0.22 0.198 0.449 0.105 0.4 292 0.50 0.16 0.100 0.228 0.058
0.5 622 0.69 0.22 0.199 0.451 0.106 0.5 117 0.58 0.18 0.111 0.253 0.065
0.6 500 0.72 0.23 0.206 0.468 0.109 0.6 38 0.67 0.20 0.119 0.276 0.071
Maturi Stage 3 Inferred Mineral Resources Maturi Stage 2 Inferred Mineral Resources Cu Cutoff Tons Cu Ni Pt Pd Au Cu Cutoff Tons Cu Ni Pt Pd Au
(%) (Mt) (%) (%) (ppm) (ppm) (ppm) (%) (Mt) (%) (%) (ppm) (ppm) (ppm) 0.2 234 0.62 0.20 0.206 0.464 0.100 0.2 240 0.41 0.14 0.084 0.200 0.049
0.3 232 0.62 0.20 0.208 0.466 0.101 0.3 199 0.44 0.15 0.087 0.210 0.052
0.4 225 0.63 0.20 0.210 0.472 0.102 0.4 127 0.49 0.16 0.095 0.228 0.057
0.5 198 0.65 0.21 0.222 0.495 0.107 0.5 50 0.56 0.18 0.105 0.252 0.064
0.6 129 0.70 0.22 0.248 0.554 0.120 0.6 11 0.64 0.20 0.115 0.277 0.070
Maturi Deposit, NI 43-101 Resources

45
The Duluth Metals Success Story
We had an intuitive geologic thought in 2006
east of the Maturi gossan and it seems to have
some legs via our recent resource estimate….
We had an intuitive geologic thought in 2006
east of the Maturi gossan and it seems to have
some legs via our recent resource estimate….

46
Thank You


