105
PETROBRAS AT A GLANCE PETROBRAS AT A GLANCE December, 2011 1

PETROBRAS AT A GLANCEPETROBRAS AT A GLANCE
December, 2011
1

DISCLAIMER
FORWARD-LOOKING STATEMENTS:
DISCLAIMER
The presentation may contain forward-looking statementsb f h h f f
We undertake no obligation to publicly update orabout future events within the meaning of Section 27A ofthe Securities Act of 1933, as amended, and Section 21Eof the Securities Exchange Act of 1934, as amended, thatare not based on historical facts and are not assurances offuture results. Such forward-looking statements merely
fl t th C ’ t i d ti t f
revise any forward-looking statements, whether asa result of new information or future events or forany other reason. Figures for 2011 on areestimates or targets.
reflect the Company’s current views and estimates offuture economic circumstances, industry conditions,company performance and financial results. Such termsas "anticipate", "believe", "expect", "forecast", "intend","plan", "project", "seek", "should", along with similar oranalogous expressions are used to identify such forward
All forward-looking statements are expresslyqualified in their entirety by this cautionarystatement, and you should not place reliance onany forward-looking statement contained in this
t tianalogous expressions, are used to identify such forward-looking statements. Readers are cautioned that thesestatements are only projections and may differ materiallyfrom actual future results or events. Readers are referredto the documents filed by the Company with the SEC,specifically the Company’s most recent Annual Report on
presentation.
NON-SEC COMPLIANT OIL AND GAS RESERVES:
CAUTIONARY STATEMENT FOR US INVESTORSspecifically the Company s most recent Annual Report onForm 20-F, which identify important risk factors that couldcause actual results to differ from those contained in theforward-looking statements, including, among otherthings, risks relating to general economic and businessconditions including crude oil and other commodity
We present certain data in this presentation, suchas oil and gas resources, that we are not permittedto present in documents filed with the UnitedStates Securities and Exchange Commission (SEC)under new Subpart 1200 to Regulation S-K becauseconditions, including crude oil and other commodity
prices, refining margins and prevailing exchange rates,uncertainties inherent in making estimates of our oil andgas reserves including recently discovered oil and gasreserves, international and Brazilian political, economicand social developments, receipt of governmental
under new Subpart 1200 to Regulation S-K becausesuch terms do not qualify as proved, probable orpossible reserves under Rule 4-10(a) of RegulationS-X.
2
and social developments, receipt of governmentalapprovals and licenses and our ability to obtain financing.

OverviewOverview
3

PETROBRAS HISTORYBecoming a major , publicly traded oil company through organic growth
Incorporated in 1953 as governmentmonopoly for all hydrocarbon activities.Little or no reserves, production orrefining.
Brazilian Government (directly andindirectly), owns 48% of Petrobras, andmaintains control with 64% of votingshares.
A history of organic, operated, self fundedgrowth. Transition from a refiner ofimported crude to integrated self
Independent financial structure, withinvestment grade foreign currency ratingsnotched above the sovereign.imported crude to integrated self
sufficiency.
End of monopoly and opening of oil sectorto international participants Petrobras
notched above the sovereign.
Listing on NYSE and SEC registration in2000 Full quarterly disclosure in IFRS andto international participants. Petrobras
status as an operator, without privilegedposition.
2000. Full quarterly disclosure in IFRS andU.S. GAAP. Market cap year‐end 2010 ofUSD 237 billion.
Incorporation in 1953 as government
l
Discovery of shallow water offshore fields Discovery of mega
fields inElimination of Monopoly, Brazil achieves
19531953 19741974 19841984 19951995‐‐88
Listing on NYSE,
20002000 20102010
USD 70 bn
20062006‐‐77
monopoly
Reserves: 16.8 million boe
Production: 2 6 Thous BPD*
Reserves:800 million BOE
Production:177 Thous. BPD
fields in deepwater Campos Basin.
Last refinery completed ‘81
Monopoly, creation of oil law. Full deregulation by 2002.
self sufficiency in oil production
Discovery of Santos Pre‐salt
with market cap of $ 31 billion
1st Investment grade rating
capitalization and acquisition of rights to produce 5 bn BOE
Production: 2MM
4
2.6 Thous. BPD
Refining Cap: 41 Thous. BDP*
Refining Cap: 823 Thous. BDP
Production:467 Thous.BPD
Production:1 MM BPD oil in Brazil in ‘98
Production: 2MM BPD oil in Brazil
* 1954

OWNERSHIPBroad distribution among government, Brazilian, and foreign shareholders
Foreign ShareholdersNon-Voting
32%30%21%
Brazilian Non-Gov’tShareholders
N V ti
Voting
20%
32%
21%
39%
23%
36%
25%
30%
18%45%
Non-VotingVoting
Brazilian Gov’t *48%40%
21%
41%
23%
45%61%55%
Oct/1992 Jul/2000 After Aug/00 After Jul/01 Dec/2009 Dec/2010
Non-VotingVoting
40%41%
Oct/1992 Jul/2000 After Aug/00 offering
After Jul/01 offering
Dec/2009 Dec/2010
Brazilian government by law must maintain control Does so with 64% of voting shareso Brazilian government, by law, must maintain control. Does so with 64% of voting shares.
o Petrobras is the most actively traded ADR on NYSE in three years, and among all stocks, the 8th mostactively traded stock. On Bovespa, Petrobras most actively traded stock, by shares and by volume.
5*Includes: Republic, BNDES, BNDESPAR, Sov. Wealth Fund

BUSINESS MODELOperating as an integrated balanced oil company, dominant in Brazil
Exploration & Production
• Focus on production in deep and ultra‐deep waters;
D
• Licensed blocks guarantee access to reserves and economies of scale;
• New exploratory frontier, adjacent to existing operations.
Downstream
• Dominant position in a growing market, far from other refining centers;
Gas and Power
•Balance and integration between production, refining and demand.
• Gas infrastructure develeped for processand and transfer of gas;Gas infrastructure develeped for processand and transfer of gas;
• Complete flexibility to consume domestic and imported gas.
Biofuels
• High productivitiy of Brazilian ethanol;
• Large areas of available unused agricultural land;
• Large consumer market, with fleet and distribution in place.
6
Large consumer market, with fleet and distribution in place.

LOGISTICAL ADVANTAGESUniquely positioned to integrate upstream and downstream operations
Upstream Operations Downstream OperationsUpstream Operations Downstream Operations
Petrobras
Existing PipelinesRefineriesMarine Terminal
Logistical Synergies Stable Cash FlowsGrowing MarketDominant Position
•Leadership in all segments of •Strong organic demand in one •Main oil producing basins and •Diversified cash flows with
Other CompaniesMarine Terminal In Land Terminal
•Leadership in all segments of the value chain
•Market position ensures economies of scale and efficient business model
•Strong organic demand in one of the fastest growing global markets
•Attractive domestic market opportunities for upstream, d t d th
•Main oil producing basins and refining located in S.E. Brazil, near GDP centers
•Logistical infrastructure fully developed
•Diversified cash flows with several growth drivers
•Reduced volatility of cash flows due to ability to smoothen prices fluctuations i th d ti k t
7
downstream and other energy segments
in the domestic market

BUSINESS SEGMENTSFully integrated across the hydrocarbon chain, dominated by Brazilian production
Adjusted EBITDA US$ 32.6 Billion1 (2010)
RTM10% G&P
2010 Proven Reserves (SPE)15.986 billion boe
Sh ll W t4%Distribution3%International6%
Shallow Water(0-300m)9%Deep Water
(300-1,500m)50%
Onshore9%
E&P77%
Ultra-Deep Water(>1,500m)
Our Main Segments: Key Statistics and Market Positions (2010)
Exploration and RTM (incl. Distribution Gas and Power International Biofuels
( 1,500m)32%
Production
• 15.3 Bn boe of 1P(SPE)
• 2.3 mm boed production
98 5% f B ili
Petrochemicals)
• 12 refineries (Brazil)
•2.0 mm bbld refining
Distribution
• 7,306 service stations
•38.8% share of distribution volume
Gas and Power
• 9,239 km of pipelines
• Participation in 20 of the 27 gas discos in
International
• 25 countries
• 0.7 Bn boe of 1P(SPE)
h b d
Biofuels
• 3 new Biodiesel Plants
• Ethanol: Opening•98.5% of Brazilian production
• 20% of global DW and UDW production
capacity
• 11.2 mty materials nominal capacity (2)
distribution volume the 27 gas discos in Brazil
• 5,943 MW of generation capacity
• 245 thous. boed production
• 281 thous. bbl/d refining capacity
•Petrochemicals Gas &
• Ethanol: Opening new markets
• Responsible for 10% of Brazilian ethanol exports
8
•Petrochemicals, Gas & Power activities
Notes: (1) Includes Corporate and Elimination; (2) Through Braskem and Quattor
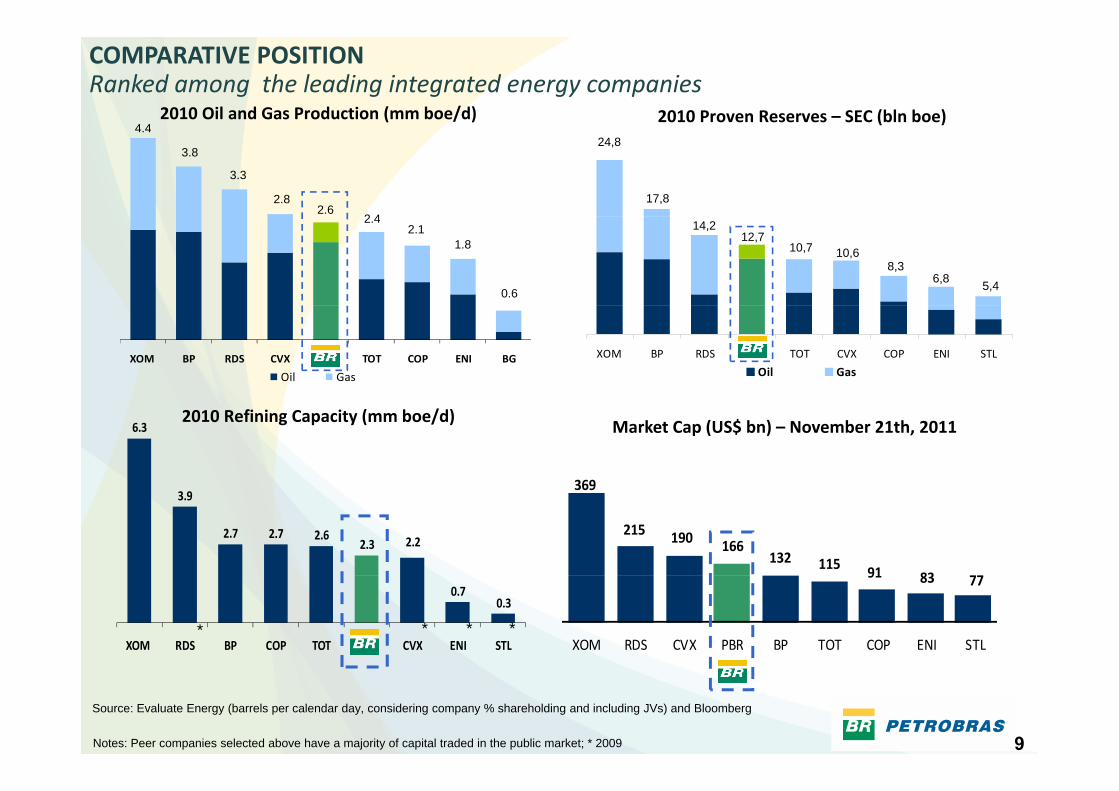
COMPARATIVE POSITIONRanked among the leading integrated energy companies
2010 Proven Reserves – SEC (bln boe)2010 Oil and Gas Production (mm boe/d)4 44.4
3.8
3.3
2.82.6
2 4
24,8
17,8
2.42.1
1.8
0.6
14,212,7
10,78,3
6,8 5,4
10,6
XOM BP RDS CVX BR TOT COP ENI BG
Oil Gas
XOM BP RDS BR TOT CVX COP ENI STL
Oil Gas
6.32010 Refining Capacity (mm boe/d)
Market Cap (US$ bn) – November 21th, 2011
3693.9
2.7 2.7 2.62.3 2.2
369
215 190 166132 115 91 83
0.70.3
XOM RDS BP COP TOT BR CVX ENI STL
91 83 77
XOM RDS CVX PBR BP TOT COP ENI STL* * **
9Notes: Peer companies selected above have a majority of capital traded in the public market; * 2009
Source: Evaluate Energy (barrels per calendar day, considering company % shareholding and including JVs) and Bloomberg
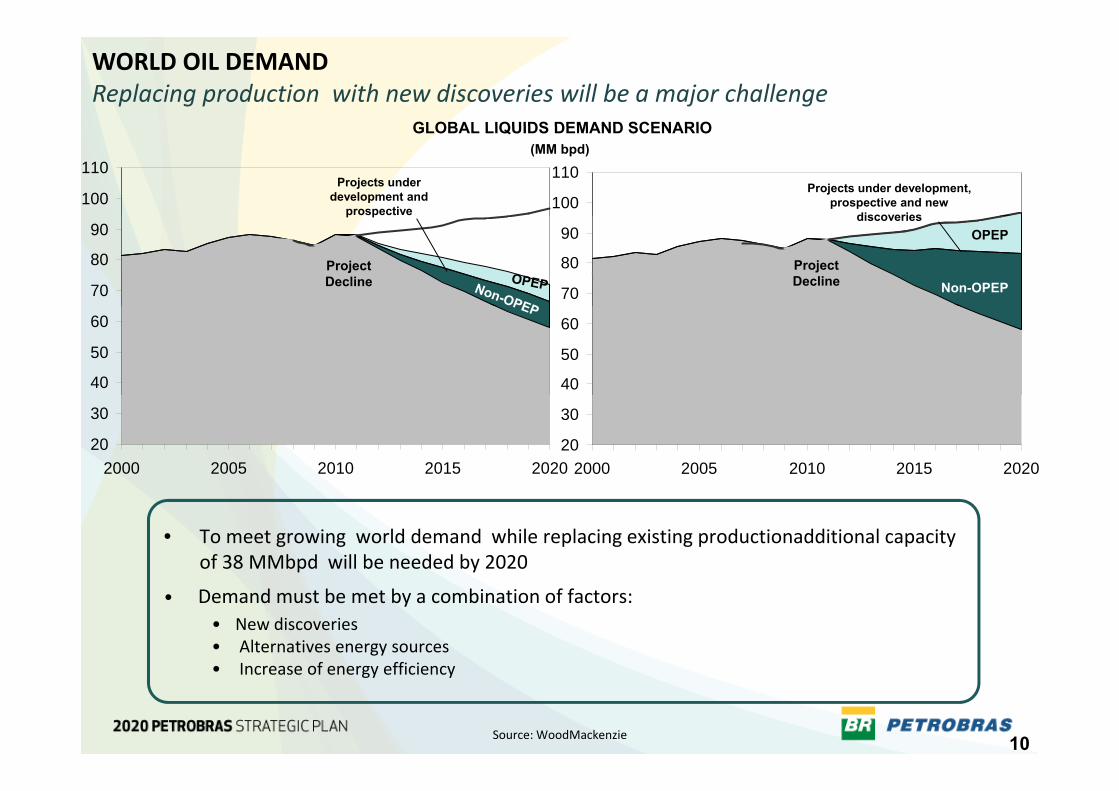
GLOBAL LIQUIDS DEMAND SCENARIO
WORLD OIL DEMANDReplacing production with new discoveries will be a major challenge
100
110
100
110(MM bpd)
GLOBAL LIQUIDS DEMAND SCENARIO
Projects underdevelopment and
prospective
Projects under development, prospective and new
discoveries
70
80
90
70
80
90p p
Project Decline
Project Decline Non-OPEP
OPEP discoveries
40
50
60
40
50
60
20
30
2000 2005 2010 2015 202020
30
2000 2005 2010 2015 2020
• To meet growing world demand while replacing existing productionadditional capacity of 38 MMbpd will be needed by 2020
• Demand must be met by a combination of factors: • New discoveries• Alternatives energy sources
I f ffi i
10
• Increase of energy efficiency
Source: WoodMackenzie

BRAZIL LEADERSHIP IN RECENT DISCOVERIESDeep‐water discoveries in Brazil represent 1/3 of the worldwide discoveries in the last 5 years
New Discoveries 2005‐2010
(33,989 million bbl) Deep‐Water Discoveries
62%38% BrasilBrazil62%
OutrosOther
Other Discoveries Deep-Waters
• In the last 5 years, more than 50% of the new discoveries (worldwide) were made in deep waters
• The development of these reserves will demand additional capacity from the supply chain
• Expansion of the oil and gas chain in Brazil is in line with this perspective
Petrobras expects to double its proved reserves until 2020, keeping the discovery cost around US$2/boe
11Source: PFC Energy

COMPETIVE ADVANTAGEReserves in ultra‐deep water in Brazil benefit from comparatively low break‐even
Expected Costs of Production
140
D t d
S$/bbl‐200
8)
80
100
120Deepwater and Ultra‐deep water
Oil Shales
Gas to liquids
Coal to liquids
uction
costs (U
40
60
80
CO₂ ‐
EOR
EOR Arctic
Heavy oil and
bitumen
Shales liquids liquids
Prod
u
20 Produced MENA
Other convention
al oilPetrobras expected maximum break‐even cost
Reserves (bn bbls)
1000 2000 3000 4000 5000 6000 7000 8000 9000 100000
12Source: IEA – Outlook 2008

DEEPWATER LEADERSHIPA history of developing technology and know‐how in Brazilian waters
1977Enchova410ft125m
1988Marimbá1 610ft1,610ft491m
1994Marlim3,370ft1,027m
1997Marlim Sul5,600ft1,707m
2003Roncador6,180ft
2009Lula
7,125ft2,172m
45Petrobras
1,707m ,1,884m
2,172m
Deepwater Production2010 Gross Global Operated¹
Offshore Production Facilities
12
13
15
15
45
BP
ExxonMobil
StatoilHydro
Shell
Petrobras
8
8
9
10
12
C Philli
CNOOC
Total
Anadarko
Chevron
100
5
8
0 20 40 60 80 100
Others
ENI/Agip
ConocoPhillips
FPSO Semi Spar TLP Other
13
FPSO Semi Spar TLP Other
Source: PFC Energy Note: (1) These 15 operators account for 98% of global deepwater production in 2010. Minimum water depth is 1,000 feet (about 300 meters)

OIL PRODUCTIONWith access to abundant reserves, Petrobras can more than double production
1 120
246142
6,418
618
1.120
180
125
3,993
2,772+ 35 Systems
2 575
321 317 334 435
618
111 132 14414199 96
93 962,386 2,516
oe/day
2,772
845Transfer of Rights
+10 Post‐Salt Projects
+8 Pre‐Salt Projects
+1 Transfer of Rights
2,575
3,070
4,910
1.855 1.971 2.004 2.100
2008 2009 2010 2011 2015 2020
1,148543
Pre-Salt’000
b Transfer of Rights13
Added Capacity
Oil: 2,300,000 bpd
2008 2009 2010 2011 2015 2020
Oil Production‐ Brazil Natural Gas Production ‐ Brazil Oil Production ‐ International Natural Gas Production ‐ International
• Pre‐salt and Transfer of Rights will represent 69% of the additional capacity up to 2020;
• Pre‐Salt participation in the total production will enhance from the current 2% to 18% in 2015 and 40.5% in 2020.
14Note: Does not include Non‐Consolidated International Production.

2010 TOTAL OIL CONSUMPTION* (MM BPD)
GROWING MARKETBrazil is the world’s seventh largest oil consumer and growing fast
9,06
2010 TOTAL OIL CONSUMPTION (MM BPD)*Includes ethanol and biodiesel
>3 MM bpd 2-3 MM bpd <2 MM bpd19,15
4,45
3,32 3,20 2,81 2,60 2,44 2,38 2,28 1 99, 2,28 1,99 1,80 1,74 1,59
27 1 1980Barrels per year
PER CAPITA OIL CONSUMPTION
15,314,8
27,1
12,4
16,0
25,0
9 912,8
22,3
2010
2000
1980
0,63,7 1,4
4,52,5
4,9
9,9
15Sources: BP Statistical Review / Petrobras estimates
OECD
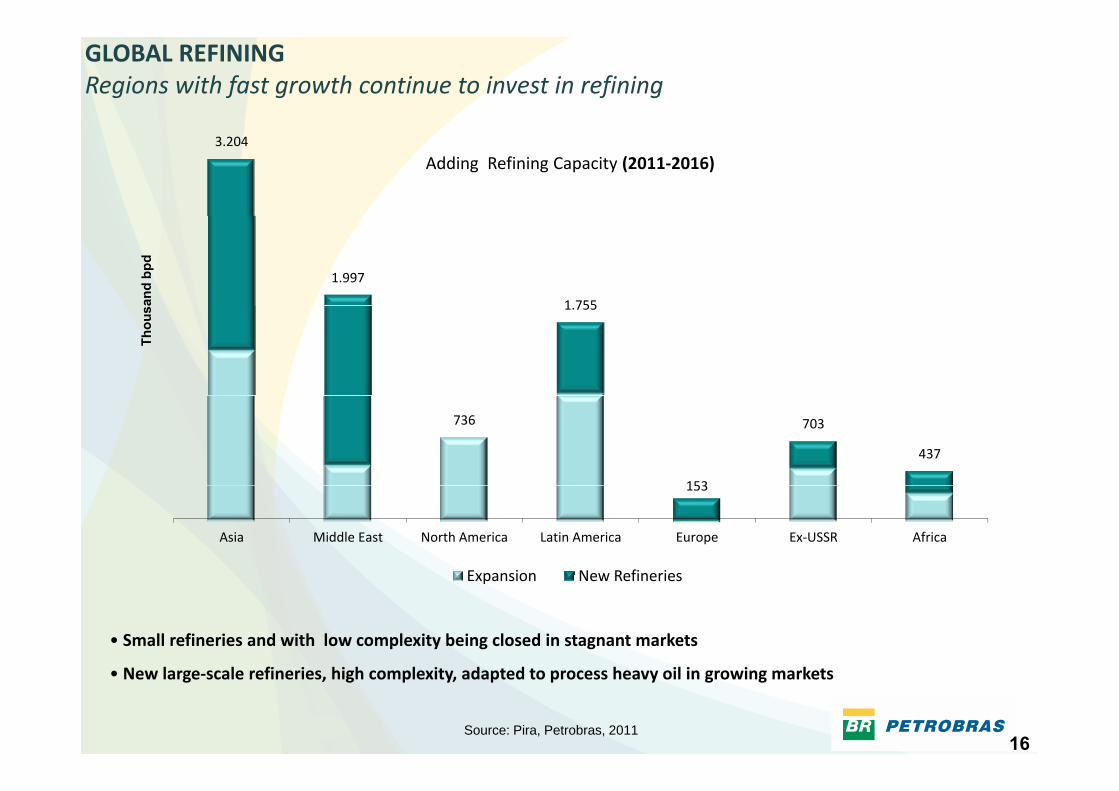
GLOBAL REFININGRegions with fast growth continue to invest in refining
3.204
Adding Refining Capacity (2011‐2016)
1.997
1 755and
bpd
1.755
Thou
s
736
153
703
437
153
Asia Middle East North America Latin America Europe Ex‐USSR Africa
Expansion New Refineries
• Small refineries and with low complexity being closed in stagnant markets
Expansion New Refineries
16
• New large‐scale refineries, high complexity, adapted to process heavy oil in growing markets
Source: Pira, Petrobras, 2011

PRODUCT PRICING Free market follows international prices in the long term
140
160 US$/bbl2002-2011
Average Realization Price ‐ Brazil
Average Realization Price ‐ USA
80
100
120
40
60
20
2011201020092008200720062005200420032002
• Petrobras policy lags the international oil market when prices increase or decrease, leading to more stable cash flows
I N b 10% i i li 2% i i di l i
17
• In November, 10% increase in gasoline, 2% increase in diesel prices

Exploration & ProductionExploration & Production
18

E&P STRATEGYSustainable development of hydrocarbon reserves
Increase oil and gas reserves and production, in a sustainable manner, and be recognized for its excellence in E&P operations, placing the Company among the world’s
five largest oil producers
2011‐15 Business Plan Highlights:
• 65% of Capex allocated to production development.
• 19 large projects, adding capacity of 2.3 million bpd.19 large projects, adding capacity of 2.3 million bpd.
• Drilling of more than 1,000 offshore wells, of these 40% is exploratory and 60% is production developmentdevelopment.
• In 2020, the pre‐salt production will correspond to 40.5% of the oil production in Brazil.
19

Proved Reserves – SPE criteria
RESERVES AND RECOVERABLE VOLUMESRapid growth in reserves from discoveries in deep waters
30.000
Million boe
25.000
15 000
20.000
Whales Park
Pre‐salt: Lula and Cernambi 15,28 Bi boe
10.000
15.000
Roncador
Whales Park, Mexilhão
5.000Garoupa
Namorado
Marlim
Guaricema
0
pCarmópolis
20
Onshore 0‐300 m 300‐1500 m > 1500 m Pre‐salt's Recoverable Volume Transfer of Rights
* Lula/Cernambi, Iara, Guará and Whales Park, ranging from 8.1 to 9.6 Billion boe
*

RESERVE PROFILEProved reserves consist largely of offshore oil that is relatively heavy
Proven Reserves as of Dec/2010 (SPE/ANP)(15.28 billion boe)
Oil + Condensate
< 22º API(heavy) 22 – 31 º API
84%
34%45%
(heavy)(intermediate)
5%11%Associated Gas
15% 6%
Gas > 31 º API (light)
Non‐Associated Gas
( g )
39%DevelopedProven Reserves
UndevelopedProven Reserves
39% 61%
21
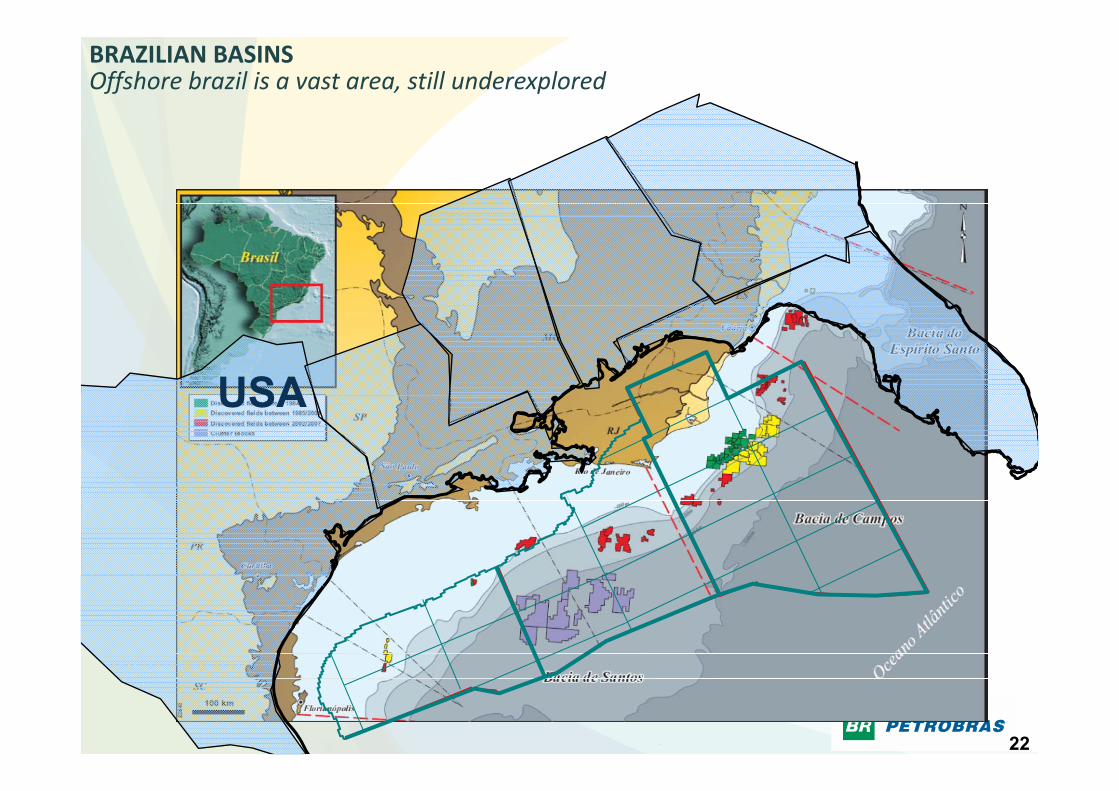
BRAZILIAN BASINSOffshore brazil is a vast area, still underexplored
USAUSA
22t

PRODUCTIONPetrobras history is to grow production by expanding into new frontiers
2500 Deep water
Shallow water 2.004
ThousandThousand bpdbpd
2000Onshore
1500
1601
1.271
1000
42
749653
500
211 230 21475
400 292 189
42
181
0
1980 1990 2000 2010
106 211 230 214
23
Onshore Shallow water Deep water Deep and ultra‐deep water
Pre‐salt

Campos Basin Santos Basin
OFFSHORE GEOLOGYProducing from pre‐salt reservoirs will drive future investment
Campos Basin Santos Basin
EastWest
PostPost--salt turbidites:salt turbidites:current productioncurrent production
Albian carbonates
Pre-salt carbonatesPre-salt carbonates:Supergiants oil fields
Near term prod ction increase Mid and long term prod ction increase
24
Geological cross section in Santos Basin used to explain petroleum systems of Santos and Campos basins
Near-term production increase Mid and long-term production increase

E&P FOCUSMaintain and expand traditional areas, while transitioning to new reservoirs
Tertiary and Upper
E&P portfolio has around 3,000 projectsE&P portfolio has around 3,000 projects
1 • Maintain production:
• Implement full development of the main production 1
Tertiary and Upper CretaceousTurbidites
concessions.
• Decrease decline in existing fields.
• Operational maintenance in existing Production Systems.
Albian carbonates
Salt
• Continuous exploration effort.2
Pre‐salt carbonates
SantosCampos
2 • Explore, appraise and start production mostly in existing Production Systems (inside existing ring fences).3 4
3 • Explore, appraise and start production mostly in existing Production Systems (inside existing ring fences).
4 • Explore & appraise. Extended Well Tests in main discoveries. Start production of pilot projects. Declare commerciality. Reduction of the project implementation time: equipments standardization,
25
y p j p q parrival of new drilling rigs, replicante FPSOs.
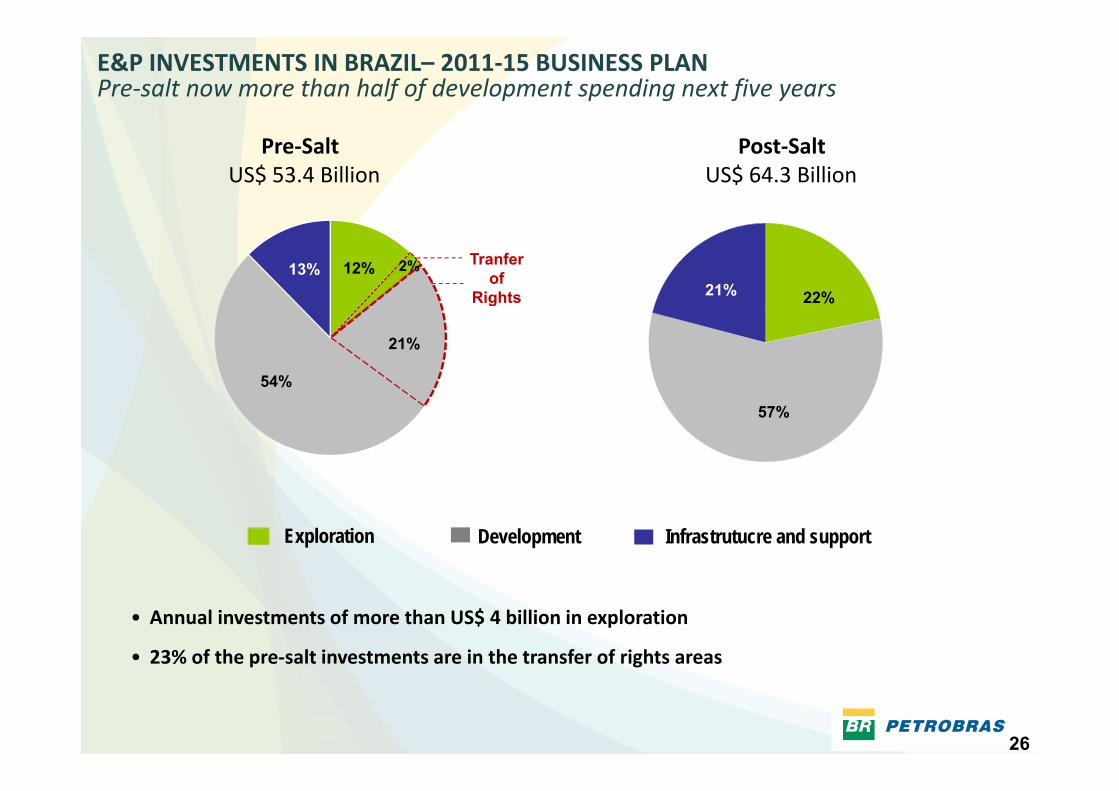
E&P INVESTMENTS IN BRAZIL– 2011‐15 BUSINESS PLANPre‐salt now more than half of development spending next five years
Pre‐SaltUS$ 53.4 Billion
Post‐SaltUS$ 64.3 Billion
22%21%12% 2%13% Tranfer
ofRights
54%
21%
g
57%
Exploration Development Infrastrutucre and support
• Annual investments of more than US$ 4 billion in exploration
• 23% of the pre‐salt investments are in the transfer of rights areas
26
p g
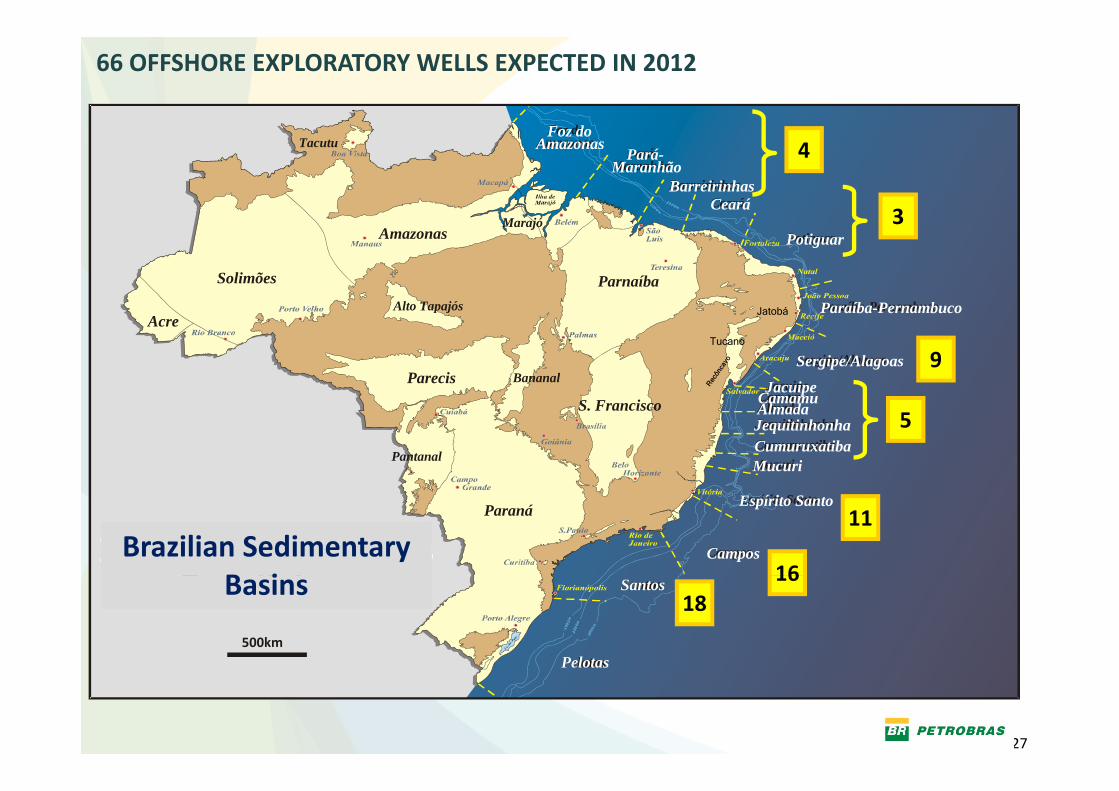
66 OFFSHORE EXPLORATORY WELLS EXPECTED IN 2012
F dF d
Mar Mediterrâneo CearáCeará
TacutuPará-
MaranhãoPará-
Maranhão
Foz doAmazonas
Foz doAmazonas
BarreirinhasBarreirinhas
3
4
PotiguarPotiguar
Solimões
Amazonas
Paraíba PernambucoParaíba Pernambuco
ParnaíbaAlto Tapajós
Marajó 3
Sergipe/AlagoasSergipe/AlagoasParecis
Paraíba-PernambucoParaíba-PernambucoAlto TapajósAcre
BananalCamamuC
JacuipeJacuipe
Tucano
Jatobá
9
PantanalCumuruxatibaCumuruxatibaJequitinhonhaJequitinhonhaAlmadaAlmadaCamamuCamamu
MucuriMucuri
pS. Francisco
5
Espírito SantoEspírito SantoParaná
CamposCampos16
11Brazilian Sedimentary
B i
lh500km
SantosSantos
PelotasPelotas
1618
Basins
27
Mar VermelhoPelotasPelotas

MAIN PROJECTSLarge projects sustain production increases Pre‐Salt and Transfer of
Rights Projects
NG Projects
P S l P j
Lula PilotFPSO BW Cidade Angra dos Reis100.000 bpd Lula NE
Juruá GNA
F 1
EWTs
Post‐Salt Projects
p
Cachalote andBaleia Franca FPSO Capixaba100.000 bpd
Guará (North) FPSO Cidade de
IlhabelaParque das Baleias
FPSO P 58
MexilhãoJaquetaHG
Guará Pilot 2FPSO Cidade de
São Paulo120.000 bpd
FPSO Cidade de Paraty
120.000 bpd
FPSO P‐67 Replicant 2Tambaú
Franco 1 Transfer of Rights
FPSO P‐74 150.000 bpd
3.070Mil bpd
Marlim Sulmodule 3
Baleia AzulFPSO Cidade de
Anchieta100.000 bpd
Papa‐Terra TLWP P‐61 &FPSO P‐63
Ilhabela150.000 bpd
FPSO P‐58180.000 bpdUruguá
FPSO Cidade de Santos
35.000 bpd
120.000 bpd
Cernambi SouthFPSO Cidade de Mangaratiba150 000 bpd
Replicant 2150.000 bpdLula Central
Tambaú FPSO Cidade de
SantosNG
2.004 2.100
2000
2500
3000module 3SS P‐56
100.000 bpd
JubarteFPSO P‐57180.000 bpd
(FPSO Espadarte reallocation)
RoncadorRoncador
150.000 bpd150.000 bpd
FPSO P‐66Replicant 1150.000 bpdLula Alto
Baleia AzulFPSO
1000
1500
2000 Roncador Módule 4 FPSO P‐62180.000 bpd
Roncador module 3SS P‐55
180.000 bpd
Tiro/SidonFPSO Cidade de
Tiro PilotSS‐11
Atlantic Zephir30.000 bpd ESP/MarimbáAruanã
FPSO
MarombaFPSO
100.000 bpdSiri
Jaqueta e FPSO
FPSO60.000 bpd
EWTs Lula NE e Cernambi
FPSO BW Cidade São Vicente30.000 bpd
0
500
1000 Itajaí80.000 bpdEWT Guará
FPSO DynamicProducer30.000 bpd
FPSO 40.000 bpd
FPSO 100.000 bpd
50.000 bpd
4 EWTsPre‐salt
EWT Carioca FPSO Dynamic
Producer30.000 bpd
3 EWTsPre‐salt
5 EWTsPre‐salt
5 EWTsPre‐salt
28
0
2010 2011 2012 2013 2014 2015

NEW PRODUCTION UNITS 2012Production capacity growth above 400 thousand bpd during the period
Development ProjectCapacity
(thousd. bpd)Petrobras % Forecast
Tambaú Natural Gas 100% PBR 1Q 2012
Pilot Baleia Azul (Pre salt) 100 100% PBR 3Q 2012Pilot Baleia Azul (Pre‐salt) 100 100% PBR 3Q 2012
Tiro Sidon 80 100% PBR 3Q2012
Roncador mod. 3 SS P‐55 180 100% PBR 4Q 2012
Pilot Guará (Pre‐salt) 120 45% PBR 4Q 2012
Additional Total Capacity ‐ Petrobras: 414 thousand bpd
o 8 ultra deepwater rigs have arrived during 2011. 15 more contracted to arrive by end of 2012.
o Additional rigs will accelerate ramp‐up of new systems.
29

New Units in Campos B i 2011 15
New UnitsFPSO
FPSO Espadarte
P‐58
201120122013Basin: 2011-15 2011
P‐56 – 100.000 bpd
2012
FPSO Espadarte
20142015
P‐62
P‐55
P‐55 – 180.000 bpd
FPSO Espadarte – 100.000 bpd
2013P‐58 – 150.000 bpd
P‐61 – 150.000 bpd
P‐62 – 180.000 bpd
P 63 150 000 bpd
P‐56FPSO
P‐63 – 150.000 bpd
FPSO (Marimbá) – 40.000 bpd
FPSO (Aruana) – 100.000 bpd
2014FPSO (Baleia Azul) – 60.000 bpdFPSO
20152015FPSO (Maromba) – 100.000 bpd
30
FPSO
P‐61
P‐63

2010
PRODUCTION SYSTEMS7 new systems until 2015, having already hired six
Lula Pilot
FPSO Cidade Angra dos Reis – 100.000 bpd
The 1st production well in Lula Pilot reached 36,000 boed (28,000 bpd of oil), being the36,000 boed (28,000 bpd of oil), being the most prolific well from Petrobras
2012Guará Pilot
2013
Guará Pilot
FPSO Cidade de São Paulo – 120.000 bpd
Lula Northeast
FPSO Cidade Paraty – 120.000 bpd
2014Guará North
FPSO – 150.000 bpd
Cernambi
FPSO – 150.000 bpd
2015Lula Central
FPSO – 150.000 bpd
Franco – Transfer ofRights
31
Lula High
FPSO – 150.000 bpd
FPSO – 150.000 bpd

VARREDURA PROJECTTechnological development and exploratory optimization in existing concessions
• Additional recoverable volume from discoveries:
Varredura ProjectDescobertas do Pr é-sal na Bacia de Campos2009/10 (VARREDURA)
Discoveries in Pre‐salt Campos Basin 2009/10 (Varredura)
• Post‐salt: Marimbá, Marlim Sul and Pampo:1,105 MM boe;
• Pre‐salt: Barracuda, Caratinga, Marlim, MarlimLeste, Albacora and Albacora Leste: 1,130 MMboe*.
•Well productivity exceeds 20,000 bpd
67 exploratory wells will be drilled between 2011 and 2015 in production areas in
Campos basin
32*No volumes have been announced regarding the Marlim Leste and Albacora Leste discoveries.
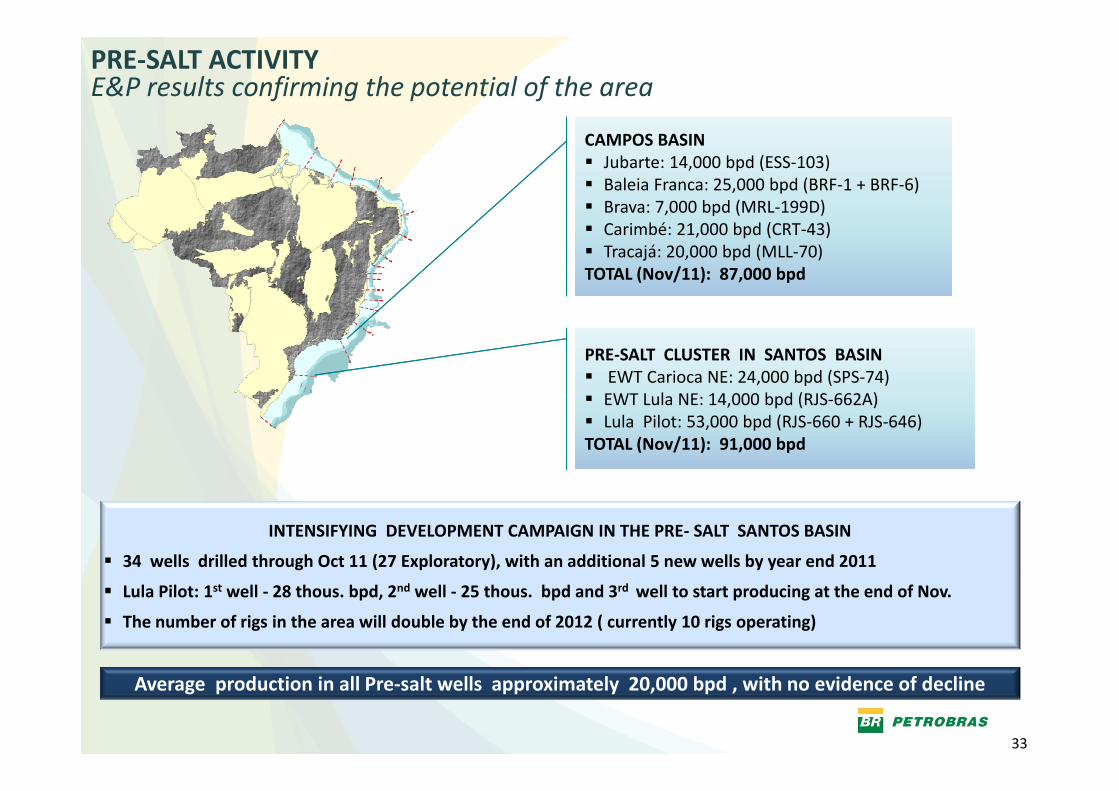
E&P results confirming the potential of the areaPRE‐SALT ACTIVITY
CAMPOS BASIN Jubarte: 14,000 bpd (ESS‐103) Baleia Franca: 25,000 bpd (BRF‐1 + BRF‐6) Brava: 7,000 bpd (MRL‐199D) Carimbé: 21,000 bpd (CRT‐43) Tracajá: 20,000 bpd (MLL‐70)TOTAL (Nov/11): 87,000 bpd
PRE‐SALT CLUSTER IN SANTOS BASIN EWT Carioca NE: 24,000 bpd (SPS‐74)
EWT L l NE 14 000 b d (RJS 662A) EWT Lula NE: 14,000 bpd (RJS‐662A) Lula Pilot: 53,000 bpd (RJS‐660 + RJS‐646)TOTAL (Nov/11): 91,000 bpd
INTENSIFYING DEVELOPMENT CAMPAIGN IN THE PRE‐ SALT SANTOS BASIN
34 wells drilled through Oct 11 (27 Exploratory), with an additional 5 new wells by year end 2011
Lula Pilot: 1st well ‐ 28 thous. bpd, 2nd well ‐ 25 thous. bpd and 3rd well to start producing at the end of Nov.
The number of rigs in the area will double by the end of 2012 ( currently 10 rigs operating)
33
Average production in all Pre‐salt wells approximately 20,000 bpd , with no evidence of decline

NEW TECHNOLOGIESPetrobras is implementing cutting‐edge technologies
OIL/WATER SUBSEA SEPARATION
‐ Resolves limitations from growing
RAW WATERINJECTION
‐ Increases production in existingResolves limitations from growingwater production
‐ Separates water and oil under the sea, reinjecting water and relieving h i f h f i
Increases production in existingsystems
‐ 3 subsea systems for pumping raw water (with little treatment) to
i h i i ithe size of the surface equipment on the platform
‐ Field: Marlim (Nov/2011)
pressurize the reservoir, increasing recovery factor without increasing surface systems. Pioneer in the world in such water depth
34
‐ Field: Albacora (Dec/2011)

bbl/d
PRODUCTION BEHAVIORReservoirs and equipments set production over time
bbl/d
Potential1
Natural decline of reservoir *Possible causes:‐ decrease in reservoir pressure
Production1 Potential2
Production2
‐ increase jn water production
* Assuming 100% efficiency of the equipment installed
2
Actual production, a combination of:‐ Natural decline of the reservoir and ‐ Equipment efficiency- problems with lift;hydrate formation in the collection line;compression failures;power outages;t t
Time power outages;equipment failures;scheduled and unscheduled maintenanceetc...
t1 t2
o 2011 production decline in some fields above historical rates was due to reducedequipment efficiency, not geology.
35
oOn average, reservoir decline was below expected.

PRODUCTION ‐ 2011Production below target mostly explained by unplanned maintenance
l d i
25.000Unprogrammed Stoppages
Production loss due to operational causes – effect on annual production
bpd
)
Unplanned maintenance and additional time for
planned maintenance in the 9M11 lowered production
15.000
20.000 Programmed Stoppages
(tho
usd.
9M11 lowered production by an average of 44
thousand bpd in the year
0
5.000
10.000
01Q 2Q 3Q
Other factors that reduced production relative to targets
o Delays in the completion and connection of wells, due to the late arrival of new rigs fromo Delays in the completion and connection of wells, due to the late arrival of new rigs frominternational shipyards.
o Logistical and market restrictions reduced production of natural gas, in turn reducing oilproduction by 20 thousand. Bpd during 9M11 (Uruguá: 10 thousd. bpd; Lula: 10 thousd. bpd)
36
production by 20 thousand. Bpd during 9M11 (Uruguá: 10 thousd. bpd; Lula: 10 thousd. bpd)

LIFTING COSTSCosts pressured by a combination of factors during first nine months of 2011
$$ US$/barrilR$/barril
104.97
117.36113.46
175.30
187.78 186.07
76.86
86.48
30.48 31.25
24 67 25 58
35.0050.66
54.11
42.72 43.47
55.14134.51
147.02
24.26 26.1331.66
34.21 31.80
14.07 15.2919.10
21.8817.88
24.67 25.58
18.46 17.34 19.00 20.93 22.3110.60 10.29 11.38 13.12 13.37
3Q10 4Q10 1Q11 2Q11 3Q11 3Q10 4Q10 1Q11 2Q11 3Q11
Lifting costBrent Government take
o In 3Q11 lifting costs increased by provisioning for 2011 Collective Bargaining Agreement, under negotiation.
37
o Increasing lifting cost trend in 2011 as a result of start‐up of new production systems, increase in planned andunplanned stoppages and higher oil prices affecting service and energy costs.

E&P PROFITABILITY IN BRAZIL
E&P Net Income ($/boe)l
Profitability of oil Production in Brazil fully exposed to oil pricesE&P Net Income ($/boe)
20
25
Brent vs. E&P Net income per Barrel
10
15
20
per B
arrel (US$)
0
5
10
Peer RangePetrobrasPeers
Net income
60%E&P ROCE
02005 2006 2007 2008 2009 2010
Brent (Average in dollars)
30%
40%
50%• E&P profitability strongly correlated to oil price
• Production in Brazil: 86% oil and 14% gas
• Higher net profit per barrel yields better return
10%
20%
30%
Peer Range
g p p ythan its peers
• Stable regulatory environment allows for capturing the benefits of the increase in oil prices Petrobras
Peers
38
0%2005 2006 2007 2008 2009 2010
Peers: BP, CVX, XOM,RDS, TOTSource: PFC Energy

PROFITABILITYNew E&P projects generate attractive returns
40,0%
45,0%
Key Assumptions:
30,0%
35,0% • 150,000 bpd FPSOs
• Production of 500 MM barrels
• Ramp‐up in line with industry
15,0%
20,0%
25,0% • Ramp‐up in line with industry
• Historic decline rate
• Oil value = 95% Brent
5,0%
10,0%
15,0%• Does not include exploration and acquisition costs
0,0%60 70 80 90 100 110
Case 1 – US$12/boe Capex / US$5/boe Opex
Case 2 US$15/boe Capex / US$7/boe Opex
(expected scenario)
US$/ bbl
h h ill h b fi i f d d d i
Case 3 – US$12/boe Capex / US$5/boe Opex without Special Interest (such as Transfer of Rights)
Case 2 – US$15/boe Capex / US$7/boe Opex
39
• The graph illustrates the cost‐benefit ratio of a standard productiondevelopment in Brazil, using assumptions based on previous experiences

DISTRIBUTION OF UPSTREAM REVENUESIn higher oil price environment, net income per BOE benefits from concession terms
Distribution of the Realization Price of a Barrel of Domestically Produced Oil
$ per Barrel Realization Price % Share of Realization Price
80,0%
100,0%
$70,00
$90,00
60,0%
80,0%
$50,00
20,0%
40,0%$30,00
0,0%
2003 2004 2005 2006 2007 2008 2009 2010 1S11$(10,00)
$10,00
2003 2004 2005 2006 2007 2008 2009 2010 1S11
Other COGS DD&A Income TaxLifting Other
-20,0%( )
40
Net Income R&DSG&A Exploratory Costs Government Take

WHAT IS PRE‐SALT?
Located in a remote area, up to 300 km offshore
CorcovadoWater depths that canexceed 2,000 meters
Total depth from5,000 to 7,000 meters
Salt layer more than 2,000 t thi k
Post‐Salt LayerFocus up to 2006
meters thick.
Pre‐Salt LayerNew Exploratory Frontier
Large Oil CarbonaticReservoirs
41

PRE‐SALT Pre‐salt represent a large and relativly unexplored area
42

SANTOS PRE‐SALT MASTER PLAN HIGHLIGHTSFrom 2006 to 2010...
Infraestructure
Pipeline Tupi‐Mexilhão
FPSO
s/nitive Systems
Pipeline Tupi Mexilhão
Defin
Piloto de Lula (AR)
EWTs
FPSO
s/E
Tupi (CSV) Guará (DP)
W Polaris Cajun (SS76)
New
Rigs
W Emminence (SS69)
W Polaris (NS28)Clipper
(NS21)
Louisiana (SS51)
W Taurus (SS68)
Stena (NS25)*
Victoria (SS70)W Orion (SS78)
Ocean Valor (SS77)Cajun (SS76)
Goldstar (SS73)Dave Beard (SS71)
Deepwater Expedition(NS20)*
Paul Wolf (SS53)
Pré‐Sal/Parati
TupiDiscoveries Carioca
Bem‐Te‐ViGuará
Iara
Caramba
Júpiter
Franco
Goldstar (SS73)
Iracema
43
2006 2008 2009 2010... 2007
* Sondas que não estão mais sob contrato com a Petrobras ou consórcios operados pela Cia.

SANTOS PRE‐SALT MASTER PLAN HIGHLIGHTS... 2011 and onwards
frastructure
ROTA 2 ROTA 3stem
s
Guará N t
Inf
LulaAlto
FPSO
s/Definitive Sys
Piloto Guará
Piloto Lula NE
Norte
Cernambi Sul
LulaCentral
Franco1
Os/EW
Ts
Lula NE (CSV)
Cernambi (CSV / 2S 2011) 4 EWTs 3 EWTs 5 EWTs 5 EWTs
sFPSO Carioca
(DP / 2S 2011)
Vitoria 10000
New
Rigs
2013 20142012
7 drilling rigsVitoria 10000
(NS‐30)
+ 3 rigs
Drilling Rigs to be contracted(includes up to 28 rigs to be constructed in Brazil)
44
2011 2013 2014 2015... 2012 2016

DEVELOPMENT OF PRE‐SALTAll first‐phase units under construction or being contracted
2 FPSOs performing EWTs
Contracted(start‐up in 2012 and 2013)
Contracted (start‐up in 2014)
Significant production increase
Phase 1b
Production > 1 MM bbl in 2017
Phase 1aPhase 0
Acquisition of information
After 20172013/2017
• Guará Pilot
2008/2013
• Appraisal wells • Accelerated innovation • Lula NE Pilot
• Guará N
• Cernambi S
• Extended well tests
• Lula Pilot• Intensive use of new technologies specifically developed for pre‐salt conditions
• 8 definitive production systems (replicant)
• 4 production units in the Transfer of Rights area
Operating (only 4years after discovery)
Hulls already contracted (conversion in the Inhaúma shipyard)
45
Under construction (hulls being built in the Rio Grande shipyard) +
topsides under bid

SANTOS BASIN PRE‐SALT UPDATEDrilling campaign continues to accelerate
High exploration success ratio continues
High productivity in producing wells
C t d ti f 91 000 b d Current production of 91,000 bpdin 3 wells.
‘EWTLula NE
EWTCarioca NE
34 ll d ill d till O t/2011 (27
Lula Pilot
34 wells drilled till Oct/2011 (27exploratory wells)
10 drilling rigs operating in Santos Basin,from a total of 23 rigs that operates in ultradeep water.
4646
Expectation to double the number of rigsoperating in the Santos Pre‐salt by end of2012.
Wells undergoing drilling, completion or appraisal

CAPITAL COSTS: PRE‐SALT VS. CAMPOS Similar equipment and processes: Principal difference is drilling and completion
PrePre--salt salt CAPEX DISTRIBUTIONCAPEX DISTRIBUTION
20%27%
53%
Gathering Completion + Drilling Units
Deepwater Projects in Campos Basin*Deepwater Projects in Campos Basin*CAPEX DISTRIBUTIONCAPEX DISTRIBUTION
Gathering Completion Drilling Units
33.3%33.3%o Additional drilling and completion cost
in the pre-salt compared with an
33.3%
in the pre salt compared with angeneric deepwater project in Camposbasin can be partially or fully offset byhigher quality and quantity of oil that isexpected in the pre-salt area.
47
Gathering Completion + Drilling Units
* Generic example, considering that these rates can change among the different existing projects in Campos Basin
expected in the pre salt area.

PRE‐SALT RESULTSReduced drilling time and exceptional reservoir behavior lead to growing optimism
Constant production
Results obtained during EWTsAverage drilling time of the wells completed during the year
(versus combined average time for 2006/7)
Constant production
Restriction due to gas burning limitation
Good behavior of the reservoirs
5 wells
4 wells
Good lateral communication
No issues regarding flow guarantee
5 wells
6 wells
EWT Schedule
41
4
1
34
35 5
48
2011 2012 2013 2014 2015
TLD ‐ Pré‐Sal e Cessão Onerosa TLD ‐ Outras áreasEWT – Pre-Salt and Transfer of Rights
EWT – Other areas

SANTOS PRE‐SALT ECONOMICSIncreasing knowledge lowers expected investment, increasing NPV for Master Plan
200%
‐45%
100%
150%nvestm
ent
‐32%
100%81%
55%
0%
50%
PLANSAL 2008 (2008‐2030) PLANSAL 2009 (2008‐2030) PLANSAL 2010 (2008‐2030)
In
200%
152%
100%
150%
esen
t Va
lue
100%118%
152%
0%
50%
PLANSAL 2008 (2008‐2030) PLANSAL 2009 (2008‐2030) PLANSAL 2010 (2008‐2030)
Net Pre
49
PLANSAL 2008 (2008 2030) PLANSAL 2009 (2008 2030) PLANSAL 2010 (2008 2030)

NATURAL GAS FLOW
50

DECLARATION OF COMMERCIALITY Deadlines for the declaration of commerciality influences development plans
2012 2013 2014 201620152011
BM‐S‐8 Bem‐Te‐Vi(12/31/2012)
G ará
Parati(04/12/2012)
Carioca(12/31/2013)
BM‐S‐9
BM‐S‐10
Guará(12/29/2011)
(04/12/2012)BM S 10
BM‐S‐11 Iara(12/31/2013)
BM‐S‐21 Caramba(04/30/2015)
BM‐S‐24 Júpiter(02/28/2016)
51

TRANSFER OF RIGHTS5 billion BOE in contiguous and adjacent areas, adding scale and repeatability
Transfer of Righs Aquisition
Volume 5,0 billion boeVolume 5,0 billion boe
Concession Area
3,865 km2 in 7 blocks
Average Price US$ 8,51 / boe
Initial Value US$ 42.5 billion / R$ 74.8 billion
Duration40 years, extendable for additional 5 years. 4 year
exploration periodexploration period
D&M Assumptions for Franco:*
110,000
Forecast ‐ Accumulated Cash Flow from Franco’s field (2C)(US$ MM)
• 2C Contingent Resource
• Total Potential Oil and Condensate Quantities:
1,632 MM boe
D&M Assumptions for Franco:
70,000
90,000
, (US$ MM)
• Total Potential Sales‐Gas Quantities:
1,664 Bn ft3
• Brent Price: US$ 79.23 bbl
$ 310,000
30,000
50,000
Beginning of Production
Positive Cash Flow
52
• Gas Price: US$ 4.27 thousand ft3
• 3 FPSOs, with 150 thousand BOPD processing capacity
(10,000) tt+
2t+
4t+
6t+
8t+
10t+
12t+
14t+
16t+
18t+
20t+
22t+
24t+
26t+
28t+
30t+
32
* Nominal values

TRANSFER OF RIGHTS Development of the areas fully under way
Declaration of Commerciality
Exploration Production
Development
Duration: 4 yearsExtendable for 2 more years
Variable, according to Development PlanExtendable for 2 more years Development Plan
Total Duration: 40 years, extendable for 5 more years according to specific criteria
Area 2010 2011 2012 2013 2014 2015 2016 2017 2018 2019 2020
Franco
l di
Resources already available for: First 4lara surroundings
Florim
NE f T i
for:
• 7 Exploratory wells• 1 contingent Exploratory well
First 4
production
units
undergoing
New technologies and definition of
NE of Tupi
South of Guará
S th f T i
well• 1 EWT• 2 contingent EWTs• 3D Seismic
undergoing
contracting
(*)
resource allocation
53
South of Tupi
* Conversion at the Inhaúma shipyard

D illi RiDrilling Rigs,Critical Resources and
Local Content
54

OFFSHORE CAPACITY GROWTH WILL KEEP STRONG Brazil is the main country to contribute with the increase in DW and UDW
Net Changes in Non‐OPEC Productive Capacity Non OPEC Major Capacity Outlook* Between Now and 2030 for Non‐OPEC Countries
Extra‐Heavy Oil
Non‐OPEC Major Capacity Outlook*r d
ay
y
UDW (>750 m)October 2010 Outlook
on barrels per
barrels pe
r da
Onshore
Shelf (< 200 m)Milli
Million
Deepwater Productive Capacity(% f Gl b l Li id C it )
2011 2012 20152014 20162013* Does not include NGLs, CTL/GTL, biofuels, or shale oil projects
7%
9% 8%
per day
(% of Global Liquids Capacity)
Others
3%
6%
Million barrels
Angola
Nigeria
Brazil
552004 2009 2015 2020 2030
M
United States (Gulf of Mexico)
Source: IHS CERA

TECHNOLOGICAL LEADERSHIPIntegration with suppliers, research centers and other oil companies
International Research Centers
Other operators
Suppliers
Brazilian Universities Brazilian Universities and Research Centersand Research Centers
Expenditures (investments and funding): US$1.3 billion / year
• Four R&D centers of Petrobras’ suppliers under construction;• In order to meet local content requirements, several companies will develop technological centers
56
in the country.

NEW VESSELS AND EQUIPMENTSResources required for production growth
Critical Resources Current Situation(Dec/10)
Delivery Plan (to be contracted)Accumulated Value
By 2013 By 2015 By 2020
Drilling Rigs Water Depth Above 2 000 m 15 39 37 (1) 65 (2)Drilling Rigs Water Depth Above 2.000 m 15 39 37 (1) 65 (2)
Supply and Special Vessel 287 423 479 568
Production Platforms SS e FPSO 44 54 61 94Production Platforms SS e FPSO 44 54 61 94
Others (Jacket and TLWP) 78 80 81 83
Production
Platform (FPSO)Drilling RigsSupply Vessel
Platform (FPSO)pp y
Water Depth 2006 2008 2010 2011 2012 2013
DRILLING RIGS UNDER CONTRACT
Water Depth 2006 2008 2010
Up to 1,000 meters 6 11 11
1,000 to 2,000 meters 19 19 21
Over 2 000 meters 2 3 15
2011 2012 2013
+2 +1 +1
+10 +13 +1
57
(1) Two rigs reallocated from international operations, expire in 2015, so it is not considered in the 2020 accumulated value
(2) The demand for long‐term will be adjusted as new demand assessments are made.
Over 2,000 meters 2 3 15 +10 +13 +1

Minimum and maximum limits by block:
LOCAL CONTENTFlexibility in concession agreements
Rounds 7, 9 and 10
Rounds 1 Maximum limit50% i th l t h
No local content required Round 0Minimum and maximum limits by block:
In deep water, between 37% and 55% in the exploration phase, and between 55% and 65% in
the production development phase.
Minimum exploration limit: 37%
Rounds 5 and 6
Minimum limit by blockBetween 30% and 70% in the exploration and
to 450% in the exploratory phase
70% in the production development phaseTransfer of Rights
Concession
pMinimum production development limit:
• Up to 2016: 55%• 2017‐2018: 58%• After 2019: 65%
and 6 production development phases
2011 2012 2013 2014 2015
2011‐2015 Projects
Marlim SulSS P-56
Baleia AzulFPSO
Roncador Papa-Terra
Guará NorteFPSO Cid. de Ilhabela
Parque das BaleiasFPSO P-58
ESP/MARIMBÁ
Guará PilotoFPSO Cid. São Paulo
Lula NEFPSO Cid. de Paraty
Cernambi SulFPSO Cid. de Mangaratiba
Lula Central FPSO P-67
Lula Alto FPSO P-66
BALEIA AZUL
Roncador FPSO P-62
Roncador SS P-55
Papa-Terra P-61 & FPSO P-63
Tiro/SidonFPSO Cid. de Itajaí
ESP/MARIMBÁFPSO
Aruana
MarombaFPSO
SIRI2 jacket and FPSO
Franco 1
BALEIA AZULFPSO
FPSO P-62 FPSO P-74
Lower local content requirements in the ANP’s initial concession rounds give local industry time to adapt.
Concession and Transfer of Rights agreements permit waivers from local content requirements when terms are
58
Concession and Transfer of Rights agreements permit waivers from local content requirements when terms are uncompetive relative to international metrics (e.g. price, deadline, technologies).

DEVELOPMENT OF NATIONAL INDUSTRYDetailing of needs into critical categories permits long‐term strategy
CATEGORYNATIONAL MARKET
AVAILABILITYFPSO cost
AVAILABILITY 1 Process equipment ▲▲2 Turbomachinery ▲▲▲3 Mechanical equipment ▲4 Electrical equipment ▲▲5 Instrumentation/automation ▲5 Instrumentation/automation ▲6 Ship structure and systems ▲▲▲7 Pipeline and valves ▲8 Security 9 Telecommunications10 Ventilation and AC (VAC)
▲Proportional
▲10 Ventilation and AC (VAC)11 Engineering services 12 Architecture 13 Commissioning services
share of FPSO cost
59
Extensive experience of contracting FPSOs combined with operational scale and equipment standardizationwill help create an internationally competitive offshore industry.

PLATFORM CONSTRUCTIONJoint ventures with foreign shipbuilders creating additional shipyard capacity
l b l l f
Under Construction: P‐55: Estaleiro Atlântico Sul – PE (hull) /QUIP‐ RS (modules)
Recently built platform:P‐57: BrasFels – RJ
Capacity: 180 thous. boe/day Value: US$ 1.2 billion Delivered two months ahead of scheduleDelivered two months ahead of schedule
P‐61: Brasfels (RJ)P‐62: Jurong (ES)
Under Construction:
P‐56: Brasfels (RJ)
gP‐74: Inhaúma (RJ)FPSO Cidade de Paraty: Brasfels (RJ) ‐modules and integrationFPSO Cidade de São Paulo: Brasfels (RJ) ‐modules and integration
Under Construction:
8 FPSOs (Pre‐salt ‐ P‐66; P‐67; P‐68; P‐69; P‐70; P‐71; P‐72; P‐73 ): Ecovix – Rio Grande (RS)P‐63: QUIP (RS)Under Construction:
P‐58: Estaleiro Rio Grande –RS , UTC Engenharia S/A – RJ e EBE – RJ.
o 2 Jack-ups under construction (P-59 and P-60) in São Roque (BA)o Inclusion of 900 new suppliers per year in Petrobras' Corporate Vendor List; o 13 new shipyards currently under construction raising the total number to 50*;
60
o 13 new shipyards currently under construction, raising the total number to 50*;
*Source: Sinaval – Executive Summary -2011, Jan.

LOCAL CONTENT ACHIEVEMENTSHigh level of local content already in place
Roncador development P 54 M li S l d l t P 56Roncador development P‐5468% local content
Marlim Sul development P‐56 73% local content
Jubarte development P‐57 65% Local Content
61

HUMAN RESOURCESIntensive training programs created to meet Business Plan demands
2010 2011 2012 2013 2014 2015 2016200920082007
Business plan 2008 - 201228 Probes146 Support boats146 Support boatsNew production platformsPromef II19 charter vesselsPremium I RefinaryPremium II RefineryPremium II RefineryReplanning Comperj and RNESTNew projects
212.638HR Demand
78.402Already been qualified
(R$ 554 million)PN 2010‐14
Already been qualified(R$ 228 million)
62

HUMAN RESOURCES REQUIREMENTSWorkers with elementary and high school education most needed
PROFESSIONALS REQUIRED FOR O&G PORTFOLIO IMPLEMENTATION
189189 PROFESSIONALS CATEGORIES189189 PROFESSIONALS CATEGORIES
212.638 Qualified professionals212.638 Qualified professionals
ENGINEERINGENGINEERING41414141
4%4%8.6748.674
CONSTRUCTION & ASSEMBLYCONSTRUCTION & ASSEMBLY
90909090
79%79%168 197168 197
CIVIL CONSTRUCTIONCIVIL CONSTRUCTION
7777
9%9%20.20020.200
OPERATIONS MAINTENAINCEOPERATIONS MAINTENAINCE
51515151
7%7%15 56715 567168.197168.197
HIGH SCHOOLHIGH SCHOOL14141414
44%44%3 8063 806 27272727
BASICBASIC21212121
71%71%118.654118.654BASICBASIC
7777
100%100%20 20020 200
15.56715.567
BASICBASIC12121212
25%25%3 9093 9093.8063.806
HIGH SCHOOLHIGH SCHOOL27272727
21%21%34.82734.827
20.20020.200 3.9093.909
HIGH SCHOOLHIGH SCHOOL19191919
49%49%7.6907.690TECHNICIANTECHNICIAN
2222
1%1%
TECHNICIAN TECHNICIAN 3333
11%11%988988
GRADUATEGRADUATE24242424
45%45%3.8803.880
1%1%2.1032.103
TECHNICIANTECHNICIAN1111
22%22%3.3933.393
INSPECTORSINSPECTORS21212121
3%3%5.0605.060
63
GRADUATEGRADUATE19191919
7.5537.5534%4%
GRADUATEGRADUATE11111111
4%4%575575

fi i i &Refining, Transportation & Marketing (RTM), d h i land Petrochemicals
64

DOWNSTREAM STRATEGYExpansion, quality, logistics and marketing
Expand the downstream, ensuring domestic supply and distribution leadership, developing markets for the oil surplus produced in Brazil
2011‐15 Business Plan Highlights:
• Downstream capacity will increase by 395 thousand bpd between 2011‐15 and 1,065 thousand bpd between 2016‐2020;
• Completion of the process to modernize the downstream segment;
• Logistics integrated with E&P activities to ensure the commercialization of the oil surplus;
• Increase petrochemicals and biopolymers production.
65

INVESTMENTSNew refineries, fuel quality and modernization responsible for 75% of spending
• Refining Capacity Expansion: Abreu e Lima
US$70.6 billion
Logistics for Oil InternationalRefinery, Premium I and II, and Comperj;
• Quality and Conversion: Modernization, conversion and hydrodesulfurization;6,2%
4,9%1,0%
Fleet Expansion
Logistics for Oil International
conversion, and hydrodesulfurization;
• Operating improvement: maintenance and optimization, HSEE, and R&D;
50 1%
13,9%Refining Capacity
Expansion
Operating Improvement
• Fleet Expansion
• Logistics for Oil: oil supply for refineries and
50,1%
23,9%
Quality and Conversion
Logistics for Oil: oil supply for refineries and infrastructure for oil exports.
Petrochemical Investments amount to US$3.8 billion
66

TRANSPORT MATRIX
MIDDLE DISTILLATE DEMAND EVOLUTIONExpectations of strong middle distillate growth
GDP and AGRICULTURE GDP IN BRAZIL
81%
46% 11%
11%8%
43%Canada
Russia
TRANSPORT MATRIXThe Brazilian transportation matrix strongly depends on trucks
150
160
170
180
+52%
GDP and AGRICULTURE GDP IN BRAZIL
46%
43%
43% 25%
11%
32%USA
53% 4%
43%
Australia
Canada
120
130140
150
37%
25%
13%
17%
50%
Brazil
China
58%90
100
110
Q10
Q09
Q08
Q07
Q06
Q05
Q04
Q03
Q02
Q01
Q00
Agriculture GDPGDP
Trucks Maritime and OthersTrains
10 000
Number of passengers carried ‐ Air Transportation in Brazil (thousand)
JET FUEL MARKETDIESEL AND JET SALES
11111111111
8.000
9.000
10.000
+12%a.a.
+4,5% p.y.
+9%
+17%
5 000
6.000
7.000
2006 2007 2008 2009 2010 9M11
67
4.000
5.000
jan 10jan 09jan 08jan 07 jan 12jan 11
2006 2007 2008 2009 2010 9M11Diesel Jet Fuel
The 9M11 sales exceeded expected growth, keeping a faster‐than‐GDP growth
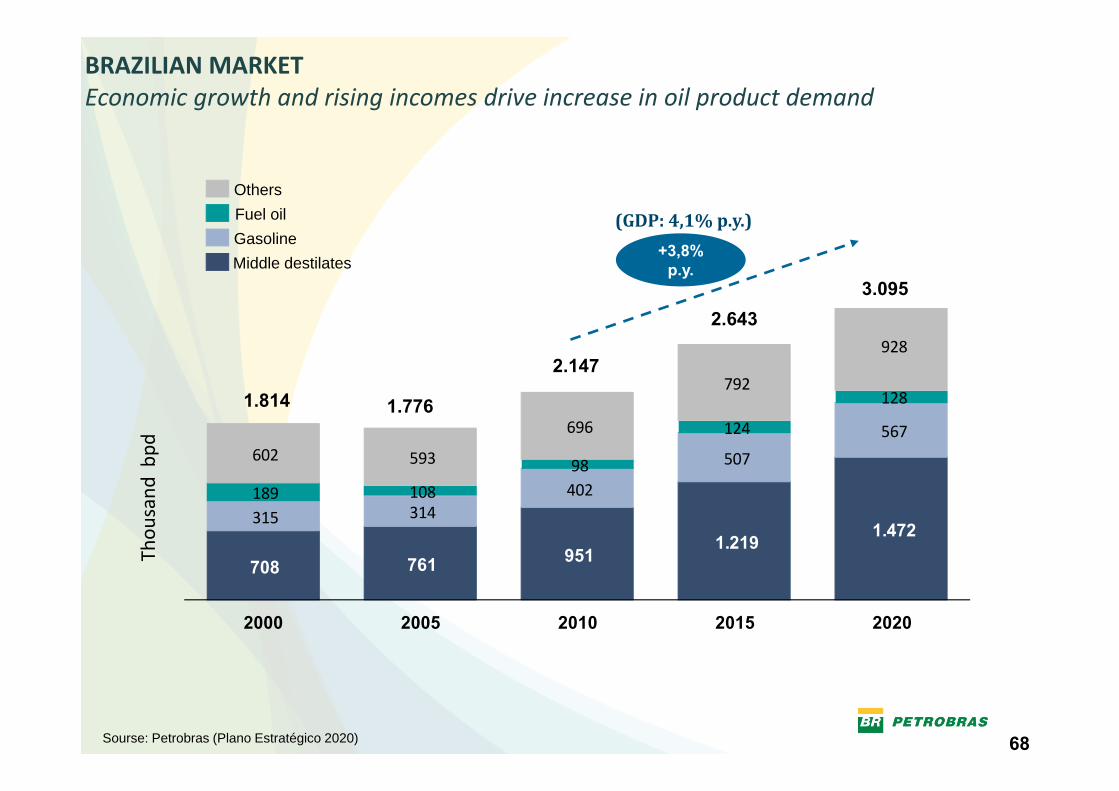
BRAZILIAN MARKETEconomic growth and rising incomes drive increase in oil product demand
(GDP 4 1% )
OthersFuel oil
3.095
+3,8% p.y.
(GDP: 4,1% p.y.)Fuel oilGasolineMiddle destilates
128792
9282.147
2.643
1 814
402
507
567
98
124
128
602 593
696
dbp
d
1.814 1.776
708 761 9511.219 1.472
315 314402189 108
Thou
sand
2000 2005 2010 2015 2020
68Sourse: Petrobras (Plano Estratégico 2020)

INTEGRATION AND BALANCEConstruction of new refineries intended to meet Brazilian demand
5000
PREMIUM I(2nd phase)300,000 bpd
(2019)
Thous bpd4,910
3000
4000 COMPERJ(2nd phase)165,000 bpd
(2018)
2,643 3,095
3,3273,2173,070
2000
Abreu e Lima
COMPERJ(1st phase)165,000 bpd
(2013)
PREMIUM I
PREMIUM II300,000 bpd
(2017)
2,536
1,641
2,2052,004
1,3931,798
1,036
2,1471,814
1,323
0
1000
1980 2000 2010 2015 2020
Abreu e LimaRefinery (RNE)230,000 bpd
(2012)
PREMIUM I(1st phase)300,000 bpd
(2016)181
... ... ... ...1980 2000 2010 2015 2020
Oil and NGL Production ‐ Brazil Total crude oil processed – Brazil Oil Products Market (2 scenarios)
• No new refineries built since 1980• Demand now exceeds refining capacity, with demand growing 20% last two years and growing
69

DOWNSTREAM EXPANSIONNew refineries needed to avoid excessive dependence on product imports
Net Imports as a percentage of total demand (%)*Net Product Imports (’000 bpd)
2006 2007 2008 2011E2009 2010
Brazil (2010)USA
ChinaGermany
FranceBrazil (2010)
IndonesiaMexico
SpainJapan
Brazil (2020)**Indonesia
* S IEA 2010 W ld E St ti ti
• Increasing imports will lead to higher logistical costs and increasing exposure to availability of international supplies
70
* Source: IEA – 2010 World Energy Statistica** Without considering Capacity Expansion
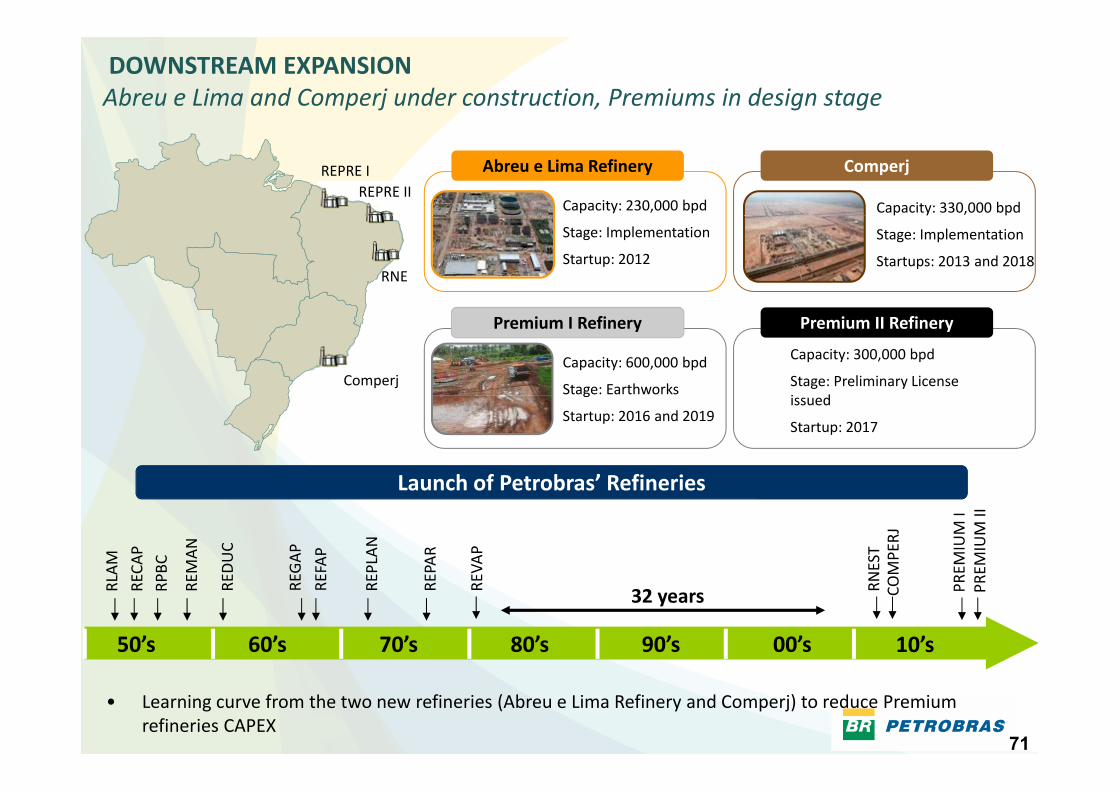
DOWNSTREAM EXPANSIONAbreu e Lima and Comperj under construction, Premiums in design stage
Capacity: 230,000 bpd
REPRE I Abreu e Lima Refinery
Capacity: 330,000 bpdREPRE II
Comperj
Stage: Implementation
Startup: 2012
Stage: Implementation
Startups: 2013 and 2018RNE
Comperj
Capacity: 300,000 bpd
Stage: Preliminary License i d
Capacity: 600,000 bpd
Stage: Earthworks
Premium I Refinery Premium II Refinery
issued
Startup: 2017
g
Startup: 2016 and 2019
Launch of Petrobras’ Refineries
LAM
ECAP
PBC
EMAN
EDUC
EGAP
EFAP
EPLAN
EPAR
EVAP
NEST
MPERJ
Launch of Petrobras Refineries
REMIUM I
EMIUM II
60’s50’s 70’s 80’s 90’s 00’s
RL RE RP RE RE RE RE RE RE RE RN CO
10’s
32 years PR PR
71
• Learning curve from the two new refineries (Abreu e Lima Refinery and Comperj) to reduce Premium refineries CAPEX

LOGISTICSDistances have relevant freight costs to reach the different markets
Freight cost ($/bbl)
2 8
2 8
2,8
4,9 5,4
2,87,7
4,1,
Processing in Brazil implies:• Lower Lead-Times• Reduced Tankage needs
L I t i
72
CrudeProducts
• Lower Inventories• Reduced need for ships

CONVERSIONNew refineries will have significant higher conversion than existing refineries , allowing l t f t i lless costs of raw material
7064%
68%65% (US$/bbl)
Average Cost of Oil (2020)Convertion Capacity/ Destilation Capacity
FCCCoker
31% 26%
40
50
60
37%
‐5,8
‐2,3
HCCFCC
10% 65%
27%10
20
30
38%36%
PREMIUMExistentBrent0
PREMIUMExistent Refineries
Brent
PREMIUMCOMPERJRNEExisting Refineries(2010)
73
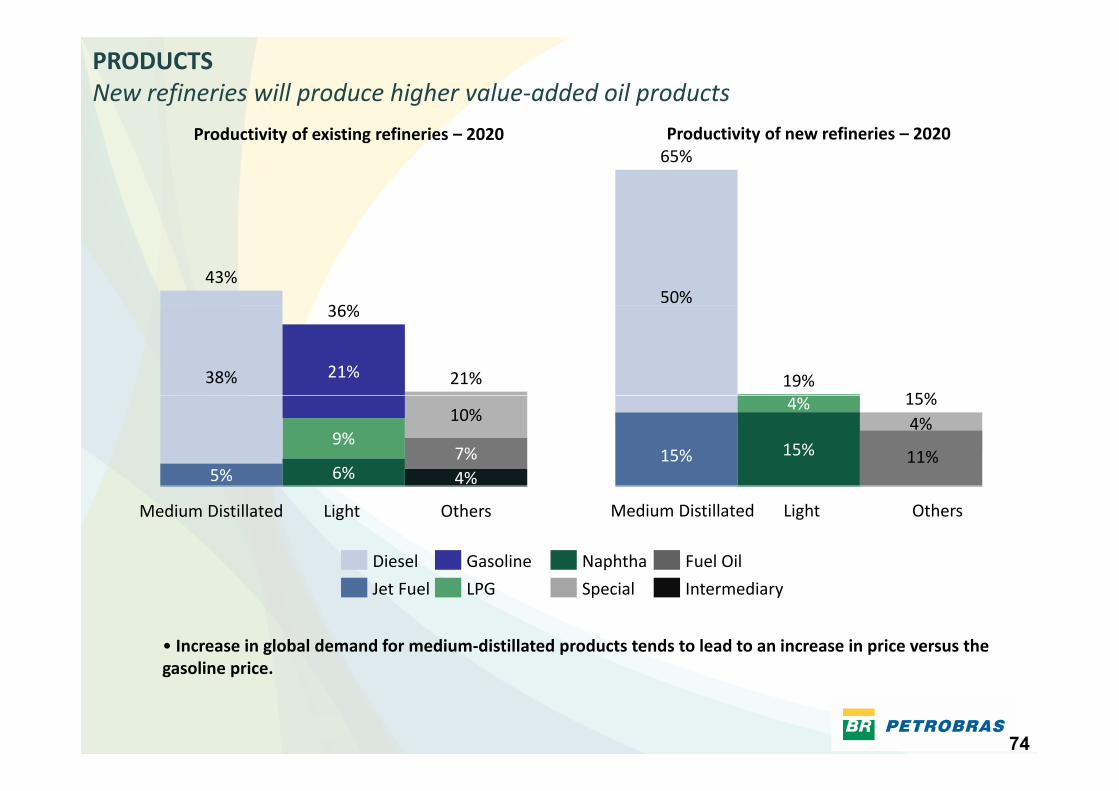
PRODUCTSNew refineries will produce higher value‐added oil products
65%Productivity of existing refineries – 2020 Productivity of new refineries – 2020
36%
43%50%
21%
36%
21%38% 19%15%
4%7%
10%
6%
9%
5%
4%
15%4%
11%
15%
15%
LightMedium Distillated Others
Fuel OilNaphthaGasolineDiesel
LightMedium Distillated Others
SpecialLPGJet Fuel Intermediary
• Increase in global demand for medium‐distillated products tends to lead to an increase in price versus the li i
74
gasoline price.

PREMIUM REFINERIESFuture refineries designed to optimize scale and resources
Lower refining costs due to design quality and scale
Economies of scale and new implementation strategies to reduce Capex, including:
• Design competition based on the lowest final cost
• Selection of UOP ‐ international company with extensive refining experience Age (years)
Current downstream cost(US$ / bbl in 2010)
refining experience
• Single design integrating all the refinery on‐site and off‐site
• Designer involved from conceptual design to technical assistance in the start up
• Scale economies (RPRE: 300kbpd modules)
Ma im m standardi ation of eq ipments specification• Maximum standardization of equipments specification
• Scheduling the construction stage allowing long‐term planning for equipment suppliers
• Reuse of the executive project allowing the incorporation of lessons learned Scale (’000 bpd)
75
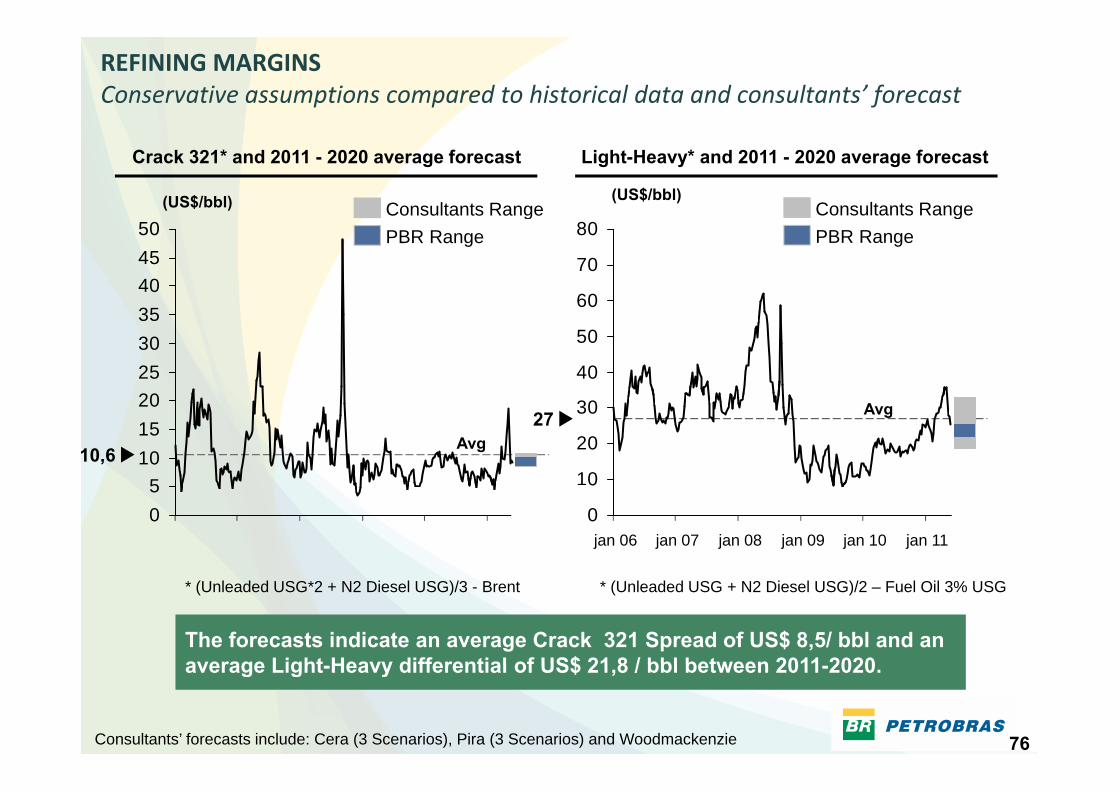
REFINING MARGINSConservative assumptions compared to historical data and consultants’ forecast
Crack 321* and 2011 - 2020 average forecast
Consultants Range(US$/bbl)
Light-Heavy* and 2011 - 2020 average forecast
(US$/bbl)Consultants Range
404550 50
45PBR Range
g
60
70
80 PBR Rangeg
20253035
40
50
60
5101520
10,6 Avg
Avg
10
20
3027
05
0
0
jan 12jan 11jan 10jan 09jan 08jan 07jan 06
The forecasts indicate an average Crack 321 Spread of US$ 8,5/ bbl and an average Light Heavy differential of US$ 21 8 / bbl between 2011 2020
* (Unleaded USG + N2 Diesel USG)/2 – Fuel Oil 3% USG* (Unleaded USG*2 + N2 Diesel USG)/3 - Brent
76
average Light-Heavy differential of US$ 21,8 / bbl between 2011-2020.
Consultants’ forecasts include: Cera (3 Scenarios), Pira (3 Scenarios) and Woodmackenzie

PROFITABILITYNew refining projects have return rate above the cost of capital
Return rate (%)
Key Assumptions:18
• Refinery with trains of 300 k bpd
• Refining scheme with HCC, Coque and HDT12
14
16
•Refining costs in line with the current refineries that has the same scale
• Integrated Analysis
P d ti f th d ti k t6
8
10
• Production for the domestic market
• Does not include tax benefits in the operation of the asset
0
2
4
6
Case 1 – Capex US$ 30.000/bpd
C 2 C S$ 0 000/b d
Margin
US$/bbl
013 14 15 16 17 18 19 20 21 22 23
Case 3 ‐ Capex US$ 50.000/bpd
Case 2 – Capex US$ 40.000/bpd Expected Scenario
77

HYDROREFINING INVESTMENTSCatch up phase to meet international standards for quality products
95%100
Hydrorefining Capacity relative to Distillation Capacity
70%
95%
69%70%67%
86%
80
100
74% (2020)67%
15%60
59% (2015)
36%
20
40
23% (current)
0
23%
Adding value to domestic crude oil by producing diesel and gasoline in‐line with international standards.
78
Underinvested over the past years requires catching up with hydrorefining capacity (for removal of sulfur)

INVESTMENTS IN QUALITYInvestment cycle in modernization and quality has peaked
US$16 billion in 2011‐15 Reduction in sulfur level
US$ 16 billion
5.9
7.0
4.94.5 Avg. Sulfur Level – Diesel (ppm)
3.2
2.3
1.01.01.1
0.20.1
<250
15141312111098765
• After 2013 investment can be focused principally on expansion alone
79
• After 2013 investment can be focused principally on expansion alone

SUPPORTTING UPSTREAM OPERATIONSLogistics support represent 11% of Capex
Capex for Fleet Expansion Capex for Logistics for Oil
US$ 3,5 billionUS$ 4,4 billion
Capex for Fleet Expansion Capex for Logistics for Oil
Pre‐SaltProjects
21%
Plangás
30%Others
51%
30%
28%
Supply
70%
OilOil
80

PETROCHEMICALS
OWNERSHIP STRUCTURETotal ON
Braskem
Nominal Capacity by Petrochemical TypeTotal ON
36,1% 47,0% PETROBRAS38,2% 50,1% ODEBRECHT25,7% 2,9% OthersAlagoas
(mmt/y)Ethylene 3.77Propylene 1.59Polyethylene 3.06
l l 2 88
yp
The Largest Thermoplastic Resins Producer in the Americas
BahiaPolypropylene 2.88PVC 0.51Cumene 0.32
• Production Capacity: 15 million metric tons of thermoplasticresins and other chemical products• 31 industrial units: 28 in Brazil and 3 in the US• 400 patents in Brazil, the US and EuropeW ld l d i h fi ld f bi l b f G PE
São Paulo
Rio de Janeiro
• World leader in the field of biopolymers because of Green PE,first produced on a commercial scale in September 2010
Rio Grande do Sul
Petrobras has also 3 new petrochemicals projects under construction:• Complexo Petroquímico do Rio de Janeiro: petrochemicals complex to be integrated with the Comperj refinery to produce materials for the plastics industry;• Petroquímica Suape Complex in Pernambuco: to produce purified terephthalic acid (PTA), polyethylene terephthalate
81
(PET) resin, and polymer and polyester filament textiles• Companhia de Coque Calcinado de Petróleo—Coquepar: calcined petroleum coke plants in Rio de Janeiro and Paraná
BIOFUELSBIOFUELS
82

2011‐2015 INVESTMENTS
INVESTMENTS IN BIOFUELSFocus to increase the ethanol supply in Brazil
2011 2015 INVESTMENTS US$ 4.1 billion
Ethanol
7%
14% 0 3 Ethanol
Ethanol Logistics
Biodiesel47%
14%
1.90.6
0.3
R&D
32%
1.3
5.6
Market Share Pbio+Partners:• 2011: 28%
Biodiesel supply (’000 m³)Ethanol supply (million m³)
Market‐share Pbio+Partners:• 2011: 5.3%2015 12%
273%
16%
735
855
• 2015: 26%• 2015: 12%
1.5
2011 20152011 2015
83
Pbio + Partners Pbio + Partners

Natural Gas, Electric Energy and Fertilizers
84
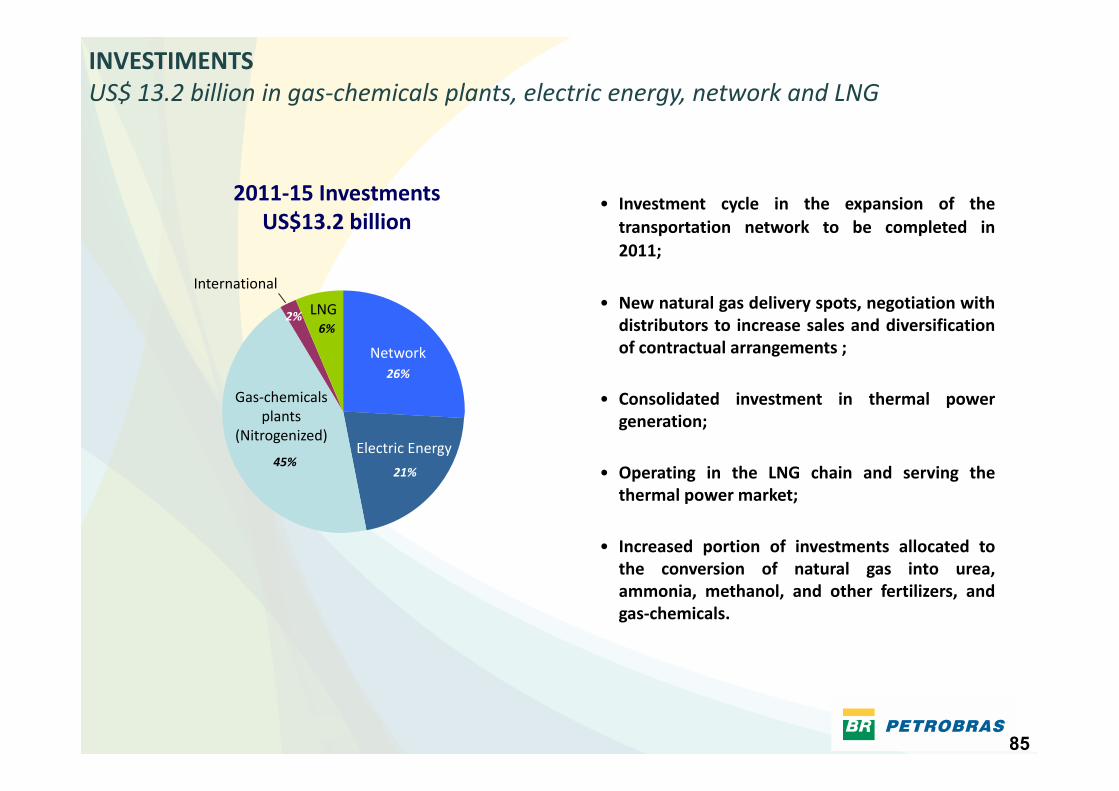
INVESTIMENTSUS$ 13.2 billion in gas‐chemicals plants, electric energy, network and LNG
• Investment cycle in the expansion of the2011‐15 InvestmentsUS$13 2 billi
International
LNG
transportation network to be completed in2011;
• New natural gas delivery spots negotiation with
US$13.2 billion
0,30,8
26%
2%6%
Network
Gas chemicals
LNG New natural gas delivery spots, negotiation withdistributors to increase sales and diversificationof contractual arrangements ;
C lid t d i t t i th l5,9
21%45%
Electric Energy
Gas‐chemicalsplants
(Nitrogenized)
• Consolidated investment in thermal powergeneration;
• Operating in the LNG chain and serving thethermal power market;
• Increased portion of investments allocated tothe conversion of natural gas into urea,g ,ammonia, methanol, and other fertilizers, andgas‐chemicals.
85

1ST INVESTMENT CYCLENatural gas transportation and processing infrastructure now largely concluded
9.538 9.728
9 000
10.000
Transportation Infraestructure (km)km
5.623 5.6676.098
7.086
7.991
6.000
7.000
8.000
9.000
2 000
3.000
4.000
5.000
0
1.000
2.000
2003 2005 2007 2008 2009 2010 2011
Investments: R$ 29,2 billion
Compressor Stations and Delivery PointsDelivery Points
Compressor Stations
By 2013 2003 to 2011
86
Delivery Points

1st Investment Cycle 2nd Investment Cycle2nd Investment Cycle
2ND INVESTMENT CYCLE:Monetization of the pre‐salt reserves drives future investments
90%
100%UFN III (Sep/14)
LNG Pecém
LNG BGUA
TPP Bicomb Conversion
Cubatão
Sulfato de Amônio (May/13)
Acquisition TPPs
UFN V (Sep/15)
COMPLETED 20112011‐‐2015 BP2015 BP
70%
80%TPP Bicomb. Conversion
TermoaçuSulfato de Amônio (May/13)
ARLA 32 (out/11)
UFN IV (Jun/17)
tal
50%
60%
Regás BahiaGasbel II
Gasduc III
estim
ento
To
30%
40%
Regás Bahia
(Jan/14)
New NG TPPs
Gasene
Pilar-Ipojuca
% d
o In
ve
10%
20% Gastau
Gaspal II
Gasan IIAtalaia-Itaporanga
Cacimbas-Vitória
Catu-Pilar
Japeri-Reduc
Gascav
Gascar UPGN Cabiúnas –Route 2 Pre-Salt
0%
10%
2005 2006 2007 2008 2009 2010 2011 2012 2013 2014 2015
Urucu-Manaus Gasan II
Ecomps + Delivery Spots + Network Maintainance
Route 2 Pre-Salt(Aug/14)
87
Adaptation of the Gas Pipelines Network (US$ 3.34 bi)New TPPs run on Natural Gas (US$ 1.82 bi)LNG regasification (US$ 0.74 bi)Chemical Transformation of NG (US$ 5.85 bi)
TPP Commitments (US$ 0.94 bi)Renewable Energy: Wind Power and Biomass (US$ 0.02 bi)Natural Gas Liquefaction (US$ 0.10 bi)
87

NATURAL GAS SUPPLY & DEMAND (MILLION M3/D) Increasing domestic gas supply and demand flexibility
DEMANDPCS 9.400 kcal/m³ SUPPLY
Thermal Power Plants Demand : Petrobras + Third partiesDomestic NG Supply (Includes third parties)
76(15.1 GW)
599
9 Northern Region
55
78
102
Inflexible
Flexible40
13
3725
To be contracted (5.5 GW(10.7 GW)38(6.7 GW)
4969
936Other Regions
NG Distributors Demand
202020152011
Supply via LNG Regasification Terminals
2011 2015 2020
Non‐thermal power
2011 2015 20202011 2015 2020
Guanabara BayPecém
Bahia41
20
1441
20
1421
14
F tili61
Petrobras’ Demand: Downstream + Fertilizers
2011 2015 20202011 2015 2020
Bolivian Supply
Firm
Flexible30
24
30
24
30
24
202020152011
Downstream
UPGN
Fertilizers
32
1639
2517
2011 2015 2020
88
Total
Demand
Total
Supply173149106 20015196

NATURAL GAS PRICESA policy that allows Bolivian imports and domestic gas to substitute fuel oil
u 182022
S$/M
MBtu
68
1012141618
US
0246
n/08
ar/0
8
ai/0
8
ul/0
8
et/0
8
ov/0
8
n/09
ar/0
9
ai/0
9
ul/0
9
et/0
9
ov/0
9
n/10
ar/1
0
ai/1
0
ul/1
0
et/1
0
ov/1
0
n/11
ar/1
1
ai/1
1
ul/1
1
et/1
1
ov/1
1
ja ma
ma ju se no ja ma
ma ju se no ja ma
ma ju se no ja ma
ma ju se no
Faixa dos Contratos Internacionais GN Brasil: Boliviano GN Brasil: Nova Política
OC Brasil (SE) GN Europa: Contrato GNL Ásia: Contrato (PIRA)Fuel Oil in Brazil (Southeast Region)
Range for International Contracts Brazilian NG: Bolivian
European NG: Contract
Brazilian NG: New Policy
Asia NGL: Contract (PIRA)
• Petrobras has 2 umbrella contracts: the Bolivian and the Brazilian New Policy (domestic gas)
• New Policy indexed to IGPM, while the Bolivian contract linked to Dollar
• Appreciation of the Real from 2009 until August 2011 created a differential between the twosources of natural gas, that is largely now closed.
89

InternationalInternational
90
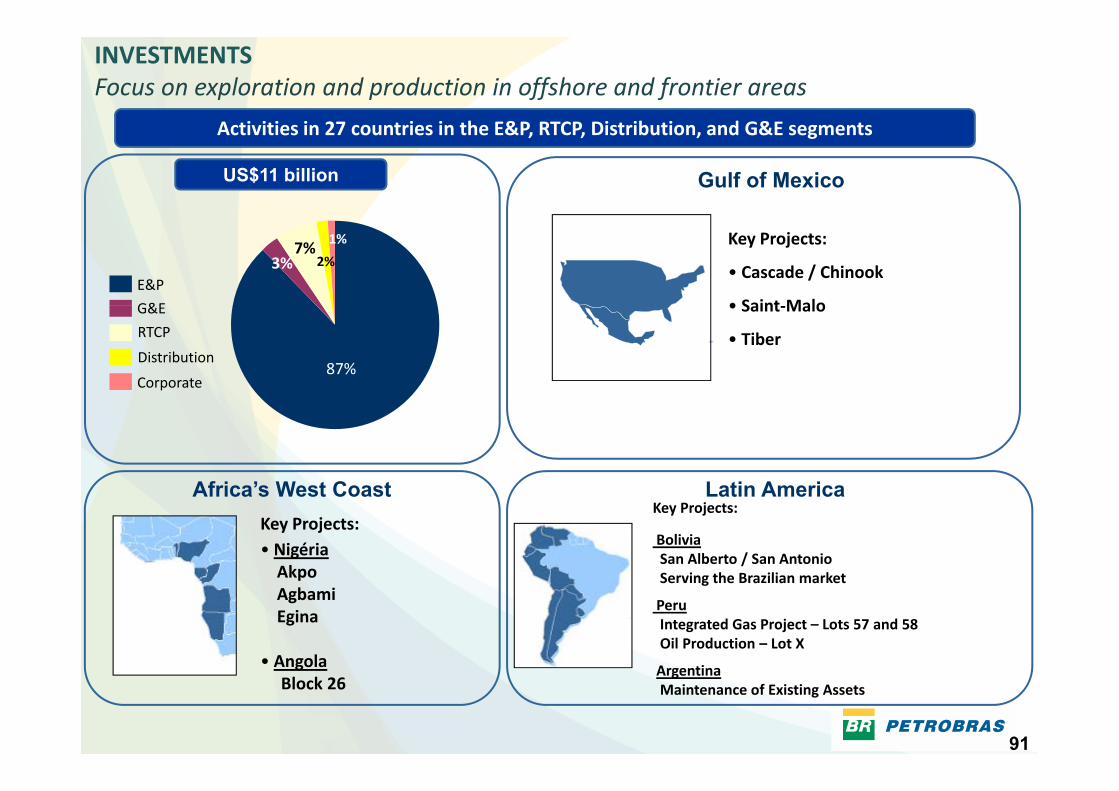
INVESTMENTSFocus on exploration and production in offshore and frontier areas
Activities in 27 countries in the E&P RTCP Distribution and G&E segments
US$11 billion
Activities in 27 countries in the E&P, RTCP, Distribution, and G&E segments
Gulf of Mexico
Key Projects:
• Cascade / Chinook
• Saint MaloG&E
E&P
1%
3% 2%7%
• Saint‐Malo
• Tiber
Corporate
Distribution
G&E
RTCP
87%
Africa’s West Coast Latin AmericaKey Projects:
BoliviaSan Alberto / San Antonio S i th B ili k t
Key Projects: • NigériaAkpo
Africa’s West Coast Latin America
Serving the Brazilian market
PeruIntegrated Gas Project – Lots 57 and 58 Oil Production – Lot X
Akpo AgbamiEgina
• Angola
91
ArgentinaMaintenance of Existing Assets
AngolaBlock 26

CASCADE ‐ CHINOOK DEVELOPMENTFirst oil expected from the ultra deep of GOM in the beginning of 2012
FPSOShuttleTanker
Petrobras America operated fields - Water Depth ~ 2,500 meters
Chinook
FSHR
Control
Gas Export Pipeline
p ,(8,200 feet).
US regulators approved Petrobras plans to bring first FPSO (*) to the US Gulf of Mexico
CascadeT
Control Umbilical Power
Umbilical
Flow line
M if ld
US Gulf of Mexico.
Technologies new to US Gulf of Mexico, including disconnectable turret buoy, allowing the vessel to
TreeManifoldy, g
move offsite during hurricanes, and transportation via shuttle tanker.
(*) FPSO Floating Prod ction Storage and Offloading facilit(*) FPSO – Floating, Production, Storage and Offloading facility.Petrobras has an extensive experience in the use of FPSO with18 units currently under operation offshore Brazil.
92Source: Petrobras America inc

FINANCIAL CONSIDERATIONSCONSIDERATIONS
93

2011‐2015 INVESTMENTSInvestment level similar to the previous Plan, with more focus in E&P
2010‐14 Business Plan
1%1% 2%
2011‐15 Business PlanUS$224.7 billionUS$224 billion
2%2% 1%1% 2%
8%2,9
14,7 3,24,2
2,314,7 3,2
4,22,46%
2% 1%1% 2%
17.8 2.43.52.9
13.2 3.14.1
2.4
53% 65,5
4,1
65,5
4,1
(*)118.873 6
5.1
127.570 6
3.8
33%
,
57%31%73.6 127.570.6
• 5% of investments will be made overseas, 87%
(*) US$22.8 billion in ExplorationE&P RTCE&P
P t h i l
RTM5% of investments will be made overseas, 87%
of which in E&P.
• Note: HSEE (US$ 4.2 bi), IT (US$ 2.7 bi), Technology
Gás,Energia & Gás Química Petroquímica
Distribuição Biocombustíveis
Corporativo
Biofuels
Gas, Energy & Gas Chemicals
Distribution
Corporate
Petrochemicals
94
Note: HSEE (US$ 4.2 bi), IT (US$ 2.7 bi), Technology(US$ 4.6 bi), Logistics (US$ 17.4 bi) and Maintenance &Infrastructure (US$ 20.6 bi)
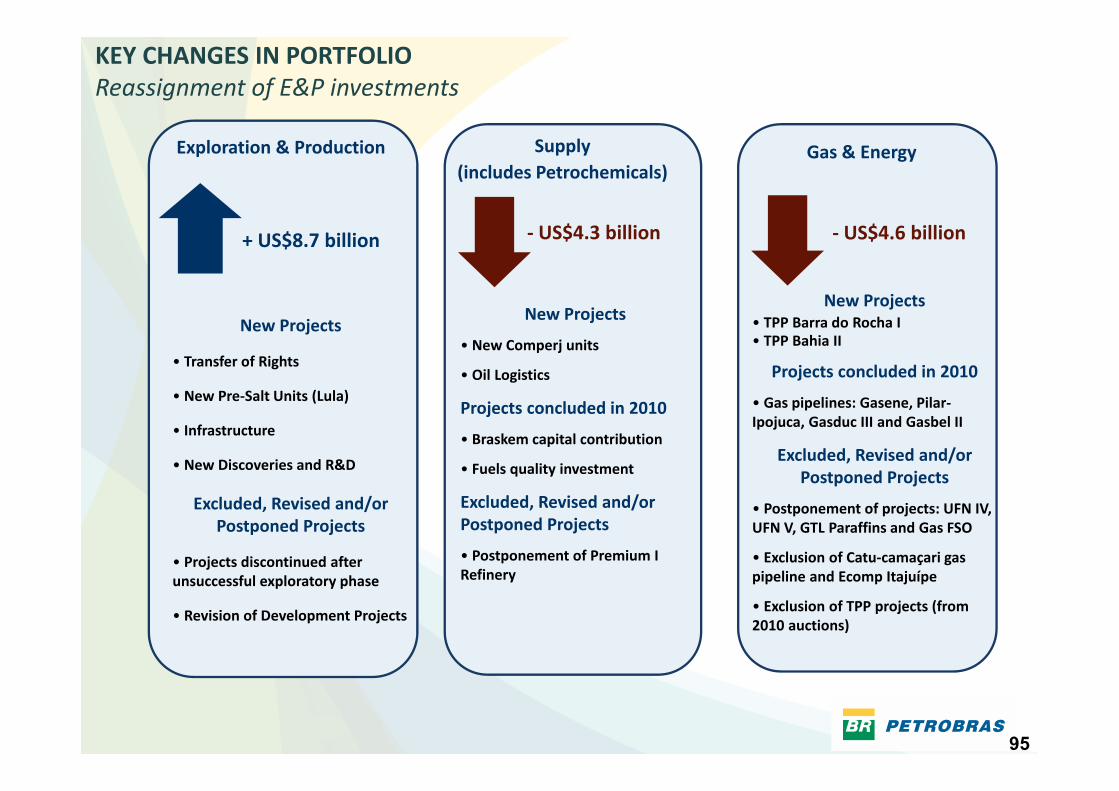
KEY CHANGES IN PORTFOLIOReassignment of E&P investments
Exploration & Production Gas & EnergySupply (includes Petrochemicals)
+ US$8.7 billion ‐ US$4.6 billion‐ US$4.3 billion
New ProjectsNew Projects
• Transfer of Rights
• New Pre Salt Units (Lula)
New Projects• TPP Barra do Rocha I• TPP Bahia II
Projects concluded in 2010
New Projects
• New Comperj units
• Oil Logistics• New Pre‐Salt Units (Lula)
• Infrastructure
• New Discoveries and R&D
• Gas pipelines: Gasene, Pilar‐Ipojuca, Gasduc III and Gasbel II
Excluded, Revised and/or Postponed Projects
Projects concluded in 2010
• Braskem capital contribution
• Fuels quality investment
Excluded, Revised and/or Postponed Projects
• Projects discontinued after f
p j
• Postponement of projects: UFN IV, UFN V, GTL Paraffins and Gas FSO
• Exclusion of Catu‐camaçari gas pipeline and Ecomp Itajuípe
Excluded, Revised and/or Postponed Projects
• Postponement of Premium I Refineryunsuccessful exploratory phase
• Revision of Development Projects
pipeline and Ecomp Itajuípe
• Exclusion of TPP projects (from 2010 auctions)
Refinery
95

KEY VARIABLESOil price assumptions within market expectations
Petrobras’ 95U
S$/b
bl
Scenarios80
Based on 2011‐2012 forecasts: Banks (Source: Bloomberg)
Based on 2013‐2015 forecasts: PIRA, DOE, CERA, WoodMackenzie, IEA
Assumptions
Key variables for Cash Generation and Investment Level• Oil price • Foreign Exchange Rate• Brazilian Market GrowthAssumptions
No Capital Increase in the period
Investment grade maintenance
• Brazilian Market Growth • Average Realization Price (ARP) – Brazil
– International Parity– International margins per product
• Oil and products exports and imports
96
Investment grade maintenance • Oil and products exports and imports• Investment Program • Divestitures and business restructuring• Third‐party funding

CASH GENERATION AND INVESTMENTSDivestment and traditional funding sources adequate for Plan needs
Scenario A Scenario B
31,4 30,926,1 26,1
13,6 13,6
US$ 256.1 US$ 255.6US$ 256.1 US$ 255.6 Key assumptions
Scenario A Scenario B
E h t
91,4 67,0
Exchange rate (R$/US$)
1.73 1,73
2011 – 110 2011 – 110
2012 – 80 2012 – 95
125,0148,9
224,7 224,7 Brent (US$/bbl) 2013 – 80 2013 – 95
2014 – 80 2014 – 95
2015 – 80 2015 – 95,
Leverage (Min. and Max.)
23% ‐ 32% 22 % ‐ 29%
Net Debt/EBITDA (Average)
1.9 1.5Sources Use Sources Use ( g )
ARP (R$/bbl) 158 177Debt AmortizationInvestments
Divestment and RestructuringCashThird‐Party Resources (Debt)O ti C h Fl (Aft Di id d )
Sources Use Sources Use
• 40% of capex in dollar in comparison to 37% in the
97
Operating Cash Flow (After Dividends) Business Plan 2010‐14

CAPEX AND CASH FLOWCash flow supports maintenance plus growth
Assumptions to Maintain Existing Capacities:• $12 per barrel to replace 830MMBBL´s of production
• $1.5 bn. ‐ Exploration • $2.0 bn. ‐ Refinery maintenance•$1.0 bn. ‐ Gas & Power maintenance• $1.5 bn. ‐ Other Maintenance
35 00040.000 45.000 50.000
US$ MM
35,13445,078
33,44745,897
5.000 10.000 15.000 20.000 25.000 30.000 35.000
16,000
,
-
OCF 2011* Capex 2009 Capex 2010 Capex 2011* Maintenance Capex (Est.)
E&P Downstream Gas & Energy Others
98
* LTM as of 6/30/11
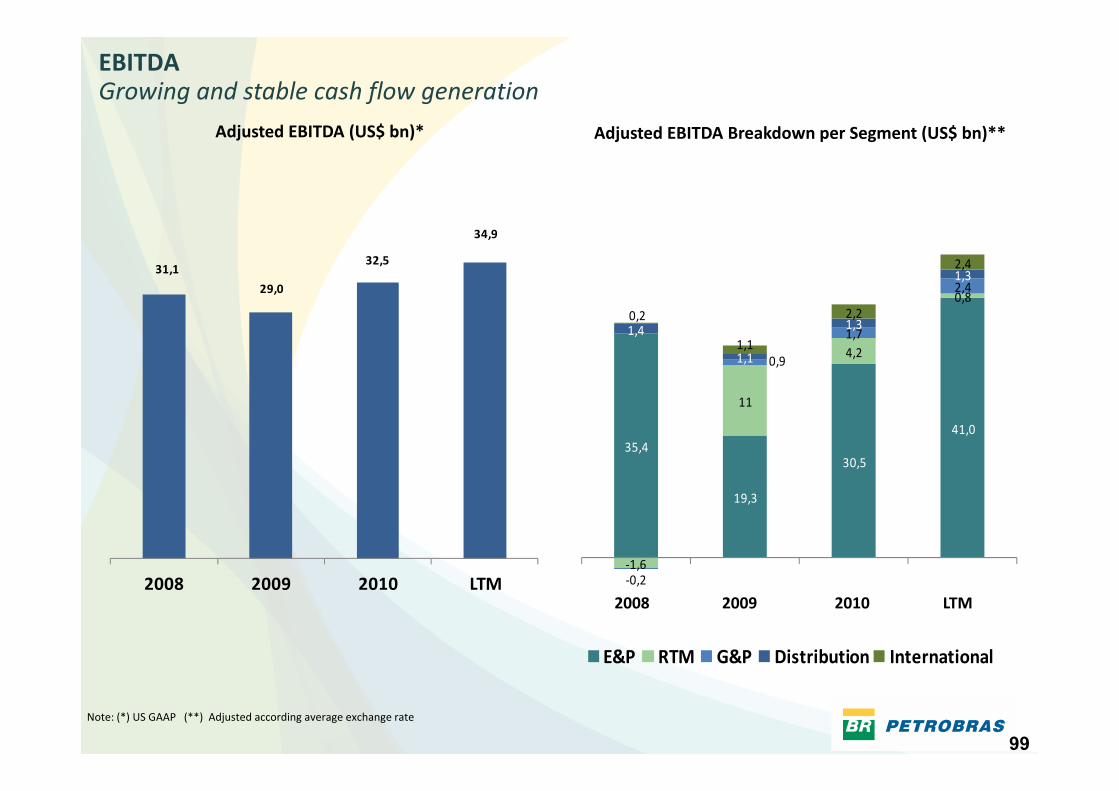
EBITDAGrowing and stable cash flow generation
Adj d EBITDA (US$ b )* d d kd ( $ b )**Adjusted EBITDA (US$ bn)* Adjusted EBITDA Breakdown per Segment (US$ bn)**
0,82,41,32,431,1
29,0
32,5
34,9
4,20,9
1,71,4
1,1
1,30,2
1,1
2,2
35,430,5
41,0
11
19,3
‐1,6‐0,2
E&P RTM G&P Distribution International
2008 2009 2010 LTM2008 2009 2010 LTM
99Note: (*) US GAAP (**) Adjusted according average exchange rate

LEVERAGE AND LIQUIDITYExchange rate was the main reason for leverage increase
N D b /EBITDA N D b /N C
34%
16% 17% 17% 17%22%
20%
30%
40%
50%
3,5
4,5
5,5
Net Debt/EBITDA Net Debt/Net Cap.
1.520.94 1.03 1.03 1.07
1.41
16%
‐10%
0%
10%
20%
0,5
1,5
2,5
3,5
‐20%‐0,5
2Q10 3Q10 4Q10 1Q11 2Q11 3Q11
R$ Billion 09/30/11 06/30/11
Short‐term debt 20.0 16.7
Long‐term debt 126.8 111.6
Total Debt 146.8 128.3
o Higher net debt, mainly due to the depreciation of the Real against the Dollar. The exchange rate effect was responsible for 3 p.p
Cash and Cash Equivalents 33.7 34.7
Tradeable Securities(maturing in more than 90 days)
21.4 24.8
increase in leverage, in 3Q11 vs 2Q11 comparison.
o Net Debt/EBITDA increased due to stable cashd h h d b
Adjusted Cash and Cash Equivalents 55.0 59.5
Net Debt 91.8 68.8
Net Debt/EBITDA 1.41X 1.07X
generation and higher net debt.
o Maintenance of high cash and equivalents position.
100
Net Debt/EBITDA 1.41X 1.07X
US$ Billion 09/30/11 06/30/11
Net Debt 49.5 44.1

DEBT PROFILEDiversified creditor base, long tenors, largely linked to dollars
Total Indebtedness (US$ 69,431 million as of December 31, 2010)
By Category By CurrencyBy Maturity By Rate
Floating43%
ST Financing13%
Financial Institutions
29%Intl Capital Markets21%
Real
Yen3%
Real Indexed to Dollar24%
Fixed57%
LT Financing87% BNDES
33%
Export Credit10%
Other7%
Dollar46%
Real27%
74%By Maturity
33%
%
2%
6%4% 5%
9%
101
2011 2012 2013 2014 2015 After 2016

TRADING VOLUMESVoting and non‐voting shares highly liquid on both the Bovespa and NYSE
Turnover NYSE & Bovespa (Daily Average Turnover)
(US$ MM) (% category and US$MM)
1,930
Turnover 2010/2005 = 619%
1,308
992
43% 47% 43%50% 52% 47% Nyse
PBRPBR/A
1,359
NysePBR
PBR/A
Bovespa
483
219 31%
6% 5%6%
5% 6%7%
25% 21%20%
20% 19%19%
27% 27%
BovespaPETR3
2005 2006 2007 2008 2009 2010
pPETR3PETR4
PETR4 (Bovespa) PBR/A (Nyse)PETR3 (Bovespa) PBR (Nyse)
219 31% 26% 23%27% 27%25%
2005 2006 2007 2008 2009 2010
PETR4
PETR4 (Bovespa) PBR/A (Nyse)PETR3 (Bovespa) PBR (Nyse)
o Turnover of PBR 3 times the volume of PBRA on the NYSE
o Turnover of PN 5 times the volume of the ON
102
o Turnover of PN 5 times the volume of the ON
o Probable explanation: Cultural. Brazilians familiar with PN´s and would not pay premium for ON´s

DIVIDENDSPayments based on percentage of net income
Net Income per ADR Price per ADR (Max-Min)Dividends per ADR
0 91.2
4 3
US$ US$ US$
75.2
1.4
0.80.7
0.9
2.9 3.0
4.33.5
26.717.5
58.8
21.1 14.9
53.0
23.031.9
48.93.9
2006 2007 2008 2009 2006 2007 2008 2009 2006 2007 2008 2009 201020102010
o Brazilian Corporate Law requires a minimum annual distributions equal to 25% of net income
o Dividends paid each year based on prior years income
103* Dividends includes the Interest on own Capital (IOC)

CONCLUSIONA Portfolio of opportunities and challenges
OPPORTUNITIES
• Abundant oil reserves
• A Growing domestic market
• Maximizing scale, standardization, and integration
D l i t h l i• Developing new technologies
• Monetizing natural gas
CHALLENGES
• Critical Resources (goods and services, human resources)
• Infrastructure and logistics
• Developing industry to meet local content requirements
• Cost pressures
104


