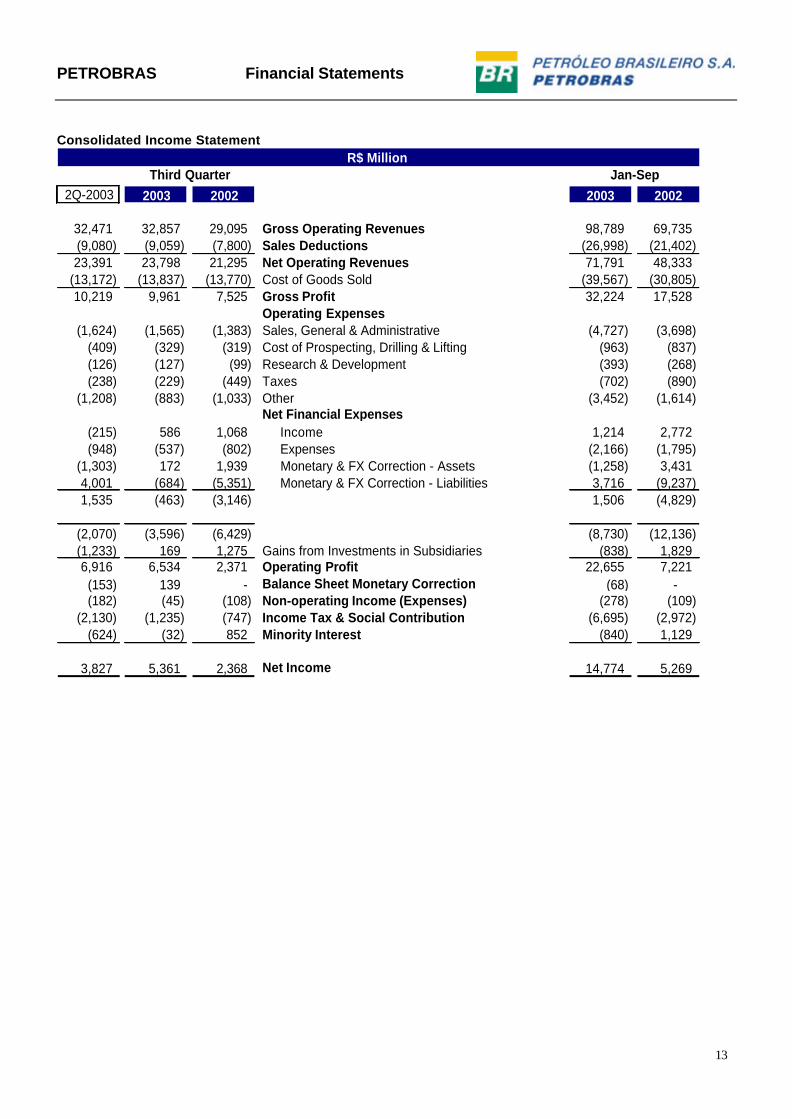
1 PETROBRAS reported consolidated net income of R$ 5,361 million in the third quarter of 2003 (3Q03), a 40% increase over 2Q03. In the period from January through September 2003, PETROBRAS’ consolidated net income was R$ 14,774 million, an increase of 180% in relation to the same period of 2002. Consolidated net operating revenue in 3Q03 was R$ 23,798 million, and the Company’s market value on September 30, 2003 rose to R$ 68,692 million. • Consolidated net income in 3Q03 was R$ 5,361 million, due mainly to the gross margin (42%), which was 7% higher than gross margin in 3Q02. This performance reflects basically the alignment of the sales prices of some oil by-products in the domestic market to the international prices and the exchange rate devaluation. Consolidated net income was additionally affected by increased export revenues, which rose because of higher international oil prices and provisions for interest on own capital, which resulted in a fiscal savings of R$ 1,119 million. However, this result was partially offset by higher costs of governmental participation in Brazil, third-party participation in consortiums in production oil areas, oil and oil by-product imports, lesser volumes sold in the domestic market (2%) and by the exchange loss of R$ 499 million as a result of the devaluation of the real, mainly in relation to assets and liabilities linked to US dollar (1.8%) and Yen (9.2%) on the 3Q/03 net of gains from participation in affiliated companies abroad. • Gross consolidated revenue in 3Q03 was R$ 32,857 million, while net operating revenue was R$ 23,798 million. In the same quarter of last year, gross revenue and net revenue were R$ 29,095 million and R$ 21,295 million, respectively. • From January through September 2003, PETROBRAS invested R$ 13,144 million, principally in developing its oil and natural gas production capacity. This was a 42% increase over the investments made in the same period of 2002. • In 3Q03, production of petroleum and natural gas in Brazil grew nearly 2% over the same period of last year, reaching an average of 1,562 thousand barrels of oil and oil equivalent per day. In 3Q03, the average production of oil by-products in Brazil was 1,674 thousand barrels/day, with growth of 1% from January through September 2002. • PETROBRAS’ economic contribution to Brazil in period from Jan-Sept 2003, measured by the generation of taxes, fees, social contributions and government contributions, was R$ 38,668 million, a growth of 40% compared to the same period of 2002. • In light of the economic and financial performance from Jan-Sept 2003, PETROBRAS’ Board of Directors authorized a R$ 3,290 million distribution (R$3.00 per share) to shareholders in the form of interest on own capital. This will be distributed by February 2004, and w ill be deducted from the dividends to be discussed at the Shareholders’ General Meetingthat will meet to approve the allocation of 2003 results. • On September 30, 2003, the Company’s market value was R$ 68,692 million, representing 136% of the Holding Company’s net equity (R$ 50,558 million). This document is divided into 5 sections: PETROBRAS Index PETROBRAS Index Financial Performance 3 Financial Statements 29 Operating Performance 5 Financial Statements 14 Appendices 22 PETROBRAS RELEASES THIRD QUARTER 2003 RESULTS (Rio de Janeiro – November 13, 2003) – PETRÓLEO BRASILEIRO S.A. – PETROBRAS released its consolidated results expressed in millions of reais today, under Brazilian Generally Accepted Accounting Principles.
Transcript
1
PETROBRAS reported consolidated net income of R$ 5,361 million in the third quarter of 2003 (3Q03), a 40% increase over 2Q03. In the period from January through September 2003, PETROBRAS’ consolidated net income was R$ 14,774 million, an increase of 180% in relation to the same period of 2002. Consolidated net operating revenue in 3Q03 was R$ 23,798 million, and the Company’s market value on September 30, 2003 rose to R$ 68,692 million.
• Consolidated net income in 3Q03 was R$ 5,361 million, due mainly to the gross margin (42%), which was 7% higher than gross margin in 3Q02.
This performance reflects basically the alignment of the sales prices of some oil by-products in the domestic market to the international prices and the exchange rate devaluation. Consolidated net income was additionally affected by increased export revenues, which rose because of higher international oil prices and provisions for interest on own capital, which resulted in a fiscal savings of R$ 1,119 million.
However, this result was partially offset by higher costs of governmental participation in Brazil, third-party participation in consortiums in production oil areas, oil and oil by-product imports, lesser volumes sold in the domestic market (2%) and by the exchange loss of R$ 499 million as a result of the devaluation of the real, mainly in relation to assets and liabilities linked to US dollar (1.8%) and Yen (9.2%) on the 3Q/03 net of gains from participation in affiliated companies abroad.
• Gross consolidated revenue in 3Q03 was R$ 32,857 million, while net operating revenue was R$ 23,798 million. In the same quarter of last year, gross revenue and net revenue were R$ 29,095 million and R$ 21,295 million, respectively.
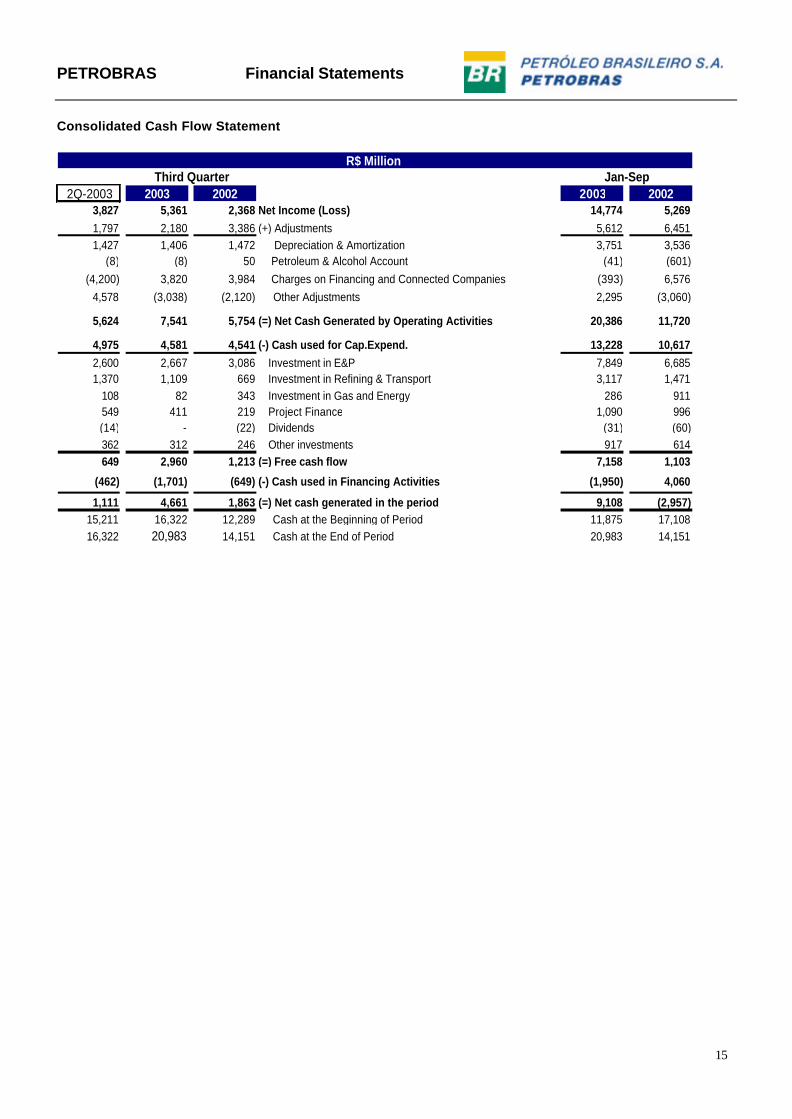
• From January through September 2003, PETROBRAS invested R$ 13,144 million, principally in developing its oil and natural gas production capacity. This was a 42%
increase over the investments made in the same period of 2002.
• In 3Q03, production of petroleum and natural gas in Brazil grew nearly 2% over the same period of last year, reaching an average of 1,562 thousand barrels of oil and oil equivalent per day. In 3Q03, the average production of oil by-products in Brazil was 1,674 thousand barrels/day, with growth of 1% from January through September 2002.
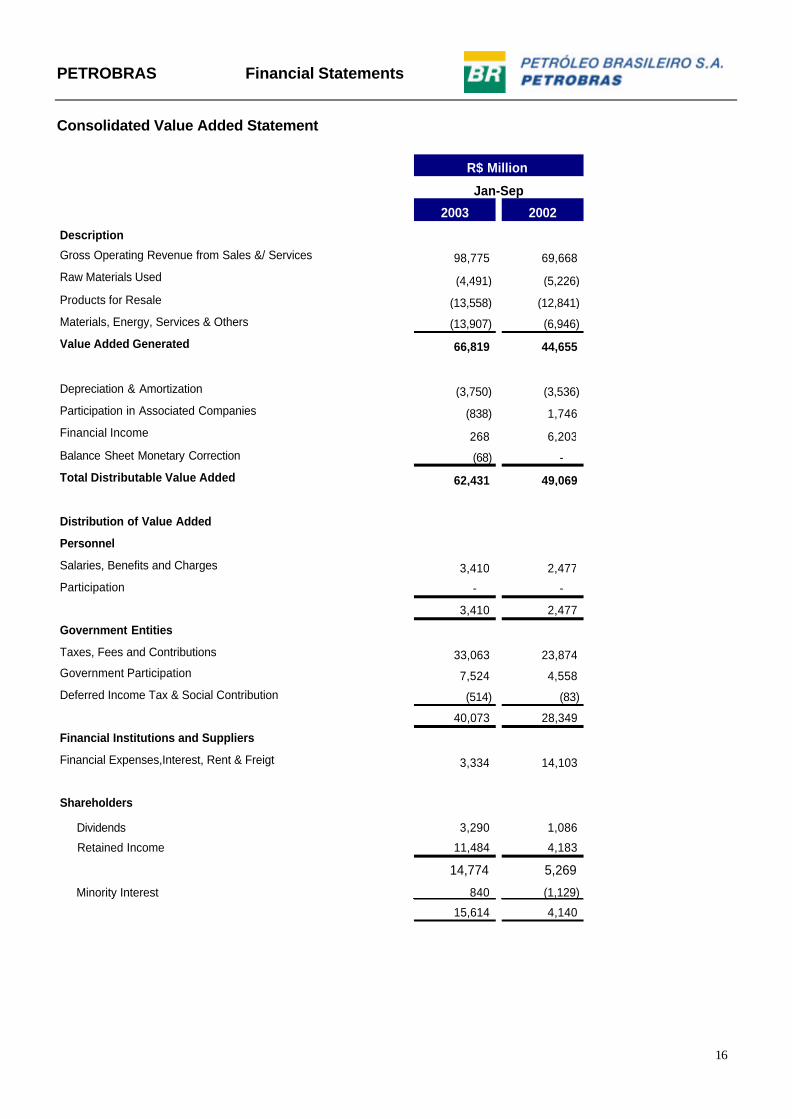
• PETROBRAS’ economic contribution to Brazil in period from Jan-Sept 2003, measured by the generation of taxes, fees, social contributions and government contributions, was R$ 38,668 million, a growth of 40% compared to the same period of 2002.
• In light of the economic and financial performance from Jan-Sept 2003, PETROBRAS’ Board of Directors authorized a R$ 3,290 million distribution (R$3.00 per share) to shareholders in the form of interest on own capital. This will be distributed by February 2004, and w ill be deducted from the dividends to be discussed at the Shareholders’ General Meetingthat will meet to approve the allocation of 2003 results.
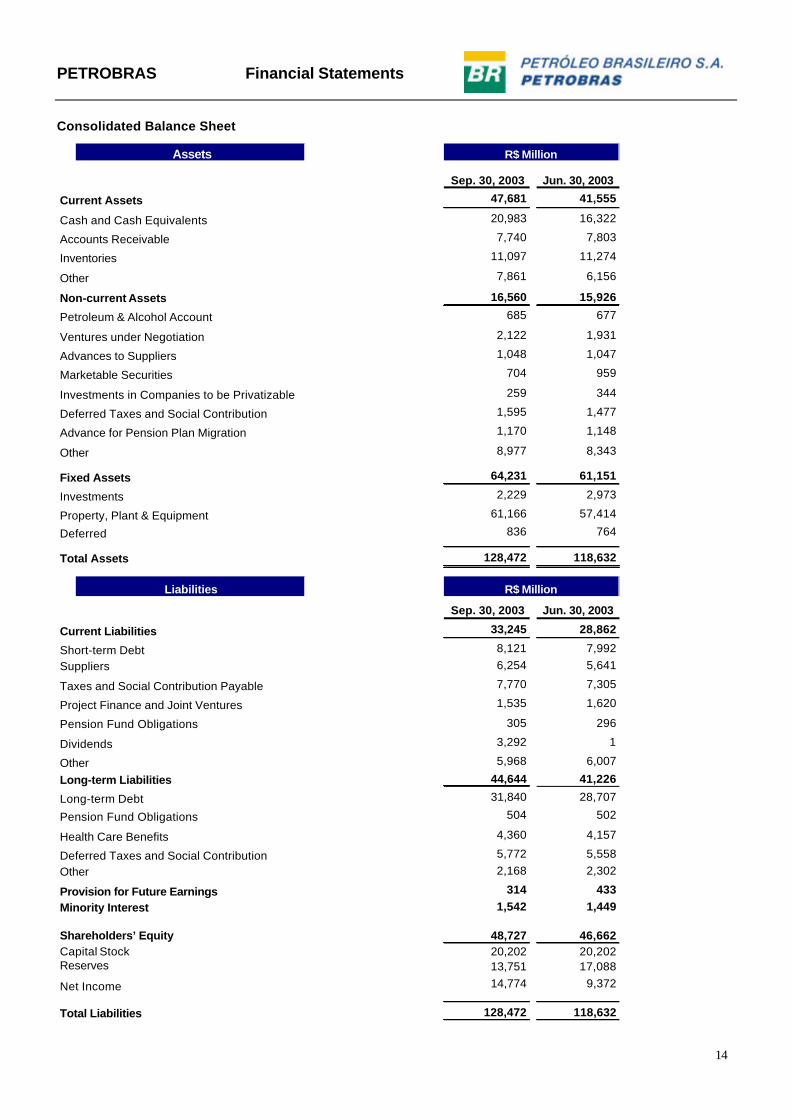
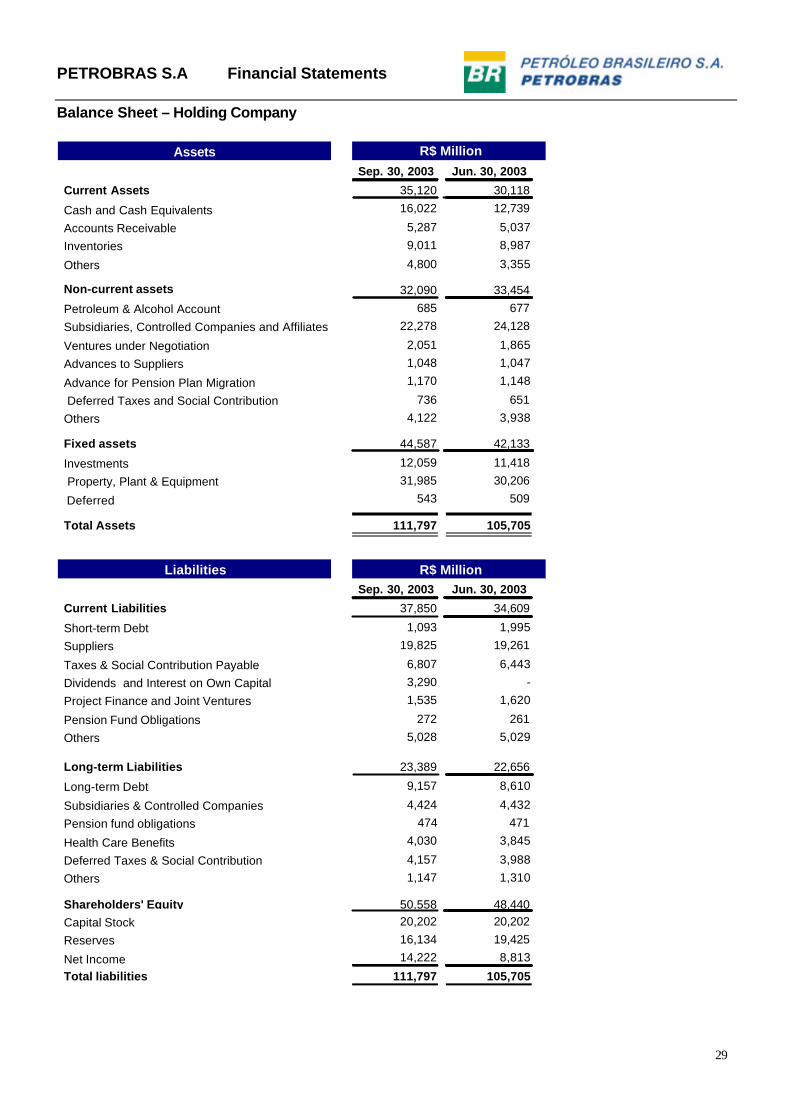
• On September 30, 2003, the Company’s market value was R$ 68,692 million, representing 136% of the Holding Company’s net equity (R$ 50,558 million).
This document is divided into 5 sections: PETROBRAS Index PETROBRAS Index Financial Performance 3 Financial Statements 29 Operating Performance 5 Financial Statements 14 Appendices 22
PETROBRAS RELEASES THIRD QUARTER 2003 RESULTS (Rio de Janeiro – November 13, 2003) – PETRÓLEO BRASILEIRO S.A. – PETROBRAS released its consolidated results expressed in millions of reais today, under Brazilian Generally Accepted Accounting Principles.
2
PETROBRAS S.A
Comments from the President, Mr. José Eduardo de Barros Dutra
This quarter marks the beginning of the commemoration of PETROBRAS’ 50th anniversary as a company, and we have more than enough reasons to celebrate this event. PETROBRAS completes a half-century of existence as the 15th largest oil company worldwide, the largest company in Brazil, and a leader in Latin America. As if to instill even more value to this 50th anniversary celebration, in the third quarter of 2003, net income reached R$ 5,361 million. Year to date, net income was R$ 14,774 million, representing an increase of 180% in relation to the same period of 2002, the best result in the Company history. On this occasion, it is noteworthy that PETROBRAS is, for the second consecutive time (2001 and 2002), listed among the top ten companies for the Anefac-Fipecafi-Serasa Award for Transparency, for which it went up against the 500 largest and best private companies in Brazil and the 50 largest state-owned companies. Investment rose to R$ 13 billion, mainly in the areas of exploration and production of petroleum and natural gas. As a result, not only did production grow, but important oil discoveries were also made, particularly in the state of Espírito Santo. On a consolidated basis, in the last 12 months discoveries in Brazil totally nearly 4 billion barrels of oil and 419 billion cubic meters of natural gas, representing 6.6 billion barrels of oil equivalents potentially recoverable. From January through September 2003, PETROBRAS’ export revenues increased 28%, compared to the same period of 2002 as a function of the reduction of sales in the domestic market and higher international oil prices. PETROBRAS’ positive evaluation by the capital markets became more evident with the successful issue of US$ 750 million in bonds in the international market. The strong interest shown by international investors resulted in the issue being snapped up in record time, with demand substantially higher than the offer. The signing of contracts that will make the US$ 1 billion financing for implantation of the Malhas Project should also be highlighted. This project involves extension of gas pipelines in the southeastern and northeastern regions of Brazil, which will expand the transport capacity of natural gas to the Northeast by 9 million cubic meters per day, and by 13 million cubic meters per day to the Southeast. PETROBRAS is an energy company with an international presence that seeks profitability in its businesses, and its activities are strongly associated with environmental and social responsibility, making it particularly significant to be awarded by the ABERJ, APIMEC, FIDES, IBASE and Instituto Ethos with the Social Balance Prize – “Prêmio Balanço Social” in the category National Outstanding Company for the year 2002. The important contribution from Petrobras to the country, measured by taxes and duties paid, already exceeds R$ 38 billion in the first nine months of the year. It is in this positive scenario that PETROBRAS reaches its 50th year with renewed energy and the challenge to continue growing over the next 50 years.
PETROBRAS Financial Performance
,
3
Net Income and Consolidated Economic Indicators
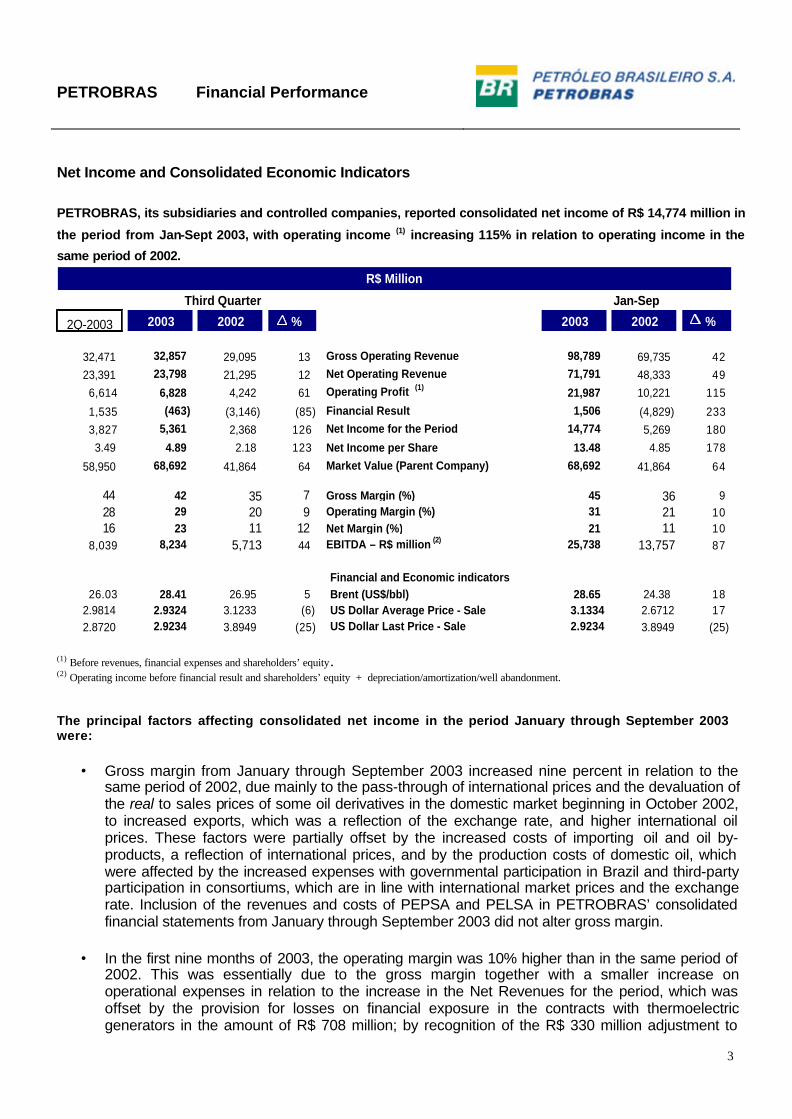
PETROBRAS, its subsidiaries and controlled companies, reported consolidated net income of R$ 14,774 million in
the period from Jan-Sept 2003, with operating income (1) increasing 115% in relation to operating income in the
1,535 (463) (3,146) (85) Financial Result 1,506 (4,829) 2333,827 5,361 2,368 126 Net Income for the Period 14,774 5,269 1803.49 4.89 2.18 123 Net Income per Share 13.48 4.85 178
2.9814 2.9324 3.1233 (6) US Dollar Average Price - Sale 3.1334 2.6712 17 2.8720 2.9234 3.8949 (25) US Dollar Last Price - Sale 2.9234 3.8949 (25)
R$ Million
Third Quarter Jan-Sep
(1) Before revenues, financial expenses and shareholders’ equity. (2) Operating income before financial result and shareholders’ equity + depreciation/amortization/well abandonment. The principal factors affecting consolidated net income in the period January through September 2003 were:
• Gross margin from January through September 2003 increased nine percent in relation to the
same period of 2002, due mainly to the pass-through of international prices and the devaluation of the real to sales prices of some oil derivatives in the domestic market beginning in October 2002, to increased exports, which was a reflection of the exchange rate, and higher international oil prices. These factors were partially offset by the increased costs of importing oil and oil by-products, a reflection of international prices, and by the production costs of domestic oil, which were affected by the increased expenses with governmental participation in Brazil and third-party participation in consortiums, which are in line with international market prices and the exchange rate. Inclusion of the revenues and costs of PEPSA and PELSA in PETROBRAS’ consolidated financial statements from January through September 2003 did not alter gross margin.
• In the first nine months of 2003, the operating margin was 10% higher than in the same period of
2002. This was essentially due to the gross margin together with a smaller increase on operational expenses in relation to the increase in the Net Revenues for the period, which was offset by the provision for losses on financial exposure in the contracts with thermoelectric generators in the amount of R$ 708 million; by recognition of the R$ 330 million adjustment to
PETROBRAS Financial Performance
4
market value of gas turbine generators, which generators were initially projected to be used in thermoelectric projects, but which are currently without any prospects for utilization; for provision of the R$ 160 million contingency related to INSS notifications, which attribute responsibility to PETROBRAS for amounts not paid by its service providers; and for liquidation of the hedge to cover financial operations in Japanese yen, which caused aloss of R$ 198 million. PEPSA and PELSA did not affect the consolidated operating margin.
• Net margin from January through September 2003 increased 10 percent over the same period of
the previous year as a function of gross margin; reduction in net financial expenses due to appreciation of the real against the dollar from Jan-Sept. 2003 (17% compared with the 68% devaluation in the same period of 2002); the provision made for interest on own capital that resulted in fiscal savings of R$ 1,119 million in spite of the growth mentioned in the operational margin in operating expenses; and the exchange rate loss in the conversion of R$ 1,013 million in net equity of controlled companies abroad due to appreciation of the real. Inclusion of PEPSA’s and PELSA’s financial statements did not affect consolidated net margin.
• Two percent increase in domestic production of oil and GNL, in relation to the first nine months of
2002. This resulted in an increased share of national oil in the load processed in refineries (81% in the period Jan-Sept 2003, and 80% in the same period of 2002).
• Net positive financial result in the amount of R$ 1,506 million, due to appreciation of the real
against the dollar from January through September 2003 (17%).
• An write-off in the amount of R$ 448 million related to wells that were identified as dry or sub-commercial.
PETROBRAS Operating Performance
5
2Q-2003 2003 1 2002 % 2003 2002 %
1.775 1.727 1.560 11 Oil and LNG production 1.708 1.550 10
1.512 1.562 1.526 2 Domestic 1.549 1.515 2
263 165 34 385 International 159 35 354
163 165 34 385 International - Pro Forma** 159 35 354
371 341 273 25 Natural Gas production * 332 278 19
242 254 249 2 Domestic 248 257 (4)
129 87 24 263 International 84 21 300
85 87 24 263 International - Pro Forma** 84 21 300
2.146 2.068 1.833 13 Total production 2.040 1.828 12
* Does not include liquified gas. Includes reinjected gas
Oil (US$/bbl)25,21 26,16 25,40 3 Brazil 27,09 22,13 22
23,39 20,08 25,65 (22) International 22,47 22,81 (1)
Natural Gas (US$/mcf)1,81 1,87 1,10 70 Brazil 1,75 1,28 37
1,03 1,12 1,17 (4) International 1,14 1,27 (10)
269 360 392 (8) Crude oil imports 322 355 (9)
127 125 213 (41) Oil product imports 121 198 (39)
95 91 56 63 Import of gas, alcohol and others 86 62 39
129 129 91 5 • International - Pro - Forma ** 129 91 2
Use of Installed Capacity (%)
83 84 85 (1) • Brazil 83 84 (1)
92 75 79 (4) • International 73 68 5
72 75 79 (4) • International - Pro - Forma ** 73 68 5
82 80 80 0 Domestic crude as % of total feedstock processed 81 80 1
Lifting Costs:
• Brazil
3,33 3,50 2,76 27 • • without government participation 3,23 3,03 7
8,05 8,58 6,97 23 • • with government participation 8,37 6,89 21
2,42 2,43 2,23 9 • International 2,36 2,22 6
2,21 2,43 2,23 9 • International - Pro - Forma ** 2,36 2,22 6
Refining cost
1,07 1,07 0,84 27 • Brazil 1,01 0,95 6
1,27 1,12 0,87 29 • International 1,09 1,00 9
1,16 1,12 0,87 29 • International - Pro - Forma ** 1,09 1,00 9
155 181 121 50 Overhead in US$ million (1) 474 428 11
1.478 1.542 1.615 (5) Total Oil Products 1.500 1.600 (6)27 39 41 (5) Alcohol, Nitrogen and others 32 34 (6)
174 194 157 24 Natural Gas 172 148 161.679 1.775 1.813 (2) Total domestic market 1.704 1.782 (4)
440 469 506 (7) Exports 455 466 (2)389 307 122 152 International Sales 297 123 141829 776 628 24 Total international market 752 589 28
2.508 2.551 2.441 5 Total 2.456 2.371 4278 307 122 152 Total Pro Forma International Market 297 123 141
** Includes pro forma PEPSA and PELSA information in the 2Q03, presenting the months of April, May and June of 2003
Sales Volume - Thousands bpd
Third Quarter Jan-Sep
Exploration & Production - Thousands bpd
Refining, Transport and Supply - Thousands bpd
Average Sales Price - US$ per bbl / mcf
(1) In order to make the "Corporate Overhead" indicator more meaningful in its management model, the Company reviewed its components, and recalculated for previous periods.
Cost - US$/barrel
PETROBRAS Operating Performance
6
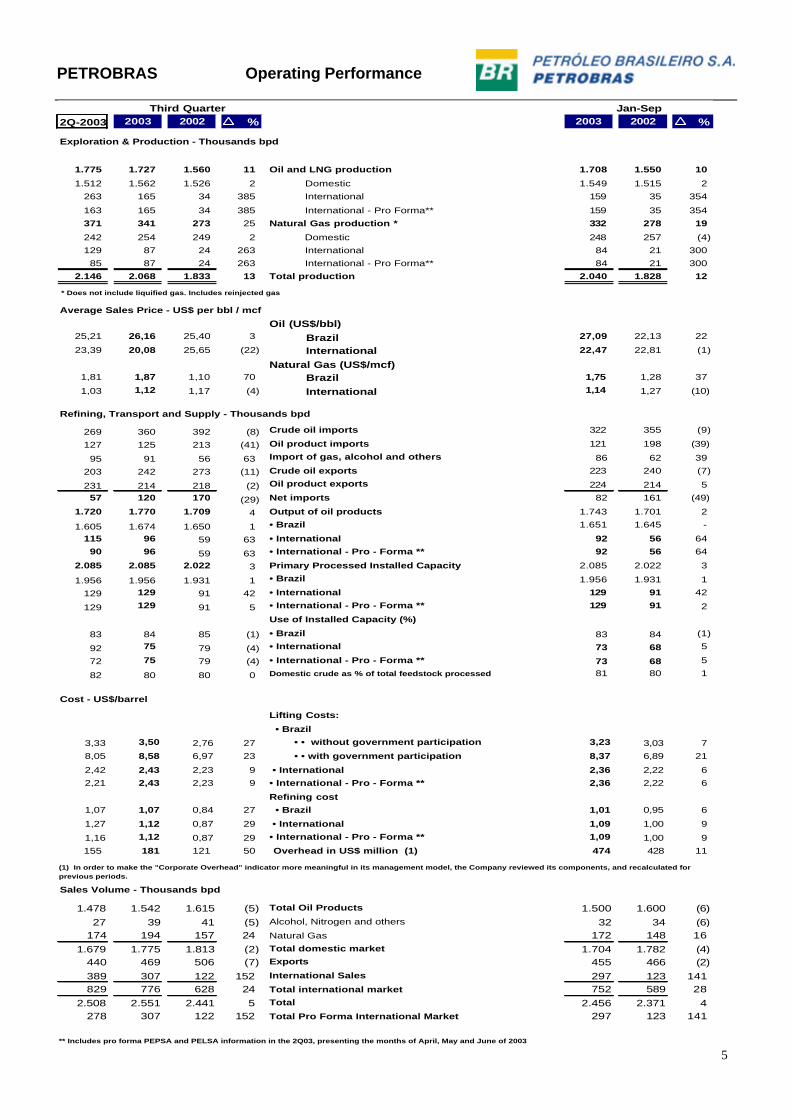
Exploration and Production – Thousand bpd
Production of domestic oil and NGL in 3Q03 was 3% higher than production in 2Q03, due essentially to the stops on platforms P-35 and P-19 (Marlim) in the months of May and June 2003, for flare repair.
International production of oil and NGL in 3Q03, considering production of Petrobras Energia Participaciones S.A. – PEPSA, and Petrolera Entre Lomas – PELSA in 2Q03 (pro forma), increased 1% in relation to the previous quarter, due to increased production in the San Antonio block in Bolivia, and increased production in Venezuela, Peru and Ecuador.
Production of domestic oil and NGL in the period from January through September 2003 increased 2% in relation to the same period of 2002, due to the entry into production of new wells in the Marlim field, in Espadarte (ESPF), and installation of the production system in the Marlim Sul field. Entry into production of FPSO Brasil in Roncador in December 2002, the Jubarte field in October 2002, and the Coral field in February 2003, also contributed to increased production in the period.
From Jan-Sept 2003, international production of oil and gas increased 334% in relation to the same period of 2002, due basically to inclusion of production of the companies Petrolera Santa Fe, Petrolera Entre Lomas and PEPSA in Argentina, and increased production in Bolivia due to the demand for gas contracted in the period. Part of this increase was offset by the expected reduction in production of “mature” fields in Angola, Colombia and the United States.
Refining, Transport and Supply – Th. bpd
The 1% increase in the share of domestic oil in the load processed in refineries from Jan-Sept 2003, if compared to the same period of 2002, is a sign of success in the search for higher profitability. This result is due to continuous improvement in refinery performance as they seek operating excellence.
Costs – US$/barrel
The lifting cost in Brazil, excluding government participation from Jan-Sept 2003, increased 7% in relation to the same period of the previous year. This result was due to higher expenses for technical services in maintenance activities on oil flow lines, equipment, and installations that support production, plus the increased transport expenses principally with the Marlim, Albacora, Enchova, Namorado, Garoupa, Corvina and Cherne fields. The 5% growth in 3Q03 in comparison with 2Q03 is due mainly to larger expenses with technical services in drilling activities, restoration and well interventions, undersea operations, inspections, maintenance and the increased cost of renting sounding equipment, mainly in the Marlim, Albacora and Pargo fields. In addition, there were higher expenses for gas compression and oil collection in the Marimba, Piraúna, Marlim and Espadarte fields.
From Jan-Sept 2003 the lifting cost in Brazil, including governmental participation, increased 21% in relation to the same period last year, due to the new price of special participation in the Marlim Sul field. This is a function of the larger volumes produced, inclusion of the Canto do Amaro and Roncador fields as taxable for payment of special participation, and to the growth of reference prices for domestic oil. When compared with 2Q03, Brazil’s lifting cost including government participation increased 7% due to higher reference prices for domestic oil.
The international lifting cost from Jan-Sept 2003 rose 6% in relation to the same period of 2002 because of incorporation of the higher unit costs of Petrolera Santa Fe, Petrolera Entre Lomas and PEPSA in Argentina, as well as the increased expenses in relation to the start of production of the San Antonio block in Bolivia. This increase was partially offset by lower maintenance expenses at the Arauca field, and lower consumption of natural gas and diesel oil at the Upia field, both of which are in Colombia.
Domestic unit refining costs from Jan-Sept 2003 rose 6% in relation to the same period of the
PETROBRAS Operating Performance
7
previous year, essentially due to the increased expenses related to chemical products and catalyzers. In comparison to 2Q03, Brazil’s refining cost in 3Q03 remained stable.
From Jan-Sept 2003, the international unit refining cost rose 9% over the same period of 2002, a function of including PEPSA’s unit costs and the larger expenses associated with maintenance of the volumetric control system, electricity, and health and safety at EG3.
The 11% increase in overhead expenses from January through September 2003, when compared with the same period of the prior year, is due to the increase in expenses related to salary and benefits following the most recent salary adjustment, effective since September 2002, and to the increased number of employees at the Company, plus the larger expenses with advertising and sponsorships. These effects were partially offset by the conversion into dollars of costs originally in
Brazilian currency, because of the average devaluation of the real against the U.S. dollar between the two periods, and by the extraordinary costs from January through September 2002, with the incentive to employees to move to the Company’s new pension plan. The larger expenses for advertising, sponsorships and data processing services provoked a 17% rise in 3Q03 overhead costs when compared with 2Q03.
Sales volume – Th. bpd
Reduced economic activity in Brazil and the consequent loss of purchasing power for the general population is reflected in the decreased market for oil by-products, principally in sales of diesel oil, gasoline, QAV and fuel oil. Thus the sales volume between January and September 2003 fell by 4% in the domestic market in relation to the same period of 2002.
PETROBRAS Operating Performance
8
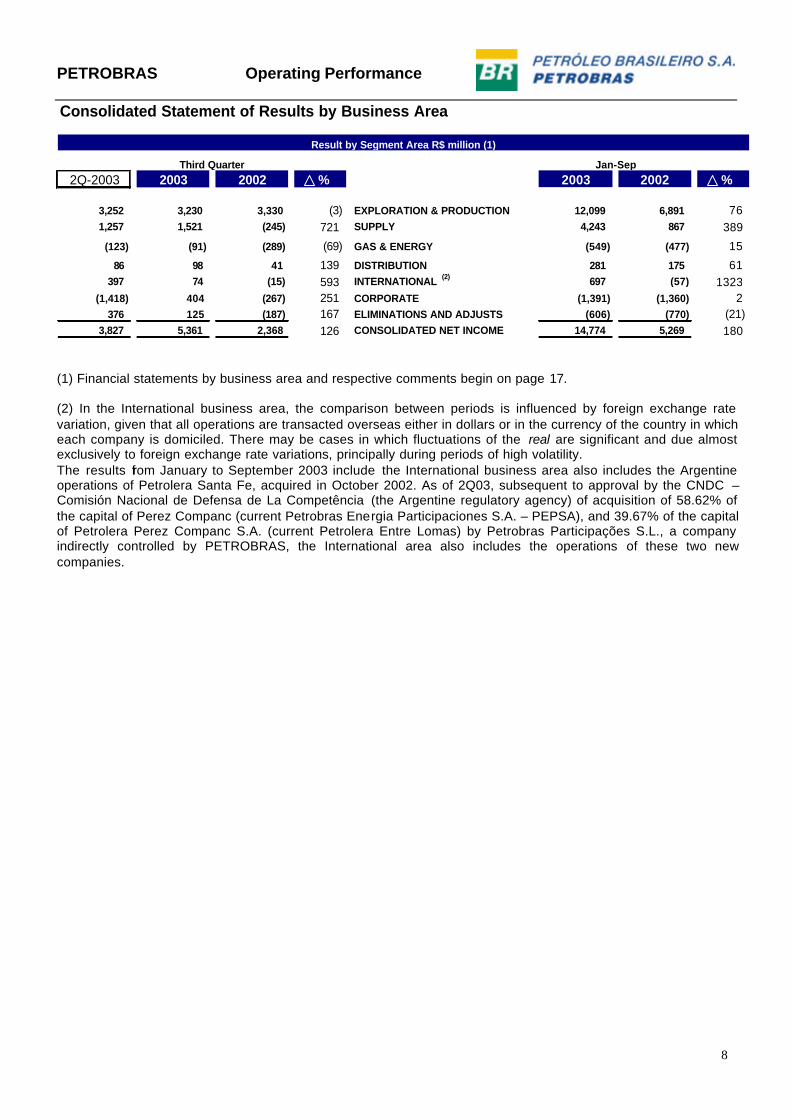
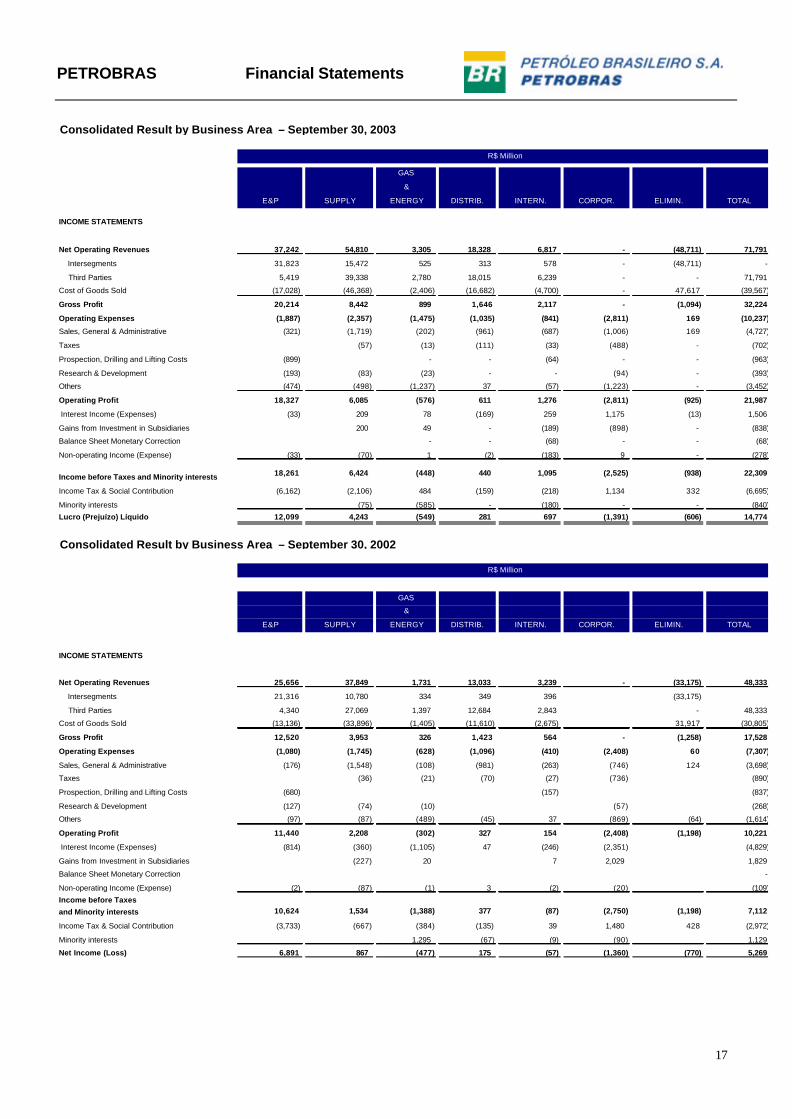
Consolidated Statement of Results by Business Area
3,827 5,361 2,368 126 CONSOLIDATED NET INCOME 14,774 5,269 180
Jan-Sep
Result by Segment Area R$ million (1)
Third Quarter
(1) Financial statements by business area and respective comments begin on page 17. (2) In the International business area, the comparison between periods is influenced by foreign exchange rate variation, given that all operations are transacted overseas either in dollars or in the currency of the country in which each company is domiciled. There may be cases in which fluctuations of the real are significant and due almost exclusively to foreign exchange rate variations, principally during periods of high volatility. The results from January to September 2003 include the International business area also includes the Argentine operations of Petrolera Santa Fe, acquired in October 2002. As of 2Q03, subsequent to approval by the CNDC – Comisión Nacional de Defensa de La Competência (the Argentine regulatory agency) of acquisition of 58.62% of the capital of Perez Companc (current Petrobras Energia Participaciones S.A. – PEPSA), and 39.67% of the capital of Petrolera Perez Companc S.A. (current Petrolera Entre Lomas) by Petrobras Participações S.L., a company indirectly controlled by PETROBRAS, the International area also includes the operations of these two new companies.
PETROBRAS Operating Performance
9
Results by Business Area
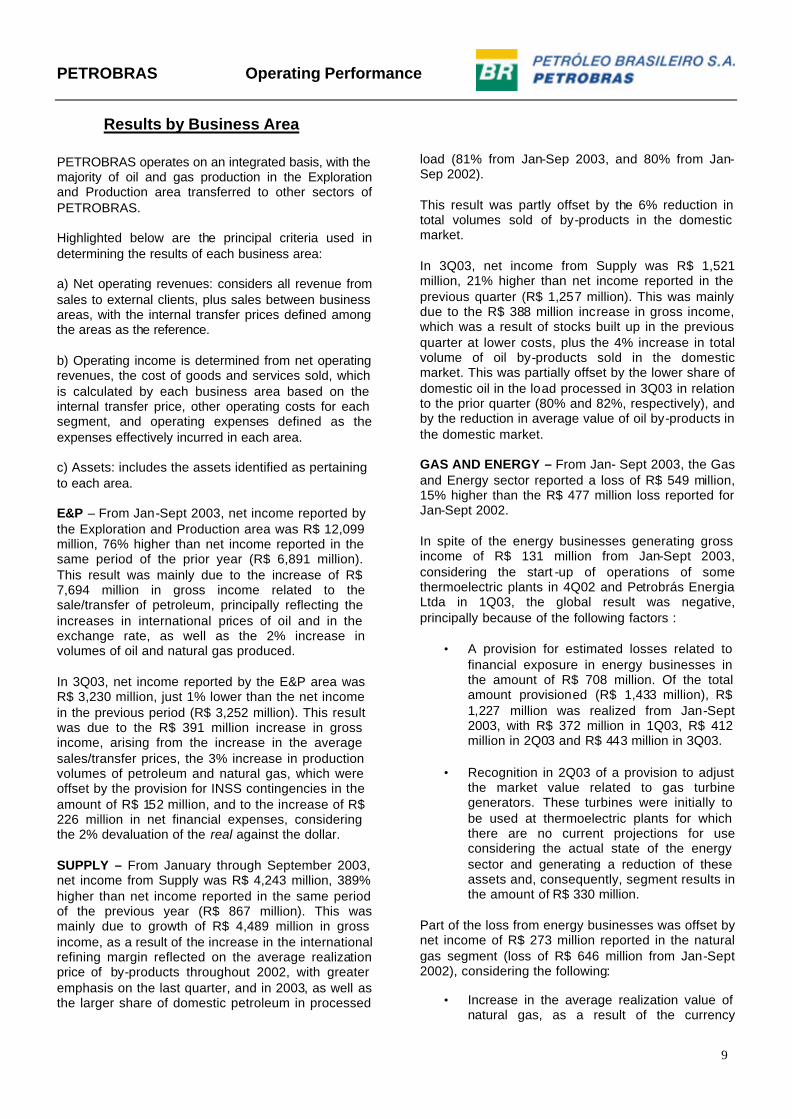
PETROBRAS operates on an integrated basis, with the majority of oil and gas production in the Exploration and Production area transferred to other sectors of PETROBRAS. Highlighted below are the principal criteria used in determining the results of each business area: a) Net operating revenues: considers all revenue from sales to external clients, plus sales between business areas, with the internal transfer prices defined among the areas as the reference. b) Operating income is determined from net operating revenues, the cost of goods and services sold, which is calculated by each business area based on the internal transfer price, other operating costs for each segment, and operating expenses defined as the expenses effectively incurred in each area. c) Assets: includes the assets identified as pertaining to each area. E&P – From Jan-Sept 2003, net income reported by the Exploration and Production area was R$ 12,099 million, 76% higher than net income reported in the same period of the prior year (R$ 6,891 million). This result was mainly due to the increase of R$ 7,694 million in gross income related to the sale/transfer of petroleum, principally reflecting the increases in international prices of oil and in the exchange rate, as well as the 2% increase in volumes of oil and natural gas produced. In 3Q03, net income reported by the E&P area was R$ 3,230 million, just 1% lower than the net income in the previous period (R$ 3,252 million). This result was due to the R$ 391 million increase in gross income, arising from the increase in the average sales/transfer prices, the 3% increase in production volumes of petroleum and natural gas, which were offset by the provision for INSS contingencies in the amount of R$ 152 million, and to the increase of R$ 226 million in net financial expenses, considering the 2% devaluation of the real against the dollar. SUPPLY – From January through September 2003, net income from Supply was R$ 4,243 million, 389% higher than net income reported in the same period of the previous year (R$ 867 million). This was mainly due to growth of R$ 4,489 million in gross income, as a result of the increase in the international refining margin reflected on the average realization price of by-products throughout 2002, with greater emphasis on the last quarter, and in 2003, as well as the larger share of domestic petroleum in processed
load (81% from Jan-Sep 2003, and 80% from Jan-Sep 2002). This result was partly offset by the 6% reduction in total volumes sold of by-products in the domestic market. In 3Q03, net income from Supply was R$ 1,521 million, 21% higher than net income reported in the previous quarter (R$ 1,257 million). This was mainly due to the R$ 388 million increase in gross income, which was a result of stocks built up in the previous quarter at lower costs, plus the 4% increase in total volume of oil by-products sold in the domestic market. This was partially offset by the lower share of domestic oil in the load processed in 3Q03 in relation to the prior quarter (80% and 82%, respectively), and by the reduction in average value of oil by-products in the domestic market. GAS AND ENERGY – From Jan- Sept 2003, the Gas and Energy sector reported a loss of R$ 549 million, 15% higher than the R$ 477 million loss reported for Jan-Sept 2002. In spite of the energy businesses generating gross income of R$ 131 million from Jan-Sept 2003, considering the start -up of operations of some thermoelectric plants in 4Q02 and Petrobrás Energia Ltda in 1Q03, the global result was negative, principally because of the following factors :
• A provision for estimated losses related to financial exposure in energy businesses in the amount of R$ 708 million. Of the total amount provisioned (R$ 1,433 million), R$ 1,227 million was realized from Jan-Sept 2003, with R$ 372 million in 1Q03, R$ 412 million in 2Q03 and R$ 443 million in 3Q03.
• Recognition in 2Q03 of a provision to adjust
the market value related to gas turbine generators. These turbines were initially to be used at thermoelectric plants for which there are no current projections for use considering the actual state of the energy sector and generating a reduction of these assets and, consequently, segment results in the amount of R$ 330 million.
Part of the loss from energy businesses was offset by net income of R$ 273 million reported in the natural gas segment (loss of R$ 646 million from Jan-Sept 2002), considering the following:
• Increase in the average realization value of natural gas, as a result of the currency
PETROBRAS Operating Performance
10
devaluation and the increase in fuel oil prices in the international market;
• 12% growth in volumes sold, a result of continuous substitution to fuel oil (ceramics industry and thermoelectric plants) and increased automotive use;
• Financial revenues following the 17% appreciation of the real against the dollar on the debt related to construction of the Bolivia to Brazil gas pipeline.
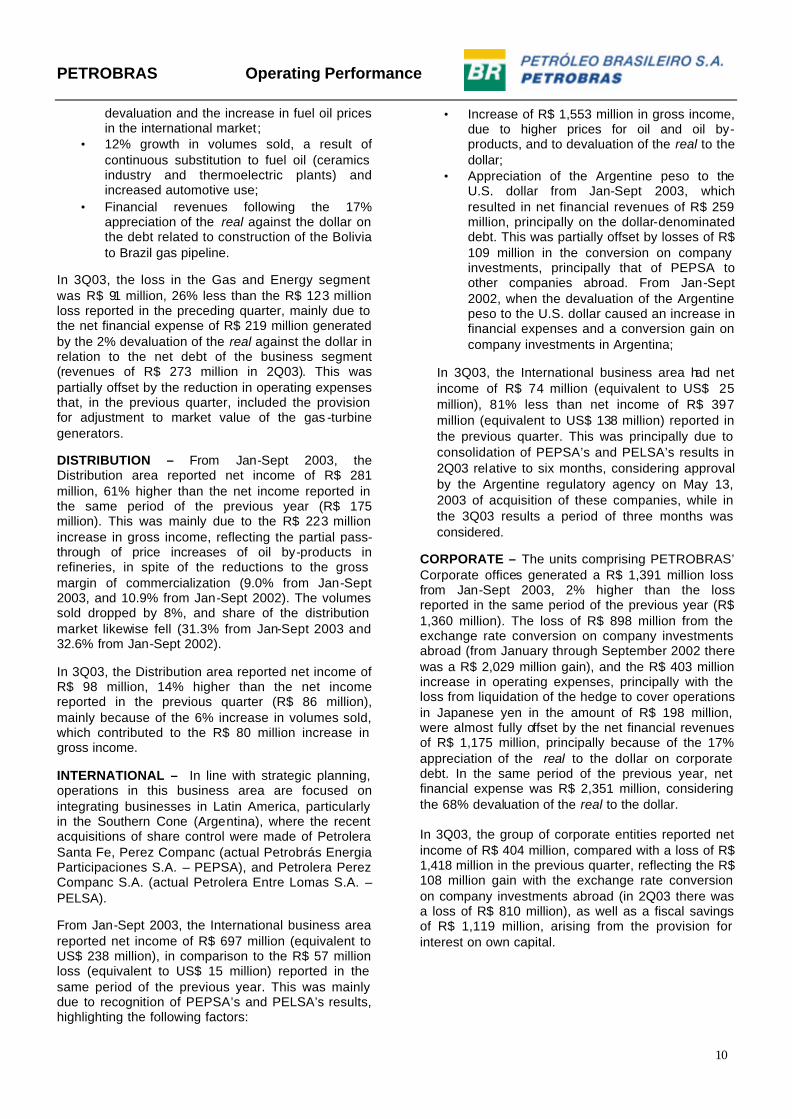
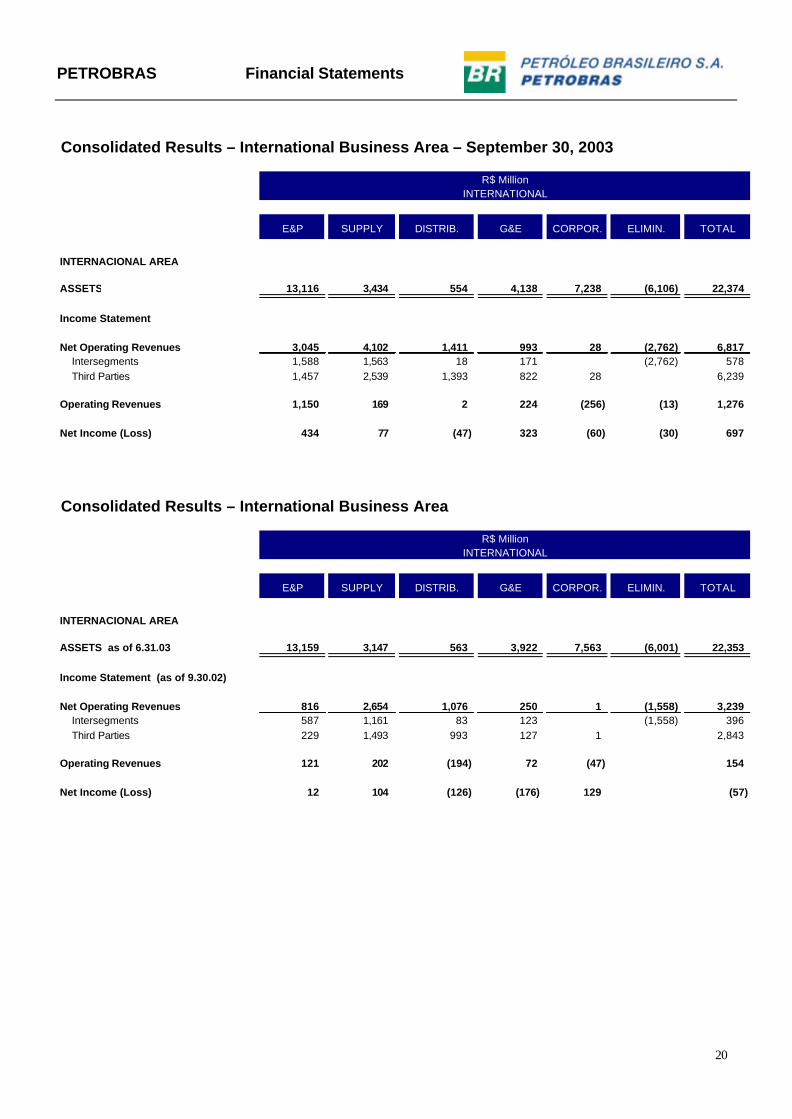
In 3Q03, the loss in the Gas and Energy segment was R$ 91 million, 26% less than the R$ 123 million loss reported in the preceding quarter, mainly due to the net financial expense of R$ 219 million generated by the 2% devaluation of the real against the dollar in relation to the net debt of the business segment (revenues of R$ 273 million in 2Q03). This was partially offset by the reduction in operating expenses that, in the previous quarter, included the provision for adjustment to market value of the gas -turbine generators. DISTRIBUTION – From Jan-Sept 2003, the Distribution area reported net income of R$ 281 million, 61% higher than the net income reported in the same period of the previous year (R$ 175 million). This was mainly due to the R$ 223 million increase in gross income, reflecting the partial pass-through of price increases of oil by-products in refineries, in spite of the reductions to the gross margin of commercialization (9.0% from Jan-Sept 2003, and 10.9% from Jan-Sept 2002). The volumes sold dropped by 8%, and share of the distribution market likewise fell (31.3% from Jan-Sept 2003 and 32.6% from Jan-Sept 2002). In 3Q03, the Distribution area reported net income of R$ 98 million, 14% higher than the net income reported in the previous quarter (R$ 86 million), mainly because of the 6% increase in volumes sold, which contributed to the R$ 80 million increase in gross income. INTERNATIONAL – In line with strategic planning, operations in this business area are focused on integrating businesses in Latin America, particularly in the Southern Cone (Argentina), where the recent acquisitions of share control were made of Petrolera Santa Fe, Perez Companc (actual Petrobrás Energia Participaciones S.A. – PEPSA), and Petrolera Perez Companc S.A. (actual Petrolera Entre Lomas S.A. – PELSA). From Jan-Sept 2003, the International business area reported net income of R$ 697 million (equivalent to US$ 238 million), in comparison to the R$ 57 million loss (equivalent to US$ 15 million) reported in the same period of the previous year. This was mainly due to recognition of PEPSA’s and PELSA’s results, highlighting the following factors:
• Increase of R$ 1,553 million in gross income, due to higher prices for oil and oil by-products, and to devaluation of the real to the dollar;
• Appreciation of the Argentine peso to the U.S. dollar from Jan-Sept 2003, which resulted in net financial revenues of R$ 259 million, principally on the dollar-denominated debt. This was partially offset by losses of R$ 109 million in the conversion on company investments, principally that of PEPSA to other companies abroad. From Jan-Sept 2002, when the devaluation of the Argentine peso to the U.S. dollar caused an increase in financial expenses and a conversion gain on company investments in Argentina;
In 3Q03, the International business area had net income of R$ 74 million (equivalent to US$ 25 million), 81% less than net income of R$ 397 million (equivalent to US$ 138 million) reported in the previous quarter. This was principally due to consolidation of PEPSA’s and PELSA’s results in 2Q03 relative to six months, considering approval by the Argentine regulatory agency on May 13, 2003 of acquisition of these companies, while in the 3Q03 results a period of three months was considered.
CORPORATE – The units comprising PETROBRAS’ Corporate offices generated a R$ 1,391 million loss from Jan-Sept 2003, 2% higher than the loss reported in the same period of the previous year (R$ 1,360 million). The loss of R$ 898 million from the exchange rate conversion on company investments abroad (from January through September 2002 there was a R$ 2,029 million gain), and the R$ 403 million increase in operating expenses, principally with the loss from liquidation of the hedge to cover operations in Japanese yen in the amount of R$ 198 million, were almost fully offset by the net financial revenues of R$ 1,175 million, principally because of the 17% appreciation of the real to the dollar on corporate debt. In the same period of the previous year, net financial expense was R$ 2,351 million, considering the 68% devaluation of the real to the dollar. In 3Q03, the group of corporate entities reported net income of R$ 404 million, compared with a loss of R$ 1,418 million in the previous quarter, reflecting the R$ 108 million gain with the exchange rate conversion on company investments abroad (in 2Q03 there was a loss of R$ 810 million), as well as a fiscal savings of R$ 1,119 million, arising from the provision for interest on own capital.
PETROBRAS Operating Performance
11
Consolidated Debt
Sep. 30, 2003 Jun. 30,2003 % Dec. 31, 2002
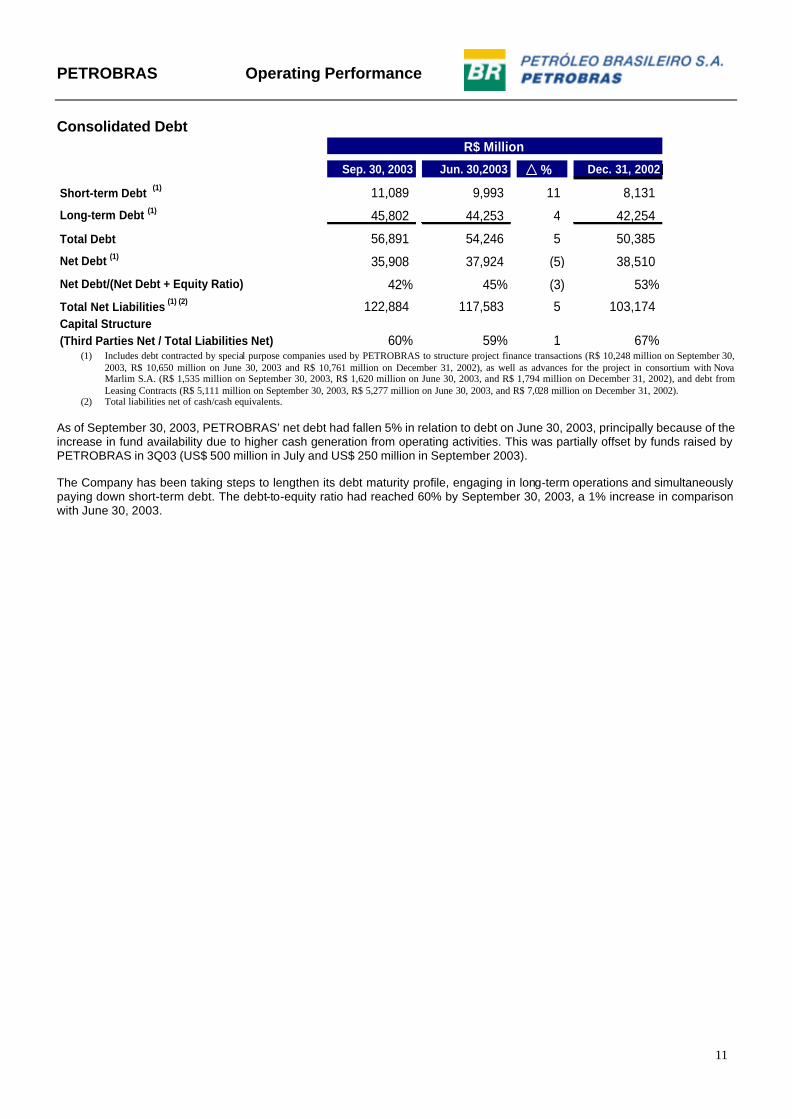
Short-term Debt (1) 11,089 9,993 11 8,131
Long-term Debt (1) 45,802 44,253 4 42,254
Total Debt 56,891 54,246 5 50,385
Net Debt (1) 35,908 37,924 (5) 38,510
Net Debt/(Net Debt + Equity Ratio) 42% 45% (3) 53%
Total Net Liabilities (1) (2) 122,884 117,583 5 103,174 Capital Structure (Third Parties Net / Total Liabilities Net) 60% 59% 1 67%
R$ Million
(1) Includes debt contracted by special purpose companies used by PETROBRAS to structure project finance transactions (R$ 10,248 million on September 30,
2003, R$ 10,650 million on June 30, 2003 and R$ 10,761 million on December 31, 2002), as well as advances for the project in consortium with Nova Marlim S.A. (R$ 1,535 million on September 30, 2003, R$ 1,620 million on June 30, 2003, and R$ 1,794 million on December 31, 2002), and debt from Leasing Contracts (R$ 5,111 million on September 30, 2003, R$ 5,277 million on June 30, 2003, and R$ 7,028 million on December 31, 2002).
(2) Total liabilities net of cash/cash equivalents. As of September 30, 2003, PETROBRAS’ net debt had fallen 5% in relation to debt on June 30, 2003, principally because of the increase in fund availability due to higher cash generation from operating activities. This was partially offset by funds raised by PETROBRAS in 3Q03 (US$ 500 million in July and US$ 250 million in September 2003). The Company has been taking steps to lengthen its debt maturity profile, engaging in long-term operations and simultaneously paying down short-term debt. The debt-to-equity ratio had reached 60% by September 30, 2003, a 1% increase in comparison with June 30, 2003.
PETROBRAS Operating Performance
12
Consolidated Investments
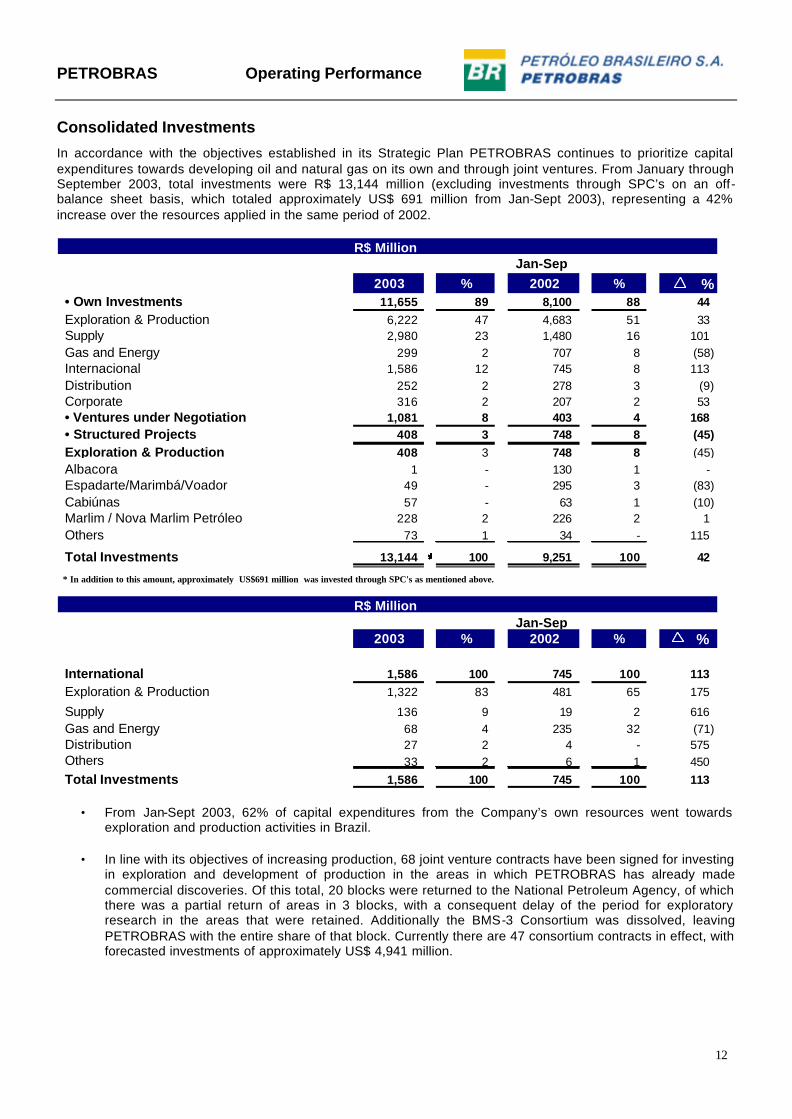
In accordance with the objectives established in its Strategic Plan PETROBRAS continues to prioritize capital expenditures towards developing oil and natural gas on its own and through joint ventures. From January through September 2003, total investments were R$ 13,144 million (excluding investments through SPC’s on an off-balance sheet basis, which totaled approximately US$ 691 million from Jan-Sept 2003), representing a 42% increase over the resources applied in the same period of 2002.
* In addition to this amount, approximately US$691 million was invested through SPC's as mentioned above.
2003 % 2002 % %
International 1,586 100 745 100 113 Exploration & Production 1,322 83 481 65 175
Supply 136 9 19 2 616 Gas and Energy 68 4 235 32 (71) Distribution 27 2 4 - 575 Others 33 2 6 1 450 Total Investments 1,586 100 745 100 113
Jan-SepR$ Million
R$ Million Jan-Sep
******
• From Jan-Sept 2003, 62% of capital expenditures from the Company’s own resources went towards exploration and production activities in Brazil.
• In line with its objectives of increasing production, 68 joint venture contracts have been signed for investing
in exploration and development of production in the areas in which PETROBRAS has already made commercial discoveries. Of this total, 20 blocks were returned to the National Petroleum Agency, of which there was a partial return of areas in 3 blocks, with a consequent delay of the period for exploratory research in the areas that were retained. Additionally the BMS-3 Consortium was dissolved, leaving PETROBRAS with the entire share of that block. Currently there are 47 consortium contracts in effect, with forecasted investments of approximately US$ 4,941 million.
Interest Income (Expenses) (814) (360) (1,105) 47 (246) (2,351) (4,829)
Gains from Investment in Subsidiaries (227) 20 7 2,029 1,829
Balance Sheet Monetary Correction -
Non-operating Income (Expense) (2) (87) (1) 3 (2) (20) (109)
Income before Taxes
and Minority interests
Income Tax & Social Contribution (3,733) (667) (384) (135) 39 1,480 428 (2,972)
Minority interests 1,295 (67) (9) (90) 1,129
Net Income (Loss) 6,891 867 (477) 175 (57) (1,360) (770) 5,269
R$ Million
1,534 (1,388) 377 (87) (2,750) (1,198) 7,112
R$ Million
10,624
PETROBRAS Financial Statements
18
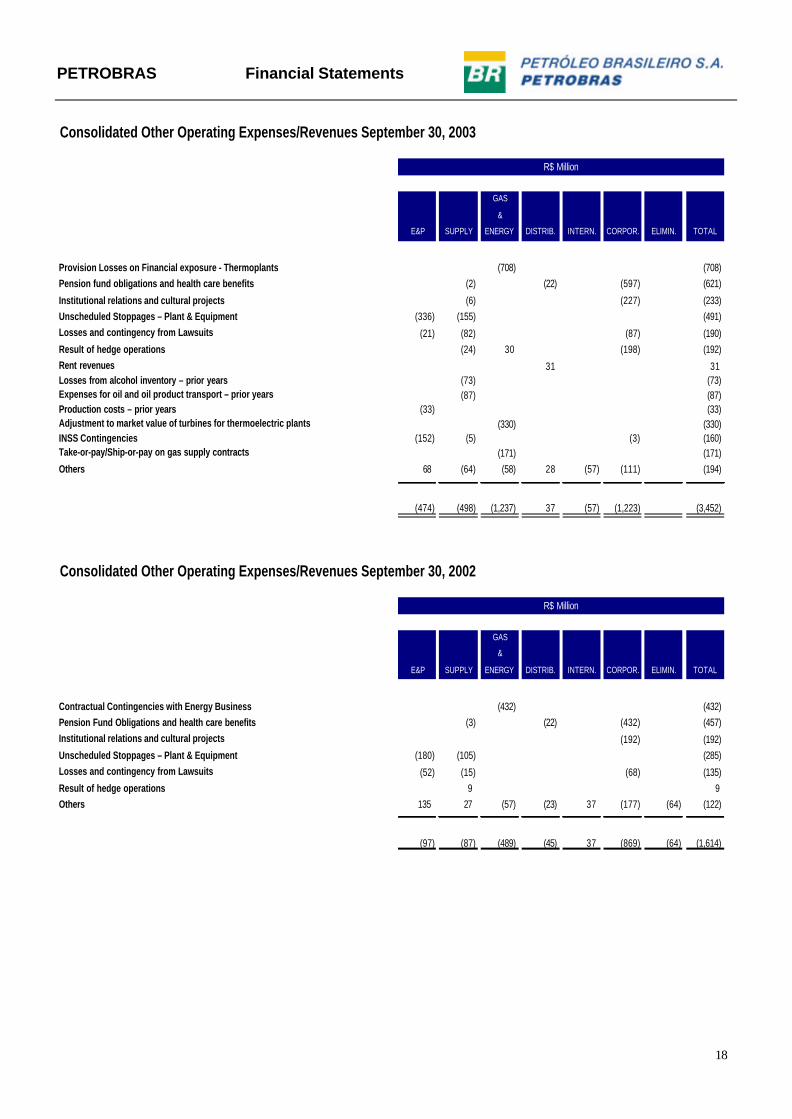
Consolidated Other Operating Expenses/Revenues September 30, 2003
GAS
&
E&P SUPPLY ENERGY DISTRIB. INTERN. CORPOR. ELIMIN. TOTAL
Provision Losses on Financial exposure - Thermoplants (708) (708)Pension fund obligations and health care benefits (2) (22) (597) (621)
Institutional relations and cultural projects (6) (227) (233)Unscheduled Stoppages – Plant & Equipment (336) (155) (491)Losses and contingency from Lawsuits (21) (82) (87) (190)Result of hedge operations (24) 30 (198) (192)Rent revenues 31 31Losses from alcohol inventory – prior years (73) (73)Expenses for oil and oil product transport – prior years (87) (87)Production costs – prior years (33) (33)Adjustment to market value of turbines for thermoelectric plants (330) (330)INSS Contingencies (152) (5) (3) (160)Take-or-pay/Ship-or-pay on gas supply contracts (171) (171)Others 68 (64) (58) 28 (57) (111) (194)
(474) (498) (1,237) 37 (57) (1,223) (3,452)
Consolidated Other Operating Expenses/Revenues September 30, 2002
GAS
&
E&P SUPPLY ENERGY DISTRIB. INTERN. CORPOR. ELIMIN. TOTAL
Contractual Contingencies with Energy Business (432) (432)Pension Fund Obligations and health care benefits (3) (22) (432) (457)Institutional relations and cultural projects (192) (192)Unscheduled Stoppages – Plant & Equipment (180) (105) (285)Losses and contingency from Lawsuits (52) (15) (68) (135)Result of hedge operations 9 9Others 135 27 (57) (23) 37 (177) (64) (122)
(97) (87) (489) (45) 37 (869) (64) (1,614)
R$ Million
R$ Million
PETROBRAS Financial Statements
19
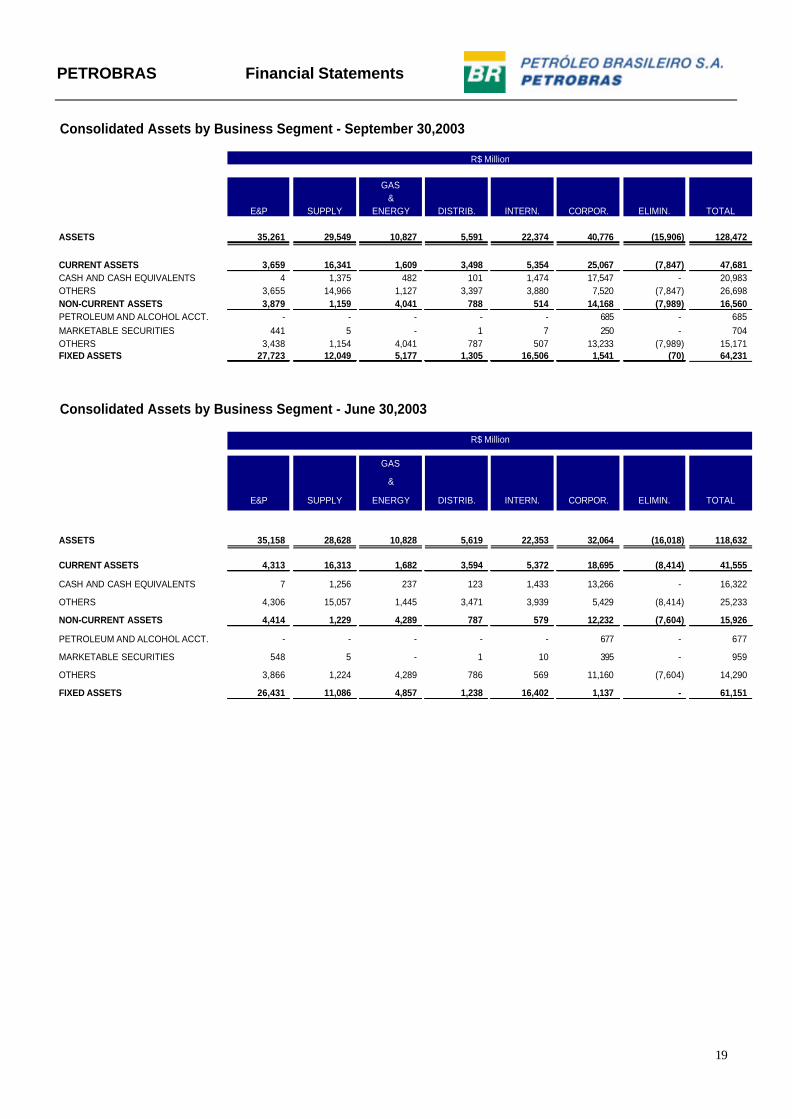
Consolidated Assets by Business Segment - September 30,2003
GAS&
E&P SUPPLY ENERGY DISTRIB. INTERN. CORPOR. ELIMIN. TOTAL
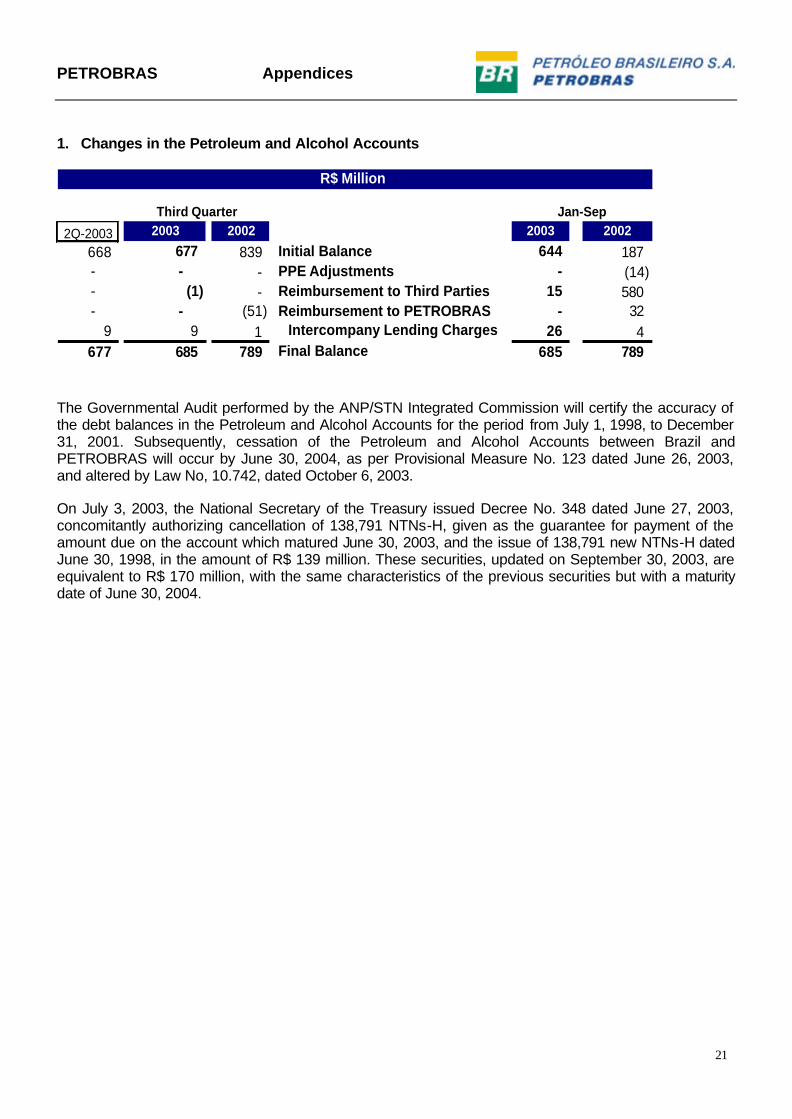
The Governmental Audit performed by the ANP/STN Integrated Commission will certify the accuracy of the debt balances in the Petroleum and Alcohol Accounts for the period from July 1, 1998, to December 31, 2001. Subsequently, cessation of the Petroleum and Alcohol Accounts between Brazil and PETROBRAS will occur by June 30, 2004, as per Provisional Measure No. 123 dated June 26, 2003, and altered by Law No, 10.742, dated October 6, 2003. On July 3, 2003, the National Secretary of the Treasury issued Decree No. 348 dated June 27, 2003, concomitantly authorizing cancellation of 138,791 NTNs-H, given as the guarantee for payment of the amount due on the account which matured June 30, 2003, and the issue of 138,791 new NTNs-H dated June 30, 1998, in the amount of R$ 139 million. These securities, updated on September 30, 2003, are equivalent to R$ 170 million, with the same characteristics of the previous securities but with a maturity date of June 30, 2004.
SISTEMA PETROBRAS Appendices
22
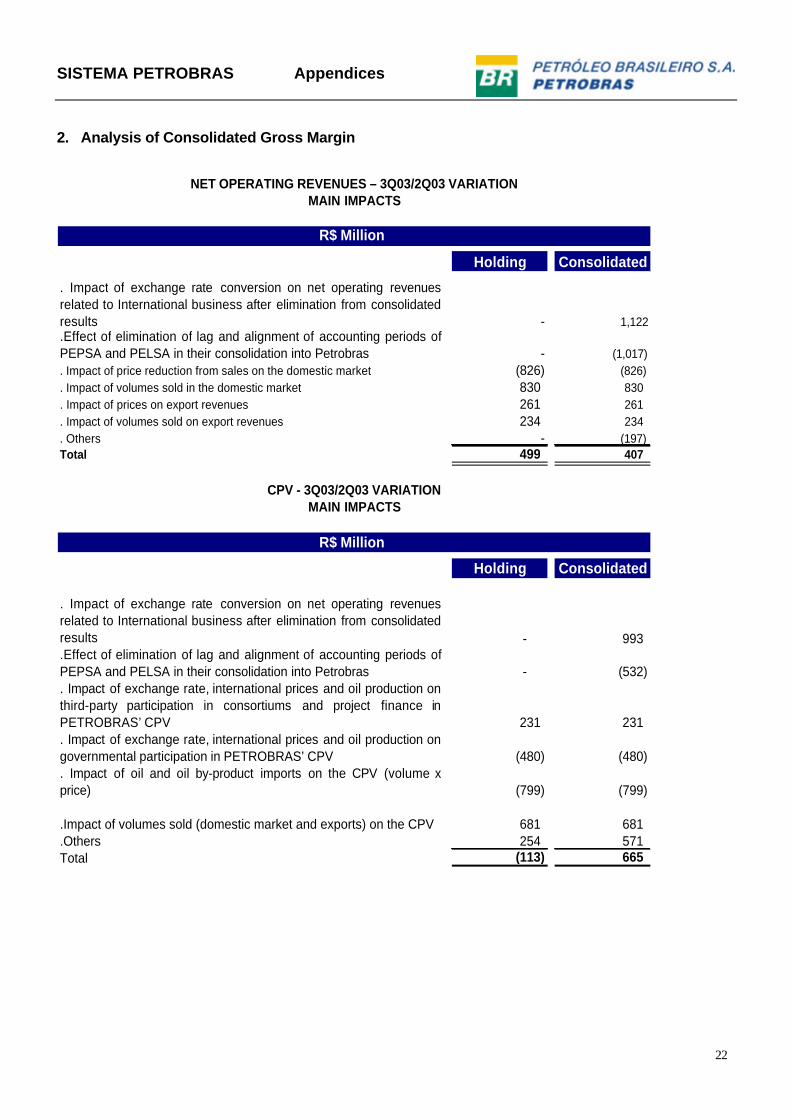
2. Analysis of Consolidated Gross Margin
Holding Consolidated
. Impact of exchange rate conversion on net operating revenuesrelated to International business after elimination from consolidatedresults - 1,122 .Effect of elimination of lag and alignment of accounting periods ofPEPSA and PELSA in their consolidation into Petrobras - (1,017). Impact of price reduction from sales on the domestic market (826) (826). Impact of volumes sold in the domestic market 830 830. Impact of prices on export revenues 261 261. Impact of volumes sold on export revenues 234 234. Others - (197)Total 499 407
Holding Consolidated
. Impact of exchange rate conversion on net operating revenuesrelated to International business after elimination from consolidatedresults - 993 .Effect of elimination of lag and alignment of accounting periods ofPEPSA and PELSA in their consolidation into Petrobras - (532) . Impact of exchange rate, international prices and oil production onthird-party participation in consortiums and project finance inPETROBRAS’ CPV 231 231 . Impact of exchange rate, international prices and oil production ongovernmental participation in PETROBRAS’ CPV (480) (480) . Impact of oil and oil by-product imports on the CPV (volume xprice) (799) (799)
.Impact of volumes sold (domestic market and exports) on the CPV 681 681
.Others 254 571 Total (113) 665
R$ Million
NET OPERATING REVENUES – 3Q03/2Q03 VARIATIONMAIN IMPACTS
CPV - 3Q03/2Q03 VARIATIONMAIN IMPACTS
R$ Million
SISTEMA PETROBRAS Appendices
23
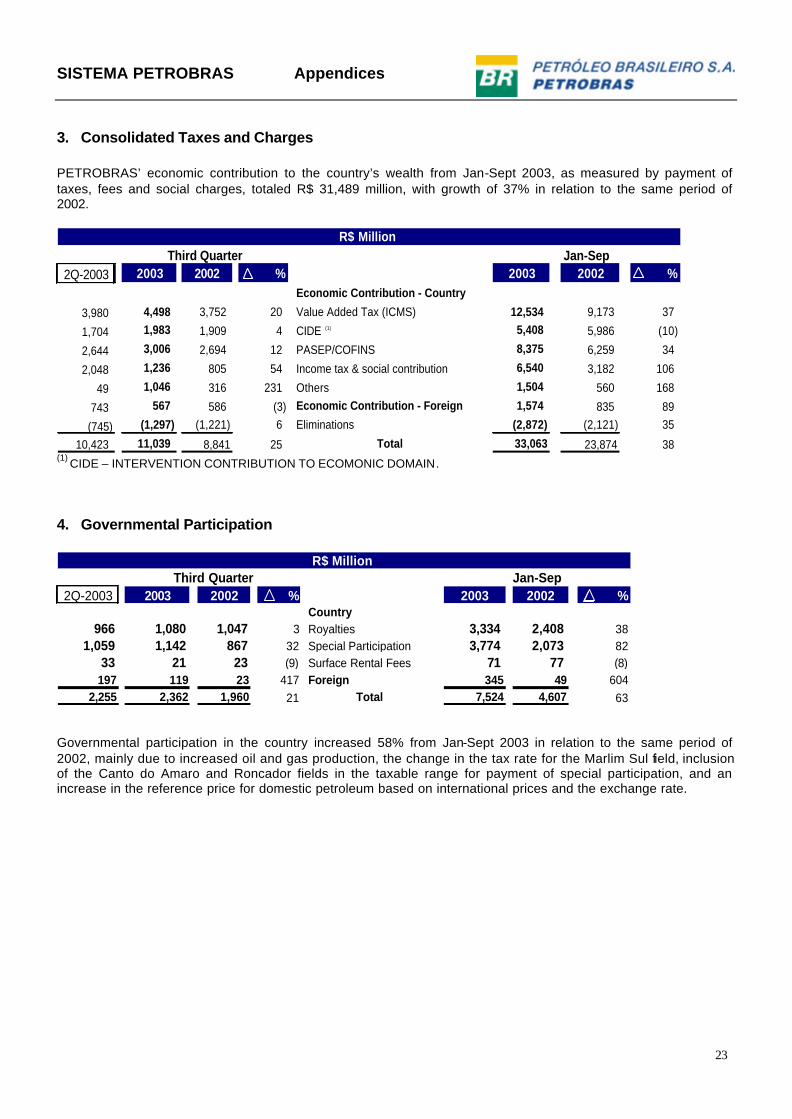
3. Consolidated Taxes and Charges PETROBRAS’ economic contribution to the country’s wealth from Jan-Sept 2003, as measured by payment of taxes, fees and social charges, totaled R$ 31,489 million, with growth of 37% in relation to the same period of 2002.
2Q-2003 2003 2002 % 2003 2002 %Economic Contribution - Country
Governmental participation in the country increased 58% from Jan-Sept 2003 in relation to the same period of 2002, mainly due to increased oil and gas production, the change in the tax rate for the Marlim Sul field, inclusion of the Canto do Amaro and Roncador fields in the taxable range for payment of special participation, and an increase in the reference price for domestic petroleum based on international prices and the exchange rate.
SISTEMA PETROBRAS Appendices
24
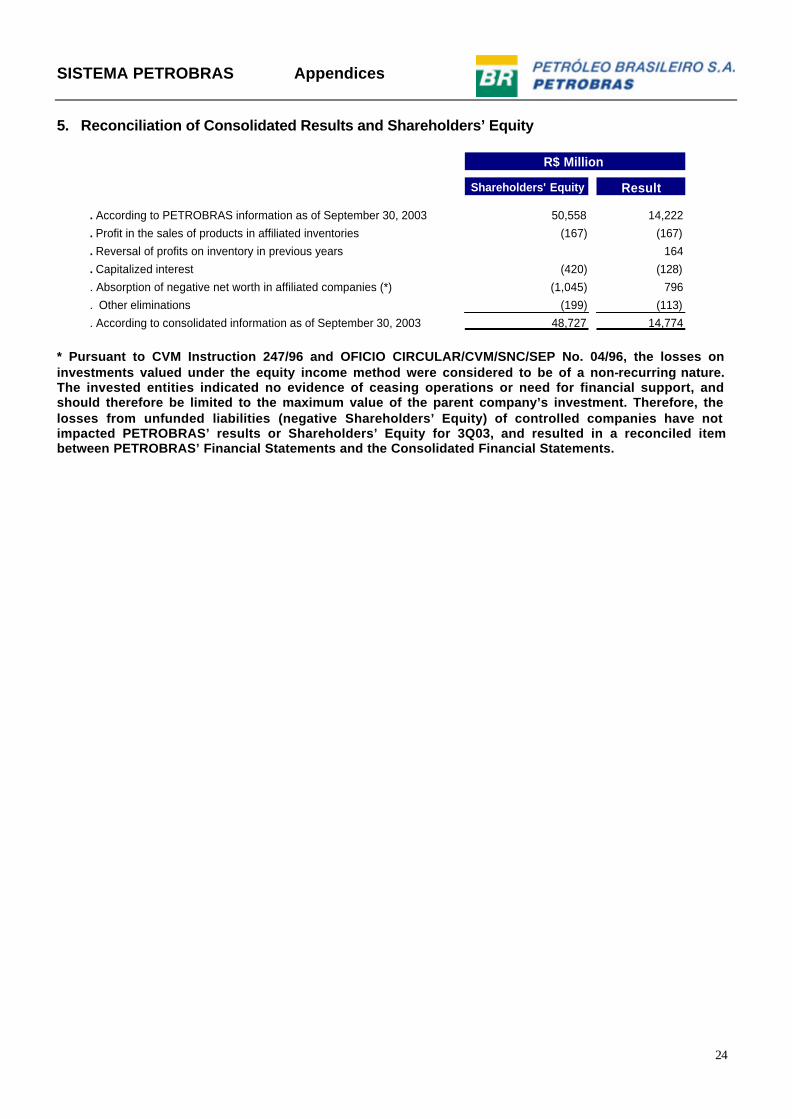
5. Reconciliation of Consolidated Results and Shareholders’ Equity
Shareholders' Equity Result
. According to PETROBRAS information as of September 30, 2003 50,558 14,222
. Profit in the sales of products in affiliated inventories (167) (167)
. Reversal of profits on inventory in previous years 164
. Capitalized interest (420) (128)
. Absorption of negative net worth in affiliated companies (*) (1,045) 796
. Other eliminations (199) (113)
. According to consolidated information as of September 30, 2003 48,727 14,774
R$ Million
* Pursuant to CVM Instruction 247/96 and OFICIO CIRCULAR/CVM/SNC/SEP No. 04/96, the losses on investments valued under the equity income method were considered to be of a non-recurring nature. The invested entities indicated no evidence of ceasing operations or need for financial support, and should therefore be limited to the maximum value of the parent company’s investment. Therefore, the losses from unfunded liabilities (negative Shareholders’ Equity) of controlled companies have not impacted PETROBRAS’ results or Shareholders’ Equity for 3Q03, and resulted in a reconciled item between PETROBRAS’ Financial Statements and the Consolidated Financial Statements.
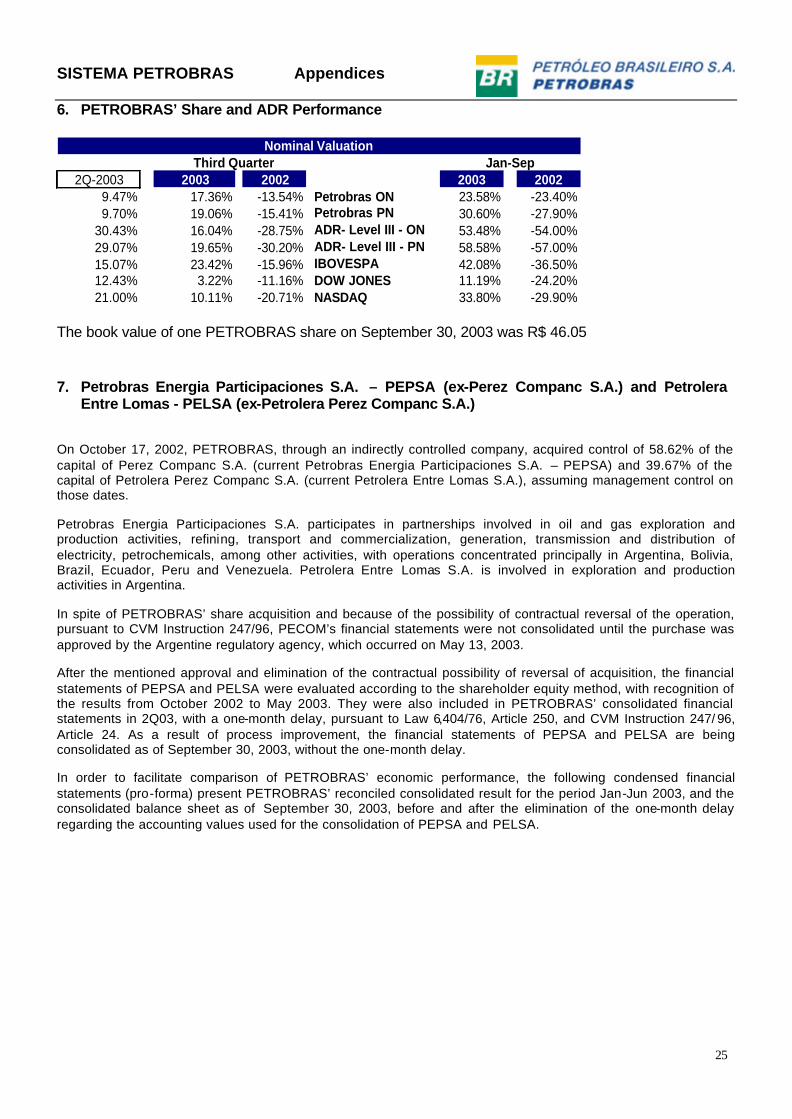
30.43% 16.04% -28.75% ADR- Level III - ON 53.48% -54.00%29.07% 19.65% -30.20% ADR- Level III - PN 58.58% -57.00%15.07% 23.42% -15.96% IBOVESPA 42.08% -36.50%12.43% 3.22% -11.16% DOW JONES 11.19% -24.20%21.00% 10.11% -20.71% NASDAQ 33.80% -29.90%
Nominal ValuationThird Quarter Jan-Sep
The book value of one PETROBRAS share on September 30, 2003 was R$ 46.05 7. Petrobras Energia Participaciones S.A. – PEPSA (ex-Perez Companc S.A.) and Petrolera
Entre Lomas - PELSA (ex-Petrolera Perez Companc S.A.)
On October 17, 2002, PETROBRAS, through an indirectly controlled company, acquired control of 58.62% of the capital of Perez Companc S.A. (current Petrobras Energia Participaciones S.A. – PEPSA) and 39.67% of the capital of Petrolera Perez Companc S.A. (current Petrolera Entre Lomas S.A.), assuming management control on those dates.
Petrobras Energia Participaciones S.A. participates in partnerships involved in oil and gas exploration and production activities, refining, transport and commercialization, generation, transmission and distribution of electricity, petrochemicals, among other activities, with operations concentrated principally in Argentina, Bolivia, Brazil, Ecuador, Peru and Venezuela. Petrolera Entre Lomas S.A. is involved in exploration and production activities in Argentina.
In spite of PETROBRAS’ share acquisition and because of the possibility of contractual reversal of the operation, pursuant to CVM Instruction 247/96, PECOM’s financial statements were not consolidated until the purchase was approved by the Argentine regulatory agency, which occurred on May 13, 2003.
After the mentioned approval and elimination of the contractual possibility of reversal of acquisition, the financial statements of PEPSA and PELSA were evaluated according to the shareholder equity method, with recognition of the results from October 2002 to May 2003. They were also included in PETROBRAS’ consolidated financial statements in 2Q03, with a one-month delay, pursuant to Law 6,404/76, Article 250, and CVM Instruction 247/ 96, Article 24. As a result of process improvement, the financial statements of PEPSA and PELSA are being consolidated as of September 30, 2003, without the one-month delay.
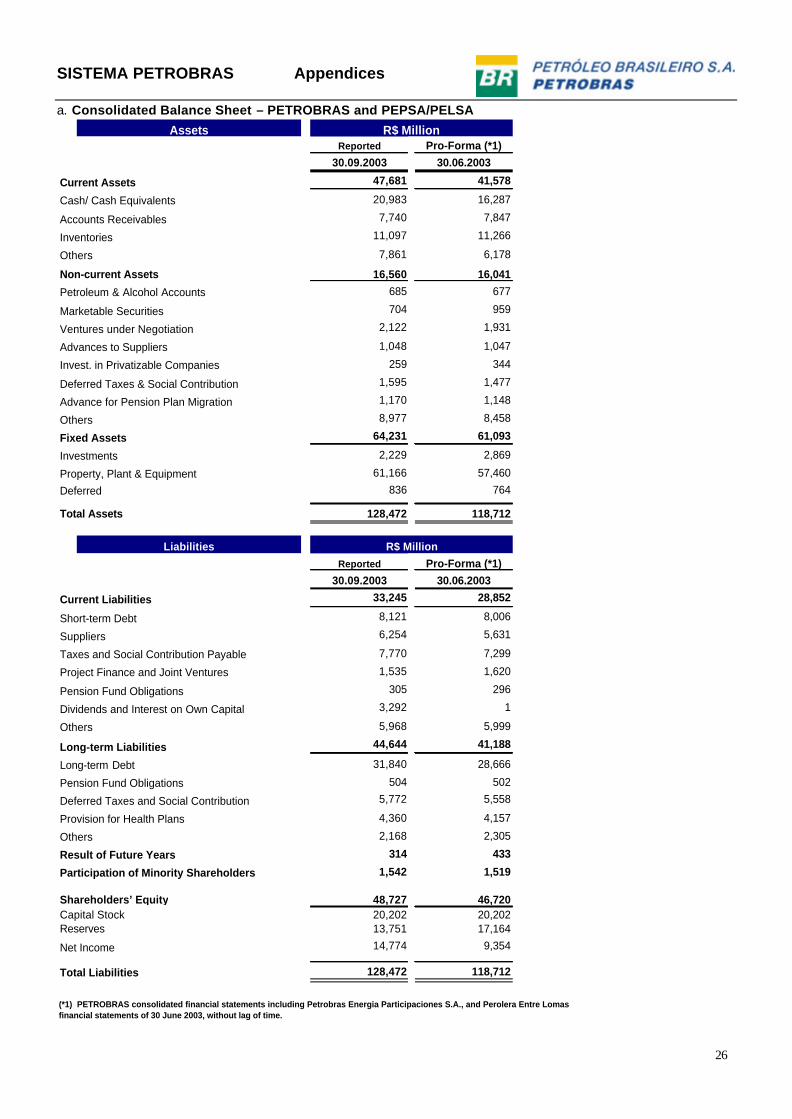
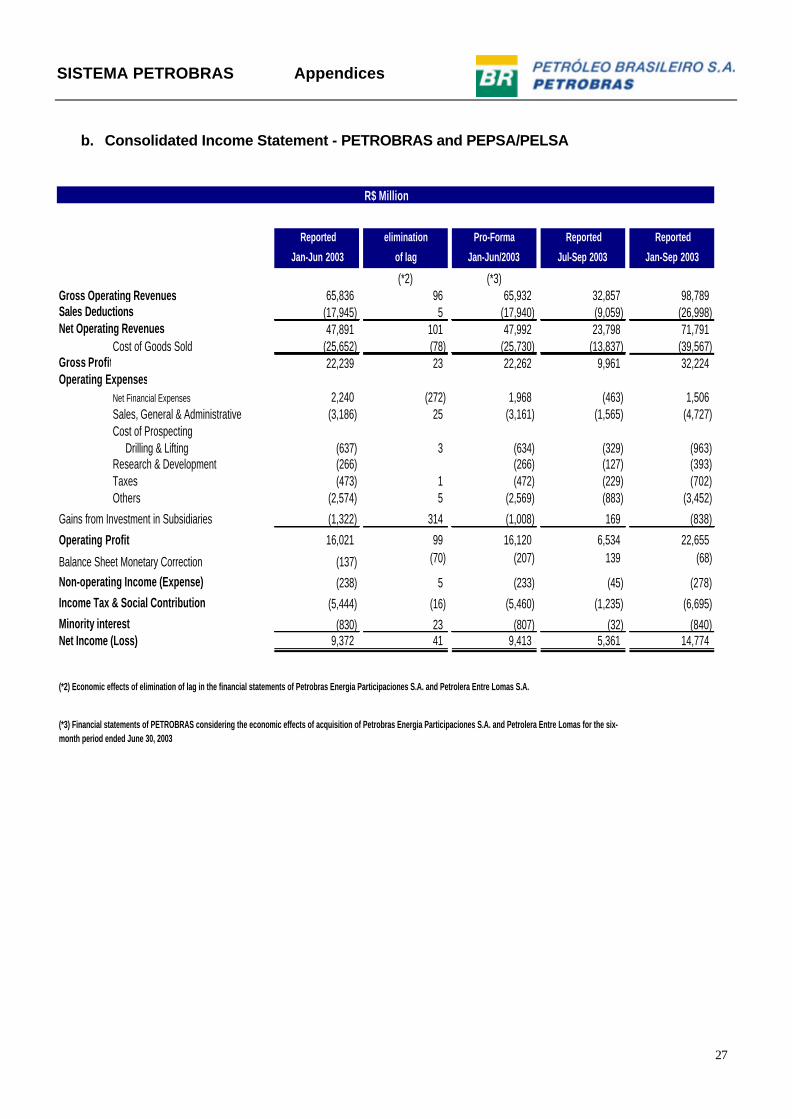
In order to facilitate comparison of PETROBRAS’ economic performance, the following condensed financial statements (pro-forma) present PETROBRAS’ reconciled consolidated result for the period Jan-Jun 2003, and the consolidated balance sheet as of September 30, 2003, before and after the elimination of the one-month delay regarding the accounting values used for the consolidation of PEPSA and PELSA.
SISTEMA PETROBRAS Appendices
26
a. Consolidated Balance Sheet – PETROBRAS and PEPSA/PELSA Assets
Reported Pro-Forma (*1)30.09.2003 30.06.2003
Current Assets 47,681 41,578
Cash/ Cash Equivalents 20,983 16,287
Accounts Receivables 7,740 7,847
Inventories 11,097 11,266
Others 7,861 6,178
Non-current Assets 16,560 16,041
Petroleum & Alcohol Accounts 685 677
Marketable Securities 704 959
Ventures under Negotiation 2,122 1,931
Advances to Suppliers 1,048 1,047
Invest. in Privatizable Companies 259 344
Deferred Taxes & Social Contribution 1,595 1,477
Advance for Pension Plan Migration 1,170 1,148
Others 8,977 8,458
Fixed Assets 64,231 61,093
Investments 2,229 2,869
Property, Plant & Equipment 61,166 57,460
Deferred 836 764
Total Assets 128,472 118,712
LiabilitiesReported Pro-Forma (*1)
30.09.2003 30.06.2003
Current Liabilities 33,245 28,852
Short-term Debt 8,121 8,006
Suppliers 6,254 5,631
Taxes and Social Contribution Payable 7,770 7,299
Project Finance and Joint Ventures 1,535 1,620
Pension Fund Obligations 305 296
Dividends and Interest on Own Capital 3,292 1
Others 5,968 5,999
Long-term Liabilities 44,644 41,188
Long-term Debt 31,840 28,666
Pension Fund Obligations 504 502
Deferred Taxes and Social Contribution 5,772 5,558
Provision for Health Plans 4,360 4,157
Others 2,168 2,305
Result of Future Years 314 433
Participation of Minority Shareholders 1,542 1,519
(*1) PETROBRAS consolidated financial statements including Petrobras Energia Participaciones S.A., and Perolera Entre Lomas financial statements of 30 June 2003, without lag of time.
SISTEMA PETROBRAS Appendices
27
b. Consolidated Income Statement - PETROBRAS and PEPSA/PELSA
Reported elimination Pro-Forma Reported Reported
Jan-Jun 2003 of lag Jan-Jun/2003 Jul-Sep 2003 Jan-Sep 2003
Non-operating Income (Expense) (238) 5 (233) (45) (278)Income Tax & Social Contribution (5,444) (16) (5,460) (1,235) (6,695)Minority interest (830) 23 (807) (32) (840)Net Income (Loss) 9,372 41 9,413 5,361 14,774
R$ Million
(*2) Economic effects of elimination of lag in the financial statements of Petrobras Energia Participaciones S.A. and Petrolera Entre Lomas S.A.
(*3) Financial statements of PETROBRAS considering the economic effects of acquisition of Petrobras Energia Participaciones S.A. and Petrolera Entre Lomas for the six-month period ended June 30, 2003
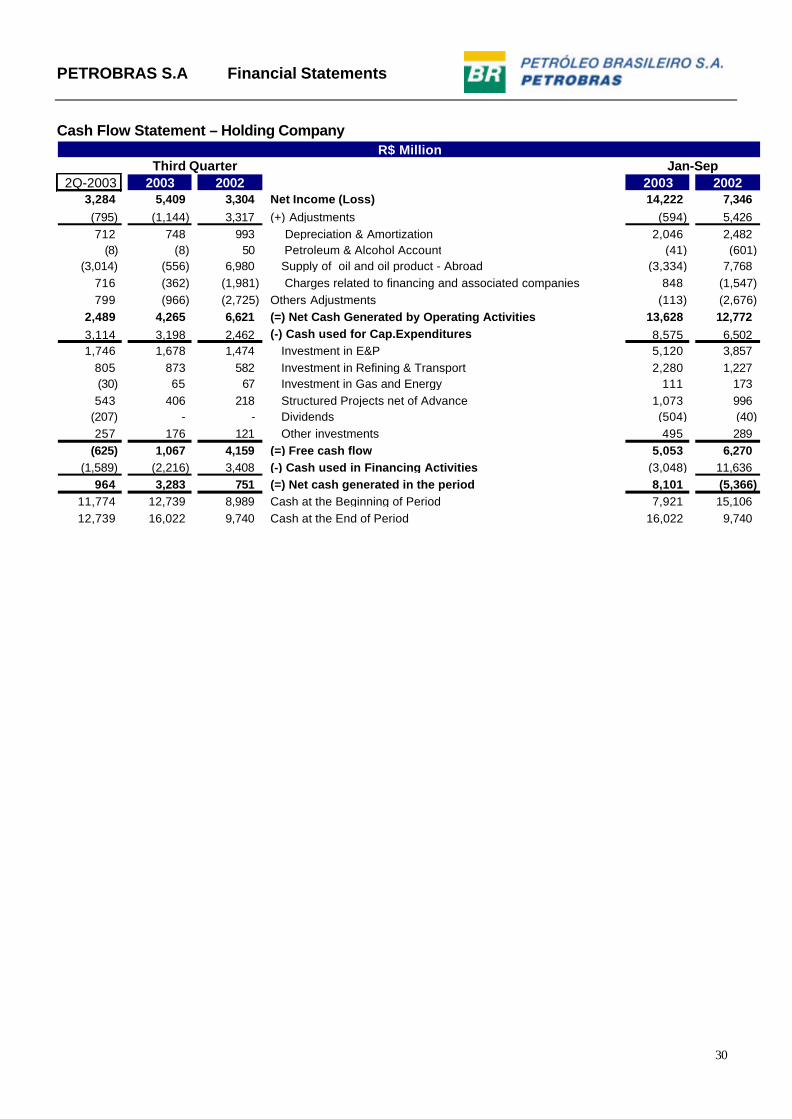
716 (362) (1,981) Charges related to financing and associated companies 848 (1,547)799 (966) (2,725) Others Adjustments (113) (2,676)
2,489 4,265 6,621 (=) Net Cash Generated by Operating Activities 13,628 12,7723,114 3,198 2,462 (-) Cash used for Cap.Expenditures 8,575 6,5021,746 1,678 1,474 Investment in E&P 5,120 3,857
805 873 582 Investment in Refining & Transport 2,280 1,227(30) 65 67 Investment in Gas and Energy 111 173543 406 218 Structured Projects net of Advance 1,073 996
(625) 1,067 4,159 (=) Free cash flow 5,053 6,270(1,589) (2,216) 3,408 (-) Cash used in Financing Activities (3,048) 11,636
964 3,283 751 (=) Net cash generated in the period 8,101 (5,366)11,774 12,739 8,989 Cash at the Beginning of Period 7,921 15,10612,739 16,022 9,740 Cash at the End of Period 16,022 9,740
Third Quarter Jan-Sep R$ Million
PETROBRAS S.A Financial Statements
31
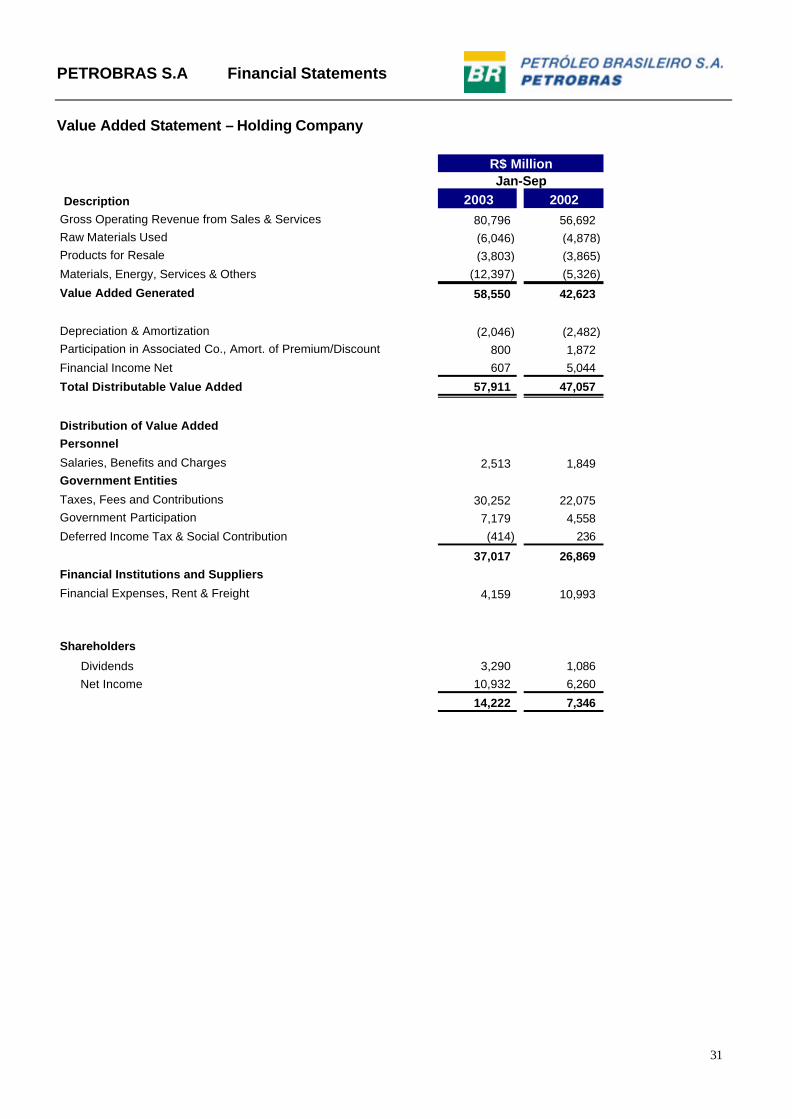
Value Added Statement – Holding Company
Description 2003 2002Gross Operating Revenue from Sales & Services 80,796 56,692Raw Materials Used (6,046) (4,878)Products for Resale (3,803) (3,865)Materials, Energy, Services & Others (12,397) (5,326)
Value Added Generated 58,550 42,623
Depreciation & Amortization (2,046) (2,482)Participation in Associated Co., Amort. of Premium/Discount 800 1,872Financial Income Net 607 5,044
Total Distributable Value Added 57,911 47,057
Distribution of Value AddedPersonnel
Salaries, Benefits and Charges 2,513 1,849Government Entities
Taxes, Fees and Contributions 30,252 22,075Government Participation 7,179 4,558Deferred Income Tax & Social Contribution (414) 236
37,017 26,869Financial Institutions and Suppliers
Financial Expenses, Rent & Freight 4,159 10,993
Shareholders
Dividends 3,290 1,086 Net Income 10,932 6,260
14,222 7,346
R$ Million Jan-Sep
PETROBRAS S.A
32
http: //www.petrobras.com.br/ri/english
Contacts: Petróleo Brasileiro S.A – PETROBRAS
Investor Relations Department Luciana Bastos de Freitas Rachid – Executive Manager
20031-912 – Rio de Janeiro, RJ (55-21) 2534-1510 / 2534-9947
This document may contain forecasts that merely reflect the expectations of the Company’s management. Such terms as “anticipate”, “believe”, “expect”, “forecast”, “intend”, “plan”, “project”, “seek”, “should”, along with similar or analogous expressions, are used to identify such forecasts. These predictions evidently involve risks and uncertainties, whether foreseen or not by the Company. Therefore, the future results of operations may differ from current expectations, and readers must not base their expectations exclusively on the information presented herein.