Singapore Singapore Shanghai Shanghai Houston Houston New York New York London London Düsseldorf Düsseldorf Dubai Dubai Prepared for: LSU Energy Summit October 2007 Prepared for: Prepared for: LSU Energy Summit LSU Energy Summit October 2007 October 2007 Petrochemical Market Outlook Petrochemical Market Outlook Chuck Carr Director Propylene Studies [email protected]Chuck Carr Chuck Carr Director Director Propylene Studies Propylene Studies [email protected][email protected]
Transcript
SingaporeSingapore ShanghaiShanghai HoustonHouston New YorkNew York LondonLondon DüsseldorfDüsseldorf DubaiDubai
Prepared for:LSU Energy Summit
October 2007
Prepared for:Prepared for:LSU Energy Summit LSU Energy Summit
October 2007October 2007
Petrochemical Market OutlookPetrochemical Market Outlook
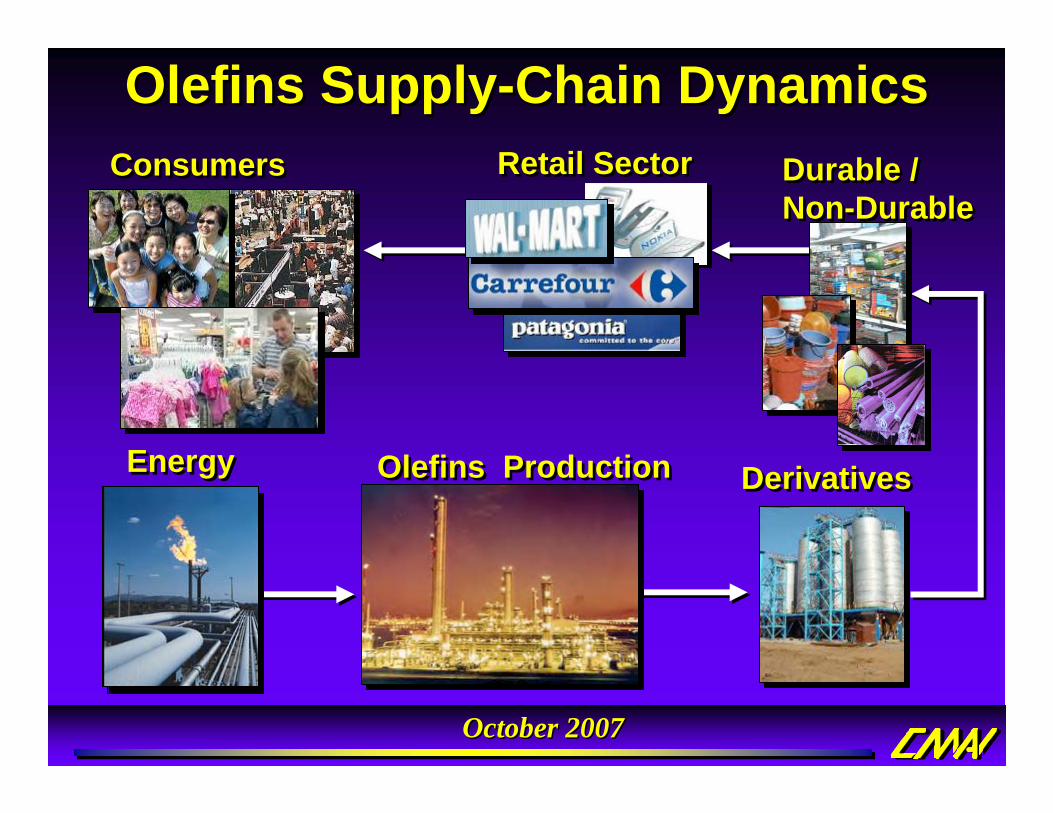
EnergyEnergy Olefins ProductionOlefins Production DerivativesDerivatives
Durable / Non-DurableDurable / Non-Durable
ConsumersConsumers Retail SectorRetail Sector
October 2007October 2007
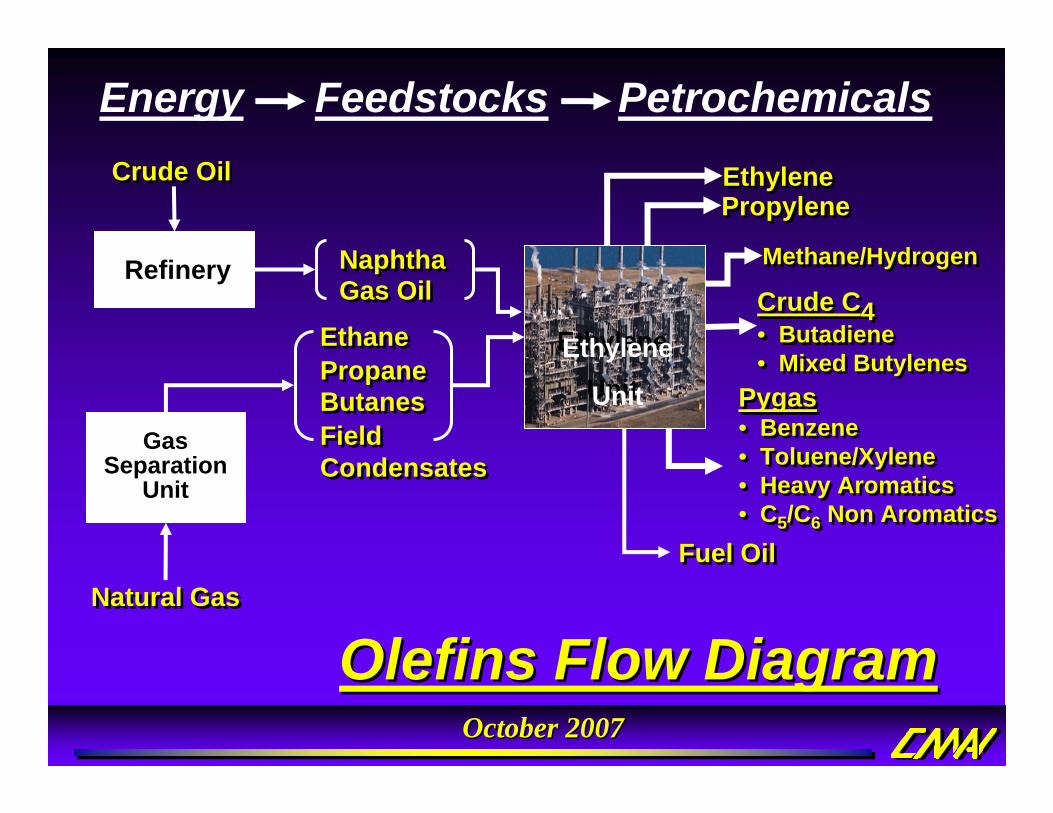
Olefins Flow DiagramOlefins Flow Diagram
FeedstocksEnergy Petrochemicals
NaphthaNaphthaGas OilGas Oil
Field CondensatesField Condensates
EthaneEthanePropanePropaneButanesButanes
PropylenePropyleneEthyleneEthylene
Pygas• Benzene• Toluene/Xylene• Heavy Aromatics• C5/C6 Non Aromatics
Pygas• Benzene• Toluene/Xylene• Heavy Aromatics• C5/C6 Non Aromatics
Crude C4• Butadiene• Mixed Butylenes
Crude C4• Butadiene• Mixed Butylenes
Fuel OilFuel Oil
Methane/HydrogenMethane/Hydrogen
Natural GasNatural Gas
Crude OilCrude Oil
Refinery
GasSeparation
Unit
Ethylene
UnitEthylene
Unit
October 2007October 2007
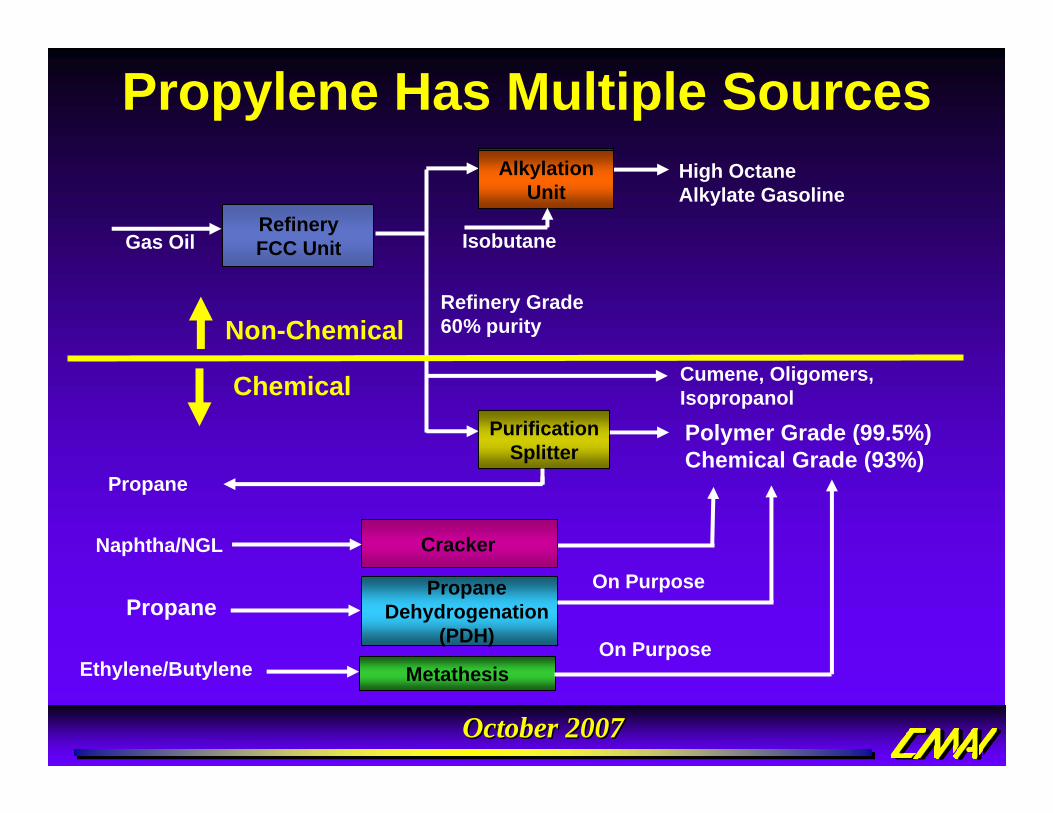
Propylene Has Multiple Sources
Propane
MetathesisEthylene/Butylene
Naphtha/NGL
RefineryFCC Unit
Alkylation Unit
Isobutane
High Octane Alkylate Gasoline
Gas Oil
Non-ChemicalRefinery Grade60% purity
Cracker
Cumene, Oligomers, Isopropanol
Polymer Grade (99.5%)Chemical Grade (93%)
Purification Splitter
Propane
Chemical
Propane Dehydrogenation
(PDH) On Purpose
On Purpose
October 2007October 2007
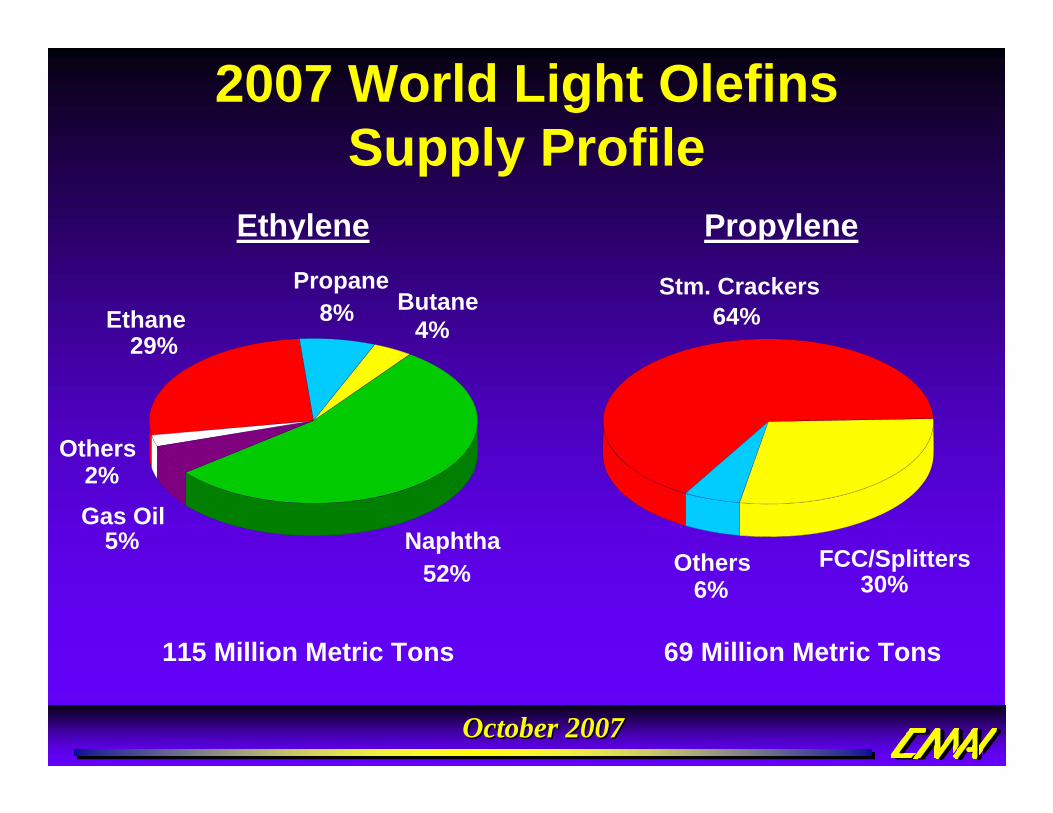
2007 World Light Olefins Supply Profile
Ethylene Propylene
69 Million Metric Tons
Others6%
Stm. Crackers64%
FCC/Splitters30%
Others2%
Butane4%
Gas Oil5%
Propane8%Ethane
29%
Naphtha52%
115 Million Metric Tons
October 2007October 2007
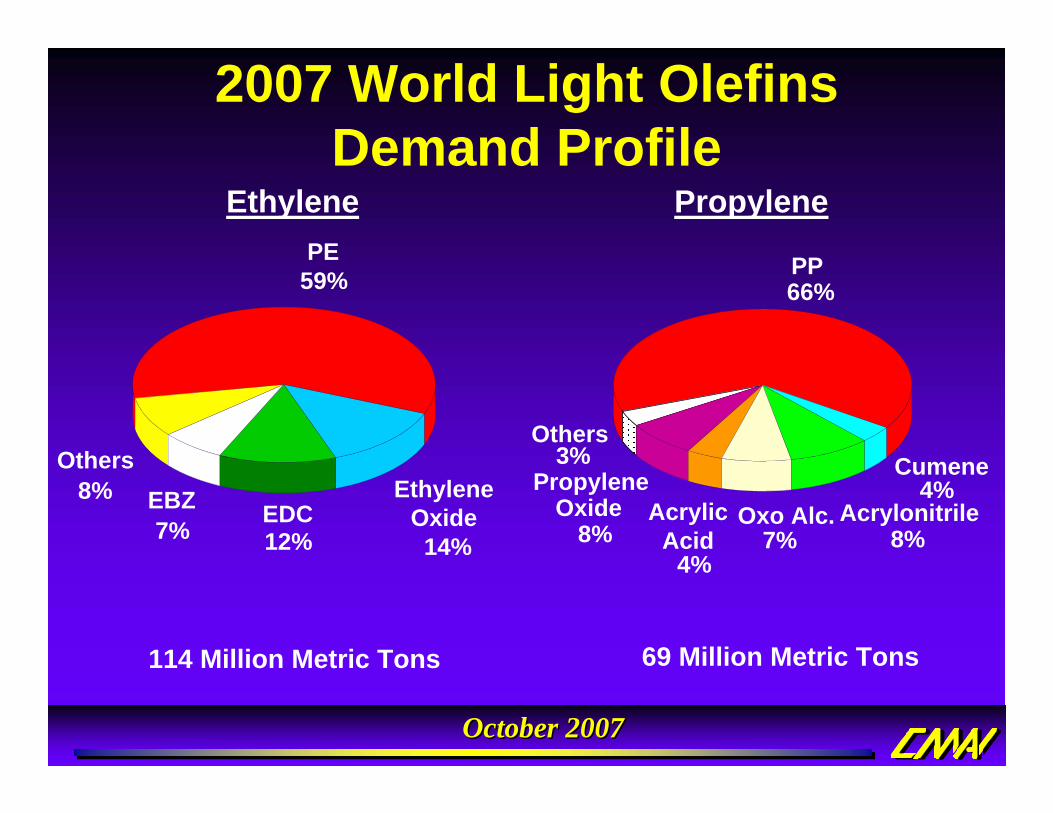
EDC12%
Ethylene Oxide
14%
PE59%
Others8% EBZ
7%
Others3%
Acrylonitrile8%
Cumene4%
Acrylic Acid
4%
Oxo Alc.7%
Propylene Oxide
8%
PP66%
Ethylene Propylene
69 Million Metric Tons114 Million Metric Tons
2007 World Light Olefins Demand Profile
October 2007October 2007
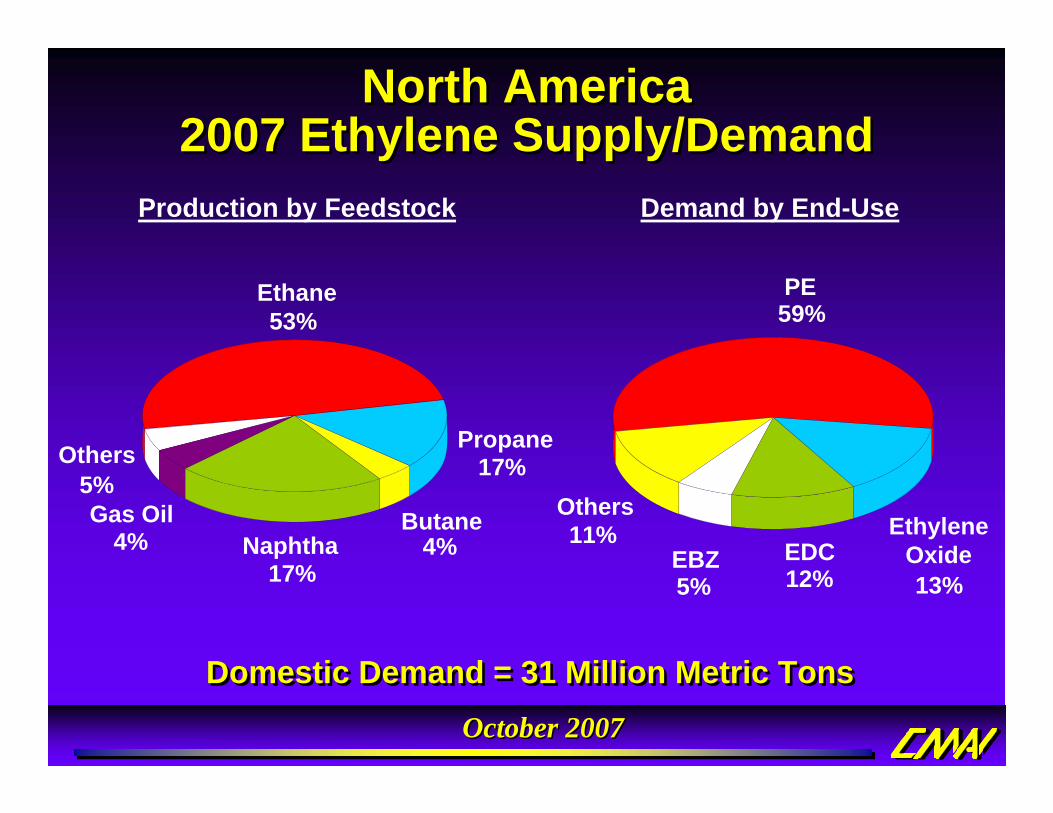
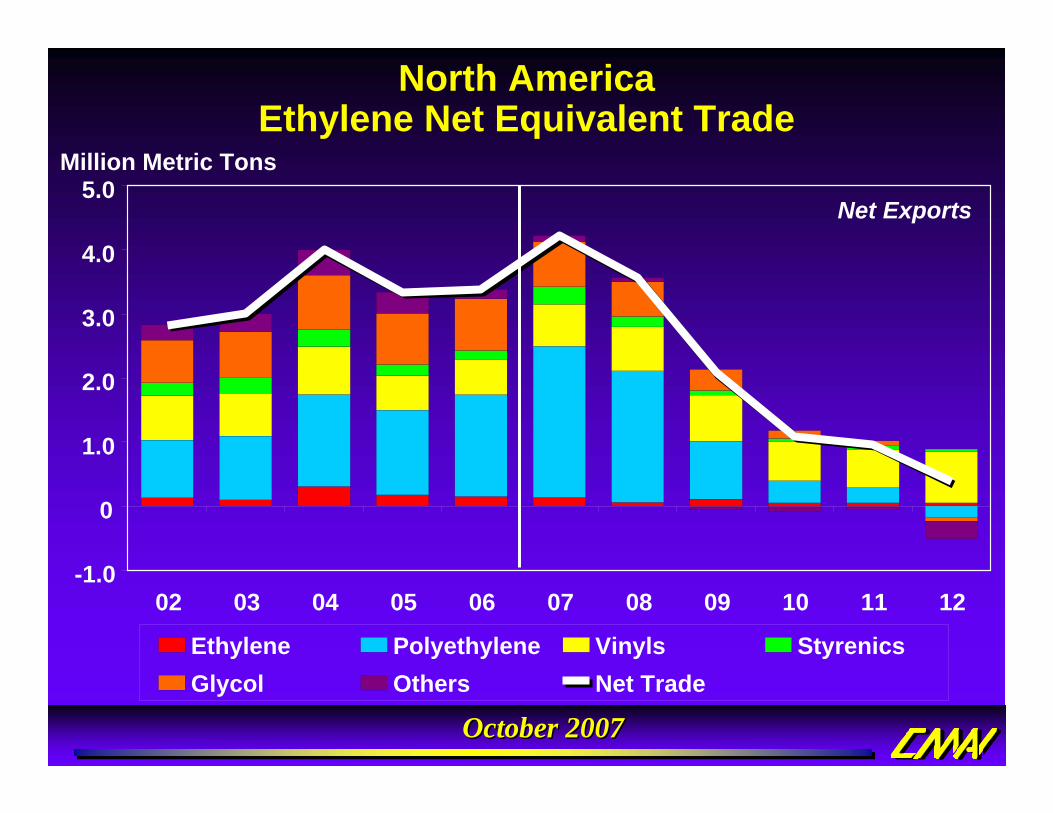
North AmericaNorth America2007 Ethylene Supply/Demand2007 Ethylene Supply/Demand
Domestic Demand = 31 Million Metric TonsDomestic Demand = 31 Million Metric Tons
Production by Feedstock Demand by End-Use
EDC12%
Ethylene Oxide13%
PE59%
Others11%
EBZ5%
Propane17%
Ethane53%
Others5%Gas Oil
4% Naphtha17%
Butane4%
October 2007October 2007
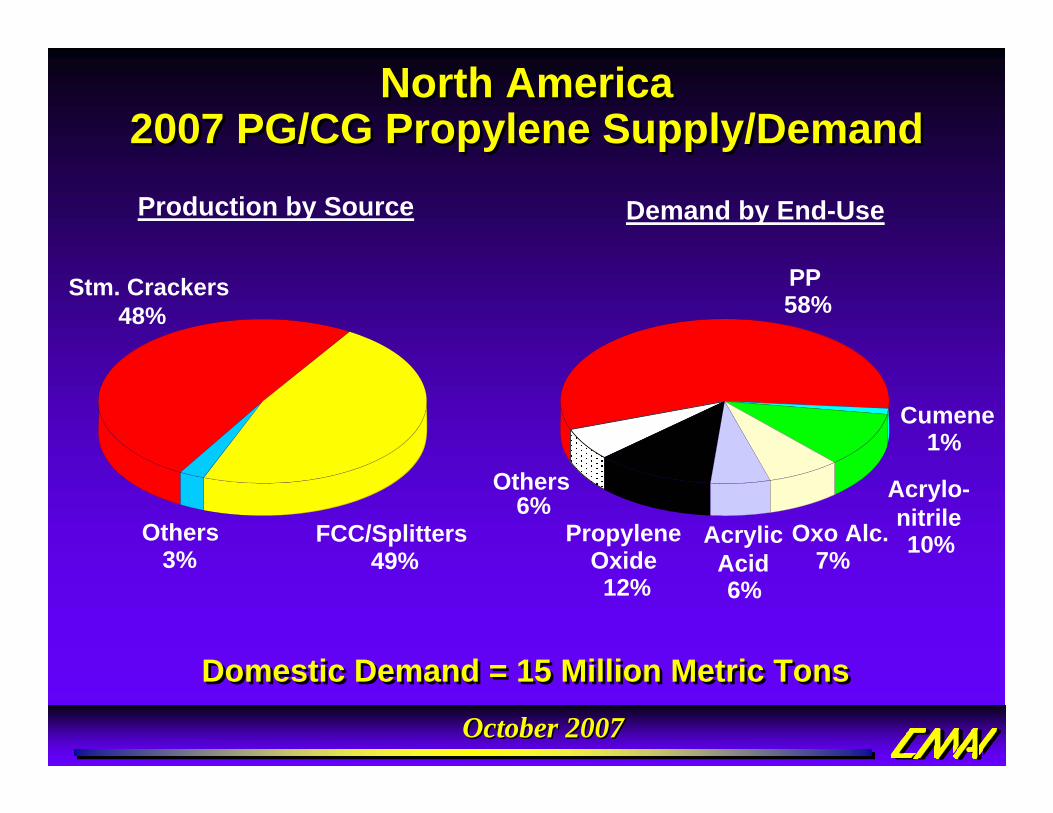
North AmericaNorth America2007 PG/CG Propylene Supply/Demand2007 PG/CG Propylene Supply/Demand
Domestic Demand = 15 Million Metric TonsDomestic Demand = 15 Million Metric Tons
Production by Source Demand by End-Use
Stm. Crackers48%
Others3%
FCC/Splitters49%
Others6%
Acrylo-nitrile10%
Cumene1%
Acrylic Acid6%
Oxo Alc.7%
Propylene Oxide12%
PP58%
October 2007October 2007
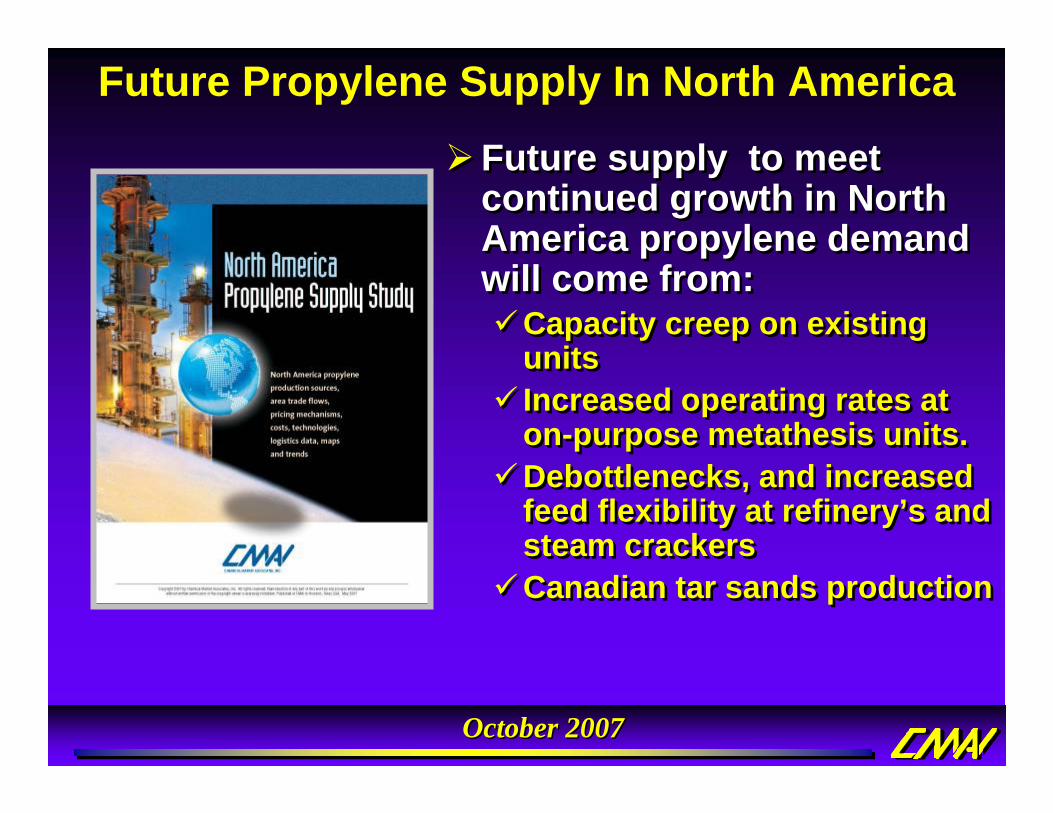
Future Propylene Supply In North America
Future supply to meet continued growth in North America propylene demand will come from:
Capacity creep on existing unitsIncreased operating rates at on-purpose metathesis units. Debottlenecks, and increased feed flexibility at refinery’s and steam crackersCanadian tar sands production
Future supply to meet continued growth in North America propylene demand will come from:
Capacity creep on existing unitsIncreased operating rates at on-purpose metathesis units. Debottlenecks, and increased feed flexibility at refinery’s and steam crackersCanadian tar sands production
October 2007October 2007
Economy and Energy Impact on
Regional Ethylene Economics
Economy and Energy Impact on
Regional Ethylene Economics
October 2007October 2007
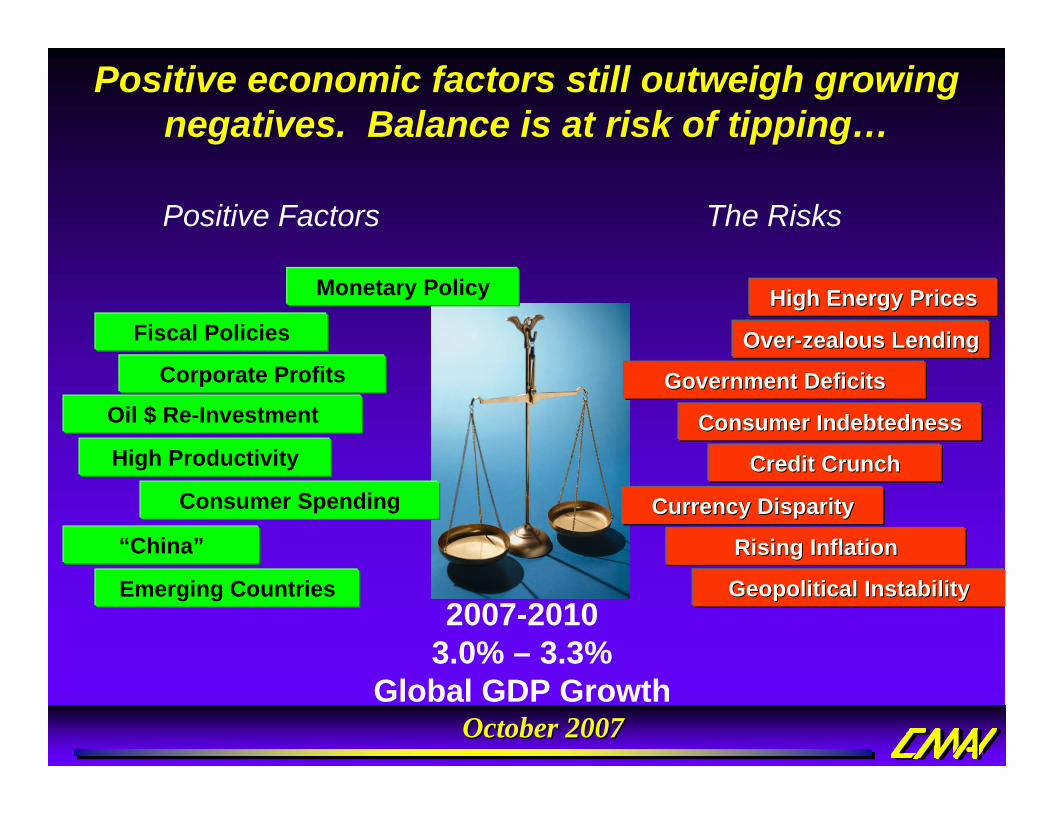
2007-2010 3.0% – 3.3%
Global GDP Growth
Positive economic factors still outweigh growing Positive economic factors still outweigh growing negatives. Balance is at risk of tippingnegatives. Balance is at risk of tipping……
Positive Factors
Monetary Policy
Corporate Profits
Fiscal Policies
Consumer Spending
“China”
Emerging Countries
High Productivity
Oil $ Re-Investment
High Energy PricesHigh Energy Prices
Credit CrunchCredit Crunch
Government DeficitsGovernment Deficits
OverOver--zealous Lendingzealous Lending
Consumer IndebtednessConsumer Indebtedness
Currency DisparityCurrency Disparity
Geopolitical InstabilityGeopolitical Instability
Rising InflationRising Inflation
The Risks
October 2007October 2007
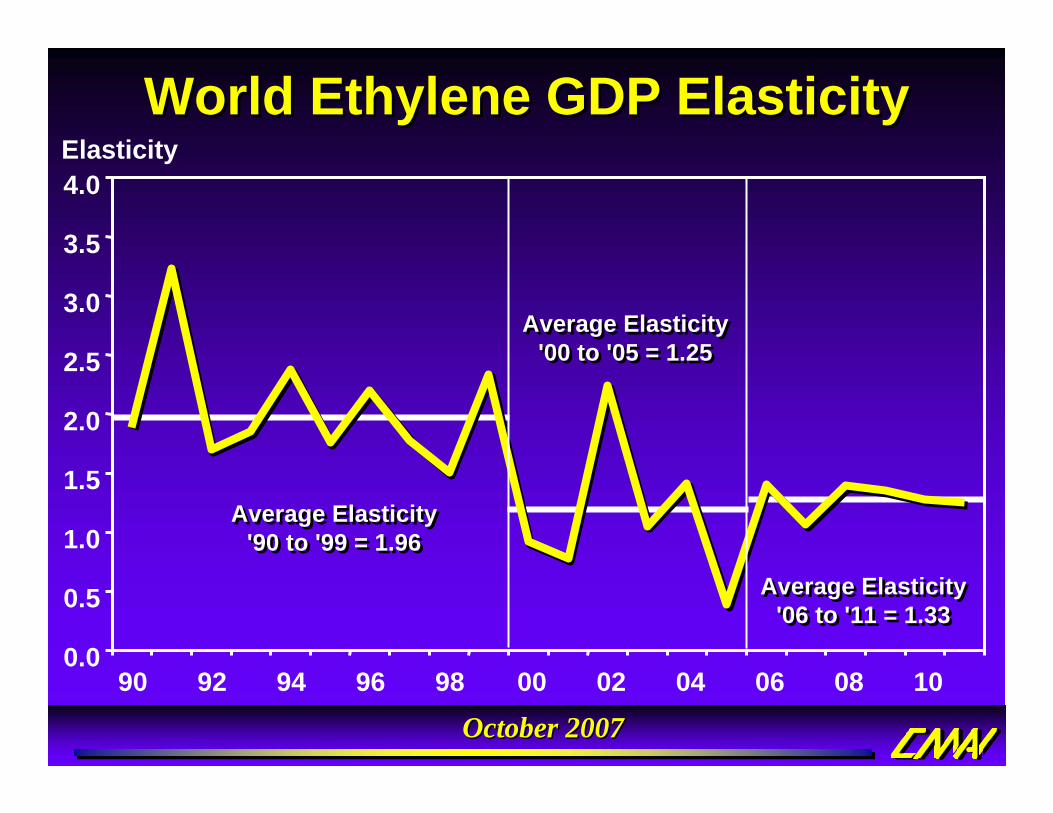
World Ethylene GDP ElasticityWorld Ethylene GDP ElasticityElasticity
0.0
0.5
1.0
1.5
2.0
2.5
3.0
3.5
4.0
90 92 94 96 98 00 02 04 06 08 10
Average Elasticity '90 to '99 = 1.96
Average Elasticity '90 to '99 = 1.96
Average Elasticity '00 to '05 = 1.25
Average Elasticity '00 to '05 = 1.25
Average Elasticity '06 to '11 = 1.33
Average Elasticity '06 to '11 = 1.33
October 2007October 2007
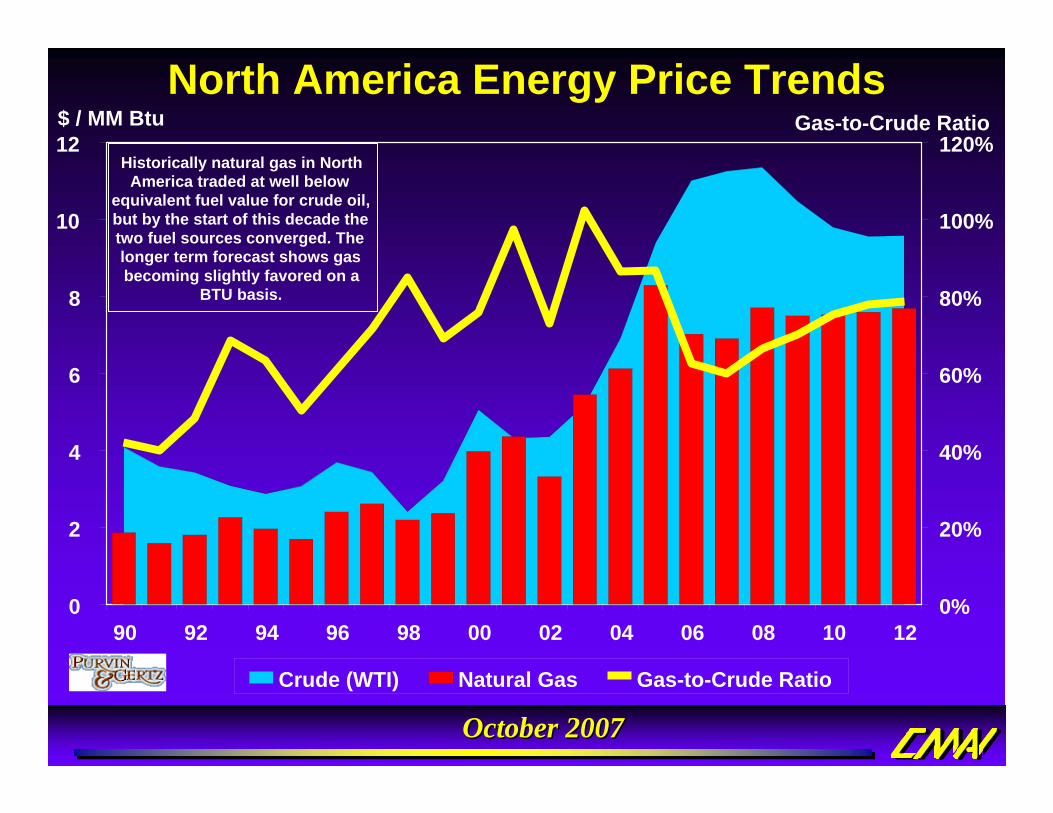
North America Energy Price Trends
0
2
4
6
8
10
12
90 92 94 96 98 00 02 04 06 08 10 12
$ / MM Btu
0%
20%
40%
60%
80%
100%
120%Gas-to-Crude Ratio
Crude (WTI) Natural Gas Gas-to-Crude Ratio
Historically natural gas in North America traded at well below
equivalent fuel value for crude oil, but by the start of this decade the two fuel sources converged. The longer term forecast shows gas becoming slightly favored on a
BTU basis.
October 2007October 2007
Higher “worry premiums” regarding perceived threats or real constraints to international crude oil
supplies favor gas based petchem units.
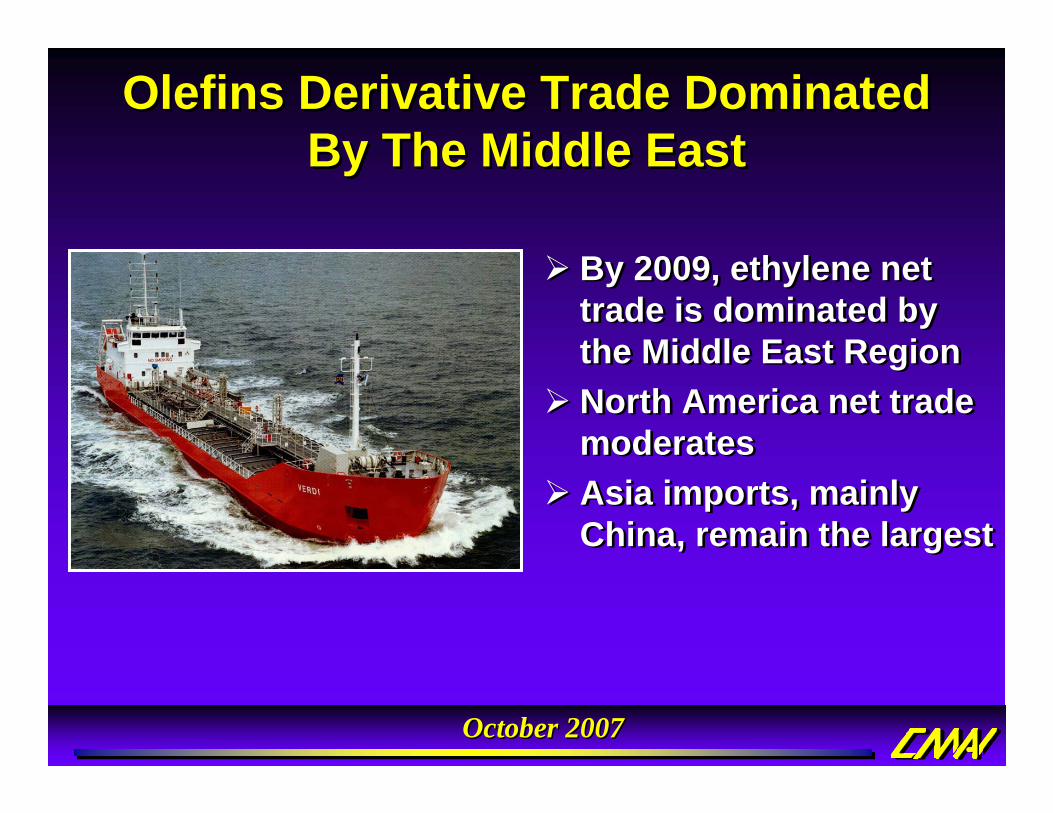
Exports from Canada and U.S. to Europe and Asia are possible as long as this advantage prevails. In the longer term, cost parity and severe surpluses could limit export opportunities – but for now…
Export Markets Are Very Attractive
Higher “worry premiums” regarding perceived threats or real constraints to international crude oil
supplies favor gas based petchem units.
Exports from Canada and U.S. to Europe and Asia are possible as long as this advantage prevails. In the longer term, cost parity and severe surpluses could limit export opportunities – but for now…
Export Markets Are Very Attractive
Ratio of Natural Gas to Crude Oil Price
October 2007October 2007Cumulative Capacity (Million Metric Tons)
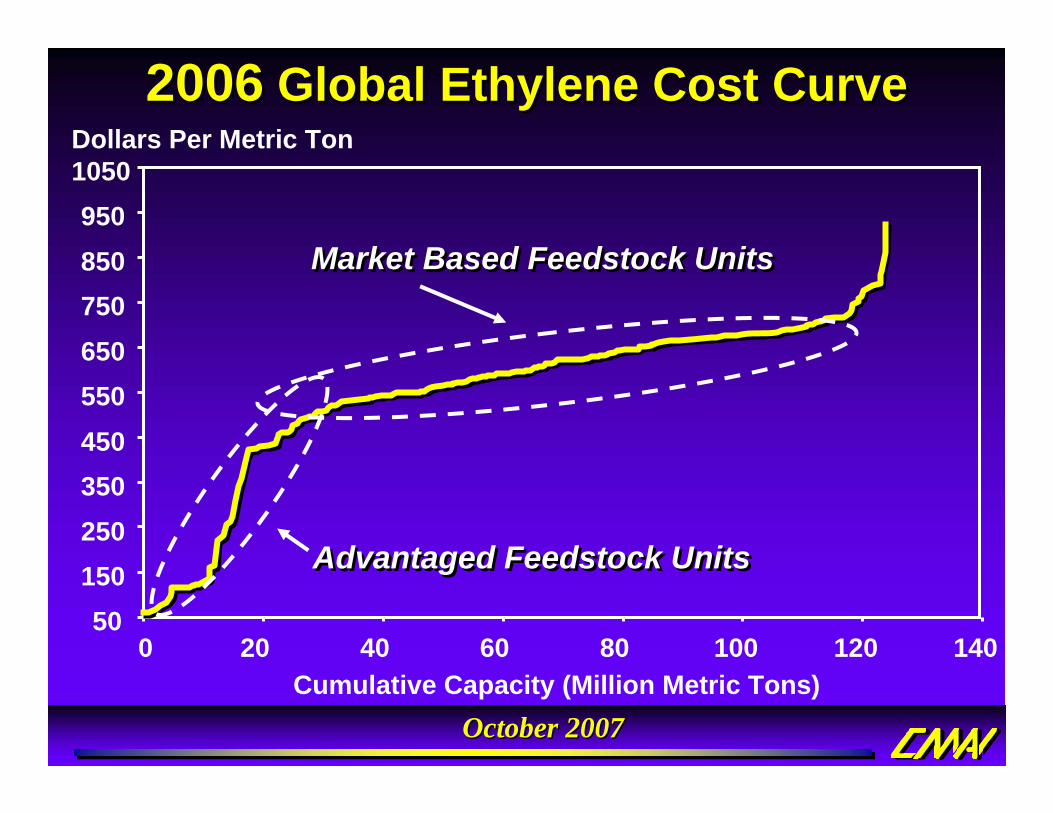
2006 Global Ethylene Cost Curve2006 Global Ethylene Cost CurveDollars Per Metric Ton1050
50150250350450550650750850950
0 20 40 60 80 100 120 140
Advantaged Feedstock UnitsAdvantaged Feedstock Units
Market Based Feedstock UnitsMarket Based Feedstock Units
October 2007October 2007
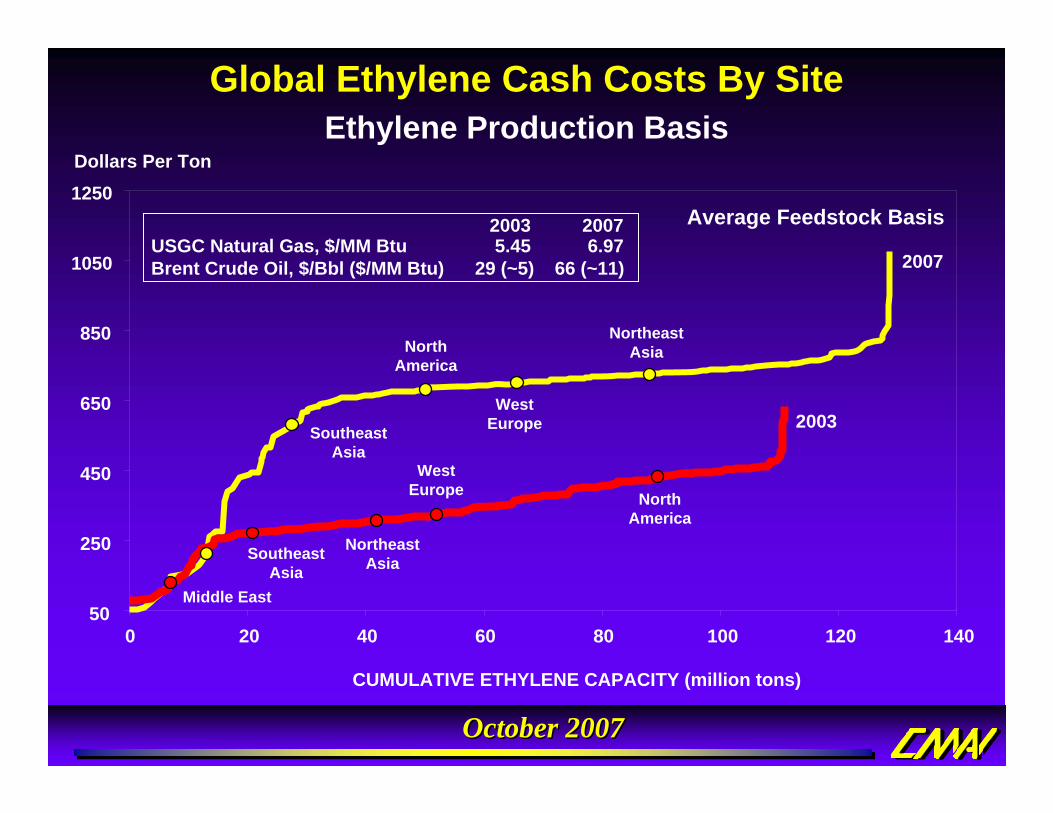
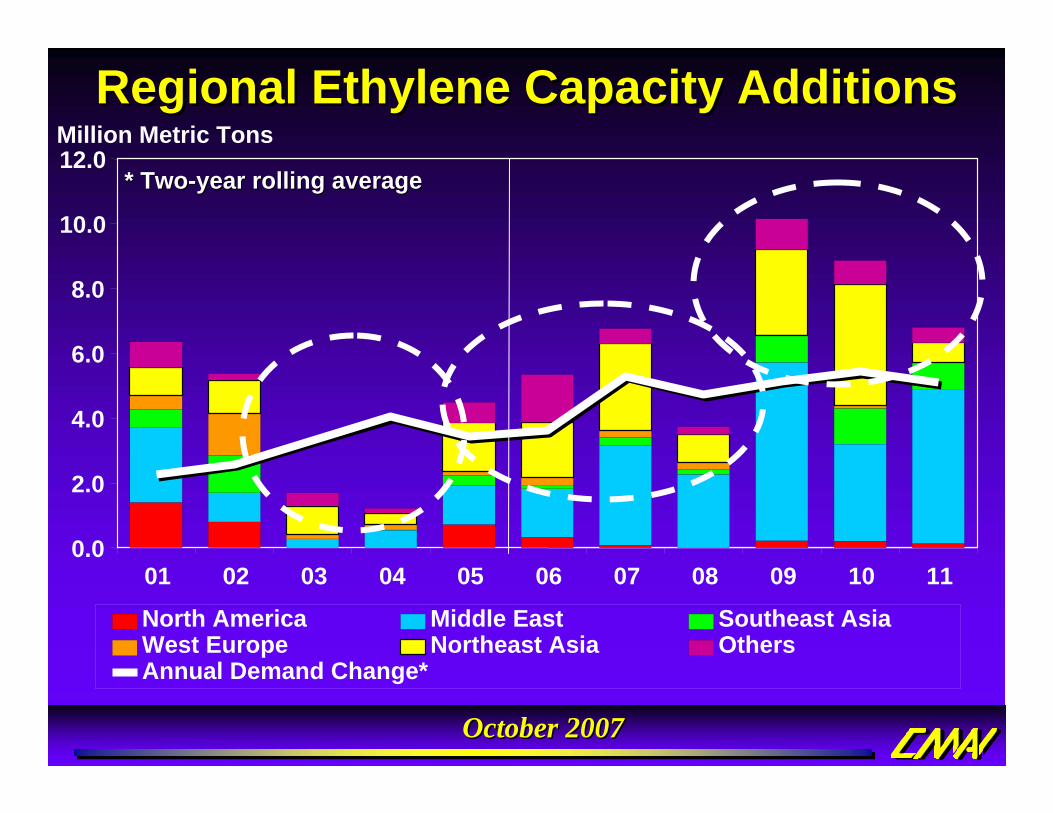
Ethylene Production BasisGlobal Ethylene Cash Costs By Site
North America Middle East Southeast AsiaWest Europe Northeast Asia Others
* Two* Two--year rolling averageyear rolling average
Annual Demand Change*
October 2007October 2007
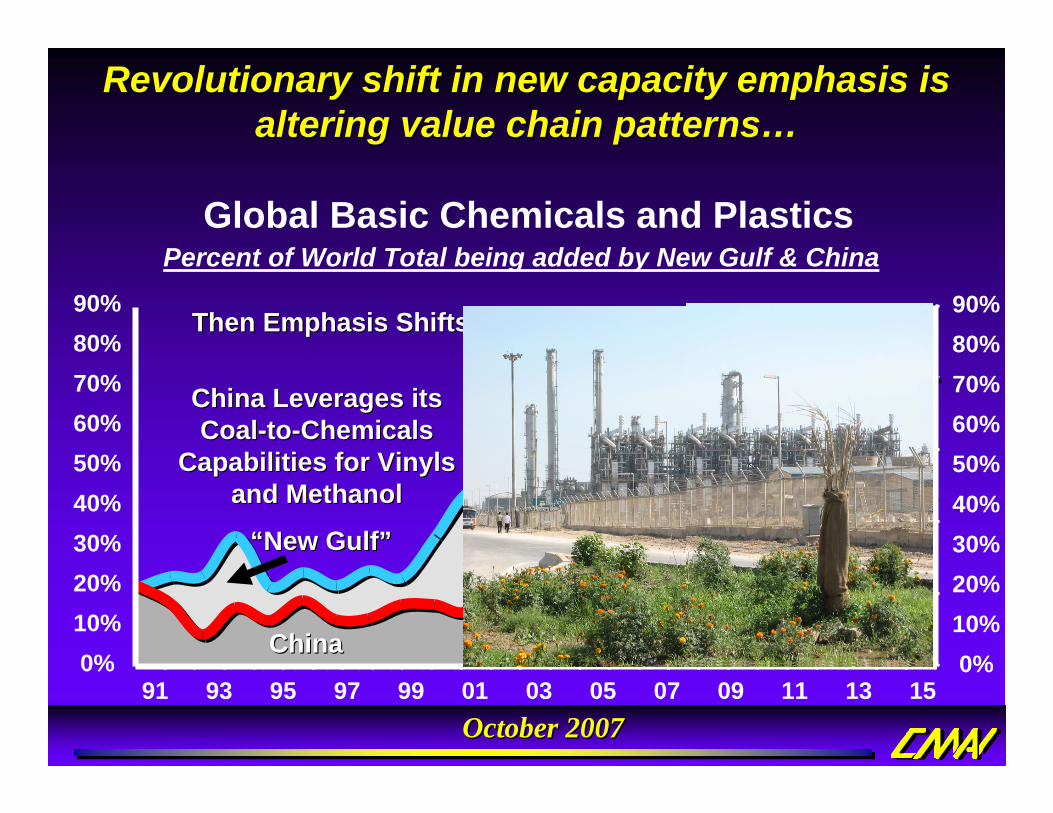
Global Basic Chemicals and PlasticsPercent of World Total being added by New Gulf & China
Then Emphasis Shifts to the Then Emphasis Shifts to the ““New GulfNew Gulf””
Revolutionary shift in new capacity emphasis is Revolutionary shift in new capacity emphasis is altering value chain patternsaltering value chain patterns……
0%10%20%30%40%50%60%70%80%90%
91 93 95 97 99 01 03 05 07 09 11 13 150%
10%20%30%40%50%60%70%80%90%
China Leverages its China Leverages its CoalCoal--toto--Chemicals Chemicals
Capabilities for Vinyls Capabilities for Vinyls and Methanoland Methanol
ChinaChina
““New GulfNew Gulf””
““New GulfNew Gulf””
ChinaChina
October 2007October 2007
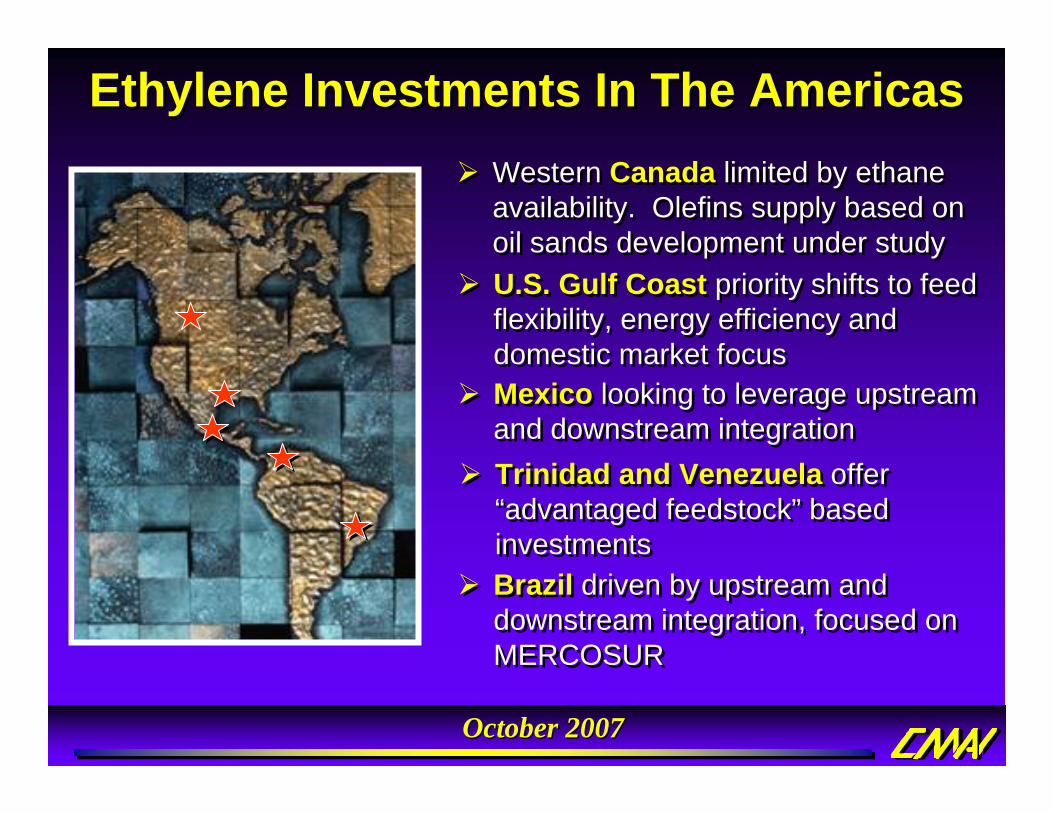
Ethylene Investments In The Americas Ethylene Investments In The Americas Western Canada limited by ethane availability. Olefins supply based on oil sands development under study
Western Canada limited by ethane availability. Olefins supply based on oil sands development under studyU.S. Gulf Coast priority shifts to feed flexibility, energy efficiency and domestic market focus
U.S. Gulf Coast priority shifts to feed flexibility, energy efficiency and domestic market focusMexico looking to leverage upstream and downstream integrationMexico looking to leverage upstream and downstream integrationTrinidad and Venezuela offer “advantaged feedstock” based investments
Trinidad and Venezuela offer “advantaged feedstock” based investments Brazil driven by upstream and downstream integration, focused on MERCOSUR
Brazil driven by upstream and downstream integration, focused on MERCOSUR
October 2007October 2007
Olefins Demand Growth Remains Steady With The Economy
Olefins Demand Growth Remains Steady With The Economy
A strong and resilient global economy continues to drive demand growth for light olefinsEthylene demand growth forecast at ~4% per year
Strongest Growth In PE and EO/EG
Propylene demand growth forecast at ~5% per year
Strongest growth in PP and Cumene
A strong and resilient global economy continues to drive demand growth for light olefinsEthylene demand growth forecast at ~4% per year