27
Petrochemical Scenario Across Continents: What is Happening in the World of Polypropylene? IOCL Petrochemical Conclave New Delhi, February 2014 Sanjay Moolji Tricon Energy Ltd.
Petrochemical Scenario Across Continents:
What is Happening in the World of Polypropylene?
IOCL Petrochemical Conclave
New Delhi, February 2014
Sanjay Moolji
Tricon Energy Ltd.
• World Polymer Business
• PP – Trends, Trade balance & Global
Markets
• Challenges & Uncertainties
• Conclusions
• About Tricon EnergySTRICTLY CONFIDENTIAL
CONTENTS
Polymer Business – Global Overview
STRICTLY CONFIDENTIAL
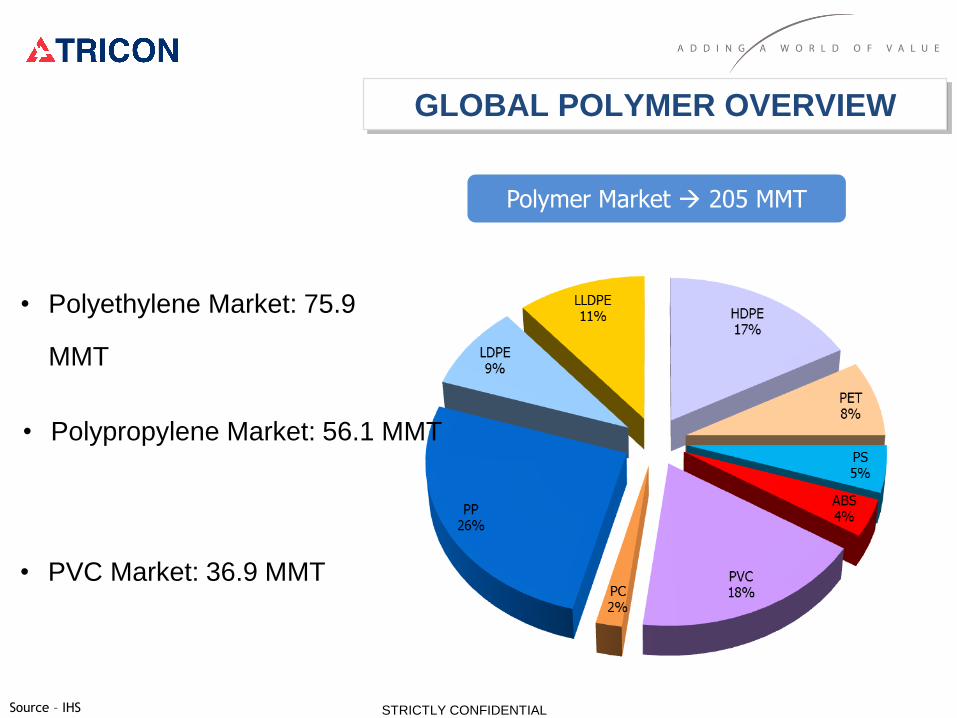
Polymer Market 205 MMT
• Polyethylene Market: 75.9
MMT
• Polypropylene Market: 56.1 MMT
• PVC Market: 36.9 MMT
GLOBAL POLYMER OVERVIEW
STRICTLY CONFIDENTIALSource – IHS
Source – IHS STRICTLY CONFIDENTIAL
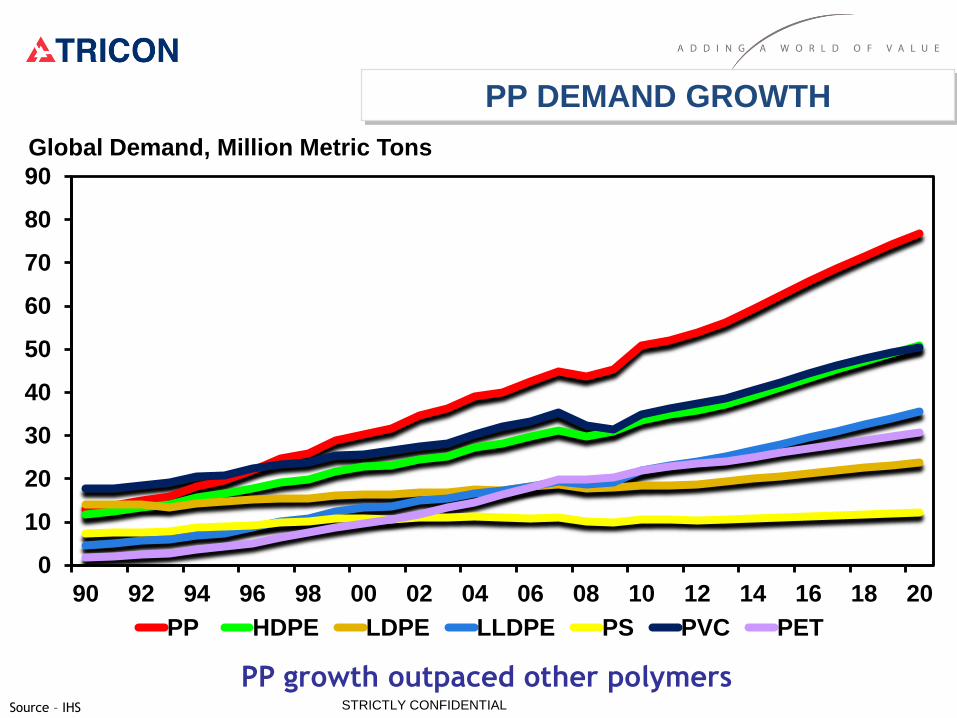
PP DEMAND GROWTH
0
10
20
30
40
50
60
70
80
90
90 92 94 96 98 00 02 04 06 08 10 12 14 16 18 20
PP HDPE LDPE LLDPE PS PVC PET
Global Demand, Million Metric Tons
PP growth outpaced other polymers

Polypropylene Business – Global Overview
STRICTLY CONFIDENTIAL
18.6 mmta
STRICTLY CONFIDENTIAL
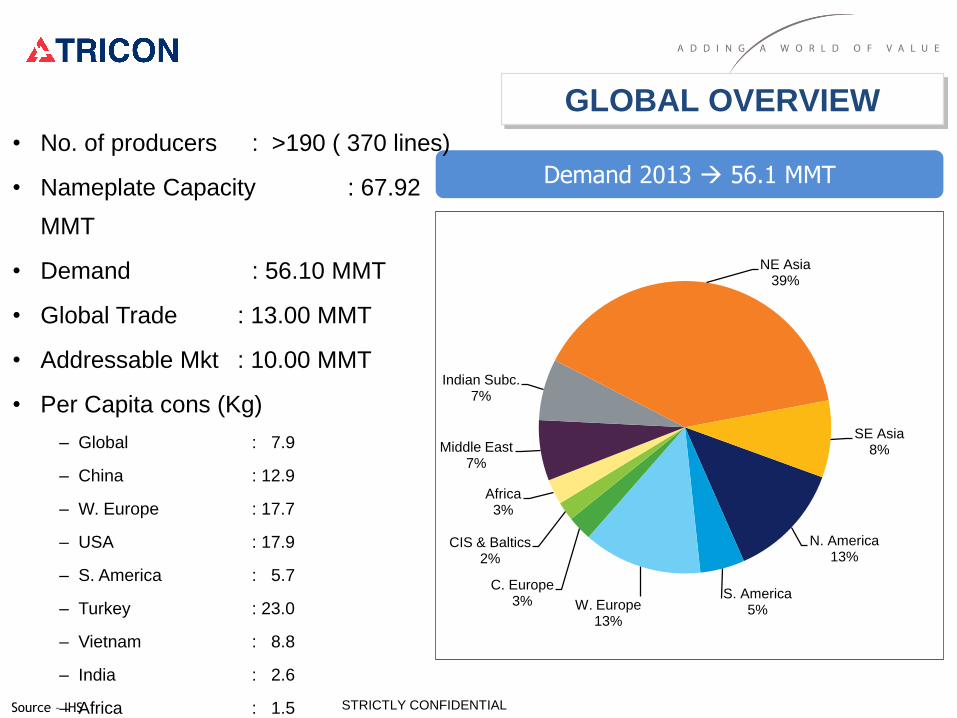
N. America13%
S. America5%W. Europe
13%
C. Europe3%
CIS & Baltics2%
Africa3%
Middle East7%
Indian Subc.7%
NE Asia39%
SE Asia8%
Demand 2013 56.1 MMT
GLOBAL OVERVIEW
• No. of producers : >190 ( 370 lines)
• Nameplate Capacity : 67.92
MMT
• Demand : 56.10 MMT
• Global Trade : 13.00 MMT
• Addressable Mkt : 10.00 MMT
• Per Capita cons (Kg)
– Global : 7.9
– China : 12.9
– W. Europe : 17.7
– USA : 17.9
– S. America : 5.7
– Turkey : 23.0
– Vietnam : 8.8
– India : 2.6
– Africa : 1.5Source – IHS

Top 10 producers account for 55% of global capacity
Capacity Capacity
(Kt) (Kt)
Lyondell Basell 6.47 1 Lyondell Basell 6.52
Sinopec Group 4.93 2 Sinopec Group 6.46
Braskem Group 4.03 3 PetroChina Group 4.61
SABIC 3.46 4 Braskem Group 4.03
PetroChina Group 3.04 5 Borealis / Borouge 3.72
Reliance Industries 2.75 6 SABIC 3.46
Borealis / Borouge 2.75 7 Exxon Mobil 2.79
Total PC 2.72 8 Reliance Industries 2.75
Exxon Mobil 2.28 9 Total PC 2.72
Formosa Plastics Corp. 2.27 10 Formosa Plastics Corp. 2.27
Total (Top 10) 34.69 Total (Top 10) 39.32
Global Capacity 64.18 Global Capacity 76.81
2011 2016Rank
Source – IHS/INTERNAL STRICTLY CONFIDENTIAL
PP PRODUCERS – THE BIG DADDY’S

20013-2018 =+18.5 MMT
2013 – 2018 AAGR
Total Capacity = 4.9%
Total Demand = 5.0%
-2.0
-1.0
0.0
1.0
2.0
3.0
4.0
5.0
6.0
2008 2009 2010 2011 2012 2013 2014 2015 2016 2017 2018North America South America West Europe
CEP/CIS Africa/Middle East Indian Sub.
Northeast Asia Southeast Asia Global Demand Growth
Million Metric Tons
Capacity Builds in Middle East and China Over-Capacity ??
2008-2013 =+16.5 MMT
PP CAPACITY OVERVIEW
STRICTLY CONFIDENTIALSource – IHS
Polypropylene Trade Balance
STRICTLY CONFIDENTIAL

523188
1105
0
500
1000
1500
2000
2500
3000
3500
2010 2014 2018NORTH AMERICA
SOUTH AMERICA
WEST EUROPE
CENTRAL EUROPECIS/ BALTIC
AFRICA
N E ASIA
S E ASIA
MIDDLE EAST
INDIAN S C
Changing Global Dynamics…. Significant Shift in Global TradeSource: IHS
PP TRADE BALANCE
-214-376
-960
-3500
-3000
-2500
-2000
-1500
-1000
-500
0
2010 2014 2018
1654
3132 3167
0
500
1000
1500
2000
2500
3000
3500
2010 2014 2018
-516-710
-1039
-3500
-3000
-2500
-2000
-1500
-1000
-500
0
2010 2014 2018
-174 -106
-1382
-3500
-3000
-2500
-2000
-1500
-1000
-500
0
2010 2014 2018 -214-376
-960
-3500
-3000
-2500
-2000
-1500
-1000
-500
0
2010 2014 2018
-474 -458-272
-3500
-3000
-2500
-2000
-1500
-1000
-500
0
2010 2014 2018
973
395
-358-1000
-500
0
500
1000
1500
2000
2500
3000
3500
2010 2014 2018-1467 -1503
498
-2000
-1500
-1000
-500
0
500
1000
1500
2010 2014 2018
STRICTLY CONFIDENTIAL
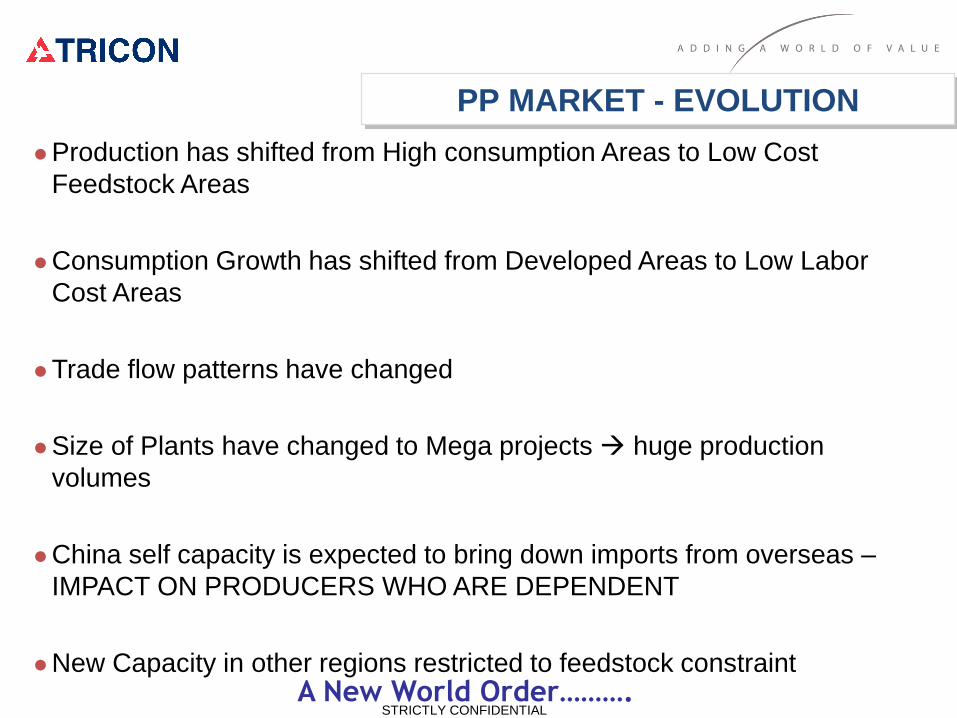
Production has shifted from High consumption Areas to Low Cost
Feedstock Areas
Consumption Growth has shifted from Developed Areas to Low Labor
Cost Areas
Trade flow patterns have changed
Size of Plants have changed to Mega projects huge production
volumes
China self capacity is expected to bring down imports from overseas –
IMPACT ON PRODUCERS WHO ARE DEPENDENT
New Capacity in other regions restricted to feedstock constraintA New World Order……….
PP MARKET - EVOLUTION
STRICTLY CONFIDENTIAL
Challenges & Uncertainties
STRICTLY CONFIDENTIAL

Propylene Produced from Multiple Sources…………
Propane
MetathesisEthylene/Butylene
Naphtha/NGL
Refinery
FCC Unit
Alkylation
Unit
Isobutane
High Octane
Alkylate
GasolineGas Oil
Non-ChemicalRefinery Grade60% purity
Cracker
Cumene, Oligomers,
Isopropanol
Polymer Grade (99.5%)
Chemical Grade (94%)Purificatio
n Splitter
Propane
Chemical
Propane
Dehydrogenation
(PDH)
On Purpose
On Purpose
MTO / MTPOn PurposeMethanol (ex-
Synthesis Gas, ex-
coal) STRICTLY CONFIDENTIALSource – IHS

Propylene Demand Profile 2013……….
Stm. Crackers
55%
FCC Splitters
31%
Dehydro5%
Metathesis4%
Coal to Propylene
1%
HS FCC3%
Others On-Purpose
1%
2013 Production Estimate = 83.6 Million Metric Tons
Production by Feedstock Demand by End-Use
Acrylic Acid4%
Acrylo-nitrile7%
Cumene4% Iso-propanol
1%
2-Ethyl Hexanol
3%
Butanols3%
Poly-propylene
68%
Propylene Oxide
8%
Others2%
STRICTLY CONFIDENTIALSource – IHS
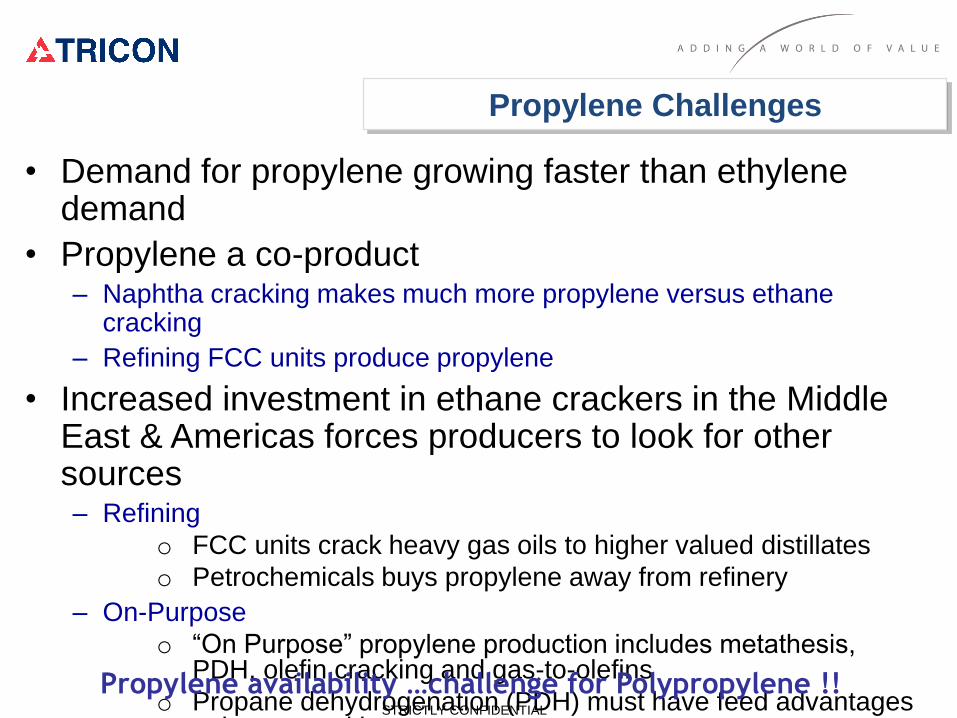
• Demand for propylene growing faster than ethylene demand
• Propylene a co-product – Naphtha cracking makes much more propylene versus ethane
cracking
– Refining FCC units produce propylene
• Increased investment in ethane crackers in the Middle East & Americas forces producers to look for other sources– Refining
o FCC units crack heavy gas oils to higher valued distillates
o Petrochemicals buys propylene away from refinery
– On-Purpose
o “On Purpose” propylene production includes metathesis, PDH, olefin cracking and gas-to-olefins
o Propane dehydrogenation (PDH) must have feed advantages to be competitive.
Propylene Challenges
Propylene availability …challenge for Polypropylene !!STRICTLY CONFIDENTIAL
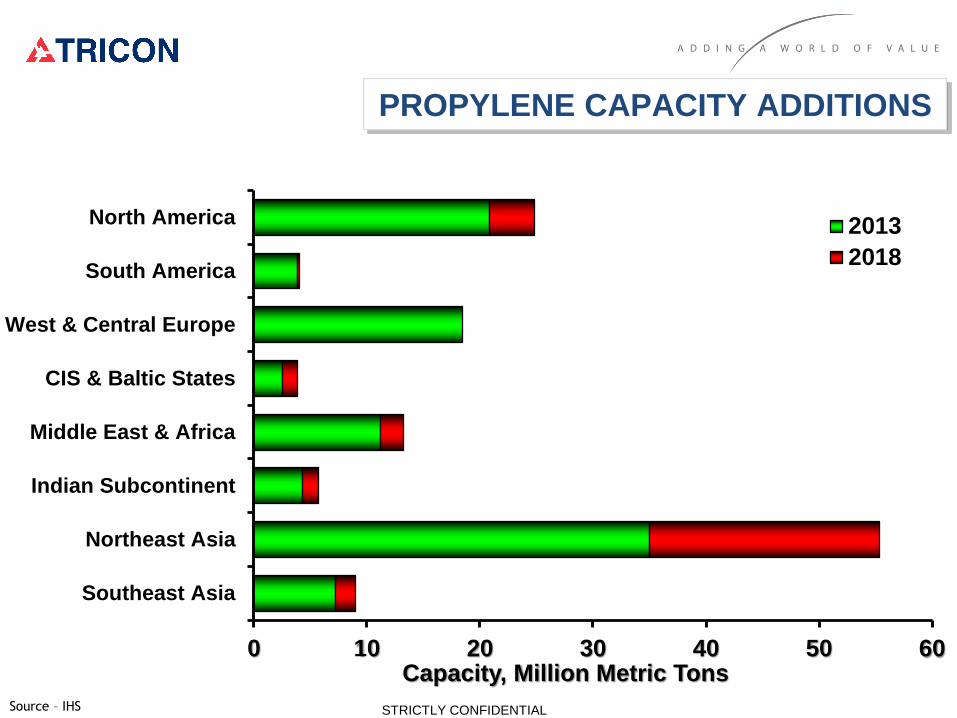
0 10 20 30 40 50 60
North America
South America
West & Central Europe
CIS & Baltic States
Middle East & Africa
Indian Subcontinent
Northeast Asia
Southeast Asia
2013
2018
PROPYLENE CAPACITY ADDITIONS
STRICTLY CONFIDENTIALSource – IHS
Capacity, Million Metric Tons

NAM Propylene Capacity Additions
Abundant Propane Driving Investments…will it make PP ??
Announced
Company Location Type
Capacity
KT Start-up Date
Debottlenecks /
New build
Dow Freeport, TX PDH 750 Q3 2015 NB
Enterprise Mont Belvieu, TX PDH 750 Q4 2015 NB
Formosa Point Comfort, TX PDH 600 Q3 2016 NB
Ascend Alvin, TX PDH 1000 Q1 2017 NB
Williams Redwater, Alberta PDH 500 Q2 2017 NB
Dow Freeport, TX PDH 750 Q3 2018 NB
Total 4350
On Hold
Company Location Type
Capacity
KT Start-up Date
Debottlenecks /
New Build
Petrologistics Houston, TX PDH 658 On hold DB/NB
STRICTLY CONFIDENTIAL
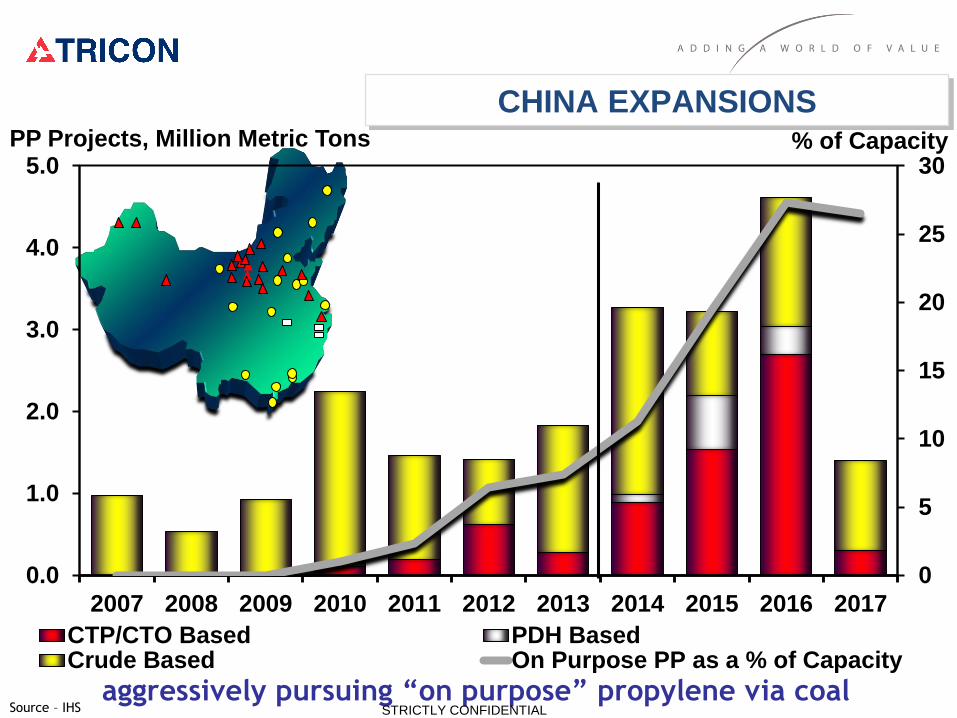
aggressively pursuing “on purpose” propylene via coal
PP Projects, Million Metric Tons
0
5
10
15
20
25
30
0.0
1.0
2.0
3.0
4.0
5.0
2007 2008 2009 2010 2011 2012 2013 2014 2015 2016 2017
CTP/CTO Based PDH BasedCrude Based On Purpose PP as a % of Capacity
% of Capacity
CHINA EXPANSIONS
STRICTLY CONFIDENTIALSource – IHS

Fushun PC (300kt)
Datang Int'l Power (500kt)
Sichuan PC (450kt)
Ningxia Refinery (100kt)
SINOPEC Wuhan (400kt)
Shanghai PC (200kt)
Daqing Refinery (300kt)
Hohhot Refining (150kt)
Sinopec BeiHai PC (200kt)
Yulin Energy & Chemical Co. (600kt)
Luoyang PC (140kt)
PuCheng Clean Energy (400kt)
Hebei Haiwei (300kt)
Ningbo Heyuan Chemical (300kt)
Shaanxi Yanchang (250kt)
Yankuang Guohong Chem. (300kt)
Shanxi Coking Corp. (300kt)
Sinopec-KPC PC JV (745kt)
CNOOC & Shell PC (700kt)
Yili Meidianhua (300kt)
Guangzhou PC (200kt)
Maoming PC (200kt)
Qinghai Salt (160kt)
Shenhua Ningmei (500kt)
SINOPEC Zhijin (300kt)
Shenhua Xinjiang (450kt)
2012
2013
2014
2015
2016
2017
Shandong Shenda (200kt)
Huating Coal Group (200kt)
Ningxia Yongda PC (120kt)
Baofeng Energy (300kt)
Jiutai Energy (IM) (300kt)
Sinopec /Wanbei JV (300kt)
Fujian ZhongJiang PC (350kt)
Fujian Zhongjing PC (350kt)
China Coal Crop. Yuheng (300kt)
Qingdao Ref&Chem (350kt)
Zhongtian Hechuang (700kt)
Shenhua Xiwan (380kt)
CPI/Total JV (400kt)
Sinopec Hainan R&C (400kt)
Yangzijang 400 KT
CHINA…..
STRICTLY CONFIDENTIALSource – IHS

0
10
20
30
40
50
60
70
80
90
100
0.0
5.0
10.0
15.0
20.0
25.0
30.0
35.0
40.0
2008 2010 2012 2014 2016 2018
Domestic Demand Exports
Total Capacity Imports
Operating Rate Imports as a % of Dom. Dem.
Million Metric Tons Operating Rate,%
• New Capacity
− 2008-13: +7.8 MMT
− 2013-18: +13.1
MMT
• More than 25%
capacity via on-purpose
by 2017, mainly CTP
• Import requirements
drop to less than 7% of
domestic demand in 5
years
STRICTLY CONFIDENTIALSource – IHS
CHINA : DEMAND SUPPLY FORECAST

STRICTLY CONFIDENTIAL
• Polypropylene no longer cheapo Incremental supply of C3 will come from non-
traditional/on purpose technologies
o China pursuing aggressively on Coal technology
o PDH based PP in North America can be advantaged : US may build new capacity by 2017/2018
• Demand to continue to grow, but at lower pace than expected in previous years
o Relative price position versus other polymers taking a toll on demand growth
o Developing economies will lead demand expansion
• Next 5 Years brings significant shifts in trade flows
o China becomes more self sufficient
o Middle East Redirects exports
o Europe transitions to new import position
o New Capacity in North America may increase export Position
CONCLUSIONS : PP
A volatile future....

Founded in 1996
29 Local Offices
22 Languages
28 Nationalities
300+ Employees
Operating in over 100 countries
Leader in Caustic, Styrene, Xylenes & Pygas
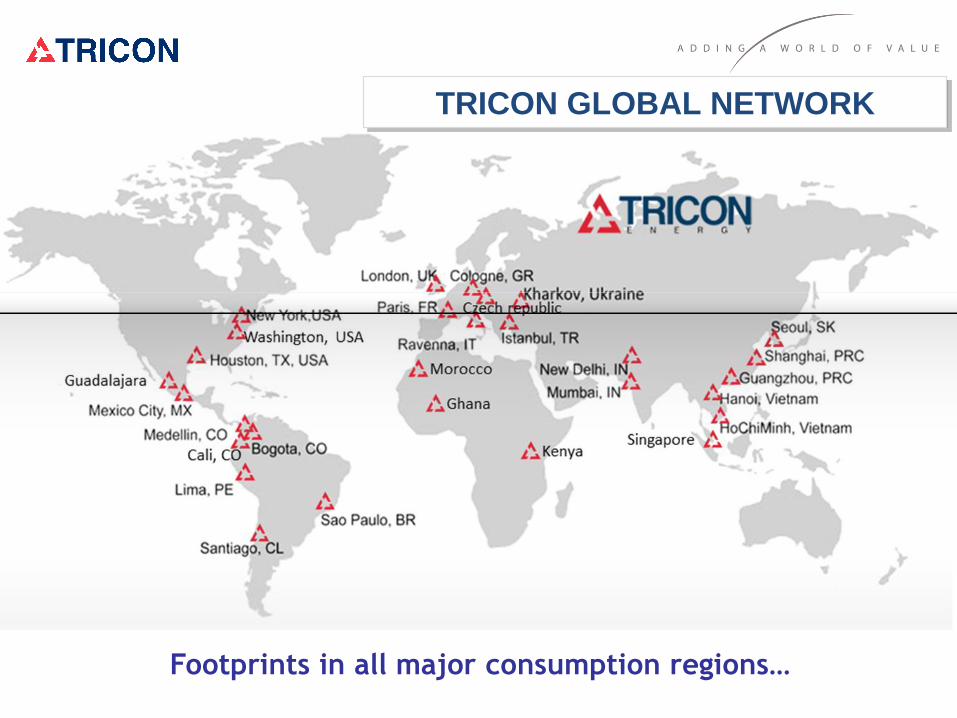
TRICON GLOBAL NETWORK
Footprints in all major consumption regions…


FUTURE
Curiosity for new products
Passion for new places
Creativity for new services
“Tricon’s evolution is the result of the commitment of its partners to expand into additional
markets and support new product lines and industries, but always keeping our people as the
core of our strategy. As a result, the employee base, the number of offices, and the quantity
and quality of our business keeps growing year after year.”
Ignacio Torras, CEO
www.triconenergy.com
Thank you
Plastics is Fantastic !!!


