Petroleum & Petrochemical Engineering Journal ISSN: 2578-4846 Prediction of Dew Point Pressure in Gas Condensate Reservoirs Based On a Combination of Gene Expression Programming (GEP) and Multiple Regression Analysis Pet Petro Chem Eng J Prediction of Dew Point Pressure in Gas Condensate Reservoirs Based On a Combination of Gene Expression Programming (GEP) and Multiple Regression Analysis El-hoshoudy AN 1,2, *, Gomaa S 2,3 and Desouky SM 3 1 PVT- lab, Production Department, Egyptian Petroleum Research Institute, Cairo, Egypt 2 Mining and Petroleum Engineering Department, Faculty of Engineering, Al-Azhar University, Cairo, Egypt 3 Petroleum Engineering Department, Faculty of Engineering, British University in Egypt, Elshorouk city, Cairo, Egypt *Corresponding author: El-hoshoudy AN, PVT- lab, Production Department, Egyptian Petroleum Research Institute, Cairo, Egypt, Tel: 1143776927; Email: [email protected]Abstract Gas condensate reservoirs represent unique and clean hydrocarbon source of energy, so prediction of their thermodynamic criteria especially dewpoint pressure (Pd) is crucial for reservoir characterization and management, since declining of initial reservoir pressure below dewpoint pressure result in liquid built up near wellbore and reduce gas productivity index. In this study, a mathematical modeling developed to estimate dewpoint pressure at reservoir temperature using reliable, precise, well-organized gene expression programming (GEP) approach in combination with multiple non-linear regression analysis. The dataset comprises 453 published data points, and the model developed as a function of compositional analysis of hydrocarbons components (ZC1-ZC7+), physical properties of heptane plus fractions (C7 + ) including molecular weight and specific gravity, the mole fraction of nonhydrocarbons (Z CO2& ZN2) and reservoir temperature. Experimental Pressure-Volume-Temperature (PVT) analysis including constant composition expansion (CCE) at reservoir conditions and compositional analysis are carried out through 27 gas condensate samples not used in model development, and covering a great range of PVT properties to evaluate the new predictive model accuracy. Assessment and validation of the developed and published correlations carried out by a statistical and graphical error analyses. The obtained relative errors indicate that the developed model employed as an alternative approach monitoring the dewpoint pressure of gas condensate reservoirs when the required real data are not accessible. Keywords: Retrograde gas reservoirs; Dewpoint pressure; Gene expression programming (GEP); Genetic Algorithm (GA); Regression analysis; Empirical correlation Research Article Volume 2 Issue 5 Received Date: June 29, 2018 Published Date: July 12, 2018
Prediction of Dew Point Pressure in Gas Condensate Reservoirs Based On a Combination of Gene Expression Programming (GEP) and Multiple Regression Analysis Pet Petro Chem Eng J
Prediction of Dew Point Pressure in Gas Condensate
Reservoirs Based On a Combination of Gene Expression
Programming (GEP) and Multiple Regression Analysis
El-hoshoudy AN1,2,*, Gomaa S2,3 and Desouky SM3
1PVT- lab, Production Department, Egyptian Petroleum Research Institute, Cairo, Egypt
2Mining and Petroleum Engineering Department, Faculty of Engineering, Al-Azhar
University, Cairo, Egypt
3Petroleum Engineering Department, Faculty of Engineering, British University in Egypt,
Elshorouk city, Cairo, Egypt
*Corresponding author: El-hoshoudy AN, PVT- lab, Production Department, Egyptian Petroleum Research Institute,
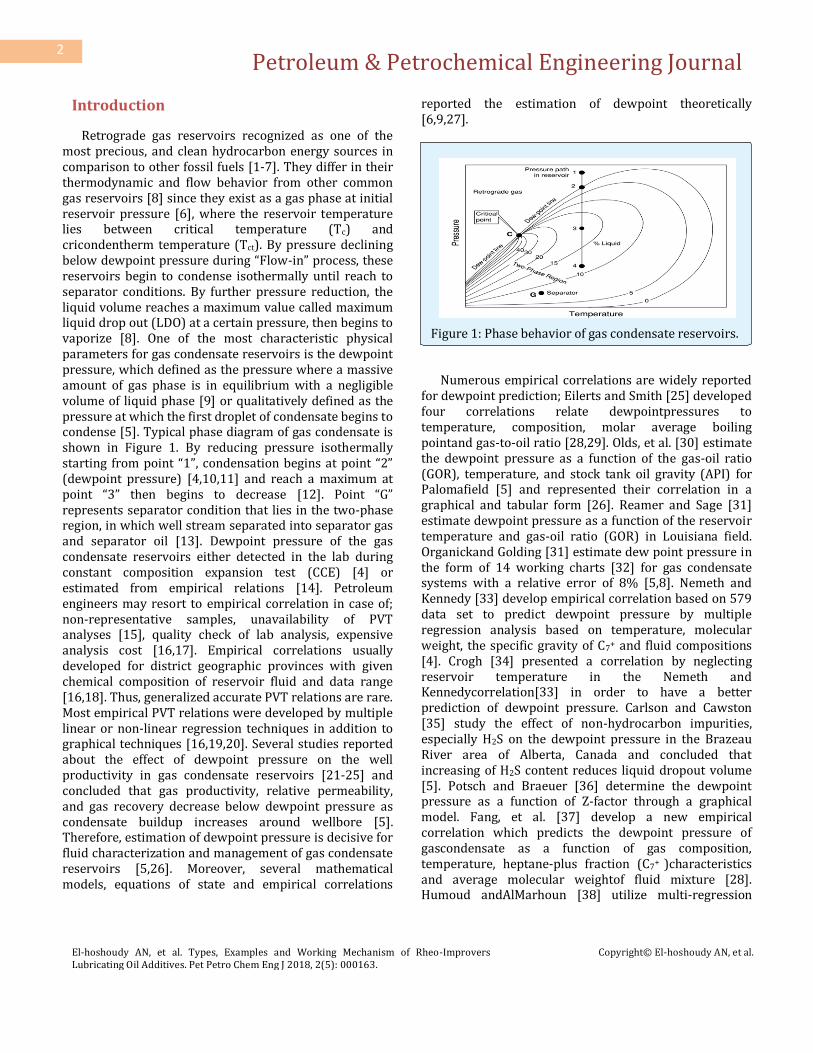
Retrograde gas reservoirs recognized as one of the most precious, and clean hydrocarbon energy sources in comparison to other fossil fuels [1-7]. They differ in their thermodynamic and flow behavior from other common gas reservoirs [8] since they exist as a gas phase at initial reservoir pressure [6], where the reservoir temperature lies between critical temperature (Tc) and cricondentherm temperature (Tct). By pressure declining below dewpoint pressure during “Flow-in” process, these reservoirs begin to condense isothermally until reach to separator conditions. By further pressure reduction, the liquid volume reaches a maximum value called maximum liquid drop out (LDO) at a certain pressure, then begins to vaporize [8]. One of the most characteristic physical parameters for gas condensate reservoirs is the dewpoint pressure, which defined as the pressure where a massive amount of gas phase is in equilibrium with a negligible volume of liquid phase [9] or qualitatively defined as the pressure at which the first droplet of condensate begins to condense [5]. Typical phase diagram of gas condensate is shown in Figure 1. By reducing pressure isothermally starting from point “1”, condensation begins at point “2” (dewpoint pressure) [4,10,11] and reach a maximum at point “3” then begins to decrease [12]. Point “G” represents separator condition that lies in the two-phase region, in which well stream separated into separator gas and separator oil [13]. Dewpoint pressure of the gas condensate reservoirs either detected in the lab during constant composition expansion test (CCE) [4] or estimated from empirical relations [14]. Petroleum engineers may resort to empirical correlation in case of; non-representative samples, unavailability of PVT analyses [15], quality check of lab analysis, expensive analysis cost [16,17]. Empirical correlations usually developed for district geographic provinces with given chemical composition of reservoir fluid and data range [16,18]. Thus, generalized accurate PVT relations are rare. Most empirical PVT relations were developed by multiple linear or non-linear regression techniques in addition to graphical techniques [16,19,20]. Several studies reported about the effect of dewpoint pressure on the well productivity in gas condensate reservoirs [21-25] and concluded that gas productivity, relative permeability, and gas recovery decrease below dewpoint pressure as condensate buildup increases around wellbore [5]. Therefore, estimation of dewpoint pressure is decisive for fluid characterization and management of gas condensate reservoirs [5,26]. Moreover, several mathematical models, equations of state and empirical correlations
reported the estimation of dewpoint theoretically [6,9,27].
Figure 1: Phase behavior of gas condensate reservoirs. Numerous empirical correlations are widely reported
for dewpoint prediction; Eilerts and Smith [25] developed four correlations relate dewpointpressures to temperature, composition, molar average boiling pointand gas-to-oil ratio [28,29]. Olds, et al. [30] estimate the dewpoint pressure as a function of the gas-oil ratio (GOR), temperature, and stock tank oil gravity (API) for Palomafield [5] and represented their correlation in a graphical and tabular form [26]. Reamer and Sage [31] estimate dewpoint pressure as a function of the reservoir temperature and gas-oil ratio (GOR) in Louisiana field. Organickand Golding [31] estimate dew point pressure in the form of 14 working charts [32] for gas condensate systems with a relative error of 8% [5,8]. Nemeth and Kennedy [33] develop empirical correlation based on 579 data set to predict dewpoint pressure by multiple regression analysis based on temperature, molecular weight, the specific gravity of C7
+ and fluid compositions [4]. Crogh [34] presented a correlation by neglecting reservoir temperature in the Nemeth and Kennedycorrelation[33] in order to have a better prediction of dewpoint pressure. Carlson and Cawston [35] study the effect of non-hydrocarbon impurities, especially H2S on the dewpoint pressure in the Brazeau River area of Alberta, Canada and concluded that increasing of H2S content reduces liquid dropout volume [5]. Potsch and Braeuer [36] determine the dewpoint pressure as a function of Z-factor through a graphical model. Fang, et al. [37] develop a new empirical correlation which predicts the dewpoint pressure of gascondensate as a function of gas composition, temperature, heptane-plus fraction (C7
+ )characteristics and average molecular weightof fluid mixture [28]. Humoud andAlMarhoun [38] utilize multi-regression
Petroleum & Petrochemical Engineering Journal
El-hoshoudy AN, et al. Types, Examples and Working Mechanism of Rheo-Improvers Lubricating Oil Additives. Pet Petro Chem Eng J 2018, 2(5): 000163.
techniques to develop an empirical model for gas condensate samples extracted fromthe Middle East region [5]. Their correlation developed as a function of reservoir temperature, pseudo reduced pressure and temperature, separator gas/oil ratio, separator pressure and temperature, relative densities of separator gas and the heptane-plus fraction [28], with an average absolute error of 4.3%, and a maximum relative error of 15.1% [26]. Marruffo et al. [39,40] proposed a mathematical model to predict dewpoint pressure and C7
+characteristics ofgas condensate reservoirs using146 PVT data points through nonlinear regression software from Western Venezuela (Anaco) fields [5]. Elsharkawy [41] develop an empirical model which predict dewpoint pressure based on 340 measured data point as a function of molecular weight, temperature, fluid composition, and specific gravity of C7
+ components. Al-Dhamen and Al-Marhoun [42] use the artificial neural network to develop a new correlation as a function of reservoir temperature, gas/oil ratio,gas and oil specific gravity. Shokir [9] use 245 data set and apply mathematical genetic approach and orthogonalleast squares algorithm to predict dewpoint pressure as a function of reservoir fluid composition and reservoirtemperature [28] neglecting specific gravity of C7
+. Godwin [43] used 259 gas condensate sample covering a wide range of gas properties and develop a new model predicting dewpoint pressure as a function of gas composition analysis and reservoir temperature with an average relative error of 0.0488% and absolute average relative error of 0.099%. Wang, et al. [44] predict dewpoint pressures of gas condensate reservoirs as a function of reservoir temperature, gas composition and physical properties of C7
+ component based on 14 group of gas condensate samples in China. Kaydani, et al. [28] develop a new correlation based on multi-gene genetic programming to determine dewpoint pressure of gas condensate reservoirs. Kamari, et al. [8] develop a new modelfor predicting dewpoint pressure in gas condensate reservoirs using gene expression soft-computing programming, based on 562 experimental data set from constant volume depletion (CVD) tests. Ahmadi and Elsharkawy [32] develop a correlation to estimate the dewpoint pressure in gas condensate reservoirs using gene expression programming (GEP).
Owing to complex relations between composition and dewpoint pressure [45], itis not practical to develop a
universal global correlation to predict thisparameter as stated in the literature [29,31,46]. Moreover, the experimental determination of dewpoint pressure for the gas condensate fluid at reservoir temperature is relatively expensive andtime-consuming [2,27,28,30,41,47]. This led the authors in this study to build up a novel relation using gene expression programming (GEP) as a soft computing approach in combination with multiple least squares non-linear regression analysis to predict dewpoint pressure for retrograde gas condensate reservoirs based on the published data covering a wide range. Moreover, the accuracy of the developed correlations as compared to the widely well-known published ones determined through statistical error analysis, then correlation validated by other 27experimentally measured dataset not used in model development.
Experimental PVT analysis
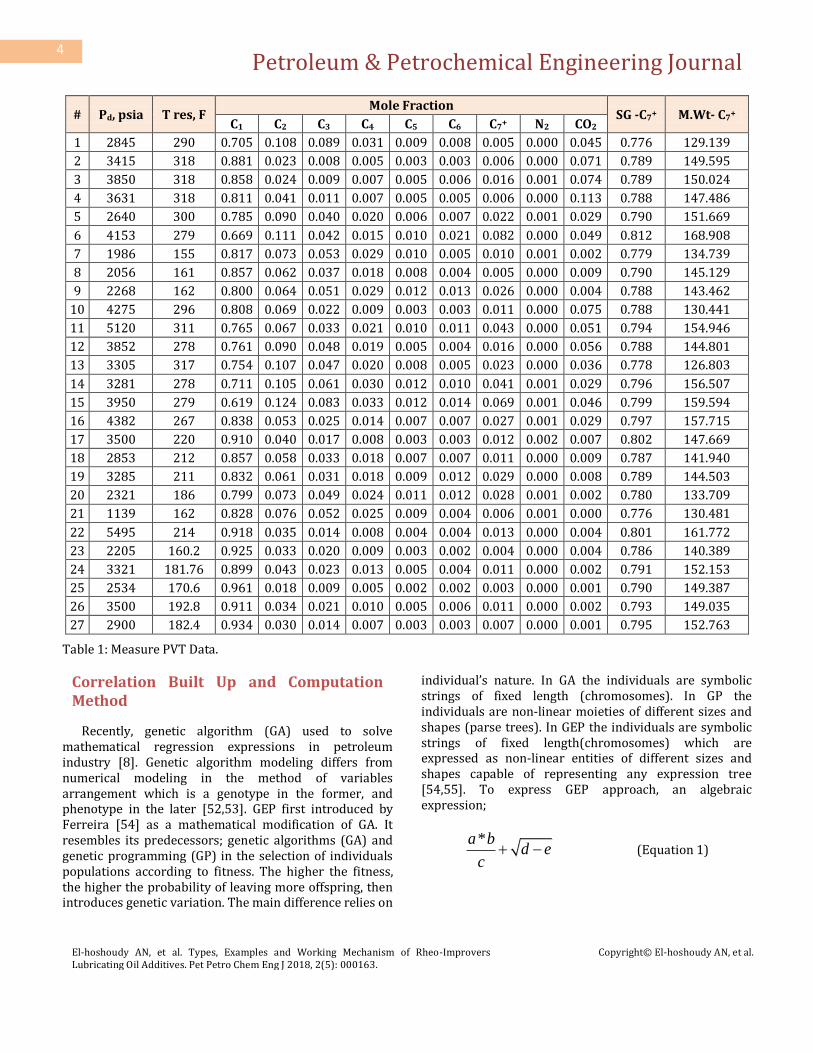
Dewpoint pressure determined experimentally in our PVT-lab through constant composition expansion (CCE) test. This test carried out to simulate the pressure-volume relations of the hydrocarbon systems [48]. The measured results are summarized in Table 1. The procedure reported in detail through literature [49,50] with minor modification and can be concluded as follow; a portion of the reservoir fluid sample was charged to the automated mercury free Vinci-PVT cell then, subjected to the reservoir temperature and excess of initial reservoir pressure. CCE test carried out by pressure declining isothermally without mass change where the dewpoint pressure and corresponding volume were recorded by running the Macro-built in Software and the retrograde liquid drop out detected by Interface Detection System (IDS). Composition analysis determined according to ASTM 1945 [51], using Clarus 500 Perkin Elmer gas chromatograph in line with the condensate cell utilizing four packed columns connected in series with thermal conductivity detector and capillary column matched with flame ionization detector. Helium used as a carrier gas and the oven isothermal temperature adjusted at 100°C in order to provide highly efficient detection of aromatics and paraffin’s (normal and isomers) up to heptane plus fractions, in addition to non-hydrocarbon components (N2,H2S & CO2).
Petroleum & Petrochemical Engineering Journal
El-hoshoudy AN, et al. Types, Examples and Working Mechanism of Rheo-Improvers Lubricating Oil Additives. Pet Petro Chem Eng J 2018, 2(5): 000163.
Recently, genetic algorithm (GA) used to solve mathematical regression expressions in petroleum industry [8]. Genetic algorithm modeling differs from numerical modeling in the method of variables arrangement which is a genotype in the former, and phenotype in the later [52,53]. GEP first introduced by Ferreira [54] as a mathematical modification of GA. It resembles its predecessors; genetic algorithms (GA) and genetic programming (GP) in the selection of individuals populations according to fitness. The higher the fitness, the higher the probability of leaving more offspring, then introduces genetic variation. The main difference relies on
individual’s nature. In GA the individuals are symbolic strings of fixed length (chromosomes). In GP the individuals are non-linear moieties of different sizes and shapes (parse trees). In GEP the individuals are symbolic strings of fixed length(chromosomes) which are expressed as non-linear entities of different sizes and shapes capable of representing any expression tree [54,55]. To express GEP approach, an algebraic expression;
*a bd e
c (Equation 1)
Petroleum & Petrochemical Engineering Journal
El-hoshoudy AN, et al. Types, Examples and Working Mechanism of Rheo-Improvers Lubricating Oil Additives. Pet Petro Chem Eng J 2018, 2(5): 000163.
Can be represented as a genotype of GEP chromosomes as shown in Figure 2, Where (a, b, c, d, e) considered as terminals and (Q, /, *, -) expressed for the functions.
Figure 2: Two genotype GEP chromosomes.
Generally, regression analysis used to build up empirical correlations [14,56]. Regression analysis used to correlate a set of independent variables to predict one dependent variable. If only one independent variable isinvolved, it is known as a simple regression analysis whilemultiple regression analysis involvesmore than one independent variable [16]. General multiple regression models, which relates a dependent variable “y” to “k” predictor of independent variables, x1, x2, ..., xk, is given by Equation 1 :
1 1 2 2 ......... k ky x x x
(Equation 2) Where α and β's are regression analysis coefficients and expressed in matrix form as follow [16,57].
111 12 1
1 221 22 2
2 331 32 3
1 2
1 ..
1 ..
1 ..
.. ..1 .. .. .. ..
.. ..1 .. .. .. ..
.. ..1 .. .. .. ..
1 ..
n
n
n
n nknk nk nkn
yx x x
yx x x
yx x x
yx x x
(Equation3)
Least-squares regression technique applied upon the
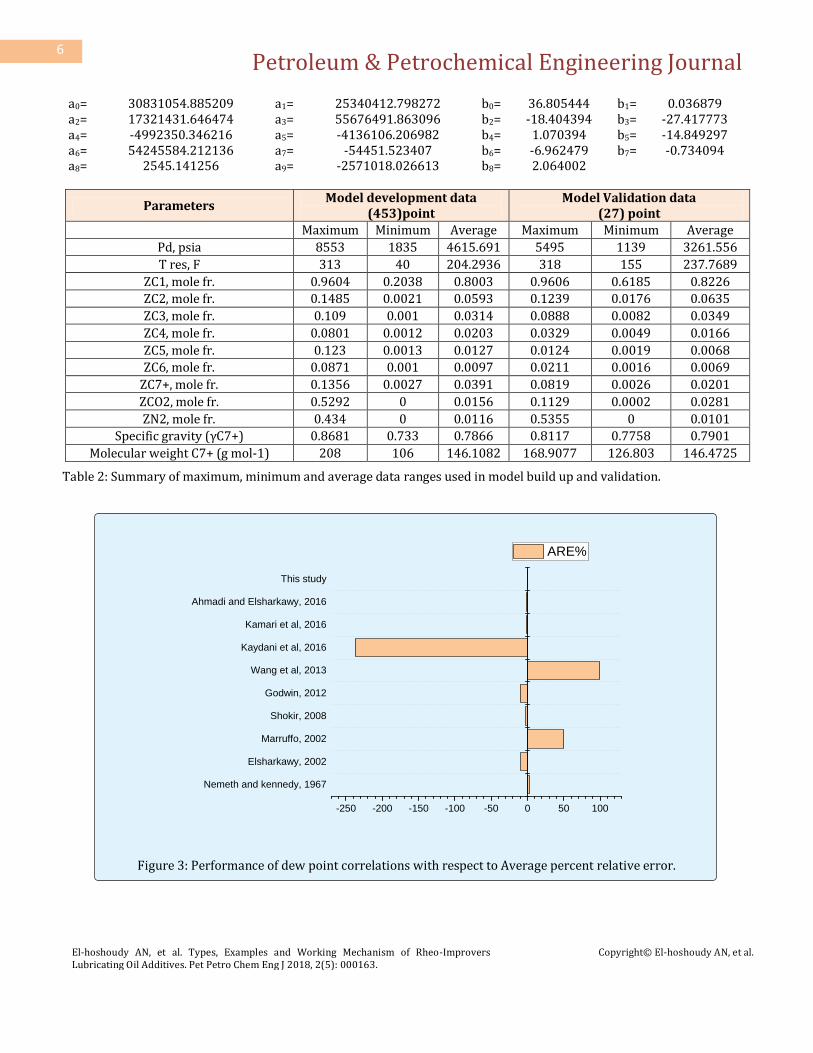
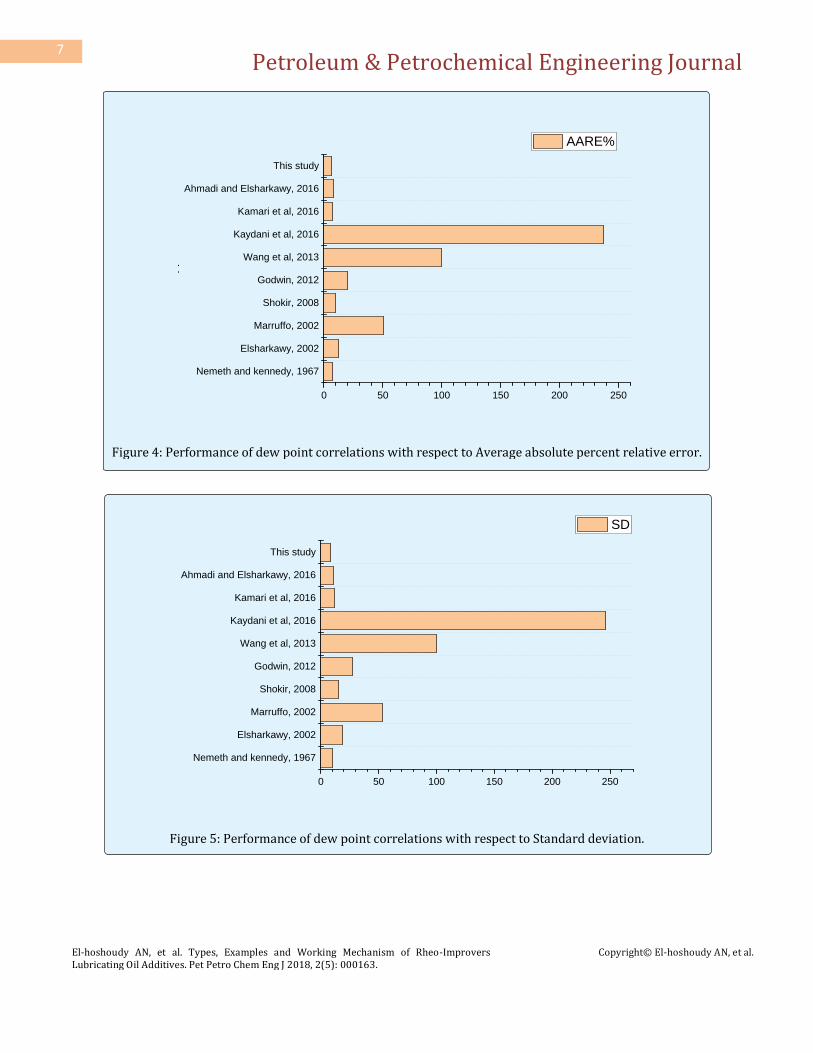
nonlinear weighted values to minimize the sum-of-squared residuals between measured and simulated quantities [58]. The data fitted by a method of successive approximations [14,59]. The linearity or nonlinearity of the data pattern checked using scatter gram plotting. Since the precision of GEP models depends on different factors, so the number of genes and depth of expression tree increased. In this model development, we apply four genes including average percent relative error (ARE%), Average absolute percent relative error (AARE%),Standard deviation (S) and coefficient of determination (R2) as a fitness functions (Figures 3-6), and a function set including (∗,+,–,ln, /) in order to develop the GEP-based model. The model correlated as a function of compositional analysis of hydrocarbon components (Zc1-Zc7+), physical properties of heptane plus fractions (C7
+) comprising molecular weight and specific gravity, the mole fraction of nonhydrocarbons (ZCO2& ZN2) and reservoir temperature. Physical properties and data range of 453 published data set used in model growth, as well as 27 datasets used in model validation, are reported in Table 2. The application range of this proposed formula to predict dewpoint pressure ranged from 1835.0 to 8553.0 psi. The optimum model for dewpoint prediction in this study is expressed as follow;
(Equation 4) 3 3dP x y
(Equation 5) 2
0 1 1 2 2 3 4 4 4 5 5 6 6 7 7
8 9
( ) ( )C C C C C C Ca a Z a Z a Z a Z a Z a Z Z a Tx
a T a
(Equation 6) 7
7
0 1 1 2 3 3 7 4 7 5 2 6 2
7 8
( ) ( ) ln( )
( )
C
C
C C C C CO Nb b Z M b Z b Z b Z b Z b Zy
b b
Petroleum & Petrochemical Engineering Journal
El-hoshoudy AN, et al. Types, Examples and Working Mechanism of Rheo-Improvers Lubricating Oil Additives. Pet Petro Chem Eng J 2018, 2(5): 000163.
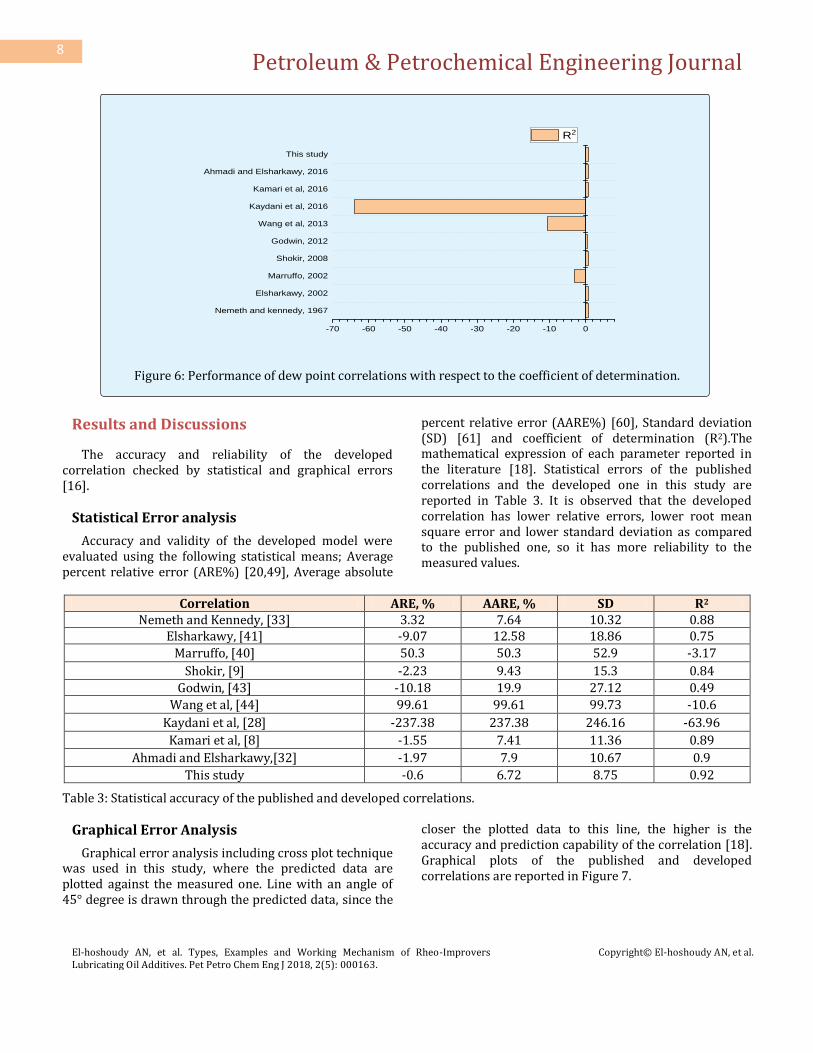
Figure 6: Performance of dew point correlations with respect to the coefficient of determination.
Results and Discussions
The accuracy and reliability of the developed correlation checked by statistical and graphical errors [16].
Statistical Error analysis
Accuracy and validity of the developed model were evaluated using the following statistical means; Average percent relative error (ARE%) [20,49], Average absolute
percent relative error (AARE%) [60], Standard deviation (SD) [61] and coefficient of determination (R2).The mathematical expression of each parameter reported in the literature [18]. Statistical errors of the published correlations and the developed one in this study are reported in Table 3. It is observed that the developed correlation has lower relative errors, lower root mean square error and lower standard deviation as compared to the published one, so it has more reliability to the measured values.
Table 3: Statistical accuracy of the published and developed correlations.
Graphical Error Analysis
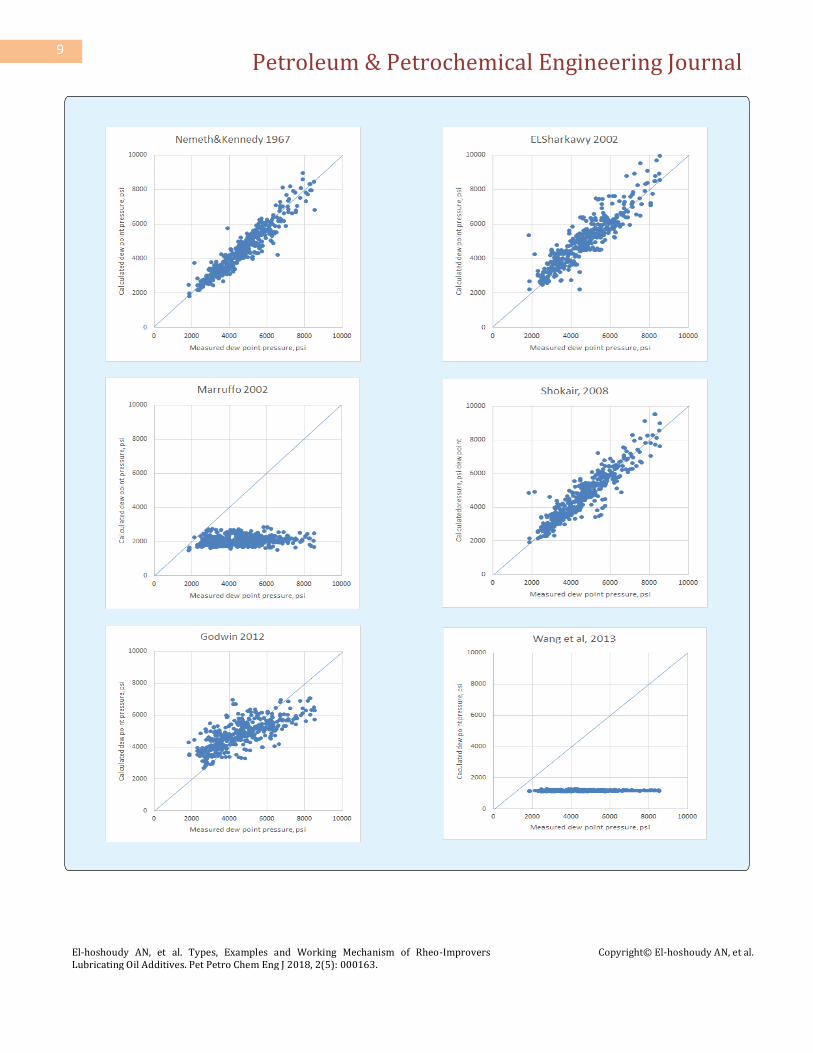
Graphical error analysis including cross plot technique was used in this study, where the predicted data are plotted against the measured one. Line with an angle of 45° degree is drawn through the predicted data, since the
closer the plotted data to this line, the higher is the accuracy and prediction capability of the correlation [18]. Graphical plots of the published and developed correlations are reported in Figure 7.
Nemeth and kennedy, 1967
Elsharkawy, 2002
Marruffo, 2002
Shokir, 2008
Godwin, 2012
Wang et al, 2013
Kaydani et al, 2016
Kamari et al, 2016
Ahmadi and Elsharkawy, 2016
This study
-70 -60 -50 -40 -30 -20 -10 0
R2
Petroleum & Petrochemical Engineering Journal
El-hoshoudy AN, et al. Types, Examples and Working Mechanism of Rheo-Improvers Lubricating Oil Additives. Pet Petro Chem Eng J 2018, 2(5): 000163.
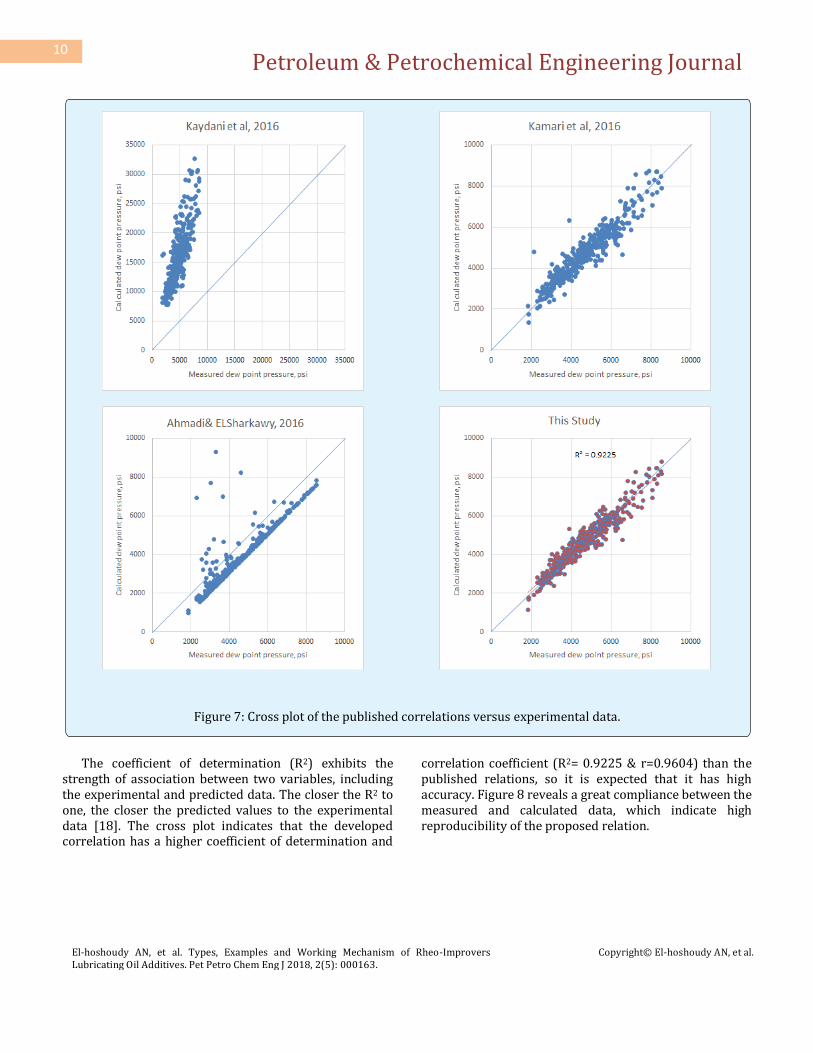
Figure 7: Cross plot of the published correlations versus experimental data.
The coefficient of determination (R2) exhibits the
strength of association between two variables, including the experimental and predicted data. The closer the R2 to one, the closer the predicted values to the experimental data [18]. The cross plot indicates that the developed correlation has a higher coefficient of determination and
correlation coefficient (R2= 0.9225 & r=0.9604) than the published relations, so it is expected that it has high accuracy. Figure 8 reveals a great compliance between the measured and calculated data, which indicate high reproducibility of the proposed relation.
Petroleum & Petrochemical Engineering Journal
El-hoshoudy AN, et al. Types, Examples and Working Mechanism of Rheo-Improvers Lubricating Oil Additives. Pet Petro Chem Eng J 2018, 2(5): 000163.
Figure 8: Comparison between experimental and calculated dew point pressure.
Validation of Correlation
Validity and applicability of thedeveloped empirical correlations carried out through graphical and statistical error analysis using 27 data sets not used in the correlation development. Figure 9 shows the cross plot of the measured and predicted data. We can observe that the
coefficient of determination reach (R2= 0.9451) which indicates a high accuracy of this correlation related to samples validation. Also, the statistical analyses show low relative error percentage, low standard deviation and high coefficient of determination. (ARE%= -1.0771, AARE%= 6.9707, and SD= 0.0888).
Figure 9: Cross-plot of new model validation.
0 100 200 300 400 500
1000
2000
3000
4000
5000
6000
7000
8000
9000P
d, p
si
no. of data points
Measured Pd, psi
Calculated Pd, psi
Petroleum & Petrochemical Engineering Journal
El-hoshoudy AN, et al. Types, Examples and Working Mechanism of Rheo-Improvers Lubricating Oil Additives. Pet Petro Chem Eng J 2018, 2(5): 000163.
A novel model with precise estimation of dewpoint pressure in retrograde gas condensate reservoirs was developed depending on 453 dataset as function of mole fraction of (ZC1-ZC
7+), physical properties of heptane plus fractions (C7
+) including molecular weight and specific gravity, mole fraction of nonhydrocarbons (ZCO2 & ZN
2) and reservoir temperature using a combination of gene expression programming (GEP) and multiple regression analysis. Experimental PVT analysis carried out to measure dewpoint pressure of the samples used in model validation in addition to compositional analysis. Comparative evaluation of the developed model and the well-known published correlations from the literature carried out using statistical and graphical error analyses. The obtained results indicate that, the developed correlation exhibit great accuracy and reproducibility with a coefficient of determination (R2= 0.9225) and lower relative errors (ARE%= -0.6, AARE%= 6.72). Model validation carried out on 27 gas condensate samples through graphical and statistical error analysis where the coefficient of determination reach (R2= 0.9451) which indicates a high reliability of the proposed correlation.
Nomenclature
Pd Dewpoint pressure, psi
GEP Gene expression programming
PVT Pressure-volume-temperature
CCE Constant composition expansion
GA Genetic Algorithm
Tc Critical temperature
Tct Cricondentherm temperature
LDO liquid drop out
CVD Constant volume depletion
GOR Gas-oil ratio
API Oil gravity
GA Genetic algorithm
γC7+ The specific gravity of heptane plus components
MC7+
The molecular weight of heptane plus components (g mol-1)
ZC1-ZC7+ The mole fraction of hydrocarbon components
from methane to heptane plus components
ZCO2 The mole fraction of CO2
ZN2 The mole fraction of N2
T Reservoir temperature, °F
ARE% Average percent relative error
AARE% Average absolute percent relative error
SD Standard deviation
r Correlation coefficient
R2 Coefficient of determination
References
1. Mohammadi H, Sedaghat MH, Manshad AK (2013) Parametric investigation of well testing analysis in low permeability gas condensate reservoirs. Journal of Natural Gas Science and Engineering 14: 17-28.
2. Mokhtari R, Varzandeh F, Rahimpour M (2013) Well productivity in an Iranian gas-condensate reservoir: A case study. Journal of Natural Gas Science and Engineering 14: 66-76.
3. Boogar AS, Masihi M (2010) New technique for calculation of well deliverability in gas condensate reservoirs. Journal of Natural Gas Science and Engineering 2(1): 29-35.
4. Ahmadi MA, Ebadi M (2014) Evolving smart approach for determination dew point pressure through condensate gas reservoirs. Fuel 117: 1074-1084.
5. Najafi Marghmaleki A, Tatar A, Barati-Harooni A, Choobineh MJ, Mohammadi AH (2016) GA-RBF model for prediction of dew point pressure in gas condensate reservoirs. Journal of Molecular Liquids 223: 979-86.
6. Rabiei A, Sayyad H, Riazi M, Hashemi A (2015) Determination of dew point pressure in gas condensate reservoirs based on a hybrid neural genetic algorithm. Fluid Phase Equilibria 387: 38-49.
7. Bhran AAE K, Hassanean MH, Helal MG (2016) Maximization of natural gas liquids production from an existing gas plant. Egyptian Journal of Petroleum 25(3): 333-341.
8. Kamari A, Sattari M, Mohammadi AH, Ramjugernath D (2016) Rapid method for the estimation of dew point pressures in gas condensate reservoirs. Journal of the Taiwan Institute of Chemical Engineers 60: 258-266.
9. Shokir EMEM (2008) Dewpoint pressure model for gas condensate reservoirs based on genetic programming. Energy & Fuels 22(5): 3194-3200.
10. Brown AS, Milton MJ, Vargha GM, Mounce R, Cowper CJ, et al. (2009) Measurement of the hydrocarbon dew point of real and synthetic natural gas mixtures by direct and indirect methods. Energy & Fuels 23(3): 1640-1650.
11. Nasrifar K, Bolland O, Moshfeghian M (2005) Predicting natural gas dew points from 15 equations of state. Energy &Fuels 19(2): 561-572.
12. Ahmed T (2010) Reservoir engineering Handbook. 4th(Edn.), Gulf Professional Publishing, Houston, pp: 1472.
13. Shi J, Huang L, Li X, Sepehrnoori K (2015) Production forecasting of gas condensate well considering fluid phase behavior in the reservoir and wellbore. Journal of Natural Gas Science and Engineering 24: 279-290.
14. Fattah K, Lashin A (2016) Improved oil formation volume factor (Bo) correlation for volatile oil reservoirs: An integrated non-linear regression and genetic programming approach. Journal of King Saud University-Engineering Sciences.
15. Hemmati M, Kharrat R (2007) Evaluation of empirically derived PVT properties for Middle East crude oils. Scientia Iranica 14(4): 358-368.
16. El-hoshoudy A, Farag A, Ali O, El-Batanoney M, Desouky S, et al. (2013) New correlations for prediction of viscosity and density of Egyptian oil reservoirs. Fuel 112: 277-282.
17. El-Hoshoudy A, Desouky SEM, Betiha M, Abdelraouf S, Elaily M (2014) Mathematical correlation predicting stock tank oil density for Egyptian crude oils at standard conditions. International Journal of Oil Gas and Coal Engineering 2(4): 55-58.
18. Fath AH (2017) Application of radial basis function neural networks in bubble point oil formation volume factor prediction for petroleum systems. Fluid Phase Equilibria 437: 14-22.
19. Elsharkawy AM, Alikhan AA (1997) Correlations for predicting solution gas/oil ratio, oil formation volume factor, and undersaturated oil compressibility. Journal of Petroleum Science and Engineering 17(3-4): 291-302.
21. Fevang Ø, Whitson C (1996) Modeling gas-condensate well deliverability. SPE Reservoir Engineering 11(4): 221-230.
22. Afidick D, Kaczorowski N, Bette S (1994) Production performance of a retrograde gas reservoir: a case study of the Arun field. SPE Asia Pacific Oil and Gas Conference, Society of Petroleum Engineers.
23. Fan L, Harris BW, Jamaluddin A, Kamath J, Mott R, et al. (2005) Understanding gas-condensate reservoirs. Oilfield Review 17(4): 14-27.
24. Barnum R, Brinkman F, Richardson T, Spillette A (1995) Gas condensate reservoir behavior: productivity and recovery reduction due to condensation. SPE Annual Technical Conference and Exhibition, Society of Petroleum Engineers, Dallas, Texas, pp: 11.
25. Eilerts K, Smith RV (1942) Specific volumes and phase-boundary properties of separator-gas and liquid-hydrocarbon mixtures. Bureau of Mines, Bartlesville, Okla, USA.
26. Majidi SMJ, Shokrollahi A, Arabloo M, Mahdikhani-Soleymanloo R, Masihi M (2014) Evolving an accurate model based on machine learning approach for prediction of dew-point pressure in gas condensate reservoirs. Chemical Engineering Research and Design 92(5): 891-902.
27. Li C, Peng Y, Dong J, Chen L (2015) Prediction of the dew point pressure for gas condensate using a modified Peng–Robinson equation of state and a four-coefficient molar distribution function. Journal of Natural Gas Science and Engineering 27(2): 967-978.
28. Kaydani H, Mohebbi A, Hajizadeh A (2016) Dewpoint pressure model for gas condensate reservoirs based on multi-gene genetic programming approach. Applied Soft Computing 47: 168-178.
29. Rostami H, Manshad AK (2014) Application of evolutionary Gaussian processes regression by particle swarm optimization for prediction of dew point pressure in gas condensate reservoirs. Neural Computing and Applications 24(3-4): 705-713.
30. Olds R, Sage B, Lacey W (1945) Volumetric and phase behavior of oil and gas from Paloma Field. Transactions of the AIME 160(1): 77-99.
31. Reamer H, Sage B (1950) Volumetric behavior of oil and gas from a Louisiana field I. Journal of Petroleum Technology 2(09): 261-268.
32. Ahmadi M A, Elsharkawy A (2017) Robust correlation to predict dew point pressure of gas condensate reservoirs. Petroleum 3(3): 340-347.
33. Nemeth L, Kennedy H (1967) A correlation of dewpoint pressure with fluid composition and temperature. Society of Petroleum Engineers Journal 7(02): 99-104.
34. Crogh A (1996) Improved correlations for retrograde gases. Texas A&M University.
35. Carlson MR, Cawston W (1996) Obtaining PVT data for very sour retrograde condensate gas and volatile oil reservoirs: a multi-disciplinary approach. SPE Gas Technology Symposium. Society of Petroleum Engineers pp: 16.
36. Potsch K, Braeuer L (1996) A novel graphical method for determining dewpoint pressures of gas condensates. European Petroleum Conference. Society of Petroleum Engineers pp: 3.
37. Fang Y, Li B, Hu Y, Sun Z, Zhu Y (1998) Condensate gas phase behavior and development. SPE International Oil and Gas Conference and Exhibition in China. Society of Petroleum Engineers pp: 20.
38. Humoud A, Al-Marhoun M (2001) A new correlation for gas-condensate dewpoint pressure prediction. SPE Middle East Oil Show. Society of Petroleum Engineers pp: 8.
39. Marruffo I, Maita J, Him J, Rojas G (2001) Statistical forecast models to determine retrograde dew pressure and C7+ percentage of gas condensates on basis of production test data of eastern Venezuelan reservoirs. Society of Petroleum Engineers pp: 6.
40. Marruffo I, Maita J, Him J, Gonzalo R (2002) Correlations To Determine Retrograde Dew Pressure and C7+ Percentage of Gas Condensate Reservoirs on Basis of Production Test Data of Eastern Venezuelan Fields. Society of Petroleum Engineers pp: 6.
41. Elsharkawy AM (2002) Predicting the dew point pressure for gas condensate reservoirs: empirical models and equations of state. Fluid phase equilibria 193(1-2): 147-165.
42. Al-Dhamen M, Al-Marhoun M (2011) New correlations for dew-point pressure for gas condensate. SPE Saudi Arabia Section Young Professionals Technical Symposium. Society of Petroleum Engineers pp: 18.
43. Godwin ON (2012) A New Analytical Method for Predicting Dew Point Pressures for Gas Condensate Reservoirs. Nigeria Annual International Conference and Exhibition. Society of Petroleum Engineers pp: 11.
44. WANG H Y, Liu H, Chang L J, Wei C, WANG H B, et al. ( 2013) Comparison and Development of Predictive Models for Dew Point Pressure of Gas Condensate Reservoir Fluids. Natural Gas Geoscience.
45. Aghamiri S, Tamtaji M, Ghafoori MJ (2017) Developing a K-value equation for predict dew point pressure of gas condensate reservoirs at high pressure. Petroleum.
46. Khodapanah E, Tabatabaei-Nejad SA (2014) A consistent method for simultaneous calculation of upper and lower dew point pressures of gas condensate fluids. Journal of Natural Gas Science and Engineering 21: 556-567.
47. Najafi-Marghmaleki A, Khosravi-Nikou MR, Barati-Harooni A (2016) A new model for prediction of binary mixture of ionic liquids+ water density using artificial neural network. Journal of Molecular Liquids 220: 232-237.
48. El Aily M, Khalil M, Desouky S, Batanoni M, Mahmoud M (2013) Experimental studies on constant mass–volume depletion of gas-condensate systems. Egyptian Journal of Petroleum 22(1): 129-136.
49. McCain WD (1990) The properties of petroleum fluids. Technology & Engineering, PennWell Books pp: 548.
50. Hosein R, Mayrhoo R, McCain WD (2014) Determination of Bubble-Point and Dew-Point Pressure Without a Visual Cell. SPE Energy Resources Conference. Society of Petroleum Engineers pp: 16.
51. ASTM D (1945) Standard Test Method for Analysis of Natural Gas by Gas Chromatography. American Society for Testing Materials.
52. Xue Y, Cheng L, Mou J, Zhao W (2014) A new fracture prediction method by combining genetic algorithm with neural network in low-permeability reservoirs. Journal of Petroleum Science and Engineering 121: 159-166.
53. Romero C, Carter J (2001) Using genetic algorithms for reservoir characterization. Journal of Petroleum Science and Engineering 31(2-4): 113-123.
54. Ferreira C (2002) Gene expression programming in problem solving. Soft computing and industry. Springer: 635-653.
55. Ferreira C (2001) Gene Expression Programming: A New Adaptive Algorithm for Solving Problems. Complex Systems 13(2): 87-129.
56. Khan MN, Bilal HM, Shoaib M, Manzoor AA, Shaukat W, et al. (2012) Fluid Characterization of a Retrograde Gas Condensate Reservoir for the Simulation Study. Society of Petroleum Engineers pp: 11.
57. AN El-hoshoudy, Desouky S (2018) Numerical Prediction of Oil Formation Volume Factor at Bubble Point for Black and Volatile Oil Reservoirs Using Non-Linear Regression Models. Petroleum and Petrochemical Engineering Journal 2(2): 1-11.
58. AN El-hoshoudy, Desouky S (2018) An Empirical Correlation for Estimation of Formation Volume Factor of Gas Condensate Reservoirs at Separator Conditions. Petroleum and Petrochemical Engineering 2(2): 1-9.
59. Dalgaard P (2008) Introductory statistics with R. Springer Science & Business Media.
60. Lohrenz J, Bray BG, Clark CR (1964) Calculating viscosities of reservoir fluids from their compositions. Journal of Petroleum Technology 16(10): 6.
61. Vazquez M, Beggs H (1980) Correlations for Fluid Physical Property Prediction. Journal of Petroleum Technology 32(6): 968-970.