19
Public Enterprises Survey 2015-2016 : Vol-II 97 PETROLEUM (REFINERY AND MARKETING)

Public Enterprises Survey 2015-2016 : Vol-II 97
PE
TR
OL
EU
M (
RE
FIN
ER
Y A
ND
MA
RK
ET
ING
)

Petroleum (Refinery and Marketing)98
6. Petroleum (Refinery & Marketing)
As on 31.03.2016, there were 8 Central Public Sector Enterprises in the Petroleum (Refinery and Marketing) group. The names of these enterprises along with their year of incorporation in chronological order are given below: -
S. No. EnterpriseYear of
Incorporation
1 INDIAN OIL CORPORATION LTD. 1964
2 CHENNAI PETROLEUM CORPORATION LTD. 1965
3 BHARAT PETROLEUM CORPN. LTD. 1976
4 HINDUSTAN PETROLEUM CORPN. LTD. 1952
5 GAIL (INDIA) LTD. 1984
6MANGALORE REFINERY & PETROCHEMICALS LTD.
1988
7 NUMALIGARH REFINERY LTD. 1993
8 GAIL GAS LTD. 2008
2. The enterprises falling in this group are mainly engaged in producing and selling of petroleum and petroleum products such as diesel, kerosene, naphtha, gas lubes, greases, chemical additives, lubricants, etc.
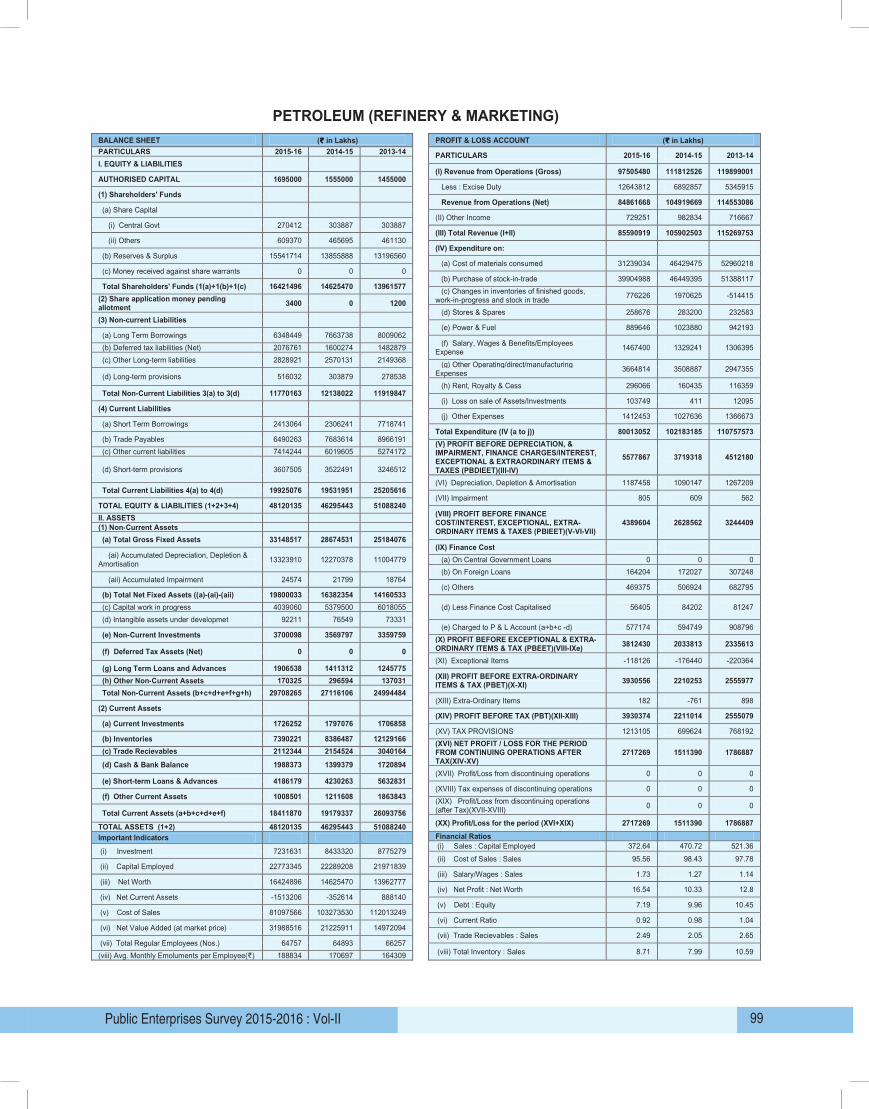
3. The consolidated financial position, the working results and the important management ratios of these enterprises are appended.
4. Turnover: The details of turnover of individual enterprises are given below:
(` in Crore)
S. No. EnterpriseTurnover
2015-16 2014-15
1 BHARAT PETROLEUM CORPN. LTD. 218011 253255
2 CHENNAI PETROLEUM CORPORATION LTD. 34967.6 47896.3
3 GAIL (INDIA) LTD. 52388.9 57464.5
4 GAIL GAS LTD. 1551.88 1024.59
5 HINDUSTAN PETROLEUM CORPN. LTD. 198034 217307
6 INDIAN OIL CORPORATION LTD. 407296 467934
7MANGALORE REFINERY & PETROCHEMICALS LTD.
50879.6 62417.1
8 NUMALIGARH REFINERY LTD. 11925.4 10827.1
SUB TOTAL : 975055 1118125
5. Net Profit / Loss: The details of enterprises, which earned net profit or sustained net loss (-) are given below:
(` in Crore)
S. No. EnterpriseNet Profit/ Loss
2015-16 2014-15
1 BHARAT PETROLEUM CORPN. LTD. 7431.88 5084.51
2 CHENNAI PETROLEUM CORPORATION LTD.
770.68 -38.99
3 GAIL (INDIA) LTD. 2298.9 3039.17
4 GAIL GAS LTD. 38.96 16.84
5 HINDUSTAN PETROLEUM CORPN. LTD. 3862.74 2733.26
6 INDIAN OIL CORPORATION LTD. 10399.03 5273.03
7 MANGALORE REFINERY & PETROCHEMICALS LTD.
1148.16 -1712.23
8 NUMALIGARH REFINERY LTD. 1222.34 718.31
SUB TOTAL : 27172.69 15113.9
6. Dividend: The details of dividend declared by the individual enterprises are given below:
(` in Crore)
S. No. EnterpriseDividend
2015-16 2014-15
1 BHARAT PETROLEUM CORPN. LTD. 2241.56 1626.94
2 CHENNAI PETROLEUM CORPORATION LTD.
94.08 0
3 GAIL (INDIA) LTD. 697.66 761.08
4 GAIL GAS LTD. 8.04 0
5 HINDUSTAN PETROLEUM CORPN. LTD. 1168.26 829.64
6 INDIAN OIL CORPORATION LTD. 3399.13 1602.45
7 NUMALIGARH REFINERY LTD. 514.94 294.25
SUB TOTAL : 8123.67 5114.36
7. Social Overhead and Township: The total number of persons employed and the expenditure incurred on social overheads and townships are given below:
S. No. Particulars
Township and Social Overheads
2015-16 2014-15
1 No. of employees (in number) 64757 64893
2 Social overheads: (` in Crore)
(i) Educational 139.24 129.59
(ii) Medical Facilities 1499.76 1051.3
(iii) Others 572.99 371.6
3 Capital cost of township (` in Crore) 2057.4 1977.03
4 No. of houses constructed (in numbers) 25332 26520
8. Company wise details in respect of Balance Sheet, Profit and Loss Account, Important Indicators and Financial Ratios along with the write up of individual company are given in the page below:
Public Enterprises Survey 2015-2016 : Vol-II 99
PETROLEUM (REFINERY & MARKETING)
BALANCE SHEET (`̀̀̀ in Lakhs) PROFIT & LOSS ACCOUNT (`̀̀̀ in Lakhs) PARTICULARS 2015-16 2014-15 2013-14 PARTICULARS 2015-16 2014-15 2013-14 I. EQUITY & LIABILITIES
(I) Revenue from Operations (Gross) 97505480 111812526 119899001 AUTHORISED CAPITAL 1695000 1555000 1455000
Less : Excise Duty 12643812 6892857 5345915 (1) Shareholders' Funds
Revenue from Operations (Net) 84861668 104919669 114553086 (a) Share Capital
(II) Other Income 729251 982834 716667 (i) Central Govt 270412 303887 303887
(III) Total Revenue (I+II) 85590919 105902503 115269753 (ii) Others 609370 465695 461130
(IV) Expenditure on: (b) Reserves & Surplus 15541714 13855888 13196560
(a) Cost of materials consumed 31239034 46429475 52960218 (c) Money received against share warrants 0 0 0
(b) Purchase of stock-in-trade 39904988 46449395 51388117 Total Shareholders' Funds (1(a)+1(b)+1(c) 16421496 14625470 13961577
(c) Changes in inventories of finished goods, work-in-progress and stock in trade 776226 1970625 -514415 (2) Share application money pending
allotment 3400 0 1200 (d) Stores & Spares 258676 283200 232583
(3) Non-current Liabilities (e) Power & Fuel 889646 1023880 942193
(a) Long Term Borrowings 6348449 7663738 8009062 (f) Salary, Wages & Benefits/Employees
Expense 1467400 1329241 1306395 (b) Deferred tax liabilities (Net) 2076761 1600274 1482879 (c) Other Long-term liabilities 2828921 2570131 2149368
(g) Other Operating/direct/manufacturing Expenses 3664814 3508887 2947355
(d) Long-term provisions 516032 303879 278538 (h) Rent, Royalty & Cess 296066 160435 116359
Total Non-Current Liabilities 3(a) to 3(d) 11770163 12138022 11919847 (i) Loss on sale of Assets/Investments 103749 411 12095
(4) Current Liabilities (j) Other Expenses 1412453 1027636 1366673
(a) Short Term Borrowings 2413064 2306241 7718741 Total Expenditure (IV (a to j)) 80013052 102183185 110757573
(b) Trade Payables 6490263 7683614 8966191 (V) PROFIT BEFORE DEPRECIATION, &
IMPAIRMENT, FINANCE CHARGES/INTEREST, EXCEPTIONAL & EXTRAORDINARY ITEMS & TAXES (PBDIEET)(III-IV)
5577867 3719318 4512180 (c) Other current liabilities 7414244 6019605 5274172 (d) Short-term provisions 3607505 3522491 3246512
(VI) Depreciation, Depletion & Amortisation 1187458 1090147 1267209 Total Current Liabilities 4(a) to 4(d) 19925076 19531951 25205616
(VII) Impairment 805 609 562 TOTAL EQUITY & LIABILITIES (1+2+3+4) 48120135 46295443 51088240
(VIII) PROFIT BEFORE FINANCE COST/INTEREST, EXCEPTIONAL, EXTRA-ORDINARY ITEMS & TAXES (PBIEET)(V-VI-VII)
4389604 2628562 3244409 II. ASSETS (1) Non-Current Assets (a) Total Gross Fixed Assets 33148517 28674531 25184076
(IX) Finance Cost (ai) Accumulated Depreciation, Depletion & Amortisation 13323910 12270378 11004779
(a) On Central Government Loans 0 0 0 (b) On Foreign Loans 164204 172027 307248
(aii) Accumulated Impairment 24574 21799 18764 (c) Others 469375 506924 682795
(b) Total Net Fixed Assets ((a)-(ai)-(aii) 19800033 16382354 14160533 (d) Less Finance Cost Capitalised 56405 84202 81247 (c) Capital work in progress 4039060 5379500 6018055
(d) Intangible assets under developmet 92211 76549 73331 (e) Charged to P & L Account (a+b+c -d) 577174 594749 908796
(e) Non-Current Investments 3700098 3569797 3359759 (X) PROFIT BEFORE EXCEPTIONAL & EXTRA-
ORDINARY ITEMS & TAX (PBEET)(VIII-IXe) 3812430 2033813 2335613 (f) Deferred Tax Assets (Net) 0 0 0
(XI) Exceptional Items -118126 -176440 -220364 (g) Long Term Loans and Advances 1906538 1411312 1245775
(XII) PROFIT BEFORE EXTRA-ORDINARY ITEMS & TAX (PBET)(X-XI) 3930556 2210253 2555977 (h) Other Non-Current Assets 170325 296594 137031
Total Non-Current Assets (b+c+d+e+f+g+h) 29708265 27116106 24994484 (XIII) Extra-Ordinary Items 182 -761 898
(2) Current Assets (XIV) PROFIT BEFORE TAX (PBT)(XII-XIII) 3930374 2211014 2555079
(a) Current Investments 1726252 1797076 1706858 (XV) TAX PROVISIONS 1213105 699624 768192
(b) Inventories 7390221 8386487 12129166 (XVI) NET PROFIT / LOSS FOR THE PERIOD
FROM CONTINUING OPERATIONS AFTER TAX(XIV-XV)
2717269 1511390 1786887 (c) Trade Recievables 2112344 2154524 3040164 (d) Cash & Bank Balance 1988373 1399379 1720894
(XVII) Profit/Loss from discontinuing operations 0 0 0 (e) Short-term Loans & Advances 4186179 4230263 5632831
(XVIII) Tax expenses of discontinuing operations 0 0 0 (f) Other Current Assets 1008501 1211608 1863843
(XIX) Profit/Loss from discontinuing operations (after Tax)(XVII-XVIII) 0 0 0
Total Current Assets (a+b+c+d+e+f) 18411870 19179337 26093756 (XX) Profit/Loss for the period (XVI+XIX) 2717269 1511390 1786887 TOTAL ASSETS (1+2) 48120135 46295443 51088240
Important Indicators Financial Ratios (i) Sales : Capital Employed 372.64 470.72 521.36 (i) Investment 7231631 8433320 8775279 (ii) Cost of Sales : Sales 95.56 98.43 97.78
(ii) Capital Employed 22773345 22289208 21971839 (iii) Salary/Wages : Sales 1.73 1.27 1.14
(iii) Net Worth 16424896 14625470 13962777 (iv) Net Profit : Net Worth 16.54 10.33 12.8
(iv) Net Current Assets -1513206 -352614 888140 (v) Debt : Equity 7.19 9.96 10.45
(v) Cost of Sales 81097566 103273530 112013249 (vi) Current Ratio 0.92 0.98 1.04
(vi) Net Value Added (at market price) 31988516 21225911 14972094 (vii) Trade Recievables : Sales 2.49 2.05 2.65
(vii) Total Regular Employees (Nos.) 64757 64893 66257 (viii) Total Inventory : Sales 8.71 7.99 10.59 (viii) Avg. Monthly Emoluments per Employee(`) 188834 170697 164309
Petroleum (Refinery and Marketing)100
Bharat Petroleum Corporation Ltd.
4&6, Currimbhoy Road Bharat Bhavan, Ballard Estate Mumbai, Maharashtra - 400001www.bharatpetroleum.in
The Company
Bharat Petroleum Corporation Ltd. (BPCL.) came into existence on 24.01.1976 subsequent to the Government of India acquiring Burmah-Shell Oil Storage & Distribution Company of India and Burmah-Shell Refineries Limited (a company incorporated on 3.11.1952) vide Burmah-Shell (Acquisition of Undertaking in India) Act 1976.
BPCL is a schedule ’A’ listed Navratna CPSE in Petroleum (Refinery & Marketing Sector) under the administrative control of Ministry of Petroleum and Natural Gas with 54.93% shareholding by the Govt. of India. The Company employed 12623 regular employees (Executives 5730 and Non-Executives 6893) as on 31.3.2016. Its registered and corporate offices are at Mumbai, Maharashtra.
Vision / Mission
Vision: BPCL is most admired global energy company leveraging talent and technology, with the first choice of customers – always, exploiting profitable growth opportunities outside energy, role model for Health, Safety, Security and Environment, a great organization to work for and a learning organization with a model corporate entity with social responsibility.
Mission:
• To participate prominently in nation-building by meeting its growing energy needs, and to support this endeavour, pursue the creation of economic surplus by efficiently deploying all available resources and aiming towards global competitiveness in the energy sector.
• Strengthen and expand areas of core competencies throughout the country, total quality management in all spheres of business and maintain the status of a leading national company.
• Create awareness among people on the imperatives of energy conservation and efficient consumption of petroleum resources, by disseminating information through appropriate media
• Availing ourselves of a new opportunity for explanation/diversification arising from the liberalization of the economy to achieve a global presence
• Promote ecology, environmental up gradation and national heritage.
Industrial / Business Operations
BPCL is an integrated oil company in the downstream sector engaged in refining of crude oil and marketing of petroleum products. It has also diversified into production and marketing of petrochemical feed stocks. BPCL’s two Refineries at Mumbai and Kochi have flexible configuration that enables them to select crude oil judiciously on economic considerations, providing a competitive edge in the liberalized scenario.
BPCL has three subsidiaries in India, namely, Bharat Petro Resources Ltd (BPRL), Bharat Petro Resource JPDA Ltd. with 100% shareholding and, Numaligarh Ltd. (NRL) with 61.65% shareholding.The company has formed 17 joint venture companies covering refining, city gas distribution, renewable energy, pipelines, gas, into-plane servicing etc. to cater to the requirement of its customers. BPCL markets its products through a robust distribution network of storage depots, terminals, LPG bottling plants, Lube blending plants, cross-country pipelines, aviation stations etc.
Performance Highlights
The physical performance of BPCL during the last three years is mentioned below:-
Main Products UnitPerformance during
2015-16 2014-15 2013-14
Crude processing MMT 24.12 23.36 23.35
Petroleum products production MMT 22.95 22.15 22.05
Market sales MMT 36.53 34.45 34.00
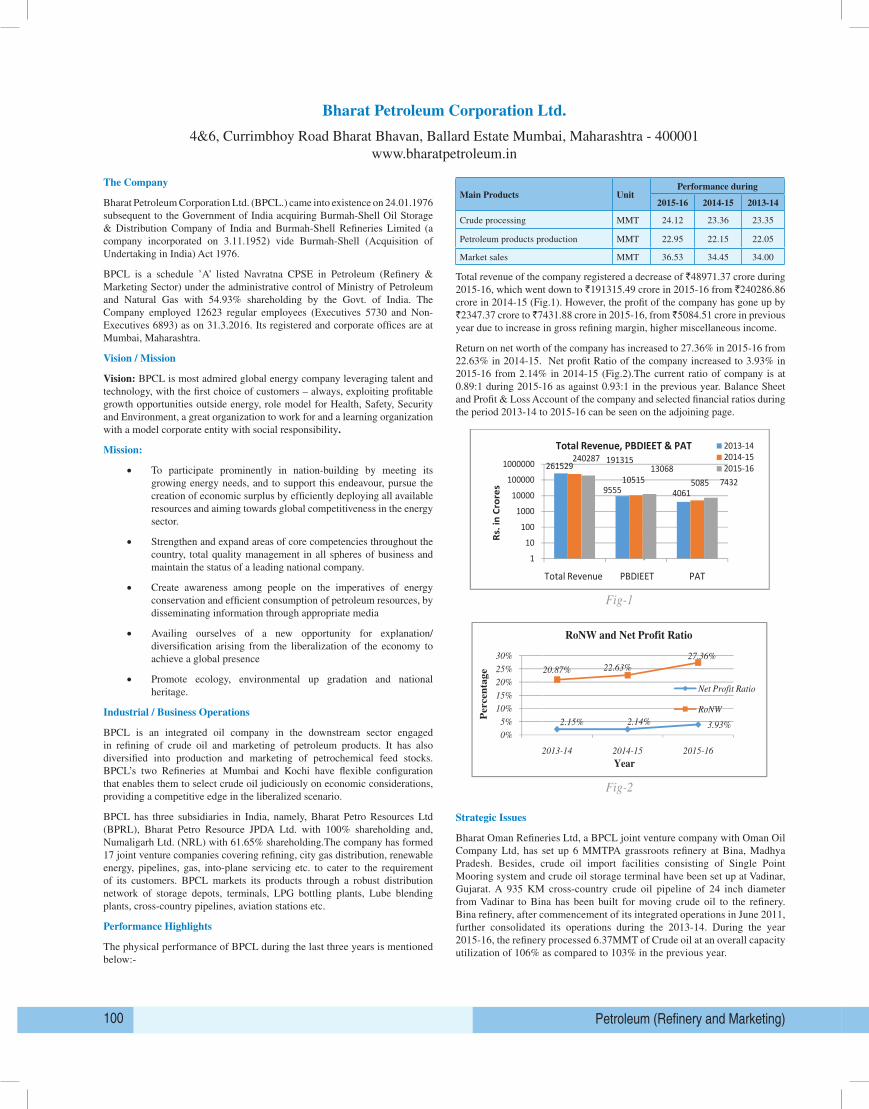
Total revenue of the company registered a decrease of `48971.37 crore during 2015-16, which went down to `191315.49 crore in 2015-16 from `240286.86 crore in 2014-15 (Fig.1). However, the profit of the company has gone up by `2347.37 crore to ̀ 7431.88 crore in 2015-16, from ̀ 5084.51 crore in previous year due to increase in gross refining margin, higher miscellaneous income.
Return on net worth of the company has increased to 27.36% in 2015-16 from 22.63% in 2014-15. Net profit Ratio of the company increased to 3.93% in 2015-16 from 2.14% in 2014-15 (Fig.2).The current ratio of company is at 0.89:1 during 2015-16 as against 0.93:1 in the previous year. Balance Sheet and Profit & Loss Account of the company and selected financial ratios during the period 2013-14 to 2015-16 can be seen on the adjoining page.
Main Products
Crude processing
Petroleum products production
Market sales
Total Revenue of the company registered a decrease of
down to 191315.49 crore in 2015
profit of the company has gone up by
crore in previous year due to increase in gross refining margin, higher miscellaneous income.
Return on net worth of the company has increased to 27.36% in 2015
Net profit Ratio of the company incr
current ratio of company is at 0.89:1 during 2015
Sheet and Profit & Loss Account of the company and selected financial ratios during the period 2013
14 to 2015-16 can be seen on the adjoining page.
Strategic Issues
Bharat Oman Refineries Ltd, a BPCL joint venture company with Oman Oil Company Ltd, has s
up 6 MMTPA grassroots refinery at Bina, Madhya Pradesh. Besides, crude oil import facilities
consisting of Single Point Mooring system and crude oil storage terminal have been set up at
Vadinar, Gujarat. A 935 KM cross
Bina has been built for moving crude oil to the refinery. Bina refinery, after commencement of its
integrated operations in June 2011, further consolidated its operations during the 2013
the year 2015-16, the refinery processed 6.37 NMT of crude oil at an overall capacity utilization of
106% as compared to 103% in the previous Year.
1
10
100
1000
10000
100000
1000000
Rs. i
n Cr
ores
0%
5%
10%
15%
20%
25%
30%
2013
Percen
tag
e
Unit Performance during
2015-16 2014-15
MMT 24.12 23.36
Petroleum products production MMT 22.95 22.15
MMT 36.53 34.45
Total Revenue of the company registered a decrease of 48971.37 crore during 2015-16, which went
191315.49 crore in 2015-16 from 240286.86 crore in 2014-15 (Fig.1). However, the
profit of the company has gone up by 2347.37 crore to 7431.88 crore in 2015-16, from
crore in previous year due to increase in gross refining margin, higher miscellaneous income.
orth of the company has increased to 27.36% in 2015-16 from 22.63% in 2014
Net profit Ratio of the company increased to 3.93% in 2015-16 from 2.14% in 2014-
current ratio of company is at 0.89:1 during 2015-16 as against 0.93:1 in the previous year.
Loss Account of the company and selected financial ratios during the period 2013
16 can be seen on the adjoining page.
Fig-1
Fig-2
Bharat Oman Refineries Ltd, a BPCL joint venture company with Oman Oil Company Ltd, has s
up 6 MMTPA grassroots refinery at Bina, Madhya Pradesh. Besides, crude oil import facilities
consisting of Single Point Mooring system and crude oil storage terminal have been set up at
Vadinar, Gujarat. A 935 KM cross-country crude oil pipeline of 24 inch diameter from Vadinar to
Bina has been built for moving crude oil to the refinery. Bina refinery, after commencement of its
integrated operations in June 2011, further consolidated its operations during the 2013
processed 6.37 NMT of crude oil at an overall capacity utilization of
106% as compared to 103% in the previous Year.
261529
9555 4061
240287
10515 5085
19131513068
7432
Total Revenue PBDIEET PAT
Total Revenue, PBDIEET & PAT 2013-142014-152015-16
2.15% 2.14% 3.93%
20.87% 22.63%
27.36%
2013-14 2014-15 2015-16
Year
RoNW and Net Profit Ratio
Net Profit Ratio
RoNW
2013-14
23.35
22.05
34.00
16, which went
15 (Fig.1). However, the
16, from 5084.51
crore in previous year due to increase in gross refining margin, higher miscellaneous income.
16 from 22.63% in 2014-15.
-15 (Fig.2).The
16 as against 0.93:1 in the previous year. Balance
Loss Account of the company and selected financial ratios during the period 2013-
Bharat Oman Refineries Ltd, a BPCL joint venture company with Oman Oil Company Ltd, has set
up 6 MMTPA grassroots refinery at Bina, Madhya Pradesh. Besides, crude oil import facilities
consisting of Single Point Mooring system and crude oil storage terminal have been set up at
nch diameter from Vadinar to
Bina has been built for moving crude oil to the refinery. Bina refinery, after commencement of its
integrated operations in June 2011, further consolidated its operations during the 2013-14.During
processed 6.37 NMT of crude oil at an overall capacity utilization of
Strategic Issues
Bharat Oman Refineries Ltd, a BPCL joint venture company with Oman Oil Company Ltd, has set up 6 MMTPA grassroots refinery at Bina, Madhya Pradesh. Besides, crude oil import facilities consisting of Single Point Mooring system and crude oil storage terminal have been set up at Vadinar, Gujarat. A 935 KM cross-country crude oil pipeline of 24 inch diameter from Vadinar to Bina has been built for moving crude oil to the refinery. Bina refinery, after commencement of its integrated operations in June 2011, further consolidated its operations during the 2013-14. During the year 2015-16, the refinery processed 6.37MMT of Crude oil at an overall capacity utilization of 106% as compared to 103% in the previous year.

Public Enterprises Survey 2015-2016 : Vol-II 101
BHARAT PETROLEUM CORPN. LTD.
BALANCE SHEET (`̀̀̀ in Lakhs) PROFIT & LOSS ACCOUNT (`̀̀̀ in Lakhs) PARTICULARS 2015-16 2014-15 2013-14 PARTICULARS 2015-16 2014-15 2013-14 I. EQUITY & LIABILITIES
(I) Revenue from Operations (Gross) 21801104 25325486 27103735 AUTHORISED CAPITAL 250000 250000 250000
Less : Excise Duty 2870771 1516796 1097682 (1) Shareholders' Funds
Revenue from Operations (Net) 18930333 23808690 26006053 (a) Share Capital
(II) Other Income 201216 219996 146866 (i) Central Govt 39720 39720 39720
(III) Total Revenue (I+II) 19131549 24028686 26152919 (ii) Others 32588 32588 32588
(IV) Expenditure on: (b) Reserves & Surplus 2643561 2174440 1873568
(a) Cost of materials consumed 6103244 9442439 10919743 (c) Money received against share warrants 0 0 0
(b) Purchase of stock-in-trade 10073200 11705171 13089787 Total Shareholders' Funds (1(a)+1(b)+1(c) 2715869 2246748 1945876
(c) Changes in inventories of finished goods, work-in-progress and stock in trade 72442 451332 -203030 (2) Share application money pending
allotment 0 0 0 (d) Stores & Spares 8176 11960 6533
(3) Non-current Liabilities (e) Power & Fuel 156232 173612 119689
(a) Long Term Borrowings 1368569 1173701 1180836 (f) Salary, Wages & Benefits/Employees Expense 287905 208560 289635 (b) Deferred tax liabilities (Net) 222890 170826 136090
(c) Other Long-term liabilities 6073 7003 6074 (g) Other Operating/direct/manufacturing Expenses 798656 769492 725523
(d) Long-term provisions 115684 110860 115731 (h) Rent, Royalty & Cess 47085 26324 26967
Total Non-Current Liabilities 3(a) to 3(d) 1713216 1462390 1438731 (i) Loss on sale of Assets/Investments 2724 0 4243
(4) Current Liabilities (j) Other Expenses 275043 188333 218341
(a) Short Term Borrowings 2396 4027 818370 Total Expenditure (IV (a to j)) 17824707 22977223 25197431
(b) Trade Payables 843079 1221641 1203874 (V) PROFIT BEFORE DEPRECIATION, &
IMPAIRMENT, FINANCE CHARGES/INTEREST, EXCEPTIONAL & EXTRAORDINARY ITEMS & TAXES (PBDIEET)(III-IV)
1306842 1051463 955488 (c) Other current liabilities 2021797 1680521 1487884 (d) Short-term provisions 302584 357561 317994
(VI) Depreciation, Depletion & Amortisation 185430 251602 224682 Total Current Liabilities 4(a) to 4(d) 3169856 3263750 3828122
(VII) Impairment 0 0 0 TOTAL EQUITY & LIABILITIES (1+2+3+4) 7598941 6972888 7212729
(VIII) PROFIT BEFORE FINANCE COST/INTEREST, EXCEPTIONAL, EXTRA-ORDINARY ITEMS & TAXES (PBIEET)(V-VI-VII)
1121412 799861 730806 II. ASSETS (1) Non-Current Assets (a) Total Gross Fixed Assets 4653064 4180963 3816378
(IX) Finance Cost (ai) Accumulated Depreciation, Depletion & Amortisation 2306285 2149457 1912427
(a) On Central Government Loans 0 0 0
(b) On Foreign Loans 56963 47112 116998 (aii) Accumulated Impairment 0 0 0
(c) Others 30386 28281 33825 (b) Total Net Fixed Assets ((a)-(ai)-(aii) 2346779 2031506 1903951
(d) Less Finance Cost Capitalised 31055 17083 14915 (c) Capital work in progress 1240275 766568 306510 (d) Intangible assets under developmet 21518 0 0
(e) Charged to P & L Account (a+b+c -d) 56294 58310 135908 (e) Non-Current Investments 787558 730205 723810
(X) PROFIT BEFORE EXCEPTIONAL & EXTRA-ORDINARY ITEMS & TAX (PBEET)(VIII-IXe) 1065118 741551 594898
(f) Deferred Tax Assets (Net) 0 0 0 (XI) Exceptional Items 0 0 0
(g) Long Term Loans and Advances 386484 407717 326666 (XII) PROFIT BEFORE EXTRA-ORDINARY ITEMS
& TAX (PBET)(X-XI) 1065118 741551 594898 (h) Other Non-Current Assets 8770 8346 16614 Total Non-Current Assets (b+c+d+e+f+g+h) 4791384 3944342 3277551
(XIII) Extra-Ordinary Items 0 0 0 (2) Current Assets
(XIV) PROFIT BEFORE TAX (PBT)(XII-XIII) 1065118 741551 594898 (a) Current Investments 509811 508909 460879
(XV) TAX PROVISIONS 321930 233100 188810 (b) Inventories 1369628 1445785 1907113
(XVI) NET PROFIT / LOSS FOR THE PERIOD FROM CONTINUING OPERATIONS AFTER TAX(XIV-XV)
743188 508451 406088 (c) Trade Recievables 216502 260767 408016 (d) Cash & Bank Balance 206735 136020 20376
(XVII) Profit/Loss from discontinuing operations 0 0 0 (e) Short-term Loans & Advances 103081 74839 64123
(XVIII) Tax expenses of discontinuing operations 0 0 0 (f) Other Current Assets 401800 602226 1074671
(XIX) Profit/Loss from discontinuing operations (after Tax)(XVII-XVIII) 0 0 0
Total Current Assets (a+b+c+d+e+f) 2807557 3028546 3935178 (XX) Profit/Loss for the period (XVI+XIX) 743188 508451 406088 TOTAL ASSETS (1+2) 7598941 6972888 7212729 Important Indicators Financial Ratios (i) Sales : Capital Employed 463.47 696.07 831.74 (i) Investment 1440877 1246009 1253144 (ii) Cost of Sales : Sales 95.12 97.56 97.74
(ii) Capital Employed 4084438 3420449 3126712 (iii) Salary/Wages : Sales 1.52 0.88 1.11
(iii) Net Worth 2715869 2246748 1945876 (iv) Net Profit : Net Worth 27.36 22.63 20.87
(iv) Net Current Assets -362299 -235204 107056 (v) Debt : Equity 18.93 16.23 16.33
(v) Cost of Sales 18007413 23228825 25417870 (vi) Current Ratio 0.89 0.93 1.03
(vi) Net Value Added (at market price) 7606920 5028434 3273628 (vii) Trade Recievables : Sales 1.14 1.1 1.57
(vii) Total Regular Employees (Nos.) 12623 12687 13214 (viii) Total Inventory : Sales 7.24 6.07 7.33 (viii) Avg. Monthly Emoluments per Employee(`) 190066 136991 182657

Petroleum (Refinery and Marketing)102
Chennai Petroleum Corporation Limited
536, Anna Salai, Teynampet Chennai Tamilnadu-600018www.cpcl.co.in
The Company
Chennai Petroleum Corporation Limited (CPCL) was incorporated on 30th December, 1965 with the objective of to be a world class energy company with a dominant presence in South India. Chennai Petroleum Corporation Limited (CPCL), formerly known as Madras Refineries Limited (MRL) was formed as a joint venture in 1965 between the Government of India (GOI), AMOCO and National Iranian Oil Company (NIOC) having a shareholding in the ratio 74%: 13%: 13% respectively. In 1985, AMOCO disinvested in favour of GOI. Later, GOI disinvested 16.92% of the paid up capital in favour of Unit Trust of India, Mutual Funds, Insurance Companies and Banks on 19th May 1992, thereby reducing its holding to 67.7%. As a part of the restructuring steps taken up by the Government of India, GOI transferred its equity to Indian Oil in 2000-01.
CPCL is a schedule-’B’ Mini-Ratna listed CPSE in Petroleum sector under the administrative control of M/o Petroleum and Natural Gas. It is a subsidiary of Indian Oil Corporation Ltd. (IOC), which holds 51.89% equity shares. The company employed 1637 regular employees (Executives -804 & Non-Executives -833) as on 31.3.2016. Its registered and corporate offices are at Chennai, Tamilnadu.
Vision / Mission
The vision of the company is to be the most admired Indian energy company through world class performance, creating value for stakeholders.
The mission of the company is to manufacture and supply petro products at competitive prices, meeting the quality expectations of the customer; to pro-actively fulfill social commitments, including environment and safety; to constantly innovate new products and alternate fuels; to recognize human resources as the most valuable asset and foster a culture of participation for mutual growth; to ensure high standards of business ethics and corporate governance; to maximize growth, achieve national pre-eminence and maximize stakeholders wealth.
Industrial / Business Operations
CPCL is engaged in refining of crude oil and manufacturing of petroleum products through its two refineries at Manali and Pannangudi near Nagapattinam, both in Tamilnadu. The product range of the company comprises of Motor Spirit, High Speed Diesel, LPG, ATF, Naphtha, Kerosene, etc. and other allied products like propylene, sulphur, wax, etc. The combined refining capacity of CPCL is 11.5 Million Tonnes Per Annum (MMTPA).
The company has two joint ventures namely Indian Additives Ltd. and National Aromatics and Petrochemicals Corp. Ltd. with an equity participation of 50% each with M/s. Chevron Oronite of USA and Southern Petrochemical Industries Corp. Ltd. (SPIC) respectively in both the above JVs.
Performance Highlights
The physical performance of the company during the last three years is given below:
Main Products / Services
Unit Performance during
2015-16 2014-15 2013-14
Crude processing ‘000 MT 9644 10782 10624
Gas processing (CBR) ‘000 MT 79.2 67.1 74.3
Total revenue of the company registered a decrease of `15871.89 crore during 2015-16, which went down to `26030.77 crore in 2015-16 from ̀ 41902.66 crore in 2014-15 due to decrease in product prices in international market and reduction in throughput in the current year as compared to the previous year (Fig.1). The profit of the company has gone up by `809.67 crore to a profit of `770.68 crore in 2015-16, from a loss of ` (-) 38.99 crore in previous year.
Return on net worth of the company is at 23.38 % in 2015-16 as against of (-)2.36% in 2014-15. Net profit ratio of the company is positive at 2.96% in 2014-15 as against of (-) 0.09% in 2014-15 (Fig.2).The current ratio of company is at 0.74:1 during 2015-16 as against 0.72:1 in the previous year. Balance Sheet and Profit & Loss Account of the company and selected financial ratios during the period 2013-14 to 2015-16 can be seen on the adjoining page.
Gas processing (CBR) ‘000 MT
Total revenue of the company registered a decrease of
down to 26030.77 crore in 2015-
prices in international market and reduction in throughput in the current year as compared to the
previous year (Fig.1). The profit of the company has gone up by
crore in 2015-16, from a loss of
Return on net worth of the company is at 23.38 % in 2015
profit ratio of the company is positive at 2.96% in 201
(Fig.2).The current ratio of company is at 0.74:1 during 2015
year. Balance Sheet and Profit & Loss Account of the company and selected financial ratios during
the period 2013-14 to 2015-16 can be seen on the adjoining page.
Strategic issues
The corporation has formulated a well
and monitoring mechanism for the risk management system. Some of the
encounters are foreign exchange market fluctuation, restrictions on oil imports from Iran.
49370
-10000
0
10000
20000
30000
40000
50000
60000
Total Revenue
Rs.
in
Cro
re
-17.64%
-0.62%
-20%
-10%
0%
10%
20%
30%
Per
cen
tag
e
‘000 MT 79.2 67.1
Total revenue of the company registered a decrease of 15871.89 crore during 2015-16, which went
-16 from 41902.66 crore in 2014-15 due to decrease in product
prices in international market and reduction in throughput in the current year as compared to the
previous year (Fig.1). The profit of the company has gone up by 809.67 crore to a profit of
(-) 38.39 crore in previous year.
Return on net worth of the company is at 23.38 % in 2015-16 as against of (-) 2.36% in 2014
profit ratio of the company is positive at 2.96% in 2014-15 as against of (-) 0.09% in 2014
The current ratio of company is at 0.74:1 during 2015-16 as against 0.97:1 in the previous
year. Balance Sheet and Profit & Loss Account of the company and selected financial ratios during
16 can be seen on the adjoining page.
Fig. 1
Fig.2
The corporation has formulated a well-defined policy framework including implementation procedure
and monitoring mechanism for the risk management system. Some of the key risk areas that company
encounters are foreign exchange market fluctuation, restrictions on oil imports from Iran.
49370
627
-304
41903
-113 -39
26031
1362 771
Total Revenue PBDIEET PAT
Total Revenue, PBDIEET & PAT
2013-14
2014-15
2015-16
17.64%
-2.36%
23.38%
0.62%-0.09%
2.96%
2013-14 2014-15 2015-16
Year
RoNW and Net Profit Ratio
RoNW
Net Profit Ratio
74.3
16, which went
15 due to decrease in product
prices in international market and reduction in throughput in the current year as compared to the
rore to a profit of 770.68
) 2.36% in 2014-15. Net
) 0.09% in 2014-15
16 as against 0.97:1 in the previous
year. Balance Sheet and Profit & Loss Account of the company and selected financial ratios during
defined policy framework including implementation procedure
key risk areas that company
encounters are foreign exchange market fluctuation, restrictions on oil imports from Iran.
Strategic issues
The corporation has formulated a well-defined policy framework including implementation procedure and monitoring mechanism for the risk management system. Some of the key risk areas that company encounters are foreign exchange market fluctuation, restrictions on oil imports from Iran.

Public Enterprises Survey 2015-2016 : Vol-II 103
CHENNAI PETROLEUM CORPORATION LTD.
BALANCE SHEET (`̀̀̀ in Lakhs) PROFIT & LOSS ACCOUNT (`̀̀̀ in Lakhs) PARTICULARS 2015-16 2014-15 2013-14 PARTICULARS 2015-16 2014-15 2013-14 I. EQUITY & LIABILITIES
(I) Revenue from Operations (Gross) 3496758 4789630 5395473 AUTHORISED CAPITAL 140000 40000 40000
Less : Excise Duty 897342 603034 461211 (1) Shareholders' Funds
Revenue from Operations (Net) 2599416 4186596 4934262 (a) Share Capital
(II) Other Income 3661 3670 2735 (i) Central Govt 0 0 0
(III) Total Revenue (I+II) 2603077 4190266 4936997 (ii) Others 114900 14900 14900
(IV) Expenditure on: (b) Reserves & Surplus 214767 150607 157344
(a) Cost of materials consumed 2275404 3925217 4707504 (c) Money received against share warrants 0 0 0
(b) Purchase of stock-in-trade 29268 28165 37378 Total Shareholders' Funds (1(a)+1(b)+1(c) 329667 165507 172244
(c) Changes in inventories of finished goods, work-in-progress and stock in trade 20857 132081 -7211
(2) Share application money pending allotment 0 0 0 (d) Stores & Spares 6190 7971 6602
(3) Non-current Liabilities (e) Power & Fuel 4738 5536 4905
(a) Long Term Borrowings 100000 100000 200000 (f) Salary, Wages & Benefits/Employees Expense 35391 33871 29186 (b) Deferred tax liabilities (Net) 0 0 70340
(c) Other Long-term liabilities 409 482 410 (g) Other Operating/direct/manufacturing Expenses 60716 39746 40361
(d) Long-term provisions 5098 4561 3699 (h) Rent, Royalty & Cess 2215 1924 2197
Total Non-Current Liabilities 3(a) to 3(d) 105507 105043 274449 (i) Loss on sale of Assets/Investments 72 201 63
(4) Current Liabilities (j) Other Expenses 31981 26808 53354
(a) Short Term Borrowings 256049 339907 345220 Total Expenditure (IV (a to j)) 2466832 4201520 4874339
(b) Trade Payables 248180 319404 521546 (V) PROFIT BEFORE DEPRECIATION, &
IMPAIRMENT, FINANCE CHARGES/INTEREST, EXCEPTIONAL & EXTRAORDINARY ITEMS & TAXES (PBDIEET)(III-IV)
136245 -11254 62658 (c) Other current liabilities 72264 156280 73084 (d) Short-term provisions 18726 9321 7683
(VI) Depreciation, Depletion & Amortisation 26566 22612 38958 Total Current Liabilities 4(a) to 4(d) 595219 824912 947533
(VII) Impairment 0 0 0 TOTAL EQUITY & LIABILITIES (1+2+3+4) 1030393 1095462 1394226
(VIII) PROFIT BEFORE FINANCE COST/INTEREST, EXCEPTIONAL, EXTRA-ORDINARY ITEMS & TAXES (PBIEET)(V-VI-VII)
109679 -33866 23700 II. ASSETS (1) Non-Current Assets (a) Total Gross Fixed Assets 849404 822468 821428
(IX) Finance Cost (ai) Accumulated Depreciation, Depletion & Amortisation 440550 414787 392241
(a) On Central Government Loans 0 0 0
(b) On Foreign Loans 0 0 0 (aii) Accumulated Impairment 0 0 0
(c) Others 39002 43196 57047 (b) Total Net Fixed Assets ((a)-(ai)-(aii) 408854 407681 429187
(d) Less Finance Cost Capitalised 8068 2823 251 (c) Capital work in progress 164250 77646 33940 (d) Intangible assets under developmet 597 597 472
(e) Charged to P & L Account (a+b+c -d) 30934 40373 56796 (e) Non-Current Investments 1423 2542 2482
(X) PROFIT BEFORE EXCEPTIONAL & EXTRA-ORDINARY ITEMS & TAX (PBEET)(VIII-IXe) 78745 -74239 -33096
(f) Deferred Tax Assets (Net) 0 0 0 (XI) Exceptional Items 0 0 0
(g) Long Term Loans and Advances 14795 12726 9333 (XII) PROFIT BEFORE EXTRA-ORDINARY ITEMS &
TAX (PBET)(X-XI) 78745 -74239 -33096 (h) Other Non-Current Assets 0 0 0 Total Non-Current Assets (b+c+d+e+f+g+h) 589919 501192 475414
(XIII) Extra-Ordinary Items 0 0 0 (2) Current Assets
(XIV) PROFIT BEFORE TAX (PBT)(XII-XIII) 78745 -74239 -33096 (a) Current Investments 0 0 0
(XV) TAX PROVISIONS 1677 -70340 -2711 (b) Inventories 320572 380508 669774
(XVI) NET PROFIT / LOSS FOR THE PERIOD FROM CONTINUING OPERATIONS AFTER TAX(XIV-XV) 77068 -3899 -30385 (c) Trade Recievables 76140 182811 222282
(d) Cash & Bank Balance 3886 3990 4602 (XVII) Profit/Loss from discontinuing operations 0 0 0
(e) Short-term Loans & Advances 39489 26846 22094 (XVIII) Tax expenses of discontinuing operations 0 0 0
(f) Other Current Assets 387 115 60 (XIX) Profit/Loss from discontinuing operations (after
Tax)(XVII-XVIII) 0 0 0 Total Current Assets (a+b+c+d+e+f) 440474 594270 918812
(XX) Profit/Loss for the period (XVI+XIX) 77068 -3899 -30385 TOTAL ASSETS (1+2) 1030393 1095462 1394226 Important Indicators Financial Ratios (i) Sales : Capital Employed 604.98 1576.83 1325.55 (i) Investment 214900 114900 214900 (ii) Cost of Sales : Sales 95.92 100.89 99.57
(ii) Capital Employed 429667 265507 372244 (iii) Salary/Wages : Sales 1.36 0.81 0.59
(iii) Net Worth 329667 165507 172244 (iv) Net Profit : Net Worth 23.38 -2.36 -17.64
(iv) Net Current Assets -154745 -230642 -28721 (v) Debt : Equity 0.87 6.71 13.42
(v) Cost of Sales 2493326 4223931 4913234 (vi) Current Ratio 0.74 0.72 0.97
(vi) Net Value Added (at market price) 1122271 674214 594615 (vii) Trade Recievables : Sales 2.93 4.37 4.5
(vii) Total Regular Employees (Nos.) 1637 1628 1688 (viii) Total Inventory : Sales 12.33 9.09 13.57 (viii) Avg. Monthly Emoluments per Employee(`) 180162 173377 144086

Petroleum (Refinery and Marketing)104
GAIL (India) Limited
16, Bhikaji Cama Place New Delhi - 110066www.gailonline.com
The Company
GAIL (India) Ltd. (GAIL) was incorporated on 16.08.1984 under the Companies Act, 1956 with an objective to undertake transportation of natural gas. GAIL is a schedule ‘A’ / listed Maharatna CPSE in Petroleum Sector under the administrative control of Ministry of Petroleum and Natural Gas with 56.11% shareholding by the Government of India. The company employed 4316 regular employees (Executives 3381 & Non-Executives 935) as on 31.3.2016. Its registered and corporate offices are at New Delhi.
Vision / Mission
The vision of the company is to be the leading company in Natural Gas and beyond, with global focus, Committed to customer care, Value creation for all stakeholders and environmental responsibility.The mission of the company is to accelerate and optimize the effective and economic use of natural gas and its fractions to the benefit of national economy.
Industrial / Business Operations
GAIL (India) Limited is engaged in Transmission and Marketing of Natural Gas, LPG Transmission, Production of Polymers, LPG, Liquid Hydrocarbons, Power Production, Exploration & Production (E&P), LNG Regasification Terminal operations, City Gas Distribution, Power and Telecom. GAIL has Natural Gas pipeline network of around 11000 km with capacity 206 MMSCMD, around 2038 km LPG Pipelines with capacity 3.8 MMTPA, 6 LPG plants of 1.3 MMTPA LPG /Liquid Hydrocarbons capacity, gas based petrochemical plant of 810KTPA polymer capacity. GAIL has stakes in 14 Oil and Gas Exploration blocks including 2 overseas blocks (Myanmar). In addition, GAIL has acquired 20% stake in shale asset in USA. GAIL has a 5 MW solar plant and 118 MW wind power plants across India. GAIL commissioned LNG regasification terminal at Dabhol (Maharashtra). For city gas distribution, GAIL has 9 JVs and a wholly owned susidiary GAIL Gas Limited. GAIL also has 13000 Km of optic fiber network for bandwidth leasing. The 7 LPG processing units include Gas Processing plants at Usar, Maharashtra (1), Gandhar, Gujarat (1), Vaghodia, Gujarat (1), Vijaipur, MP (2), and an integrated LPG (1) & Petrochemical plant (1) at Pata, U.P.
The company has 5 subsidiaries abroad namely GAIL Global (USA) Inc, GAIL Global (USA) LNG LLC, GAIL Global (Singapore) Pte Limited, GAIL GAS Limited with 100% equity shareholding and Brahmaputra Cracker and Polymer Limited (BCPL) with 70% equity share. The company has 15 JVs namely Indraprastha Gas Limited (22.50%), Mahanagar Gas Limited (32.50%), Maharashtra Natural Gas Limited (22.50%), Aavantika Gas Limited (22.50%), Bhagyanagar Gas Limited (22.50%), Central U.P. Gas Limited (25%), Green Gas Limited(22.50%), Tripura Natural Gas Company Limited (29%), Vadodara Gas Limited, ONGC Petro-additions Limited (15.5%), Petronet LNG Limited (12.5%), Ratnagiri Gas and Power Pvt. Limited (25.51%), GAIL China Gas Global Energy Holdings Limited (50%), TAPL (5%) and Rashtriya Coal Gas Fertilizer Limited (11%).
Performance Highlights
The performance detail of major products /services during the last three years is given below:
Main Products UnitsPerformance during
2015-16 2014-15 2013-14
Natural Gas Transportation MMSCMD 92.09 92.10 96.22
Natural Gas Trading MMSCMD 73.67 72.07 79.18
LHC Sales TMT 1089 1277 1307
Polymer Sales TMT 334 441 445
LPG Transported TMT 2819 3093 3145
Total revenue of the company registered a decrease of `4830.99 crore during 2015-16, which went down to `52771.85 crore in 2015-16 from `57602.84 crore in 2014-15 (Fig.1). The profit of the company has also gone down by `740.27 crore to `2298.90 crore in 2015-16, from `3039.17 crore in previous year due to fall in polymer and petrochemicals prices.
Return on net worth of the company has come down to 7.52% in 2015-16 from 10.44 % in 2014-15. Net profit ratio of the company has also decreased to 4.43% in 2015-16 from 5.36 % in 2014-15 (Fig.2). The current ratio of company is at 0.99:1 during 2015-16 as against 1.06:1 in the previous year. Balance Sheet and Profit & Loss Account of the company and selected financial ratios during the period 2013-14 to 2015-16 can be seen on the adjoining page.
LHC Sales
Polymer Sales
LPG Transported
Total revenue of the company registered a decrease of
down to 52771.85 crore in 2015
company has also gone down by
in previous year due to fall in polymer and petrochemicals prices.
Return on net worth of the company has come down to 7.52% in 2015
Net profit ratio of the company has also decreased to 4.43% in 2015
(Fig.2). The current ratio of company is at 0.99:1 during 2015
year. Balance Sheet and Profit & Loss Account of the company and selected financial ratios during the
period 2013-14 to 2015-16 can be seen on the adjoining page.
Strategic Issues
GAIL is facing a number of strategic issues such as low utilization of assets including pipelines and
gas processing plants due to declining domestic gas availability. No new trunk pipelines have been
laid in last three years by any player primarily because of declining gas avai
by PNGRB, lack of new anchor customers, etc. which are making pipelines projects unviable.
Further, due to reduced allocation of domestic gas, GAIL uses expensive imported gas as feedstock
for Petrochemicals resulting in higher c
liquid hydrocarbons) have fallen due to sharp fall in crude oil price, thereby putting severe pressure
on margins. The volatility in crude oil price has also caused a shift in LNG prices, with Lon
RLNG becoming more expensive compared to spot RLNG, because of which marketability of Long
Term RLNG has reduced.
58406
0
10000
20000
30000
40000
50000
60000
70000
Total Revenue
Rs.
in
Cro
re
16.16%
0%
5%
10%
15%
20%
Per
cen
tag
e
TMT 1089 1277
TMT 334 441
TMT 2819 3093
Total revenue of the company registered a decrease of 4830.99 crore during 2015-
52771.85 crore in 2015-16 from 57602.84 crore in 2014-15 (Fig.1). The profit of the
740.27 crore to 2298.9 crore in 2015-16, from
in previous year due to fall in polymer and petrochemicals prices.
Return on net worth of the company has come down to 7.52% in 2015-16 from 10.44 % in 2014
Net profit ratio of the company has also decreased to 4.43% in 2015-16 from 5.36 % in 2014
The current ratio of company is at 0.99:1 during 2015-16 as against 1.06:1 in the previous
year. Balance Sheet and Profit & Loss Account of the company and selected financial ratios during the
16 can be seen on the adjoining page.
Fig-1
Fig-2
of strategic issues such as low utilization of assets including pipelines and
gas processing plants due to declining domestic gas availability. No new trunk pipelines have been
laid in last three years by any player primarily because of declining gas availability, tariff reduction
by PNGRB, lack of new anchor customers, etc. which are making pipelines projects unviable.
Further, due to reduced allocation of domestic gas, GAIL uses expensive imported gas as feedstock
for Petrochemicals resulting in higher cost of production. Also product prices (polymer, LPG, other
liquid hydrocarbons) have fallen due to sharp fall in crude oil price, thereby putting severe pressure
on margins. The volatility in crude oil price has also caused a shift in LNG prices, with Lon
RLNG becoming more expensive compared to spot RLNG, because of which marketability of Long
58406
76004375
57603
55573039
52772
5126 2299
Total Revenue PBDIEET PAT
Total Revenue, PBDIEET & PAT
2013-14
2014-15
2015-16
16.16%
10.44% 7.52%
7.61%5.36%
4.43%
2013-14 2014-15 2015-16
Year
RoNW and Net Profit Ratio
RoNW Net Profit Ratio
1307
445
3145
-16, which went
15 (Fig.1). The profit of the
3039.17 crore
16 from 10.44 % in 2014-15.
16 from 5.36 % in 2014-15
s against 1.06:1 in the previous
year. Balance Sheet and Profit & Loss Account of the company and selected financial ratios during the
of strategic issues such as low utilization of assets including pipelines and
gas processing plants due to declining domestic gas availability. No new trunk pipelines have been
lability, tariff reduction
by PNGRB, lack of new anchor customers, etc. which are making pipelines projects unviable.
Further, due to reduced allocation of domestic gas, GAIL uses expensive imported gas as feedstock
ost of production. Also product prices (polymer, LPG, other
liquid hydrocarbons) have fallen due to sharp fall in crude oil price, thereby putting severe pressure
on margins. The volatility in crude oil price has also caused a shift in LNG prices, with Long-tem
RLNG becoming more expensive compared to spot RLNG, because of which marketability of Long
Strategic Issues
GAIL is facing a number of strategic issues such as low utilization of assets including pipelines and gas processing plants due to declining domestic gas availability. No new trunk pipelines have been laid in last three years by any player primarily because of declining gas availability, tariff reduction by PNGRB, lack of new anchor customers, etc. which are making pipelines projects unviable. Further, due to reduced allocation of domestic gas, GAIL uses expensive imported gas as feedstock for Petrochemicals resulting in higher cost of production. Also product prices (polymer, LPG, other liquid hydrocarbons) have fallen due to sharp fall in crude oil price, thereby putting severe pressure on margins. The volatility in crude oil price has also caused a shift in LNG prices, with Long-term RLNG becoming more expensive compared to spot RLNG, because of which marketability of Long Term RLNG has reduced.
Public Enterprises Survey 2015-2016 : Vol-II 105
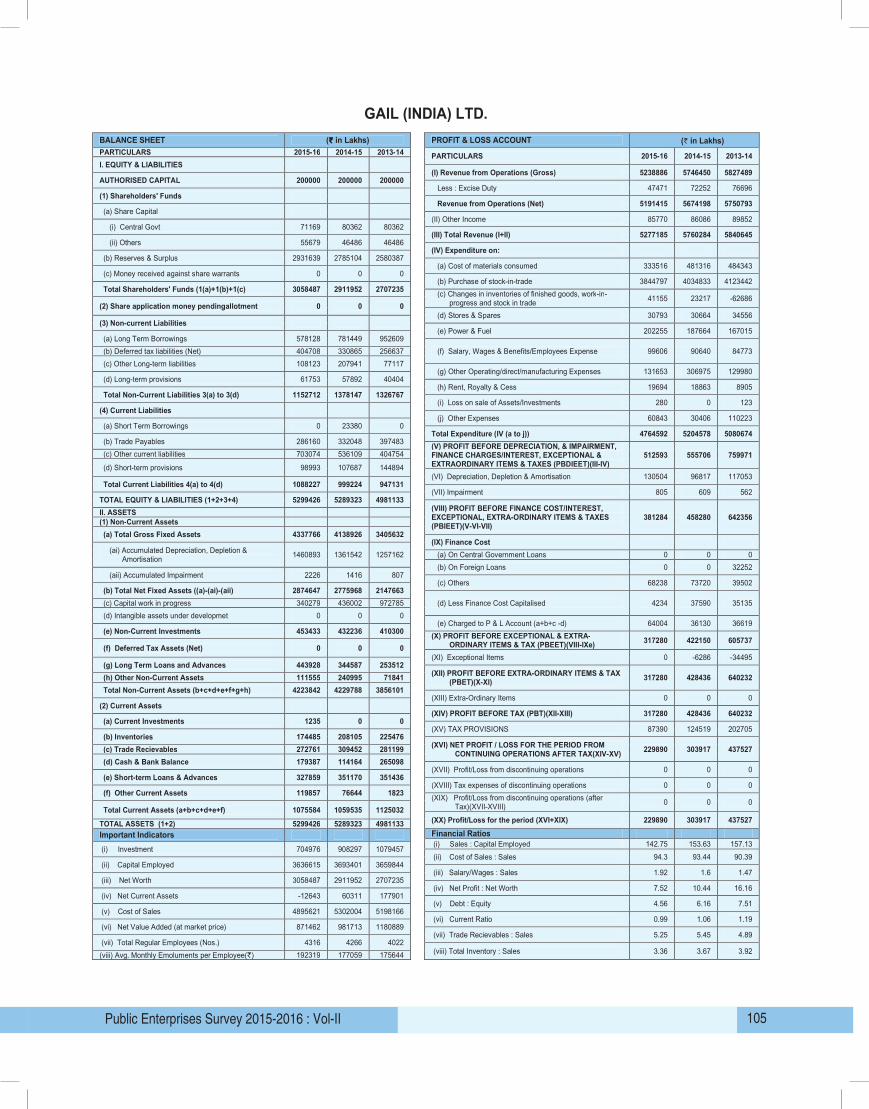
GAIL (INDIA) LTD.
BALANCE SHEET (`̀̀̀ in Lakhs) PROFIT & LOSS ACCOUNT PARTICULARS 2015-16 2014-15 2013-14 PARTICULARS 2015-16 2014-15 2013-14 I. EQUITY & LIABILITIES
(I) Revenue from Operations (Gross) 5238886 5746450 5827489 AUTHORISED CAPITAL 200000 200000 200000
Less : Excise Duty 47471 72252 76696 (1) Shareholders' Funds
Revenue from Operations (Net) 5191415 5674198 5750793 (a) Share Capital
(II) Other Income 85770 86086 89852 (i) Central Govt 71169 80362 80362
(III) Total Revenue (I+II) 5277185 5760284 5840645 (ii) Others 55679 46486 46486
(IV) Expenditure on: (b) Reserves & Surplus 2931639 2785104 2580387
(a) Cost of materials consumed 333516 481316 484343 (c) Money received against share warrants 0 0 0
(b) Purchase of stock-in-trade 3844797 4034833 4123442 Total Shareholders' Funds (1(a)+1(b)+1(c) 3058487 2911952 2707235
(c) Changes in inventories of finished goods, work-in-progress and stock in trade 41155 23217 -62686
(2) Share application money pendingallotment 0 0 0 (d) Stores & Spares 30793 30664 34556
(3) Non-current Liabilities (e) Power & Fuel 202255 187664 167015
(a) Long Term Borrowings 578128 781449 952609 (f) Salary, Wages & Benefits/Employees Expense 99606 90640 84773 (b) Deferred tax liabilities (Net) 404708 330865 256637
(c) Other Long-term liabilities 108123 207941 77117 (g) Other Operating/direct/manufacturing Expenses 131653 306975 129980
(d) Long-term provisions 61753 57892 40404 (h) Rent, Royalty & Cess 19694 18863 8905
Total Non-Current Liabilities 3(a) to 3(d) 1152712 1378147 1326767 (i) Loss on sale of Assets/Investments 280 0 123
(4) Current Liabilities (j) Other Expenses 60843 30406 110223
(a) Short Term Borrowings 0 23380 0 Total Expenditure (IV (a to j)) 4764592 5204578 5080674
(b) Trade Payables 286160 332048 397483 (V) PROFIT BEFORE DEPRECIATION, & IMPAIRMENT,
FINANCE CHARGES/INTEREST, EXCEPTIONAL & EXTRAORDINARY ITEMS & TAXES (PBDIEET)(III-IV)
512593 555706 759971 (c) Other current liabilities 703074 536109 404754 (d) Short-term provisions 98993 107687 144894
(VI) Depreciation, Depletion & Amortisation 130504 96817 117053 Total Current Liabilities 4(a) to 4(d) 1088227 999224 947131
(VII) Impairment 805 609 562 TOTAL EQUITY & LIABILITIES (1+2+3+4) 5299426 5289323 4981133
(VIII) PROFIT BEFORE FINANCE COST/INTEREST, EXCEPTIONAL, EXTRA-ORDINARY ITEMS & TAXES (PBIEET)(V-VI-VII)
381284 458280 642356 II. ASSETS (1) Non-Current Assets (a) Total Gross Fixed Assets 4337766 4138926 3405632
(IX) Finance Cost (ai) Accumulated Depreciation, Depletion &
Amortisation 1460893 1361542 1257162 (a) On Central Government Loans 0 0 0
(b) On Foreign Loans 0 0 32252 (aii) Accumulated Impairment 2226 1416 807
(c) Others 68238 73720 39502 (b) Total Net Fixed Assets ((a)-(ai)-(aii) 2874647 2775968 2147663
(d) Less Finance Cost Capitalised 4234 37590 35135 (c) Capital work in progress 340279 436002 972785 (d) Intangible assets under developmet 0 0 0
(e) Charged to P & L Account (a+b+c -d) 64004 36130 36619 (e) Non-Current Investments 453433 432236 410300
(X) PROFIT BEFORE EXCEPTIONAL & EXTRA-ORDINARY ITEMS & TAX (PBEET)(VIII-IXe) 317280 422150 605737
(f) Deferred Tax Assets (Net) 0 0 0 (XI) Exceptional Items 0 -6286 -34495
(g) Long Term Loans and Advances 443928 344587 253512 (XII) PROFIT BEFORE EXTRA-ORDINARY ITEMS & TAX
(PBET)(X-XI) 317280 428436 640232 (h) Other Non-Current Assets 111555 240995 71841 Total Non-Current Assets (b+c+d+e+f+g+h) 4223842 4229788 3856101
(XIII) Extra-Ordinary Items 0 0 0 (2) Current Assets
(XIV) PROFIT BEFORE TAX (PBT)(XII-XIII) 317280 428436 640232 (a) Current Investments 1235 0 0
(XV) TAX PROVISIONS 87390 124519 202705 (b) Inventories 174485 208105 225476
(XVI) NET PROFIT / LOSS FOR THE PERIOD FROM CONTINUING OPERATIONS AFTER TAX(XIV-XV) 229890 303917 437527 (c) Trade Recievables 272761 309452 281199
(d) Cash & Bank Balance 179387 114164 265098 (XVII) Profit/Loss from discontinuing operations 0 0 0
(e) Short-term Loans & Advances 327859 351170 351436 (XVIII) Tax expenses of discontinuing operations 0 0 0
(f) Other Current Assets 119857 76644 1823 (XIX) Profit/Loss from discontinuing operations (after
Tax)(XVII-XVIII) 0 0 0 Total Current Assets (a+b+c+d+e+f) 1075584 1059535 1125032
(XX) Profit/Loss for the period (XVI+XIX) 229890 303917 437527 TOTAL ASSETS (1+2) 5299426 5289323 4981133 Important Indicators Financial Ratios (i) Sales : Capital Employed 142.75 153.63 157.13 (i) Investment 704976 908297 1079457 (ii) Cost of Sales : Sales 94.3 93.44 90.39
(ii) Capital Employed 3636615 3693401 3659844 (iii) Salary/Wages : Sales 1.92 1.6 1.47
(iii) Net Worth 3058487 2911952 2707235 (iv) Net Profit : Net Worth 7.52 10.44 16.16
(iv) Net Current Assets -12643 60311 177901 (v) Debt : Equity 4.56 6.16 7.51
(v) Cost of Sales 4895621 5302004 5198166 (vi) Current Ratio 0.99 1.06 1.19
(vi) Net Value Added (at market price) 871462 981713 1180889 (vii) Trade Recievables : Sales 5.25 5.45 4.89
(vii) Total Regular Employees (Nos.) 4316 4266 4022 (viii) Total Inventory : Sales 3.36 3.67 3.92 (viii) Avg. Monthly Emoluments per Employee(`) 192319 177059 175644
(` in Lakhs)
Petroleum (Refinery and Marketing)106
GAIL Gas Ltd.
GAIL Bhawan, 16, Bhikaji Cama Place, R.K Puram, New Delhi 110 066www.gailgas.com
The Company
GAIL Gas Ltd. (GGL), a wholly owned subsidiary of GAIL (India) Ltd, was incorporated on 27.05.2008 with the objective of focused implementation of City Gas Distribution (CGD) projects in the country. The company started its commercial operation on 15.12.2009. The City Gas Distribution is core business of GAIL Gas which is also one of the fastest growing segment in gas sector.
GGL is an uncategorized CPSE in the Petroleum (Refinery & Marketing) sector under the administrative control of Ministry of Petroleum & Natural Gas. The company employed 150 regular employees (Executives -129 & Non-Executives- 21) as on 31.3.2016. Its registered office is at New Delhi and corporate office is at Noida, Uttar Pradesh.
Vision / Mission
The vision of the company is to be the leading company in retailing, distribution and marketing of Natural Gas with focus on city gas distribution, committed to customer care, value creation for all stakeholders and environmental responsibility.
The mission of the company is to accelerate and optimize the effective and economic use of natural gas in industries and CGD to the benefit of national economy.
Industrial / Business Operations
The company is engaged in selling of CNG, trading of Natural Gas and transportation of Natural Gas. The company is to implement City Gas Distribution (CGD) projects and to set up CNG stations along National Highway under CNG corridor project. It has been implementing CGD projects in 6 cities namely Kota, Dewas, Sonepat, Meerut, Agra & Firozabad.
The company has five joint ventures.
Performance Highlights
The physical performance of the company during the last three years is given below:
Main Product / Services
UnitPerformance during
2015-16 2014-15 2013-14
Sale of Compressed Natural Gas (CNG)
Kg 28,931,772 232,33,400 230,00,000
Sale of Piped Natural Gas (PNG)
MMBTU 29,461,039 208,79,762 204,86,111
Total revenue of the company registered an increase of `527.49 crore during 2015-16, which went up to `1553.93
crore in 2015-16 from `1026.44 crore in 2014-15 (Fig.1). The profit of the company has also gone up by `22.12 crore to `38.96 crore in 2015-16, from `16.84 crore in previous year due to increase in sales.
Return on net worth of the company has increased to 7.41% in 2015-16 from 4.67% in 2014-15. Net profit ratio of the company has also increased to 2.51% in 2015-16 from 1.64% in 2014-15 (Fig.2). The current ratio of company is at 0.95:1 during 2015-16 from 1.18:1 in the previous year. Balance Sheet and Profit & Loss Account of the company and selected financial ratios during the period 2013-14 to 2015-16 can be seen on the adjoining page.
14 to 2015-16 can be seen on the adjoining page.
Fig. 1
Fig.2
Strategic issues
1. Lack of availability of suitable land for setting up CNG stations.
2. Issues w.r.t. delay in obtaining permissions for lying of gas pipelines from various government
authorities like local governing bodies, NHAI, Forestsand Railways etc.
991
4511
1026
44 17
1554
91 39
0
500
1000
1500
2000
Total Revenue PBDIEET PAT
Rs.
in
Cro
re
Total Revenue, PBDIEET & PAT
2013-14
2014-15
2015-16
3.69%
4.67%
7.41%
1.16%1.64%
2.51%
0%
2%
4%
6%
8%
2013-14 2014-15 2015-16
Per
cen
tag
e
Year
RoNW and Net Profit Ratio
RoNW Net Profit Ratio
Strategic issues
a. Lack of availability of suitable land for setting up CNG stations.
b. Issues w.r.t. delay in obtaining permissions for lying of gas pipelines from various government authorities like local governing bodies, NHAI, Forestsand Railways etc.

Public Enterprises Survey 2015-2016 : Vol-II 107
GAIL GAS LTD.
BALANCE SHEET (`̀̀̀ in Lakhs) PROFIT & LOSS ACCOUNT (`̀̀̀ in Lakhs)
PARTICULARS 2015-16 2014-15 2013-14 PARTICULARS 2015-16 2014-15 2013-14 I. EQUITY & LIABILITIES
(I) Revenue from Operations (Gross) 155188 102459 99853 AUTHORISED CAPITAL 70000 30000 30000
Less : Excise Duty 0 0 1025 (1) Shareholders' Funds
Revenue from Operations (Net) 155188 102459 98828 (a) Share Capital
(II) Other Income 205 185 283 (i) Central Govt 0 0 0
(III) Total Revenue (I+II) 155393 102644 99111 (ii) Others 40200 30000 25435
(IV) Expenditure on: (b) Reserves & Surplus 8990 6062 4392
(a) Cost of materials consumed 139850 93026 89817 (c) Money received against share warrants 0 0 0
(b) Purchase of stock-in-trade 0 0 0 Total Shareholders' Funds (1(a)+1(b)+1(c) 49190 36062 29827
(c) Changes in inventories of finished goods, work-in-progress and stock in trade 0 0 0
(2) Share application money pending allotment 3400 0 1200 (d) Stores & Spares 126 196 0
(3) Non-current Liabilities (e) Power & Fuel 349 328 328
(a) Long Term Borrowings 12288 13111 15514 (f) Salary, Wages & Benefits/Employees Expense 2281 2292 1874 (b) Deferred tax liabilities (Net) 2560 1779 1133
(c) Other Long-term liabilities 3522 3575 3403 (g) Other Operating/direct/manufacturing Expenses 2948 1829 2099
(d) Long-term provisions 0 0 0 (h) Rent, Royalty & Cess 584 525 0
Total Non-Current Liabilities 3(a) to 3(d) 18370 18465 20050 (i) Loss on sale of Assets/Investments 0 0 0
(4) Current Liabilities (j) Other Expenses 162 -21 454
(a) Short Term Borrowings 11195 3367 0 Total Expenditure (IV (a to j)) 146300 98175 94572
(b) Trade Payables 6629 5396 2658 (V) PROFIT BEFORE DEPRECIATION, &
IMPAIRMENT, FINANCE CHARGES/INTEREST, EXCEPTIONAL & EXTRAORDINARY ITEMS & TAXES (PBDIEET)(III-IV)
9093 4469 4539 (c) Other current liabilities 9884 9587 8602 (d) Short-term provisions 2209 977 413
(VI) Depreciation, Depletion & Amortisation 1373 1223 1770 Total Current Liabilities 4(a) to 4(d) 29917 19327 11673
(VII) Impairment 0 0 0 TOTAL EQUITY & LIABILITIES (1+2+3+4) 100877 73854 62750
(VIII) PROFIT BEFORE FINANCE COST/INTEREST, EXCEPTIONAL, EXTRA-ORDINARY ITEMS & TAXES (PBIEET)(V-VI-VII)
7720 3246 2769 II. ASSETS (1) Non-Current Assets (a) Total Gross Fixed Assets 42483 37030 35784
(IX) Finance Cost (ai) Accumulated Depreciation, Depletion & Amortisation 6162 4707 3712
(a) On Central Government Loans 0 0 0
(b) On Foreign Loans 0 0 0 (aii) Accumulated Impairment 0 0 0
(c) Others 1887 1407 1060 (b) Total Net Fixed Assets ((a)-(ai)-(aii) 36321 32323 32072
(d) Less Finance Cost Capitalised 0 0 0 (c) Capital work in progress 26568 15218 15410 (d) Intangible assets under developmet 0 0 0
(e) Charged to P & L Account (a+b+c -d) 1887 1407 1060 (e) Non-Current Investments 9246 3198 1257
(X) PROFIT BEFORE EXCEPTIONAL & EXTRA-ORDINARY ITEMS & TAX (PBEET)(VIII-IXe) 5833 1839 1709
(f) Deferred Tax Assets (Net) 0 0 0 (XI) Exceptional Items 0 0 0
(g) Long Term Loans and Advances 269 282 284 (XII) PROFIT BEFORE EXTRA-ORDINARY ITEMS &
TAX (PBET)(X-XI) 5833 1839 1709 (h) Other Non-Current Assets 0 0 0 Total Non-Current Assets (b+c+d+e+f+g+h) 72404 51021 49023
(XIII) Extra-Ordinary Items -4 -649 0 (2) Current Assets
(XIV) PROFIT BEFORE TAX (PBT)(XII-XIII) 5837 2488 1709 (a) Current Investments 0 0 0
(XV) TAX PROVISIONS 1941 804 565 (b) Inventories 830 666 356
(XVI) NET PROFIT / LOSS FOR THE PERIOD FROM CONTINUING OPERATIONS AFTER TAX(XIV-XV) 3896 1684 1144 (c) Trade Recievables 6197 5803 3829
(d) Cash & Bank Balance 135 62 2746 (XVII) Profit/Loss from discontinuing operations 0 0 0
(e) Short-term Loans & Advances 21256 16270 6743 (XVIII) Tax expenses of discontinuing operations 0 0 0
(f) Other Current Assets 55 32 53 (XIX) Profit/Loss from discontinuing operations (after
Tax)(XVII-XVIII) 0 0 0 Total Current Assets (a+b+c+d+e+f) 28473 22833 13727
(XX) Profit/Loss for the period (XVI+XIX) 3896 1684 1144 TOTAL ASSETS (1+2) 100877 73854 62750 Important Indicators Financial Ratios (i) Sales : Capital Employed 239.2 208.36 212.35 (i) Investment 55888 43111 42149 (ii) Cost of Sales : Sales 95.16 97.01 97.48
(ii) Capital Employed 64878 49173 46541 (iii) Salary/Wages : Sales 1.47 2.24 1.9
(iii) Net Worth 52590 36062 31027 (iv) Net Profit : Net Worth 7.41 4.67 3.69
(iv) Net Current Assets -1444 3506 2054 (v) Debt : Equity 0.28 0.44 0.58
(v) Cost of Sales 147673 99398 96342 (vi) Current Ratio 0.95 1.18 1.18
(vi) Net Value Added (at market price) 21043 15259 14194 (vii) Trade Recievables : Sales 3.99 5.66 3.87
(vii) Total Regular Employees (Nos.) 150 118 112 (viii) Total Inventory : Sales 0.53 0.65 0.36 (viii) Avg. Monthly Emoluments per Employee(`) 126722 161864 139435

Petroleum (Refinery and Marketing)108
Hindustan Petroleum Corporation Limited
17, Jamshedji Tata Road Mumbai- 400020 Maharahashtrawww.hpcl.co.in
The Company
Hindustan Petroleum Corporation Limited (HPCL) a fortune 500 company was incorporated on 05.07.1952 under the company Act, 1913 as Standard Vacuum Refinery Co. (Stan Vac) of India Ltd. It was renamed as ESSO Standard Refining Co. of India Ltd. (ESRC) in the year 1962 under Companies Act 1956. The amalgamation of the Lube India and ESSO Standard Refinery Co. of India Ltd. vide Amalgamation Order, 1974, changed its name to Hindustan Petroleum Corporation Limited and after nationalization, ESSO Undertaking were also vested in it. In the year 1976, Caltex and in the year 1979, Kosan Co. Ltd. was also merged with HPCL.
It is a Schedule ‘A’ listed CPSE with Navratna status in Petroleum (Refinery & Marketing) sector under the administrative control of Ministry of Petroleum and Natural Gas. Government of India holds 51.11% of its shareholding. The company employed 10538 (Executives-5568 & Non-Executives-4970) employees as on 31.3.2016. The company has its registered and corporate offices at Mumbai.
Vision/Mission
The vision of the company is to be a World Class Energy Company known for caring and delighting the customers with high quality products and innovative services across domestic and international markets with aggressive growth and delivering superior financial performance. The company will be a model of excellence in meeting social commitment, environment, health and safety norms and in employee welfare and relation
The mission of the company is HPCL, along with its joint ventures, will be a fully integrated company in the hydrocarbons sector of exploration and production, refining and marketing; focusing on enhancement of productivity, quality and profitability; caring for customers and employees; caring for environment protection and cultural heritage. It will also attain scale dimensions by diversifying into other energy related fields and by taking up transnational operations.
Industrial / Business Operations
HPCL is engaged in crude oil refining and marketing of petroleum products. It has two refineries one each at Mumbai in Maharashtra and Visakhapatnam in Andhra Pradesh with a design capacity of 7.5 MMTPA & 8.3 MMTPA respectively. In addition, the company has a Lube Refinery with a capacity of 450 TMT, 106 Regional Offices, 73 Depots (including exclusive Lube Depots) and 37 Terminals/TOPs, 37 ASFs, 46 LPG Bottling Plants and 13802 Retail outlets.HPCL holds an equity stake of 16.95% in Mangalore Refinery & Petrochemicals Limited, a “a state of the art refinery” at Mangalore with a capacity of 15 MMTPA. HPCL has also constructed a 9 MMTPA refinery at Bathinda, in Punjab, with Mittal Energy Investments Pte.Ltd.as a Joint venture. HPCL owns eight multi-products cross country pipelines viz., Mumbai-Pune-Solapur Pipeline; Visakh-Vijaywada-Secunderabad Pipeline, Mundra-Delhi Pipeline, Ramandandi-Bahadurgarh Pipeline, Ramanmandi-Bathinda Pipeline, Bahadurgarh-Tikrikalan Pipeline, Awa-Salawas Pipeline and Rewari Kanpur Pipeline.
The company has 12 joint ventures and 4 subsidiaries namely CREDA HPCL Biofuel Ltd., HPCL Biofuel Ltd, Prize Petroleum Company Ltd. and HPCL Rajasthan Refinery Ltd. in the field of Exploration & Production, refining and marketing with shareholding ranging from 11% to 100%.
Performance Highlights
The physical performance of Company for the last three years is given below:
Main Product UnitPerformance during
2015-16 2014-15 2013-14
Crude Processed MMT 17.23 16.18 15.51
Sale of Products MMT 34.21 31.95 30.96
Total revenue of the company registered a decrease of `27623.09 crore during 2015-16, which went down to `180709.24 crore in 2015-16 from `208332.33 crore in 2014-15(Fig.1). However, the profit of the company has gone up by `1129.48 crore to `3862.74 crore in 2015-16, from `2733.26crore in previous year mainly due to superior refining and marketing performance.
Return on net worth of the company has increased to 21.04% in 2015-16 from 17.06% in 2014-15. Net profit ratio of the company has increased to 2.15% in 2015-16 from 1.32% in 2014-15 (Fig.2). The current ratio of company is at 1.03:1 during 2015-16 as against 1.16:1 in the previous year. Balance Sheet and Profit & Loss Account of the company and selected financial ratios during the period 2013-14 to 2015-16 can be seen on the adjoining page.
Main Product
Crude Processed
Sale of Products
Total revenue of the company registered a decrease of
down to 180709.24 crore in 2015
profit of the company has gone up by
2733.26crore in previous year mainly due to superior refining and marketing performance.
Return on net worth of the company has increased to 21.06% in 2015
Net profit ratio of the company has increased to 2.15% in 2015
The current ratio of company is at 1.03:1 during 2015
Balance Sheet and Profit & Loss Account of the company and selected financial ratios during the
period 2013-14 to 2015-16 can be seen on the adjoining page.
Strategic Issues
The strategic challenges are to increase the product self
capacity, growing market share in the changing dynamic market scenario with re
players, consolidation of new business line of natural gas and diversification to new business lines
like renewable and petrochemicals.
224333
0
50000
100000
150000
200000
250000
Total Revenue
Rs.
in
Cro
re
0.78%0%
5%
10%
15%
20%
25%
Per
cen
tage
Unit Performance during
2015-16 2014-15 2013-14
MMT 17.23 16.18 15.51
MMT 34.21 31.95 30.96
Total revenue of the company registered a decrease of 27623.09 crore during 2015-16, which went
180709.24 crore in 2015-16 from 208332.33 crore in 2014-15(Fig.1). However, the
profit of the company has gone up by 1129.48 crore to 3862.74 crore in 2015
2733.26crore in previous year mainly due to superior refining and marketing performance.
mpany has increased to 21.06% in 2015-16 from 17.06% in 2014
Net profit ratio of the company has increased to 2.15% in 2015-16 from 1.32% in 2014
current ratio of company is at 1.03:1 during 2015-16 as against 1.16:1 in the previous yea
Balance Sheet and Profit & Loss Account of the company and selected financial ratios during the
16 can be seen on the adjoining page.
Fig-1
Fig-2
The strategic challenges are to increase the product self sufficiency by expanding the refinery
capacity, growing market share in the changing dynamic market scenario with re- entry of private
players, consolidation of new business line of natural gas and diversification to new business lines
224333
6154 1734
208332
6839 2733
180709
90453863
Total Revenue PBDIEET PAT
Total Revenue, PBDIEET & PAT
2013-14
2014-15
2015-16
11.55%
17.06%
21.04%
0.78% 1.32%
2.15%
2013-14 2014-15 2015-16
Year
RoNW and Net Profit Ratio
RoNW
Net Profit
Ratio
14
15.51
30.96
16, which went
15(Fig.1). However, the
3862.74 crore in 2015-16, from
2733.26crore in previous year mainly due to superior refining and marketing performance.
16 from 17.06% in 2014-15.
16 from 1.32% in 2014-15(Fig.2).
16 as against 1.16:1 in the previous year.
Balance Sheet and Profit & Loss Account of the company and selected financial ratios during the
sufficiency by expanding the refinery
entry of private
players, consolidation of new business line of natural gas and diversification to new business lines
Strategic Issues
The strategic challenges are to increase the product self sufficiency by expanding the refinery capacity, growing market share in the changing dynamic market scenario with re- entry of private players, consolidation of new business line of natural gas and diversification to new business lines like renewable and petrochemicals.

Public Enterprises Survey 2015-2016 : Vol-II 109
HINDUSTAN PETROLEUM CORPN. LTD.
BALANCE SHEET (`̀̀̀ in Lakhs) PROFIT & LOSS ACCOUNT (`̀̀̀ in Lakhs) PARTICULARS 2015-16 2014-15 2013-14 PARTICULARS 2015-16 2014-15 2013-14 I. EQUITY & LIABILITIES
(I) Revenue from Operations (Gross) 19803440 21730692 23250321 AUTHORISED CAPITAL 35000 35000 35000
Less : Excise Duty 1846321 1068074 915168 (1) Shareholders' Funds
Revenue from Operations (Net) 17957119 20662618 22335153 (a) Share Capital
(II) Other Income 113805 170615 98171 (i) Central Govt 17308 17308 17308
(III) Total Revenue (I+II) 18070924 20833233 22433324 (ii) Others 16593 16593 16593
(IV) Expenditure on: (b) Reserves & Surplus 1801709 1568308 1467315
(a) Cost of materials consumed 4052383 5615844 6196249 (c) Money received against share warrants 0 0 0
(b) Purchase of stock-in-trade 11594843 12927836 14513795 Total Shareholders' Funds (1(a)+1(b)+1(c) 1835610 1602209 1501216
(c) Changes in inventories of finished goods, work-in-progress and stock in trade 175739 374944 -57443 (2) Share application money pending
allotment 0 0 0 (d) Stores & Spares 23064 24420 16781
(3) Non-current Liabilities (e) Power & Fuel 23012 16892 10950
(a) Long Term Borrowings 1063348 1485583 1555488 (f) Salary, Wages & Benefits/Employees Expense 231453 241466 203030 (b) Deferred tax liabilities (Net) 481046 410360 390843
(c) Other Long-term liabilities 945058 829235 720770 (g) Other Operating/direct/manufacturing Expenses 685004 634657 632944
(d) Long-term provisions 43127 58147 58766 (h) Rent, Royalty & Cess 53526 53526 20674
Total Non-Current Liabilities 3(a) to 3(d) 2532579 2783325 2725867 (i) Loss on sale of Assets/Investments 5531 0 1754
(4) Current Liabilities (j) Other Expenses 321871 259701 279209
(a) Short Term Borrowings 388854 219981 1637667 Total Expenditure (IV (a to j)) 17166426 20149286 21817943
(b) Trade Payables 658707 893565 1088643 (V) PROFIT BEFORE DEPRECIATION, &
IMPAIRMENT, FINANCE CHARGES/INTEREST, EXCEPTIONAL & EXTRAORDINARY ITEMS & TAXES (PBDIEET)(III-IV)
904498 683947 615381 (c) Other current liabilities 1458791 1016232 653225 (d) Short-term provisions 172552 239752 192699
(VI) Depreciation, Depletion & Amortisation 266677 197876 220194 Total Current Liabilities 4(a) to 4(d) 2678904 2369530 3572234
(VII) Impairment 0 0 0 TOTAL EQUITY & LIABILITIES (1+2+3+4) 7047093 6755064 7799317
(VIII) PROFIT BEFORE FINANCE COST/INTEREST, EXCEPTIONAL, EXTRA-ORDINARY ITEMS & TAXES (PBIEET)(V-VI-VII)
637821 486071 395187 II. ASSETS (1) Non-Current Assets (a) Total Gross Fixed Assets 5504858 4817492 4246676
(IX) Finance Cost (ai) Accumulated Depreciation, Depletion & Amortisation 2137933 1890828 1637495
(a) On Central Government Loans 0 0 0
(b) On Foreign Loans 50215 67702 112650 (aii) Accumulated Impairment 22348 20383 17957
(c) Others 25579 29663 51932 (b) Total Net Fixed Assets ((a)-(ai)-(aii) 3344577 2906281 2591224
(d) Less Finance Cost Capitalised 11780 26706 30946 (c) Capital work in progress 187694 347442 458556 (d) Intangible assets under developmet 0 0 0
(e) Charged to P & L Account (a+b+c -d) 64014 70659 133636 (e) Non-Current Investments 600006 586752 573583
(X) PROFIT BEFORE EXCEPTIONAL & EXTRA-ORDINARY ITEMS & TAX (PBEET)(VIII-IXe) 573807 415412 261551
(f) Deferred Tax Assets (Net) 0 0 0 (XI) Exceptional Items 0 0 0
(g) Long Term Loans and Advances 157340 142986 157555 (XII) PROFIT BEFORE EXTRA-ORDINARY ITEMS &
TAX (PBET)(X-XI) 573807 415412 261551 (h) Other Non-Current Assets 8603 11655 14626 Total Non-Current Assets (b+c+d+e+f+g+h) 4298220 3995116 3795544
(XIII) Extra-Ordinary Items 0 0 0 (2) Current Assets
(XIV) PROFIT BEFORE TAX (PBT)(XII-XIII) 573807 415412 261551 (a) Current Investments 499462 537396 512404
(XV) TAX PROVISIONS 187533 142086 88174 (b) Inventories 1270912 1297226 1876831
(XVI) NET PROFIT / LOSS FOR THE PERIOD FROM CONTINUING OPERATIONS AFTER TAX(XIV-XV) 386274 273326 173377 (c) Trade Recievables 419266 360305 546595
(d) Cash & Bank Balance 1969 1707 3471 (XVII) Profit/Loss from discontinuing operations 0 0 0
(e) Short-term Loans & Advances 529552 530652 1031595 (XVIII) Tax expenses of discontinuing operations 0 0 0
(f) Other Current Assets 27712 32662 32877 (XIX) Profit/Loss from discontinuing operations (after
Tax)(XVII-XVIII) 0 0 0 Total Current Assets (a+b+c+d+e+f) 2748873 2759948 4003773
(XX) Profit/Loss for the period (XVI+XIX) 386274 273326 173377 TOTAL ASSETS (1+2) 7047093 6755064 7799317 Important Indicators Financial Ratios (i) Sales : Capital Employed 619.43 669.17 730.69 (i) Investment 1097249 1519484 1589389 (ii) Cost of Sales : Sales 97.05 98.47 98.66
(ii) Capital Employed 2898958 3087792 3056704 (iii) Salary/Wages : Sales 1.29 1.17 0.91
(iii) Net Worth 1835610 1602209 1501216 (iv) Net Profit : Net Worth 21.04 17.06 11.55
(iv) Net Current Assets 69969 390418 431539 (v) Debt : Equity 31.37 43.82 45.88
(v) Cost of Sales 17427572 20347162 22036383 (vi) Current Ratio 1.03 1.16 1.12
(vi) Net Value Added (at market price) 5740250 4167402 2620824 (vii) Trade Recievables : Sales 2.33 1.74 2.45
(vii) Total Regular Employees (Nos.) 10538 10634 10849 (viii) Total Inventory : Sales 7.08 6.28 8.4 (viii) Avg. Monthly Emoluments per Employee(`) 183030 189225 155951
Petroleum (Refinery and Marketing)110
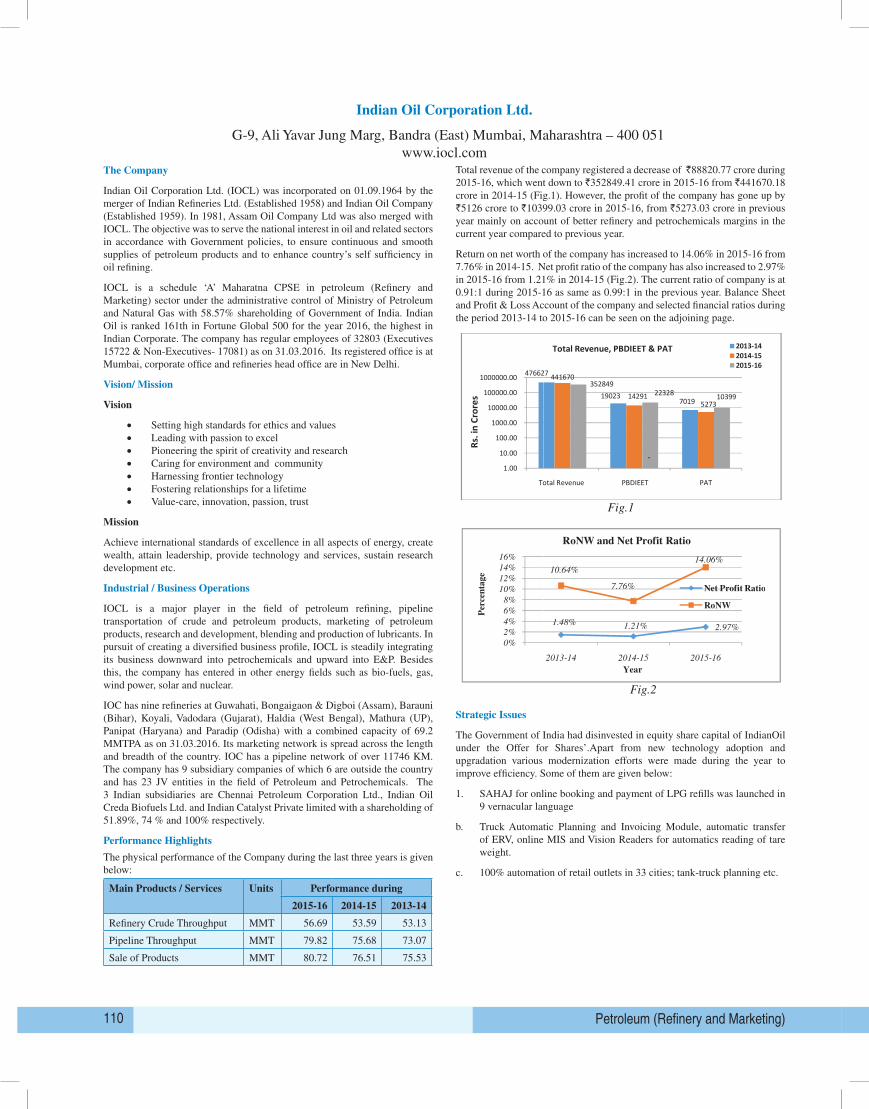
Indian Oil Corporation Ltd.
G-9, Ali Yavar Jung Marg, Bandra (East) Mumbai, Maharashtra – 400 051www.iocl.com
The Company
Indian Oil Corporation Ltd. (IOCL) was incorporated on 01.09.1964 by the merger of Indian Refineries Ltd. (Established 1958) and Indian Oil Company (Established 1959). In 1981, Assam Oil Company Ltd was also merged with IOCL. The objective was to serve the national interest in oil and related sectors in accordance with Government policies, to ensure continuous and smooth supplies of petroleum products and to enhance country’s self sufficiency in oil refining.
IOCL is a schedule ‘A’ Maharatna CPSE in petroleum (Refinery and Marketing) sector under the administrative control of Ministry of Petroleum and Natural Gas with 58.57% shareholding of Government of India. Indian Oil is ranked 161th in Fortune Global 500 for the year 2016, the highest in Indian Corporate. The company has regular employees of 32803 (Executives 15722 & Non-Executives- 17081) as on 31.03.2016. Its registered office is at Mumbai, corporate office and refineries head office are in New Delhi.
Vision/ Mission
Vision
• Setting high standards for ethics and values • Leading with passion to excel• Pioneering the spirit of creativity and research• Caring for environment and community• Harnessing frontier technology• Fostering relationships for a lifetime• Value-care, innovation, passion, trust
Mission
Achieve international standards of excellence in all aspects of energy, create wealth, attain leadership, provide technology and services, sustain research development etc.
Industrial / Business Operations
IOCL is a major player in the field of petroleum refining, pipeline transportation of crude and petroleum products, marketing of petroleum products, research and development, blending and production of lubricants. In pursuit of creating a diversified business profile, IOCL is steadily integrating its business downward into petrochemicals and upward into E&P. Besides this, the company has entered in other energy fields such as bio-fuels, gas, wind power, solar and nuclear.
IOC has nine refineries at Guwahati, Bongaigaon & Digboi (Assam), Barauni (Bihar), Koyali, Vadodara (Gujarat), Haldia (West Bengal), Mathura (UP), Panipat (Haryana) and Paradip (Odisha) with a combined capacity of 69.2 MMTPA as on 31.03.2016. Its marketing network is spread across the length and breadth of the country. IOC has a pipeline network of over 11746 KM. The company has 9 subsidiary companies of which 6 are outside the country and has 23 JV entities in the field of Petroleum and Petrochemicals. The 3 Indian subsidiaries are Chennai Petroleum Corporation Ltd., Indian Oil Creda Biofuels Ltd. and Indian Catalyst Private limited with a shareholding of 51.89%, 74 % and 100% respectively.
Performance Highlights
The physical performance of the Company during the last three years is given below:
Main Products / Services Units Performance during
2015-16 2014-15 2013-14
Refinery Crude Throughput MMT 56.69 53.59 53.13
Pipeline Throughput MMT 79.82 75.68 73.07
Sale of Products MMT 80.72 76.51 75.53
Total revenue of the company registered a decrease of `88820.77 crore during 2015-16, which went down to `352849.41 crore in 2015-16 from `441670.18 crore in 2014-15 (Fig.1). However, the profit of the company has gone up by `5126 crore to `10399.03 crore in 2015-16, from `5273.03 crore in previous year mainly on account of better refinery and petrochemicals margins in the current year compared to previous year.
Return on net worth of the company has increased to 14.06% in 2015-16 from 7.76% in 2014-15. Net profit ratio of the company has also increased to 2.97% in 2015-16 from 1.21% in 2014-15 (Fig.2). The current ratio of company is at 0.91:1 during 2015-16 as same as 0.99:1 in the previous year. Balance Sheet and Profit & Loss Account of the company and selected financial ratios during the period 2013-14 to 2015-16 can be seen on the adjoining page.
Sale of Products
Total revenue of the company registered a decrease of
went down to 352849.41 crore in 2015
the profit of the company has gone up by
5273.03 crore in previous year mainly on account of better refinery and petrochemicals margins in
the current year compared to previous year.
Return on net worth of the company has increased to 14.06% in 2015
profit ratio of the company has also increased
The current ratio of company is at 0.91:1 during 2015
Balance Sheet and Profit & Loss Account of the company and selected financial ratios during the
period 2013-14 to 2015-16 can be seen on the adjoining page.
Strategic Issues
The Government of India had disinvested in equity share capital of IndianOil under the Offer for
Shares’.Apart from new technology adoption and upgradation various
made during the year to improve efficiency. Some of them are given below:
• SAHAJ for online booking and payment of LPG refills was launched in 9 vernacular
language
• Truck Automatic Planning and Invoicing Module, automatic transfer of ERV, online MIS and
Vision Readers for automatics reading of tare weight.
• 100% automation of retail outlets in 33 cities; tank
476627
1.00
10.00
100.00
1000.00
10000.00
100000.00
1000000.00
Total Revenue Rs
. in
Cror
es
0%
2%
4%
6%
8%
10%
12%
14%
16%
Per
cen
tag
e
MMT 80.72 76.51
Total revenue of the company registered a decrease of 88820.77 crore during 2015
352849.41 crore in 2015-16 from 441670.18 crore in 2014-15 (Fig.1). However,
the profit of the company has gone up by 5126 crore to 10399.03 crore in 2015
mainly on account of better refinery and petrochemicals margins in
the current year compared to previous year.
Return on net worth of the company has increased to 14.06% in 2015-16 from 7.76% in 2014
profit ratio of the company has also increased to 2.97% in 2015-16 from 1.21% in 2014
The current ratio of company is at 0.91:1 during 2015-16 as same as 0.99:1 in the previous year.
Balance Sheet and Profit & Loss Account of the company and selected financial ratios during the
16 can be seen on the adjoining page.
Fig.1
Fig.2
f India had disinvested in equity share capital of IndianOil under the Offer for
Shares’.Apart from new technology adoption and upgradation various modernization efforts were
made during the year to improve efficiency. Some of them are given below:
SAHAJ for online booking and payment of LPG refills was launched in 9 vernacular
Truck Automatic Planning and Invoicing Module, automatic transfer of ERV, online MIS and
Vision Readers for automatics reading of tare weight.
100% automation of retail outlets in 33 cities; tank-truck planning etc.
476627
190237019
441670
142915273
35284922328 10399
Total Revenue PBDIEET PAT
Total Revenue, PBDIEET & PAT 2013-142014-152015-16
1.48% 1.21% 2.97%
10.64%
7.76%
14.06%
2013-14 2014-15 2015-16
Year
RoNW and Net Profit Ratio
Net Profit Ratio
RoNW
75.53
88820.77 crore during 2015-16, which
15 (Fig.1). However,
10399.03 crore in 2015-16, from
mainly on account of better refinery and petrochemicals margins in
16 from 7.76% in 2014-15. Net
16 from 1.21% in 2014-15 (Fig.2).
16 as same as 0.99:1 in the previous year.
Balance Sheet and Profit & Loss Account of the company and selected financial ratios during the
f India had disinvested in equity share capital of IndianOil under the Offer for
modernization efforts were
SAHAJ for online booking and payment of LPG refills was launched in 9 vernacular
Truck Automatic Planning and Invoicing Module, automatic transfer of ERV, online MIS and
Strategic Issues
The Government of India had disinvested in equity share capital of IndianOil under the Offer for Shares’.Apart from new technology adoption and upgradation various modernization efforts were made during the year to improve efficiency. Some of them are given below:
1. SAHAJ for online booking and payment of LPG refills was launched in 9 vernacular language
b. Truck Automatic Planning and Invoicing Module, automatic transfer of ERV, online MIS and Vision Readers for automatics reading of tare weight.
c. 100% automation of retail outlets in 33 cities; tank-truck planning etc.
Public Enterprises Survey 2015-2016 : Vol-II 111
INDIAN OIL CORPORATION LTD.
BALANCE SHEET (`̀̀̀ in Lakhs) PROFIT & LOSS ACCOUNT (`̀̀̀ in Lakhs) PARTICULARS 2015-16 2014-15 2013-14 PARTICULARS 2015-16 2014-15 2013-14 I. EQUITY & LIABILITIES
(I) Revenue from Operations (Gross) 40729602 46793390 49711413 AUTHORISED CAPITAL 600000 600000 600000
Less : Excise Duty 5669293 3040777 2390404 (1) Shareholders' Funds
Revenue from Operations (Net) 35060309 43752613 47321009 (a) Share Capital
(II) Other Income 224632 414405 341729 (i) Central Govt 142215 166497 166497
(III) Total Revenue (I+II) 35284941 44167018 47662738 (ii) Others 100580 76298 76298
(IV) Expenditure on: (b) Reserves & Surplus 7152078 6554202 6356413
(a) Cost of materials consumed 14226503 20504994 22701201 (c) Money received against share warrants 0 0 0
(b) Purchase of stock-in-trade 14362880 17753390 19623715 Total Shareholders' Funds (1(a)+1(b)+1(c) 7394873 6796997 6599208
(c) Changes in inventories of finished goods, work-in-progress and stock in trade 360724 821607 -115300 (2) Share application money pending
allotment 0 0 0 (d) Stores & Spares 179543 197223 165641
(3) Non-current Liabilities (e) Power & Fuel 460787 612369 621395
(a) Long Term Borrowings 2494324 3273126 3168358 (f) Salary, Wages & Benefits/Employees Expense 763709 710478 661897 (b) Deferred tax liabilities (Net) 946824 672021 561618
(c) Other Long-term liabilities 1765536 1521648 1341158 (g) Other Operating/direct/manufacturing Expenses 1930218 1706756 1378667
(d) Long-term provisions 238296 41020 39012 (h) Rent, Royalty & Cess 171964 58199 56628
Total Non-Current Liabilities 3(a) to 3(d) 5444980 5507815 5110146 (i) Loss on sale of Assets/Investments 95048 0 5751
(4) Current Liabilities (j) Other Expenses 500751 372889 660821
(a) Short Term Borrowings 1754270 1697931 4891554 Total Expenditure (IV (a to j)) 33052127 42737905 45760416
(b) Trade Payables 2241215 2919977 3569730 (V) PROFIT BEFORE DEPRECIATION, &
IMPAIRMENT, FINANCE CHARGES/INTEREST, EXCEPTIONAL & EXTRAORDINARY ITEMS & TAXES (PBDIEET)(III-IV)
2232814 1429113 1902322 (c) Other current liabilities 2887300 2331068 2431915 (d) Short-term provisions 2938080 2731159 2552912
(VI) Depreciation, Depletion & Amortisation 485279 452866 576009 Total Current Liabilities 4(a) to 4(d) 9820865 9680135 13446111
(VII) Impairment 0 0 0 TOTAL EQUITY & LIABILITIES (1+2+3+4) 22660718 21984947 25155465
(VIII) PROFIT BEFORE FINANCE COST/INTEREST, EXCEPTIONAL, EXTRA-ORDINARY ITEMS & TAXES (PBIEET)(V-VI-VII)
1747535 976247 1326313 II. ASSETS (1) Non-Current Assets (a) Total Gross Fixed Assets 15055904 12164345 11260901
(IX) Finance Cost (ai) Accumulated Depreciation, Depletion & Amortisation 5966350 5539198 4966022
(a) On Central Government Loans 0 0 0
(b) On Foreign Loans 44059 56316 44836 (aii) Accumulated Impairment 0 0 0
(c) Others 255951 287211 463606 (b) Total Net Fixed Assets ((a)-(ai)-(aii) 9089554 6625147 6294879
(d) Less Finance Cost Capitalised 0 0 0 (c) Capital work in progress 2032122 3556398 3315064 (d) Intangible assets under developmet 70096 75952 72859
(e) Charged to P & L Account (a+b+c -d) 300010 343527 508442 (e) Non-Current Investments 1696426 1662858 1631149
(X) PROFIT BEFORE EXCEPTIONAL & EXTRA-ORDINARY ITEMS & TAX (PBEET)(VIII-IXe) 1447525 632720 817871
(f) Deferred Tax Assets (Net) 0 0 0 (XI) Exceptional Items -136425 -166809 -174680
(g) Long Term Loans and Advances 830353 462034 464055 (XII) PROFIT BEFORE EXTRA-ORDINARY ITEMS
& TAX (PBET)(X-XI) 1583950 799529 992551 (h) Other Non-Current Assets 7193 9456 7002 Total Non-Current Assets (b+c+d+e+f+g+h) 13725744 12391845 11785008
(XIII) Extra-Ordinary Items 0 0 0 (2) Current Assets
(XIV) PROFIT BEFORE TAX (PBT)(XII-XIII) 1583950 799529 992551 (a) Current Investments 701105 727091 728270
(XV) TAX PROVISIONS 544047 272226 290642 (b) Inventories 3828240 4554385 6469737
(XVI) NET PROFIT / LOSS FOR THE PERIOD FROM CONTINUING OPERATIONS AFTER TAX(XIV-XV)
1039903 527303 701909 (c) Trade Recievables 802644 675817 1102292 (d) Cash & Bank Balance 51294 11190 260853
(XVII) Profit/Loss from discontinuing operations 0 0 0 (e) Short-term Loans & Advances 3115923 3145169 4070112
(XVIII) Tax expenses of discontinuing operations 0 0 0 (f) Other Current Assets 435768 479450 739193
(XIX) Profit/Loss from discontinuing operations (after Tax)(XVII-XVIII) 0 0 0
Total Current Assets (a+b+c+d+e+f) 8934974 9593102 13370457 (XX) Profit/Loss for the period (XVI+XIX) 1039903 527303 701909 TOTAL ASSETS (1+2) 22660718 21984947 25155465 Important Indicators Financial Ratios (i) Sales : Capital Employed 354.53 434.48 484.47 (i) Investment 2737119 3515921 3411153 (ii) Cost of Sales : Sales 95.39 98.72 97.91
(ii) Capital Employed 9889197 10070123 9767566 (iii) Salary/Wages : Sales 2.18 1.62 1.4
(iii) Net Worth 7394873 6796997 6599208 (iv) Net Profit : Net Worth 14.06 7.76 10.64
(iv) Net Current Assets -885891 -87033 -75654 (v) Debt : Equity 10.27 13.48 13.05
(v) Cost of Sales 33442358 43190771 46330674 (vi) Current Ratio 0.91 0.99 0.99
(vi) Net Value Added (at market price) 14774895 9677617 6633893 (vii) Trade Recievables : Sales 2.29 1.54 2.33
(vii) Total Regular Employees (Nos.) 32803 32962 33793 (viii) Total Inventory : Sales 10.92 10.41 13.67 (viii) Avg. Monthly Emoluments per Employee(`) 194014 179620 163223
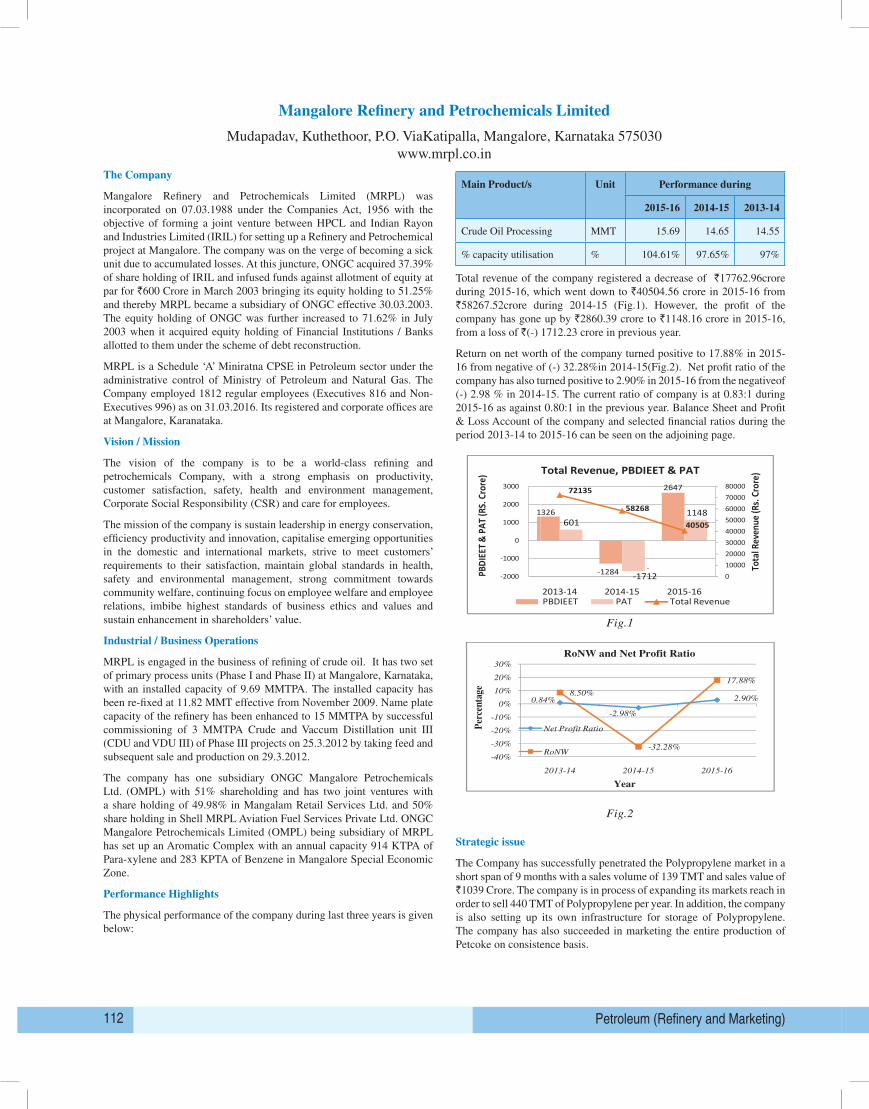
Petroleum (Refinery and Marketing)112
Mangalore Refinery and Petrochemicals Limited
Mudapadav, Kuthethoor, P.O. ViaKatipalla, Mangalore, Karnataka 575030www.mrpl.co.in
The Company
Mangalore Refinery and Petrochemicals Limited (MRPL) was incorporated on 07.03.1988 under the Companies Act, 1956 with the objective of forming a joint venture between HPCL and Indian Rayon and Industries Limited (IRIL) for setting up a Refinery and Petrochemical project at Mangalore. The company was on the verge of becoming a sick unit due to accumulated losses. At this juncture, ONGC acquired 37.39% of share holding of IRIL and infused funds against allotment of equity at par for `600 Crore in March 2003 bringing its equity holding to 51.25% and thereby MRPL became a subsidiary of ONGC effective 30.03.2003. The equity holding of ONGC was further increased to 71.62% in July 2003 when it acquired equity holding of Financial Institutions / Banks allotted to them under the scheme of debt reconstruction.
MRPL is a Schedule ‘A’ Miniratna CPSE in Petroleum sector under the administrative control of Ministry of Petroleum and Natural Gas. The Company employed 1812 regular employees (Executives 816 and Non-Executives 996) as on 31.03.2016. Its registered and corporate offices are at Mangalore, Karanataka.
Vision / Mission
The vision of the company is to be a world-class refining and petrochemicals Company, with a strong emphasis on productivity, customer satisfaction, safety, health and environment management, Corporate Social Responsibility (CSR) and care for employees.
The mission of the company is sustain leadership in energy conservation, efficiency productivity and innovation, capitalise emerging opportunities in the domestic and international markets, strive to meet customers’ requirements to their satisfaction, maintain global standards in health, safety and environmental management, strong commitment towards community welfare, continuing focus on employee welfare and employee relations, imbibe highest standards of business ethics and values and sustain enhancement in shareholders’ value.
Industrial / Business Operations
MRPL is engaged in the business of refining of crude oil. It has two set of primary process units (Phase I and Phase II) at Mangalore, Karnataka, with an installed capacity of 9.69 MMTPA. The installed capacity has been re-fixed at 11.82 MMT effective from November 2009. Name plate capacity of the refinery has been enhanced to 15 MMTPA by successful commissioning of 3 MMTPA Crude and Vaccum Distillation unit III (CDU and VDU III) of Phase III projects on 25.3.2012 by taking feed and subsequent sale and production on 29.3.2012.
The company has one subsidiary ONGC Mangalore Petrochemicals Ltd. (OMPL) with 51% shareholding and has two joint ventures with a share holding of 49.98% in Mangalam Retail Services Ltd. and 50% share holding in Shell MRPL Aviation Fuel Services Private Ltd. ONGC Mangalore Petrochemicals Limited (OMPL) being subsidiary of MRPL has set up an Aromatic Complex with an annual capacity 914 KTPA of Para-xylene and 283 KPTA of Benzene in Mangalore Special Economic Zone.
Performance Highlights
The physical performance of the company during last three years is given below:
Main Product/s Unit Performance during
2015-16 2014-15 2013-14
Crude Oil Processing MMT 15.69 14.65 14.55
% capacity utilisation % 104.61% 97.65% 97%
Total revenue of the company registered a decrease of `17762.96crore during 2015-16, which went down to `40504.56 crore in 2015-16 from `58267.52crore during 2014-15 (Fig.1). However, the profit of the company has gone up by `2860.39 crore to `1148.16 crore in 2015-16, from a loss of `(-) 1712.23 crore in previous year.
Return on net worth of the company turned positive to 17.88% in 2015-16 from negative of (-) 32.28%in 2014-15(Fig.2). Net profit ratio of the company has also turned positive to 2.90% in 2015-16 from the negativeof (-) 2.98 % in 2014-15. The current ratio of company is at 0.83:1 during 2015-16 as against 0.80:1 in the previous year. Balance Sheet and Profit & Loss Account of the company and selected financial ratios during the period 2013-14 to 2015-16 can be seen on the adjoining page.
Crude Oil Processing
% capacity utilisation
Total revenue of the company registered a decrease of
down to 40504.56 crore in 2015
profit of the company has gone up by
(-) 1712.23 crore in previous year
Return on net worth of the company turned positive to 17.88% in 2015
32.28%in 2014-15(Fig.2). Net profit ratio of the company has also turned positivet
16 from the negativeof (-) 2.98 % in 2014
16 as against 0.80:1 in the previous year. Balance Sheet and Profit & Loss Account of the company
and selected financial ratios during the pe
Strategic issue
The Company has successfully penetrated the Polypropylene market in a short span of 9 months with
a sales volume of 139 TMT and sales value of
its markets reach in order to sell 440 TMT of Polypropylene per year. In addition, the company is
also setting up its own infrastructure for storage of Polypropylene. The company has also succeeded
in marketing the entire production of Petcoke on consistence basis.
1326
-2000
-1000
0
1000
2000
3000PB
DIEE
T & P
AT (R
S. C
rore
)
0.84%
-40%
-30%
-20%
-10%
0%
10%
20%
30%
Per
cen
tag
e
2015-16 2014-15 2013
MMT 15.69 14.65 14.55
104.61% 97.65%
Total revenue of the company registered a decrease of 17762.96crore during 2015-16, which went
40504.56 crore in 2015-16 from 58267.52crore during 2014-15 (Fig.1). However
profit of the company has gone up by 2860.39 crore to 1148.16 crore in 2015-16, from a loss of
) 1712.23 crore in previous year.
Return on net worth of the company turned positive to 17.88% in 2015-16 from negative of (
15(Fig.2). Net profit ratio of the company has also turned positiveto 2.90% in 2015
) 2.98 % in 2014-15.The current ratio of company is at 0.82:1 during 2015
16 as against 0.80:1 in the previous year. Balance Sheet and Profit & Loss Account of the company
and selected financial ratios during the period 2013-14 to 2015-16 can be seen on the adjoining page.
Fig.1
Fig.2
The Company has successfully penetrated the Polypropylene market in a short span of 9 months with
a sales volume of 139 TMT and sales value of 1039 crores. The company is in process of expanding
its markets reach in order to sell 440 TMT of Polypropylene per year. In addition, the company is
also setting up its own infrastructure for storage of Polypropylene. The company has also succeeded
keting the entire production of Petcoke on consistence basis.
1326
-1284
2647
601
-1712
1148
72135
58268
40505
01000020000300004000050000600007000080000
2013-14 2014-15 2015-16
Tota
l Rev
enue
(Rs.
Cror
e)Total Revenue, PBDIEET & PAT
PBDIEET PAT Total Revenue
0.84%
-2.98%
2.90%8.50%
-32.28%
17.88%
2013-14 2014-15 2015-16
Year
RoNW and Net Profit Ratio
Net Profit Ratio
RoNW
2013-14
14.55
97%
16, which went
15 (Fig.1). However, the
16, from a loss of
16 from negative of (-)
o 2.90% in 2015-
The current ratio of company is at 0.82:1 during 2015-
16 as against 0.80:1 in the previous year. Balance Sheet and Profit & Loss Account of the company
16 can be seen on the adjoining page.
The Company has successfully penetrated the Polypropylene market in a short span of 9 months with
1039 crores. The company is in process of expanding
its markets reach in order to sell 440 TMT of Polypropylene per year. In addition, the company is
also setting up its own infrastructure for storage of Polypropylene. The company has also succeeded
Strategic issue
The Company has successfully penetrated the Polypropylene market in a short span of 9 months with a sales volume of 139 TMT and sales value of `1039 Crore. The company is in process of expanding its markets reach in order to sell 440 TMT of Polypropylene per year. In addition, the company is also setting up its own infrastructure for storage of Polypropylene. The company has also succeeded in marketing the entire production of Petcoke on consistence basis.

Public Enterprises Survey 2015-2016 : Vol-II 113
MANGALORE REFINERY & PETROCHEMICALS LTD.
BALANCE SHEET (`̀̀̀ in Lakhs) PROFIT & LOSS ACCOUNT (`̀̀̀ in Lakhs) PARTICULARS 2015-16 2014-15 2013-14 PARTICULARS 2015-16 2014-15 2013-14 I. EQUITY & LIABILITIES
(I) Revenue from Operations (Gross) 5087958 6241714 7523041 AUTHORISED CAPITAL 300000 300000 200000
Less : Excise Duty 1123214 495461 341562 (1) Shareholders' Funds
Revenue from Operations (Net) 3964744 5746253 7181479 (a) Share Capital
(II) Other Income 85712 80499 32017 (i) Central Govt 0 0 0
(III) Total Revenue (I+II) 4050456 5826752 7213496 (ii) Others 175267 175267 175267
(IV) Expenditure on: (b) Reserves & Surplus 466778 355230 531621
(a) Cost of materials consumed 3455161 5596151 7085252 (c) Money received against share warrants 0 0 0
(b) Purchase of stock-in-trade 0 0 0 Total Shareholders' Funds (1(a)+1(b)+1(c) 642045 530497 706888
(c) Changes in inventories of finished goods, work-in-progress and stock in trade 68317 188613 -67407 (2) Share application money pending
allotment 0 0 0 (d) Stores & Spares 8516 8100 -149
(3) Non-current Liabilities (e) Power & Fuel 21066 7070 3248
(a) Long Term Borrowings 682042 786465 885357 (f) Salary, Wages & Benefits/Employees Expense 28503 24074 21547 (b) Deferred tax liabilities (Net) 8063 0 47027
(c) Other Long-term liabilities 0 1 190 (g) Other Operating/direct/manufacturing Expenses 26353 18770 12001
(d) Long-term provisions 4037 3463 4670 (h) Rent, Royalty & Cess 734 725 660
Total Non-Current Liabilities 3(a) to 3(d) 694142 789929 937244 (i) Loss on sale of Assets/Investments 39 41 161
(4) Current Liabilities (j) Other Expenses 177094 111571 25617
(a) Short Term Borrowings 256 1087 0 Total Expenditure (IV (a to j)) 3785783 5955115 7080930
(b) Trade Payables 2133887 1833695 2103117 (V) PROFIT BEFORE DEPRECIATION, &
IMPAIRMENT, FINANCE CHARGES/INTEREST, EXCEPTIONAL & EXTRAORDINARY ITEMS & TAXES (PBDIEET)(III-IV)
264673 -128363 132566 (c) Other current liabilities 229755 257391 192376 (d) Short-term provisions 35439 20974 12143
(VI) Depreciation, Depletion & Amortisation 71240 49861 70642 Total Current Liabilities 4(a) to 4(d) 2399337 2113147 2307636
(VII) Impairment 0 0 0 TOTAL EQUITY & LIABILITIES (1+2+3+4) 3735524 3433573 3951768
(VIII) PROFIT BEFORE FINANCE COST/INTEREST, EXCEPTIONAL, EXTRA-ORDINARY ITEMS & TAXES (PBIEET)(V-VI-VII)
193433 -178224 61924 II. ASSETS (1) Non-Current Assets (a) Total Gross Fixed Assets 2251046 2094159 1225098
(IX) Finance Cost (ai) Accumulated Depreciation, Depletion & Amortisation 758899 683233 625956
(a) On Central Government Loans 0 0 0
(b) On Foreign Loans 12967 897 512 (aii) Accumulated Impairment 0 0 0
(c) Others 46084 39812 31632 (b) Total Net Fixed Assets ((a)-(ai)-(aii) 1492147 1410926 599142
(d) Less Finance Cost Capitalised 1268 0 0 (c) Capital work in progress 18307 137751 855155 (d) Intangible assets under developmet 0 0 0
(e) Charged to P & L Account (a+b+c -d) 57783 40709 32144 (e) Non-Current Investments 134967 134967 1500
(X) PROFIT BEFORE EXCEPTIONAL & EXTRA-ORDINARY ITEMS & TAX (PBEET)(VIII-IXe) 135650 -218933 29780
(f) Deferred Tax Assets (Net) 0 0 0 (XI) Exceptional Items 18299 -3345 -11189
(g) Long Term Loans and Advances 67923 35832 27366 (XII) PROFIT BEFORE EXTRA-ORDINARY ITEMS &
TAX (PBET)(X-XI) 117351 -215588 40969 (h) Other Non-Current Assets 34204 26142 26948 Total Non-Current Assets (b+c+d+e+f+g+h) 1747548 1745618 1510111
(XIII) Extra-Ordinary Items 0 0 0 (2) Current Assets
(XIV) PROFIT BEFORE TAX (PBT)(XII-XIII) 117351 -215588 40969 (a) Current Investments 0 0 0
(XV) TAX PROVISIONS 2535 -44365 -19149 (b) Inventories 319672 339961 844896
(XVI) NET PROFIT / LOSS FOR THE PERIOD FROM CONTINUING OPERATIONS AFTER TAX(XIV-XV) 114816 -171223 60118 (c) Trade Recievables 236903 235881 448115
(d) Cash & Bank Balance 1371273 1026872 1067233 (XVII) Profit/Loss from discontinuing operations 0 0 0
(e) Short-term Loans & Advances 42361 69000 72314 (XVIII) Tax expenses of discontinuing operations 0 0 0
(f) Other Current Assets 17767 16241 9099 (XIX) Profit/Loss from discontinuing operations (after
Tax)(XVII-XVIII) 0 0 0 Total Current Assets (a+b+c+d+e+f) 1987976 1687955 2441657
(XX) Profit/Loss for the period (XVI+XIX) 114816 -171223 60118 TOTAL ASSETS (1+2) 3735524 3433573 3951768 Important Indicators Financial Ratios (i) Sales : Capital Employed 299.43 436.33 451.03 (i) Investment 857309 961732 1060624 (ii) Cost of Sales : Sales 97.28 104.5 99.58
(ii) Capital Employed 1324087 1316962 1592245 (iii) Salary/Wages : Sales 0.72 0.42 0.3
(iii) Net Worth 642045 530497 706888 (iv) Net Profit : Net Worth 17.88 -32.28 8.5
(iv) Net Current Assets -411361 -425192 134021 (v) Debt : Equity 3.89 4.49 5.05
(v) Cost of Sales 3856984 6004935 7151411 (vi) Current Ratio 0.83 0.8 1.06
(vi) Net Value Added (at market price) 1432548 438833 493445 (vii) Trade Recievables : Sales 5.98 4.1 6.24
(vii) Total Regular Employees (Nos.) 1812 1720 1715 (viii) Total Inventory : Sales 8.06 5.92 11.76 (viii) Avg. Monthly Emoluments per Employee(`) 131084 116638 104699
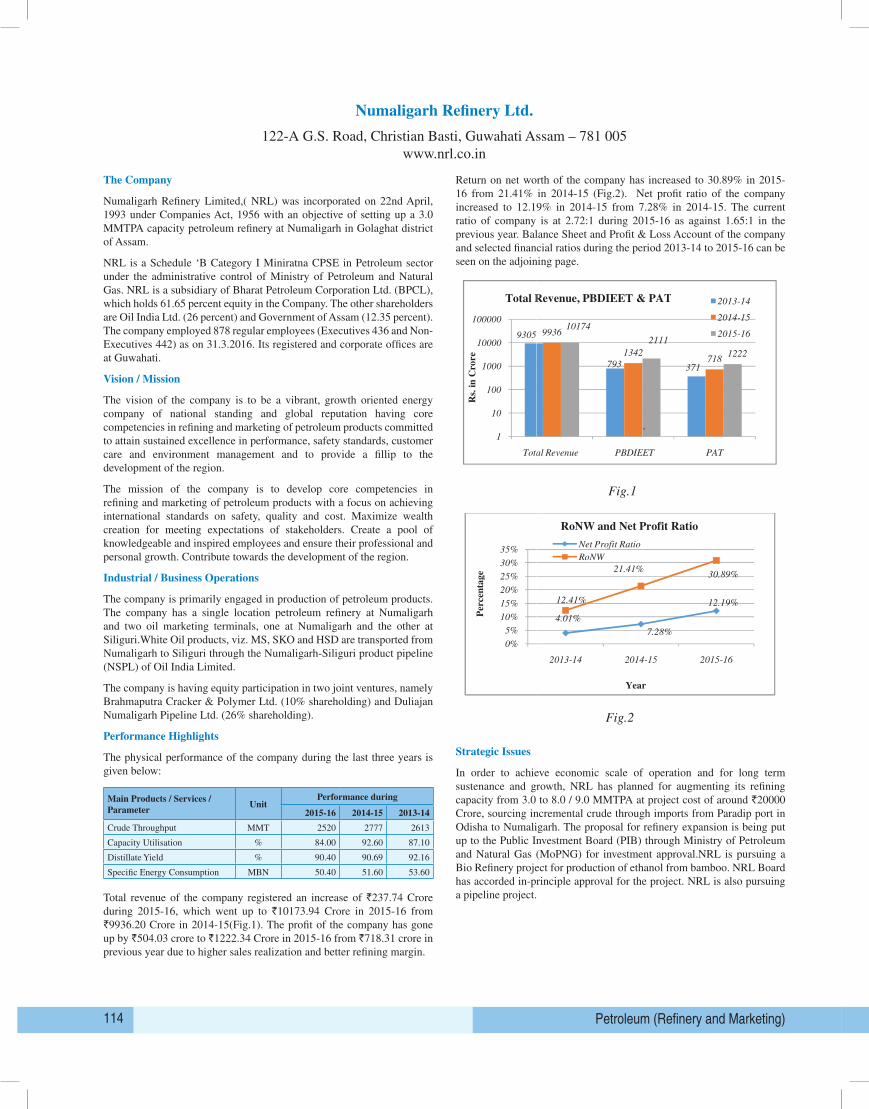
Petroleum (Refinery and Marketing)114
Numaligarh Refinery Ltd.
122-A G.S. Road, Christian Basti, Guwahati Assam – 781 005www.nrl.co.in
The Company
Numaligarh Refinery Limited,( NRL) was incorporated on 22nd April, 1993 under Companies Act, 1956 with an objective of setting up a 3.0 MMTPA capacity petroleum refinery at Numaligarh in Golaghat district of Assam.
NRL is a Schedule ‘B Category I Miniratna CPSE in Petroleum sector under the administrative control of Ministry of Petroleum and Natural Gas. NRL is a subsidiary of Bharat Petroleum Corporation Ltd. (BPCL), which holds 61.65 percent equity in the Company. The other shareholders are Oil India Ltd. (26 percent) and Government of Assam (12.35 percent). The company employed 878 regular employees (Executives 436 and Non-Executives 442) as on 31.3.2016. Its registered and corporate offices are at Guwahati.
Vision / Mission
The vision of the company is to be a vibrant, growth oriented energy company of national standing and global reputation having core competencies in refining and marketing of petroleum products committed to attain sustained excellence in performance, safety standards, customer care and environment management and to provide a fillip to the development of the region.
The mission of the company is to develop core competencies in refining and marketing of petroleum products with a focus on achieving international standards on safety, quality and cost. Maximize wealth creation for meeting expectations of stakeholders. Create a pool of knowledgeable and inspired employees and ensure their professional and personal growth. Contribute towards the development of the region.
Industrial / Business Operations
The company is primarily engaged in production of petroleum products. The company has a single location petroleum refinery at Numaligarh and two oil marketing terminals, one at Numaligarh and the other at Siliguri.White Oil products, viz. MS, SKO and HSD are transported from Numaligarh to Siliguri through the Numaligarh-Siliguri product pipeline (NSPL) of Oil India Limited.
The company is having equity participation in two joint ventures, namely Brahmaputra Cracker & Polymer Ltd. (10% shareholding) and Duliajan Numaligarh Pipeline Ltd. (26% shareholding).
Performance Highlights
The physical performance of the company during the last three years is given below:
Main Products / Services /Parameter
UnitPerformance during
2015-16 2014-15 2013-14
Crude Throughput MMT 2520 2777 2613
Capacity Utilisation % 84.00 92.60 87.10
Distillate Yield % 90.40 90.69 92.16
Specific Energy Consumption MBN 50.40 51.60 53.60
Total revenue of the company registered an increase of `237.74 Crore during 2015-16, which went up to `10173.94 Crore in 2015-16 from `9936.20 Crore in 2014-15(Fig.1). The profit of the company has gone up by `504.03 crore to `1222.34 Crore in 2015-16 from `718.31 crore in previous year due to higher sales realization and better refining margin.
Return on net worth of the company has increased to 30.89% in 2015-16 from 21.41% in 2014-15 (Fig.2). Net profit ratio of the company increased to 12.19% in 2014-15 from 7.28% in 2014-15. The current ratio of company is at 2.72:1 during 2015-16 as against 1.65:1 in the previous year. Balance Sheet and Profit & Loss Account of the company and selected financial ratios during the period 2013-14 to 2015-16 can be seen on the adjoining page.
Total revenue of the company registered an increase of
up to 10173.94 crores in 2015-
company has gone up by 504.03 crore to
previous year due to higher sales realization and better refining margin.
Return on net worth of the company has increase
(Fig.2). Net profit ratio of the company increased to 12.19% in 2014
current ratio of company is at 2.72:1 during 2015
Sheet and Profit & Loss Account of the company and selected financial ratios during the period 2013
14 to 2015-16 can be seen on the adjoining page.
Strategic Issues
In order to achieve economic scale of operation and for long term sustenance and growth, NRL has
planned for augmenting its refining capacity from 3.0 to 8.0 / 9.0 MMTPA at project cost of around
20000 crores, sourcing incremental crude through imports f
Numaligarh. The proposal for refinery expansion is being put up to the Public Investment Board
(PIB) through Ministry of Petroleum and Natural Gas (MoPNG) for investment approval.NRL is
pursuing a Bio Refinery project for prod
principle approval for the project. NRL is also pursuing a pipeline project.
9305
1
10
100
1000
10000
100000
Total Revenue
Rs.
in
Cro
re
Total Revenue, PBDIEET & PAT
0%
5%
10%
15%
20%
25%
30%
35%
Per
cen
tag
e
Total revenue of the company registered an increase of 237.74 crores during 2015-16, which went
-16 from 9936.20 crores in 2014-15(Fig.1). The profit of the
504.03 crore to 1222.34 crores in 2015-16 from 718.31 crore in
previous year due to higher sales realization and better refining margin.
Return on net worth of the company has increased to 30.89% in 2015-16 from 21.41% in 2014
(Fig.2). Net profit ratio of the company increased to 12.19% in 2014-15 from 7.28% in 2014
current ratio of company is at 2.72:1 during 2015-16 as against 1.65:1 in the previous year. Balance
Profit & Loss Account of the company and selected financial ratios during the period 2013
16 can be seen on the adjoining page.
Fig.1
Fig.2
In order to achieve economic scale of operation and for long term sustenance and growth, NRL has
planned for augmenting its refining capacity from 3.0 to 8.0 / 9.0 MMTPA at project cost of around
sourcing incremental crude through imports from Paradip port in Odisha to
Numaligarh. The proposal for refinery expansion is being put up to the Public Investment Board
(PIB) through Ministry of Petroleum and Natural Gas (MoPNG) for investment approval.NRL is
pursuing a Bio Refinery project for production of ethanol from bamboo. NRL Board has accorded in
principle approval for the project. NRL is also pursuing a pipeline project.
793 371
9936
1342718
10174
2111
1222
Total Revenue PBDIEET PAT
Total Revenue, PBDIEET & PAT 2013-14
2014-15
2015-16
4.01%
7.28%
12.19%12.41%
21.41%30.89%
2013-14 2014-15 2015-16
Year
RoNW and Net Profit Ratio
Net Profit Ratio
RoNW
16, which went
15(Fig.1). The profit of the
718.31 crore in
16 from 21.41% in 2014-15
15 from 7.28% in 2014-15. The
16 as against 1.65:1 in the previous year. Balance
Profit & Loss Account of the company and selected financial ratios during the period 2013-
In order to achieve economic scale of operation and for long term sustenance and growth, NRL has
planned for augmenting its refining capacity from 3.0 to 8.0 / 9.0 MMTPA at project cost of around
rom Paradip port in Odisha to
Numaligarh. The proposal for refinery expansion is being put up to the Public Investment Board
(PIB) through Ministry of Petroleum and Natural Gas (MoPNG) for investment approval.NRL is
uction of ethanol from bamboo. NRL Board has accorded in-
Strategic Issues
In order to achieve economic scale of operation and for long term sustenance and growth, NRL has planned for augmenting its refining capacity from 3.0 to 8.0 / 9.0 MMTPA at project cost of around `20000 Crore, sourcing incremental crude through imports from Paradip port in Odisha to Numaligarh. The proposal for refinery expansion is being put up to the Public Investment Board (PIB) through Ministry of Petroleum and Natural Gas (MoPNG) for investment approval.NRL is pursuing a Bio Refinery project for production of ethanol from bamboo. NRL Board has accorded in-principle approval for the project. NRL is also pursuing a pipeline project.
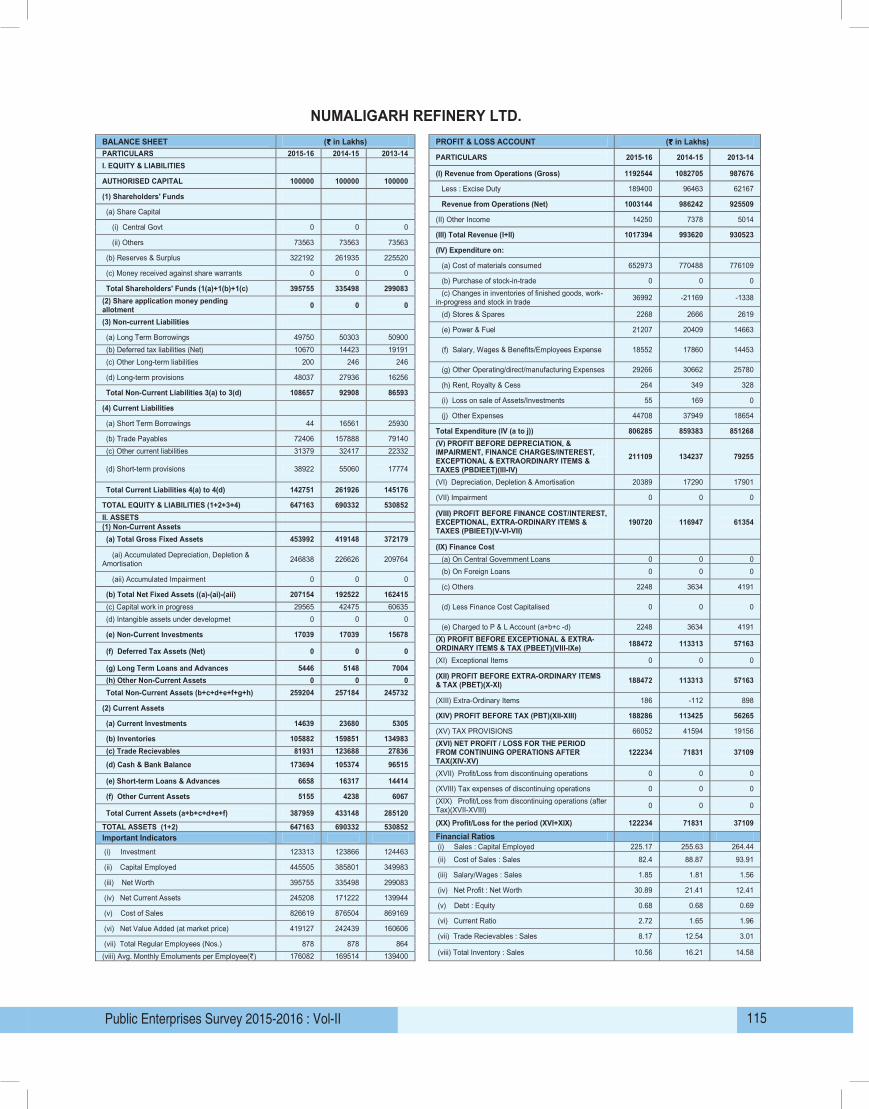
Public Enterprises Survey 2015-2016 : Vol-II 115
NUMALIGARH REFINERY LTD.
BALANCE SHEET (`̀̀̀ in Lakhs) PROFIT & LOSS ACCOUNT (`̀̀̀ in Lakhs) PARTICULARS 2015-16 2014-15 2013-14 PARTICULARS 2015-16 2014-15 2013-14 I. EQUITY & LIABILITIES
(I) Revenue from Operations (Gross) 1192544 1082705 987676 AUTHORISED CAPITAL 100000 100000 100000
Less : Excise Duty 189400 96463 62167 (1) Shareholders' Funds
Revenue from Operations (Net) 1003144 986242 925509 (a) Share Capital
(II) Other Income 14250 7378 5014 (i) Central Govt 0 0 0
(III) Total Revenue (I+II) 1017394 993620 930523 (ii) Others 73563 73563 73563
(IV) Expenditure on: (b) Reserves & Surplus 322192 261935 225520
(a) Cost of materials consumed 652973 770488 776109 (c) Money received against share warrants 0 0 0
(b) Purchase of stock-in-trade 0 0 0 Total Shareholders' Funds (1(a)+1(b)+1(c) 395755 335498 299083
(c) Changes in inventories of finished goods, work-in-progress and stock in trade 36992 -21169 -1338 (2) Share application money pending
allotment 0 0 0 (d) Stores & Spares 2268 2666 2619
(3) Non-current Liabilities (e) Power & Fuel 21207 20409 14663
(a) Long Term Borrowings 49750 50303 50900 (f) Salary, Wages & Benefits/Employees Expense 18552 17860 14453 (b) Deferred tax liabilities (Net) 10670 14423 19191
(c) Other Long-term liabilities 200 246 246 (g) Other Operating/direct/manufacturing Expenses 29266 30662 25780
(d) Long-term provisions 48037 27936 16256 (h) Rent, Royalty & Cess 264 349 328
Total Non-Current Liabilities 3(a) to 3(d) 108657 92908 86593 (i) Loss on sale of Assets/Investments 55 169 0
(4) Current Liabilities (j) Other Expenses 44708 37949 18654
(a) Short Term Borrowings 44 16561 25930 Total Expenditure (IV (a to j)) 806285 859383 851268
(b) Trade Payables 72406 157888 79140 (V) PROFIT BEFORE DEPRECIATION, &
IMPAIRMENT, FINANCE CHARGES/INTEREST, EXCEPTIONAL & EXTRAORDINARY ITEMS & TAXES (PBDIEET)(III-IV)
211109 134237 79255 (c) Other current liabilities 31379 32417 22332 (d) Short-term provisions 38922 55060 17774
(VI) Depreciation, Depletion & Amortisation 20389 17290 17901 Total Current Liabilities 4(a) to 4(d) 142751 261926 145176
(VII) Impairment 0 0 0 TOTAL EQUITY & LIABILITIES (1+2+3+4) 647163 690332 530852
(VIII) PROFIT BEFORE FINANCE COST/INTEREST, EXCEPTIONAL, EXTRA-ORDINARY ITEMS & TAXES (PBIEET)(V-VI-VII)
190720 116947 61354 II. ASSETS (1) Non-Current Assets (a) Total Gross Fixed Assets 453992 419148 372179
(IX) Finance Cost (ai) Accumulated Depreciation, Depletion & Amortisation 246838 226626 209764
(a) On Central Government Loans 0 0 0
(b) On Foreign Loans 0 0 0 (aii) Accumulated Impairment 0 0 0
(c) Others 2248 3634 4191 (b) Total Net Fixed Assets ((a)-(ai)-(aii) 207154 192522 162415
(d) Less Finance Cost Capitalised 0 0 0 (c) Capital work in progress 29565 42475 60635 (d) Intangible assets under developmet 0 0 0
(e) Charged to P & L Account (a+b+c -d) 2248 3634 4191 (e) Non-Current Investments 17039 17039 15678
(X) PROFIT BEFORE EXCEPTIONAL & EXTRA-ORDINARY ITEMS & TAX (PBEET)(VIII-IXe) 188472 113313 57163
(f) Deferred Tax Assets (Net) 0 0 0 (XI) Exceptional Items 0 0 0
(g) Long Term Loans and Advances 5446 5148 7004 (XII) PROFIT BEFORE EXTRA-ORDINARY ITEMS
& TAX (PBET)(X-XI) 188472 113313 57163 (h) Other Non-Current Assets 0 0 0 Total Non-Current Assets (b+c+d+e+f+g+h) 259204 257184 245732
(XIII) Extra-Ordinary Items 186 -112 898 (2) Current Assets
(XIV) PROFIT BEFORE TAX (PBT)(XII-XIII) 188286 113425 56265 (a) Current Investments 14639 23680 5305
(XV) TAX PROVISIONS 66052 41594 19156 (b) Inventories 105882 159851 134983
(XVI) NET PROFIT / LOSS FOR THE PERIOD FROM CONTINUING OPERATIONS AFTER TAX(XIV-XV)
122234 71831 37109 (c) Trade Recievables 81931 123688 27836 (d) Cash & Bank Balance 173694 105374 96515
(XVII) Profit/Loss from discontinuing operations 0 0 0 (e) Short-term Loans & Advances 6658 16317 14414
(XVIII) Tax expenses of discontinuing operations 0 0 0 (f) Other Current Assets 5155 4238 6067
(XIX) Profit/Loss from discontinuing operations (after Tax)(XVII-XVIII) 0 0 0
Total Current Assets (a+b+c+d+e+f) 387959 433148 285120 (XX) Profit/Loss for the period (XVI+XIX) 122234 71831 37109 TOTAL ASSETS (1+2) 647163 690332 530852 Important Indicators Financial Ratios (i) Sales : Capital Employed 225.17 255.63 264.44 (i) Investment 123313 123866 124463 (ii) Cost of Sales : Sales 82.4 88.87 93.91
(ii) Capital Employed 445505 385801 349983 (iii) Salary/Wages : Sales 1.85 1.81 1.56
(iii) Net Worth 395755 335498 299083 (iv) Net Profit : Net Worth 30.89 21.41 12.41
(iv) Net Current Assets 245208 171222 139944 (v) Debt : Equity 0.68 0.68 0.69
(v) Cost of Sales 826619 876504 869169 (vi) Current Ratio 2.72 1.65 1.96
(vi) Net Value Added (at market price) 419127 242439 160606 (vii) Trade Recievables : Sales 8.17 12.54 3.01
(vii) Total Regular Employees (Nos.) 878 878 864 (viii) Total Inventory : Sales 10.56 16.21 14.58 (viii) Avg. Monthly Emoluments per Employee(`) 176082 169514 139400


