41
Petroleum Retail Market in Pakistan Kalim A. Siddiqui President Petroleum Marketing Byco Petroleum Pakistan Limited (Formerly Bosicor Pakistan Limited) 1
Petroleum Retail Market
in Pakistan
Kalim A. SiddiquiPresident Petroleum Marketing
Byco Petroleum Pakistan Limited
(Formerly Bosicor Pakistan Limited)
1
2
Presentation Outline
• Overview of:
World Economic Outlook
World Oil Scenario
• Overview of:
Pakistan Economic Outlook
Pakistan Oil Scenario
• Overview of Petroleum Retail Market in Pakistan
• Overview of Byco Petroleum Marketing in Pakistan
• Conclusion

World Economic Outlook
3

World Economic Highlights
• Global GDP is expected to grow at 3.4% in 2010.
• The main contribution for growth is coming from developing Asia, with:
- China expected to grow by 9.1% in 2010.
- India forecasted to grow by 7.0% in 2010.
• The OECD is forecast to grow on a much lower level of 1.7%. The US is expected to
contribute the most within the OECD at 2.5% in 2010.
• Growth in 2010 continues to be challenged by following concerns:
- Level of public debt in almost all OECD regions.
- Record high unemployment levels across the globe.
- Government efforts in China to prevent the economy from overheating.
4Source : OPEC Oil Market Report – Jan’2010OECD is Organization for Economic Cooperation and Development

5
3.00
4.80
2.20
2.70
3.80
4.90 4.70
5.30 5.20
3.10
3.40
-
1.00
2.00
3.00
4.00
5.00
6.00
2000 2001 2002 2003 2004 2005 2006 2007 2008 2009 2010p
GD
P G
row
th r
ate
Source : CIA World Factbook
World Real GDP Growth Rate
World Oil Scenario
6

7
World Oil Statistics - 2009
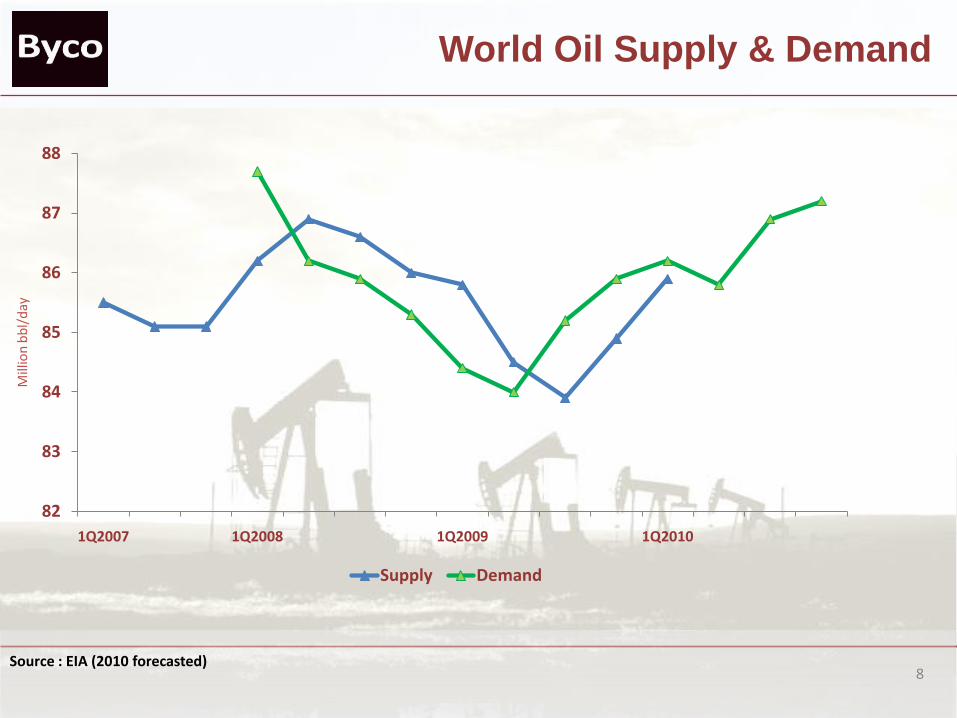
• Oil Production: 85.43 million bbl/d
• Oil Consumption : 85.98 million bbl/d
• Oil Exports: 66.13 million bbl/day
• Oil Imports: 66.68 million bbl/day
• Oil - proved reserves: 1.343 trillion bbl/day
Source : CIA World Fact Book
8
World Oil Supply & Demand
Source : EIA (2010 forecasted)
82
83
84
85
86
87
88
1Q2007 1Q2008 1Q2009 1Q2010
Supply Demand
Mill
ion
bb
l/d
ay

Crude Oil Price Trend
Source : EIA USAOPEC
9
0
20
40
60
80
100
120
140
160F
eb
-95
Ju
n-9
5
Oct-
95
Feb
-96
Ju
n-9
6
Oct-
96
Feb
-97
Ju
n-9
7
Oct-
97
Feb
-98
Ju
n-9
8
Oct-
98
Feb
-99
Ju
n-9
9
Oct-
99
Feb
-00
Ju
n-0
0
Oct-
00
Feb
-01
Ju
n-0
1
Oct-
01
Feb
-02
Ju
n-0
2
Oct-
02
Feb
-03
Ju
n-0
3
Oct-
03
Feb
-04
Ju
n-0
4
Oct-
04
Feb
-05
Ju
n-0
5
Oct-
05
Fe
b-0
6
Ju
n-0
6
Oct-
06
Feb
-07
Ju
n-0
7
Oct-
07
Feb
-08
Ju
n-0
8
Oct-
08
Feb
-09
Ju
n-0
9
Oct-
09
Feb
-10
US
$/B
BL
WTI North Brent OPEC

Global Refining Capacity
Source : ENI World Oil Gas Review
80.1
81.5 81.3 81.482.0
82.3
82.8
85.3 85.4 85.5
87.2
76.0
78.0
80.0
82.0
84.0
86.0
88.0
1999 2000 2001 2002 2003 2004 2005 2006 2007 2008 2009
Mill
ion
bar
rels
pe
r d
ay
10

Global Energy Mix For 2009
Source : EIA
35.8%
26.9%
23.4%
8.0%5.8%
Liquids Coal Gas Renewables Nuclear Total
Share 35.8% 27.0% 23.4% 8.1% 5.7% 100.0%
Volume (MnToe)
4,421 3,341 2,889 1,005 703 12,359
11

12
3%10%
46%6%
35%
Global Oil Consumption in 2009
Agriculture Industry Transportation Residential All Other*Total
Consumption 3% 10% 46% 6% 35% 100%
Source : OPEC Market Review Dec 2009* All Other may include Electricity generation, Non-energy uses, Commercial uses, etc

Pakistan Economic Outlook
13
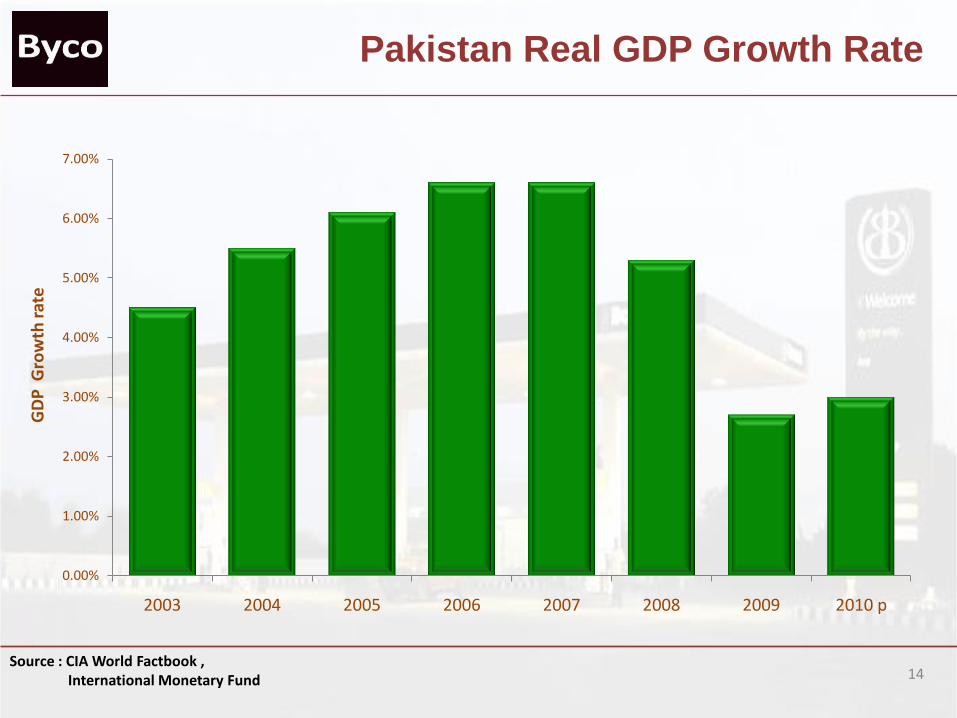
Pakistan Real GDP Growth RateG
DP
Gro
wth
rat
e
Source : CIA World Factbook ,International Monetary Fund
0.00%
1.00%
2.00%
3.00%
4.00%
5.00%
6.00%
7.00%
2003 2004 2005 2006 2007 2008 2009 2010 p
14
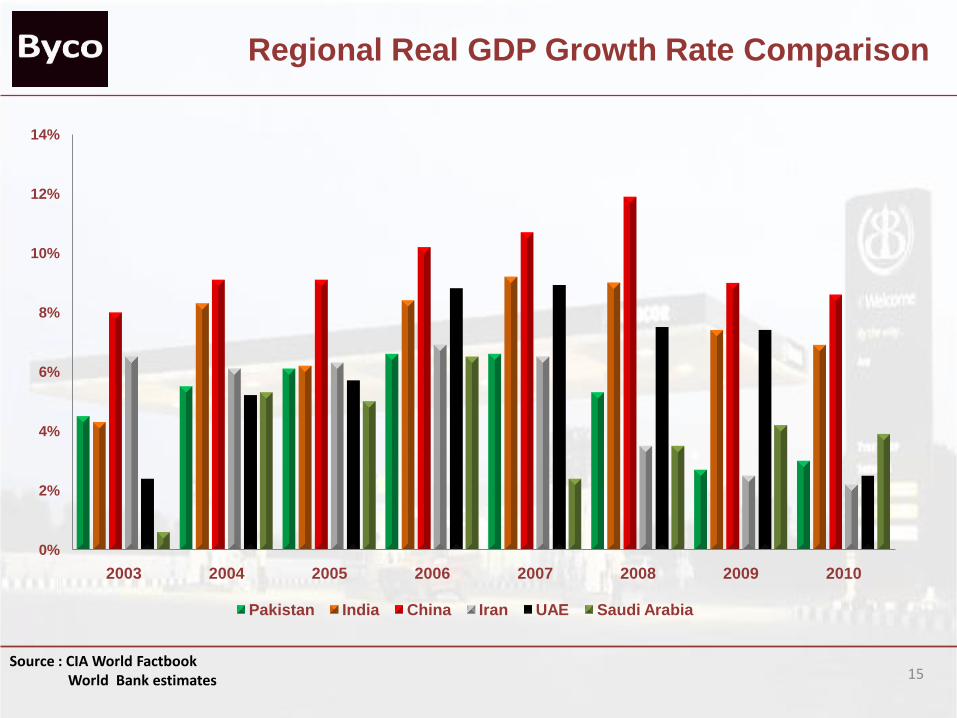
Regional Real GDP Growth Rate Comparison
Source : CIA World FactbookWorld Bank estimates 15
0%
2%
4%
6%
8%
10%
12%
14%
2003 2004 2005 2006 2007 2008 2009 2010
Pakistan India China Iran UAE Saudi Arabia
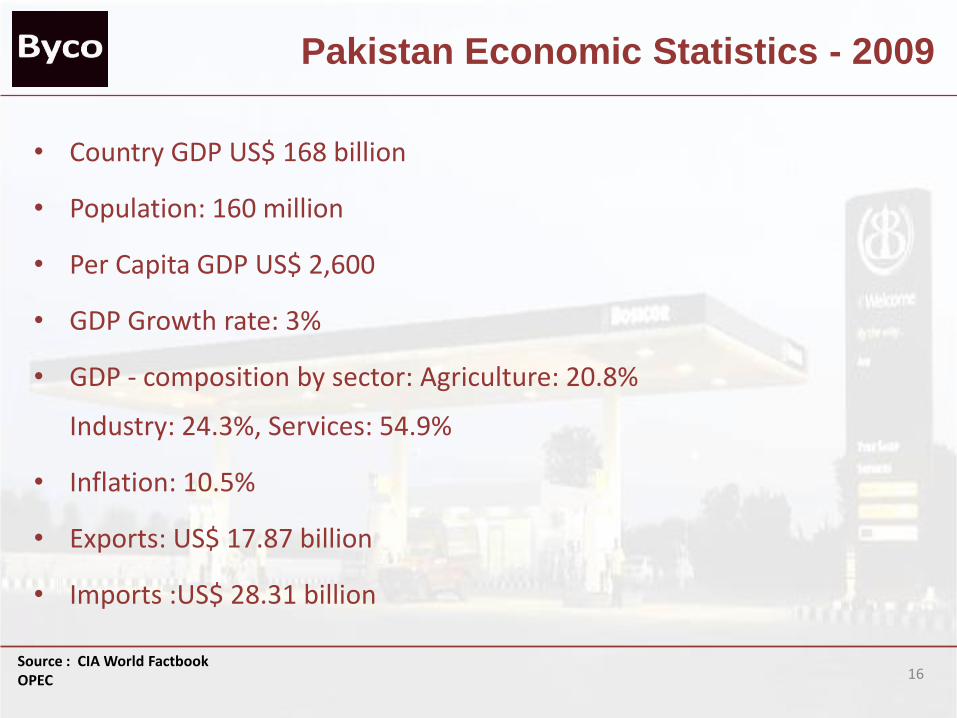
Pakistan Economic Statistics - 2009
• Country GDP US$ 168 billion
• Population: 160 million
• Per Capita GDP US$ 2,600
• GDP Growth rate: 3%
• GDP - composition by sector: Agriculture: 20.8%
Industry: 24.3%, Services: 54.9%
• Inflation: 10.5%
• Exports: US$ 17.87 billion
• Imports :US$ 28.31 billion
Source : CIA World FactbookOPEC 16

Major Industries, Trading Partners & Export Items
• Major Industries–Textile, Sugar, Vegetable Oils,
–Agricultural products, Cement,
–Fertilizers, Steel, Chemicals,
–Sporting goods & carpets
• Major Trading Partners–US, Japan, Germany, China, EU
–UK, Saudi Arabia & UAE
• Major Exports– Oils Seeds, Vegetables, Cotton, Coal, Fertilizer, Telecom equipment, Textile,
Cotton, Rice, Medical instruments, Sporting goods.
17
Pakistan Oil Scenario
18
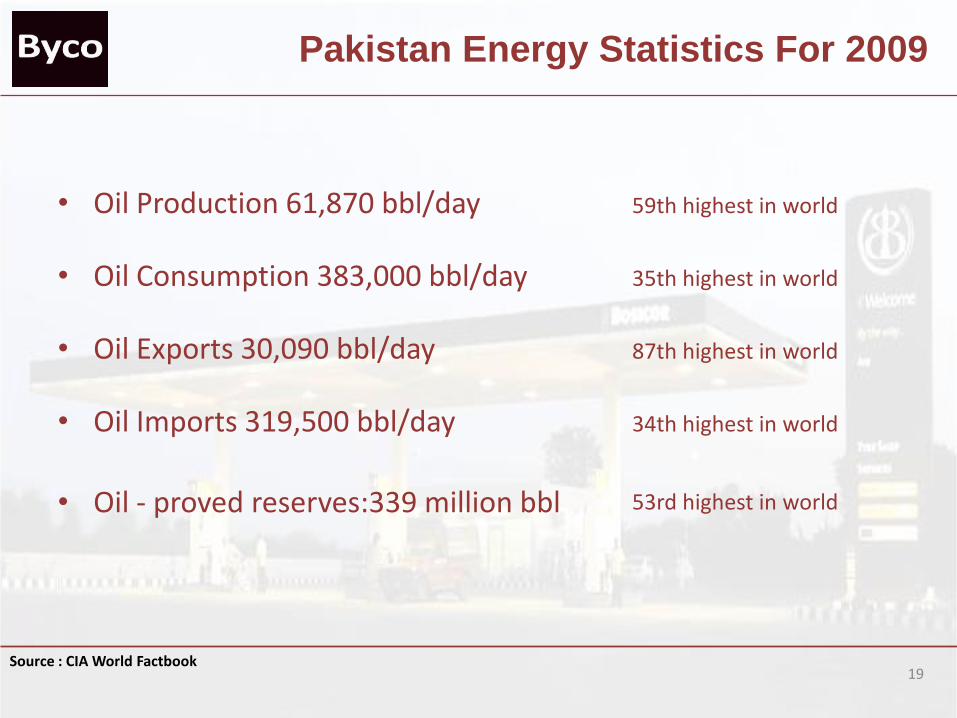
Pakistan Energy Statistics For 2009
• Oil Production 61,870 bbl/day 59th highest in world
• Oil Consumption 383,000 bbl/day 35th highest in world
• Oil Exports 30,090 bbl/day 87th highest in world
• Oil Imports 319,500 bbl/day 34th highest in world
• Oil - proved reserves:339 million bbl 53rd highest in world
Source : CIA World Factbook19

Pakistan Energy Statistics For 2009
• Natural gas production:37.5 billion cu m 23rd highest in world
• Natural gas consumption:37.5 billion cu m 21st highest in world
• Natural gas proved reserves: 885.3 billion cu m 26th highest in world
• Coal reserves more then 185bn tons 04th highest in world
Source : CIA World Factbook20
Pakistan Economy – Key Attributes
• A market location with great business potential
• Strategic location: Gateway to Central Asia (CIS countries).
• Neighboring with China, India, Iran and Afghanistan.
• Host to major multinationals and global brands in key industrial
areas.
21

Pakistan Economy – Key Attributes
• High growth areas are education & training, agribusiness
health & medical, oil & gas, building & construction,
multilateral Projects (ADB-WB), information, communication &
telecom, defense & aviation.
• Economy still recovering from oil price inflation and global
downturn.
• Infrastructure development still under process in many areas.
22
Pakistan Economy – Key Attributes
• Nascent democratic /political setup and security concerns
• Proven investment potential during the past few years.
• Promising prospects as region is showing good economic
recovery.
• Untapped potential of natural resources and alternative
energy avenues.
23

24
0.0
2.0
4.0
6.0
8.0
10.0
12.0
14.0
16.0
18.0
20.0
1998-99 1999-00 2000-01 2001-02 2002-03 2003-04 2004-05 2005-06 2006-07 2007-08 2008-2009 2009-10
Vo
lum
e in
Mn
MT
Year 1998-99 1999-00 2000-01 2001-02 2002-03 2003-04 2004-05 2005-06 2006-07 2007-08 2008-2009 2009-2010
Consumption (MnMT)
16.9 18.1 18.1 17.4 17.8 15.4 15.5 14.9 17.1 18.5 18.8 20
Petroleum Products Consumption
Source : OCAC

Infrastructure
Source : OCAC
MHKGAT
MCH
RWP
QTA
TJB
KHI
SKP
GWD
VHR
CTL
JGT
CPI
RefineriesSouth NRL, PRL, BPPLCentral PARCONorth ARL
MFM
KMK
WOP
DEPOT
REFINERY
25
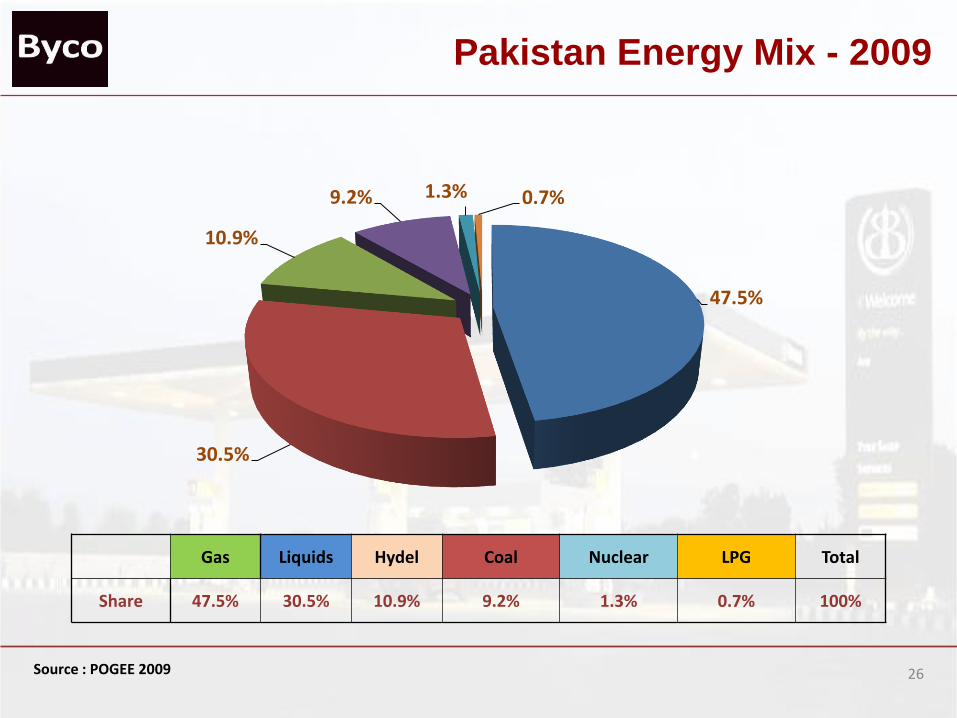
Pakistan Energy Mix - 2009
Source : POGEE 2009
47.5%
30.5%
10.9%
9.2% 1.3% 0.7%
Gas Liquids Hydel Coal Nuclear LPG Total
Share 47.5% 30.5% 10.9% 9.2% 1.3% 0.7% 100%
26
27
Petroleum Retail Market in Pakistan

Downstream Oil Industry
• Annual sales of US$ 11.8 billion.
• Direct employment of over 100,000 people.
• Indirect employment (transport sector) of another 24,000
persons.
• Capital investment of over US$ 0.36 billion over last 5 years.
• Annual generation of taxes around US$ 2.37 billion.
• Progressive IT infrastructure.
28Source : OCAC, HDIP, Pakistan Energy Outlook

Downstream Oil Industry
• Skill sets ranging from Technical, IT, Finance, Sales, Marketing
& HR.
• Pakistan has the largest no. of CNG vehicles in the world (2.2
million)
• CNG Dispensing Facility 2,941 stations. Largest in the world.
29Source : OCAC, HDIP, Pakistan Energy Outlook
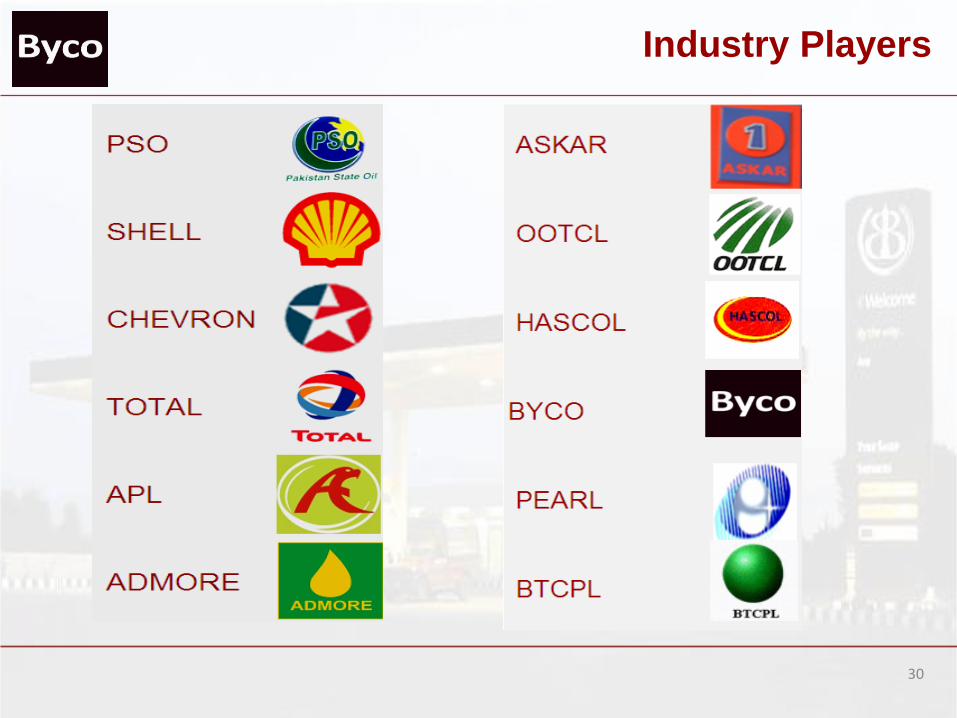
Industry Players
30
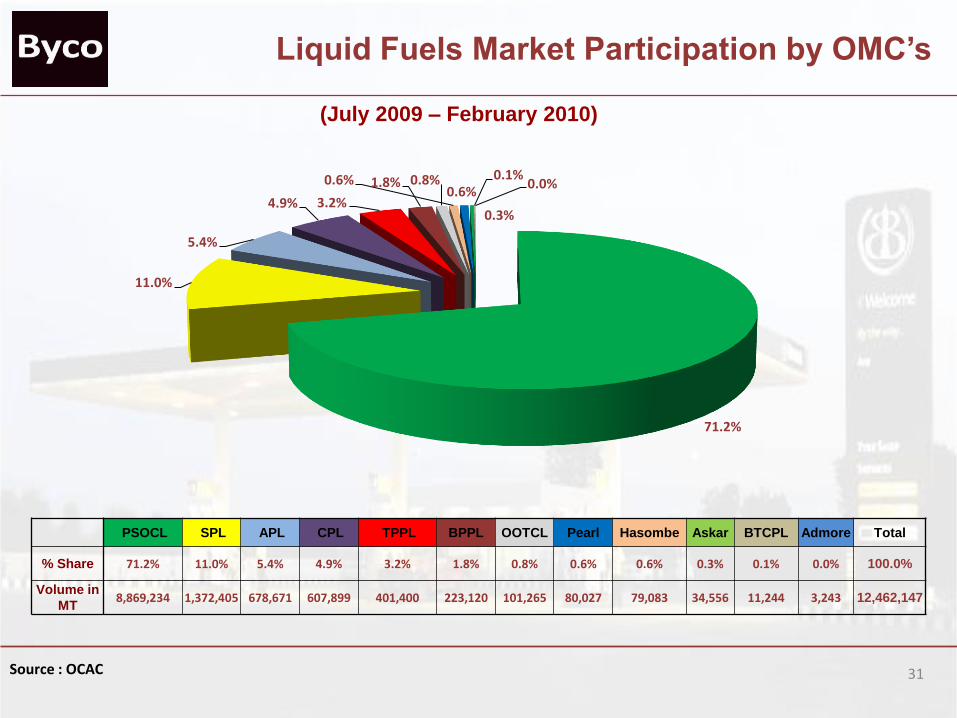
(July 2009 – February 2010)
Source : OCAC 31
Liquid Fuels Market Participation by OMC’s
71.2%
11.0%
5.4%
4.9% 3.2%
1.8% 0.8%0.6%0.6%
0.3%
0.1%0.0%
PSOCL SPL APL CPL TPPL BPPL OOTCL Pearl Hasombe Askar BTCPL Admore Total
% Share 71.2% 11.0% 5.4% 4.9% 3.2% 1.8% 0.8% 0.6% 0.6% 0.3% 0.1% 0.0% 100.0%
Volume in
MT8,869,234 1,372,405 678,671 607,899 401,400 223,120 101,265 80,027 79,083 34,556 11,244 3,243 12,462,147

Source : Corporate websites
Retail Outlets Market Participation by Company
32
55.8%
14.2%
9.2%
6.2%
4.1%3.1% 3.3%
1.9% 1.1%0.6%
0.6%
PSO SPL COPL Admore APL TPPL Askar Hascol BPPL OOTCL BTCPL TOTAL
Share 55.8% 14.2% 9.2% 6.2% 4.1% 3.1% 3.3% 1.9% 1.1% 0.6% 0.6% 100.0%
No. Of Outlets 3,620 922 598 401 265 200 213 120 73 38 38 6,488
Retail Fuel Industry Trends
• Non Fuel activities are growing fast.
• Stiff competition on retail sites development.
• Enhanced branding activities.
• Customer more demanding on product quality and
forecourt services.
• Growing use of technology and innovation to provide
products and services.
33
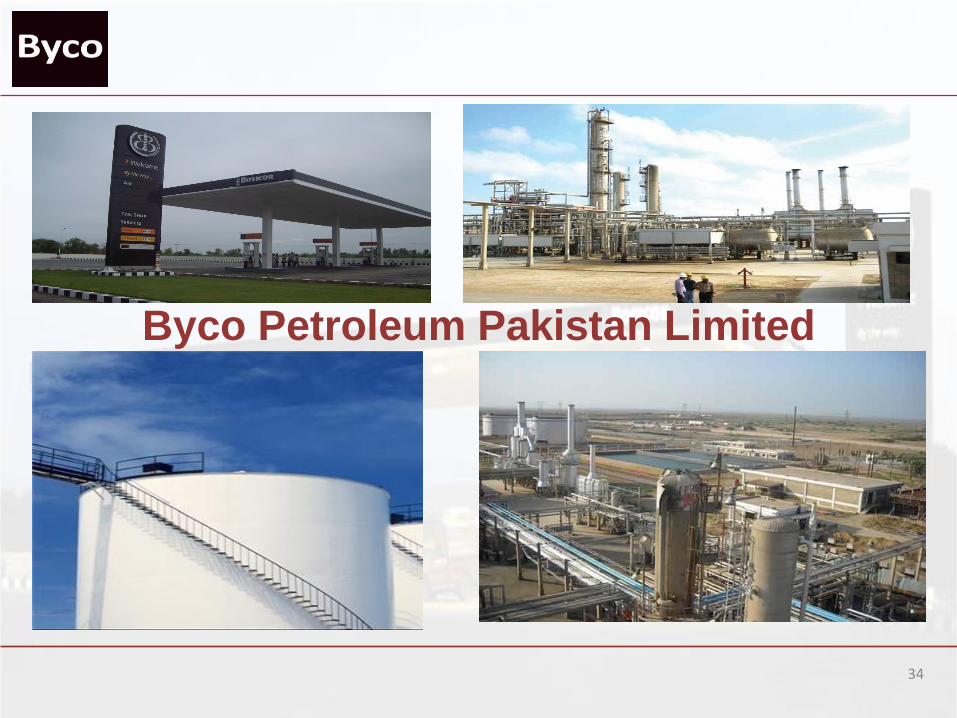
Byco Petroleum Pakistan Limited
34

35
• Current refinery capacity 30,000 bbl/day
• Upcoming refinery capacity 120,000 bbl/day
• Combined refining capacity 150,000 bbl/ day
• Will be the largest refining complex in Pakistan after
commissioning of upcoming refinery
• Plan to have the first and largest petrochemical facility for the
production of aromatics
Byco’s Petroleum Marketing Business
Emerging Energy leader
36
• Aggressive expansion strategy for Petroleum Marketing to become
a major player
• Developing storage / product handling infrastructure.
• Plan astronomical growth in retail network
• Plan to introduce LPG dispensing at our retail outlets
• New brand identity to be launched shortly.
Byco’s Petroleum Marketing Business
Emerging Energy leader

37
• Plan to develop state of the art NFR facilities at our retail outlets
through the provision of the following facilities:
• ATM Services
• C-stores
• Fast food franchises
• Business Centers
• Plan to introduce Byco branded lubricants for automotive and
industrial segments.
Byco’s Petroleum Marketing Business
Emerging Energy leader

Progressive Commissioning of Retail Outlets
38
4 46 7 8
11 1214
16
20
2832
32 3235 36 37 37 37 37 37 38
50 50 5052 52 53 53
56
66
73
0
6
12
18
24
30
36
42
48
54
60
66
72
Aug-0
7
Sep-0
7
Oct-
07
Nov-0
7
Dec-0
7
Jan-0
8
Feb-0
8
Mar-
08
Apr-
08
May-0
8
Jun-0
8
Jul-
08
Aug-0
8
Sep-0
8
Oct-
08
Nov-0
8
Dec-0
8
Jan-0
9
Feb-0
9
Mar-
09
Apr-
09
May-0
9
Jun-0
9
Jul-
09
Aug-0
9
Sep-0
9
Oct-
09
Nov-0
9
Dec-0
9
Jan-1
0
Feb-1
0
Mar-
10
Num
ber
Of
Sit
es

39
Current Rank is 6th
Progressive Growth in Liquid Fuels Market Share
Rank in 2007 was 11th
0.01%
0.88%
1.42%
2.64%
0.00%
0.50%
1.00%
1.50%
2.00%
2.50%
3.00%
Jul-
07
Au
g-0
7
Sep
-07
Oct
-07
No
v-0
7
De
c-0
7
Jan
-08
Feb
-08
Mar
-08
Ap
r-0
8
May
-08
Jun
-08
Jul-
08
Au
g-0
8
Sep
-08
Oct
-08
No
v-0
8
De
c-0
8
Jan
-09
Feb
-09
Mar
-09
Ap
r-0
9
May
-09
Jun
-09
Jul-
09
Au
g-0
9
Sep
-09
Oct
-09
No
v-0
9
De
c-0
9
Jan
-10
Feb
-10
Share
40
• Petroleum retail market in Pakistan is growing at a rapid pace.
• This segment Offers lucrative business opportunities for investors
and vendors.
• Petroleum retail segment is dynamic and is receptive to
technological and service innovation in alignment with the
international market.
• NFR activities are expected to increase in this segment in the
coming years.
Conclusion
41
THANK YOU


