All required disclosure and analyst certification appear on the last two pages of this report. Additional information is available upon request. Redistribution or reproduction is prohibited without written permission (Member of Alliance Bank group) PP7766/03/2013 (032116) 18 March 2013 Lacking major growth catalyst We initiate coverage on Petronas Chemicals with a NEUTRAL recommendation and a TP of RM6.38 (FY13 P/E of 13.7x). We view that 2013 and 2014 petrochemical demand is likely to be met by new supplies from the Middle East, China, and also Africa, thus capping upside to prices and resulting in flattish earnings growth. Furthermore, new capacity for PChem only materialises in FY15 onwards. On valuation, PChem currently trades on par with global peers average of 13.7x which we view is fair given our neutral industry outlook. Malaysia’s leading integrated gas based petrochemicals producer Petronas Chemicals Group (PChem) is the leading integrated natural gas based petrochemicals producer in Malaysia and one of the largest producers in South East Asia. PChem has a total production capacity of more than 11m mtpa. PChem is one of the lowest cost petrochemical producers globally because of low cost feedstock from PETRONAS. The group’s EBITDA margins are steady at above 30%, compared to naphtha based peers with margins <15%. Steady demand for petrochemicals over the long term… ICIS has forecasted that barring severe global economic downturns, emerging markets and economic recovery will be able to drive olefin & derivatives (O&D) demand by 4% annually (or roughly 10m mtpa) over the next 3-4 years. In the M&F (methanol & fertilisers) segment, methanol demand will be driven by non- traditional usage like methanol-to-olefin (MTO) production while fertilisers will benefit from on-going agricultural activities in Malaysia and China. …which is likely to be met by new supplies in the mid-term We view that steady demand for both O&D and F&M will largely be met by new supplies thus keeping overall petrochemical prices flattish going forward. In the O&D scene, major ethylene chain capacity is emerging from China, Singapore and Abu Dhabi in 2013. Also, 2 new MTO plants will be ready in China and Algeria by 1H13. In fertilisers, 2 major new facilities in Qatar have already started to drag down urea and ammonia prices and will continue to influence prices as they reach full utilisation. That said, new capacities could trickle down into demand for methanol (from MTO plants), and paraxylene (from new polyester plants in China). Slowed growth seen for FY13 and FY14 During FY11 and FPE11 (9MDec11), PChem’s net profit (+36% and +27% y-o-y respectively) were buoyed by rising petrochemical prices despite that utilisation of the group’s plants was hampered by unplanned shutdowns, and decline in contributions from JV and associates. Going into FY13 though, with demand growth likely to be met by new supplies, we expect only mild net profit growth of 4.1% which will be driven largely by improved methanol and paraxylene prices. We also caution for weakness in 3Q13 due to major ethane cracker maintenance activities. Our outlook for FY14 is equally unexciting, with 4.2% profit growth on the back of improved utilisation and continued improvement in methanol prices. Initiating coverage with a NEUTRAL call and TP of RM6.38 PChem currently trades at FY13 P/E of 13.7x which is generally in line with their peers 1- year rolling forward average of 14.0x and peers long term average of 13.7x. Pegging our FY13 EPS to 13.7x P/E derives our TP of RM6.38 and given the lack of upside we initiate coverage with a NEUTRAL recommendation. Downside risks include a slowdown in global economy which would dampen demand for petrochemicals or major unplanned plant downtime. Upside risks include lengthy downtime by peers, which could create supply imbalances thus push up prices or stronger than expected global growth, which drives demand. Petronas Chemicals Group Neutral Chemicals Bloomberg Ticker: PCHEM MK | Bursa Code: 5183 Initiating Coverage Analyst Arhnue Tan [email protected]+603 2604 3909 12-month upside potential Target price 6.38 Current price (as at 15 Mar) 6.37 Capital upside (%) 0.1 Net dividends (%) 3.7 Total return (%) 3.8 Key stock information Syariah-compliant? Yes Market Cap (RM m) 50,960.0 Shares outstanding (m) 8,000.0 Free float (%) 23.2 52-week high / low (RM) 6.65 / 5.66 3-mth avg volume ('000) 2,872.4 3-mth avg turnover (RM m) 17.9 Share price performance 1M 3M 6M Absolute (%) 4.4 2.9 -1.2 Relative (%) 4.7 4.9 -0.3 Share price chart Major shareholders % PETRONAS 64.4 Employees Provident Fund 12.4
Transcript
All required disclosure and analyst certification appear on the last two pages of this report. Additional information is available upon request. Redistribution or reproduction is prohibited without written permission
(Member of Alliance Bank group) PP7766/03/2013 (032116)
18 March 2013
Lacking major growth catalyst
We initiate coverage on Petronas Chemicals with a NEUTRAL recommendation and a TP of RM6.38 (FY13 P/E of 13.7x). We view that 2013 and 2014 petrochemical demand is likely to be met by new supplies from the Middle East, China, and also Africa, thus capping upside to prices and resulting in flattish earnings growth. Furthermore, new capacity for PChem only materialises in FY15 onwards. On valuation, PChem currently trades on par with global peers average of 13.7x which we view is fair given our neutral industry outlook.
Malaysia’s leading integrated gas based petrochemicals producer Petronas Chemicals Group (PChem) is the leading integrated natural gas based
petrochemicals producer in Malaysia and one of the largest producers in South East Asia. PChem has a total production capacity of more than 11m mtpa.
PChem is one of the lowest cost petrochemical producers globally because of low cost feedstock from PETRONAS. The group’s EBITDA margins are steady at above 30%, compared to naphtha based peers with margins <15%.
Steady demand for petrochemicals over the long term… ICIS has forecasted that barring severe global economic downturns, emerging markets
and economic recovery will be able to drive olefin & derivatives (O&D) demand by 4% annually (or roughly 10m mtpa) over the next 3-4 years.
In the M&F (methanol & fertilisers) segment, methanol demand will be driven by non-traditional usage like methanol-to-olefin (MTO) production while fertilisers will benefit from on-going agricultural activities in Malaysia and China.
…which is likely to be met by new supplies in the mid-term We view that steady demand for both O&D and F&M will largely be met by new supplies
thus keeping overall petrochemical prices flattish going forward. In the O&D scene, major ethylene chain capacity is emerging from China, Singapore and
Abu Dhabi in 2013. Also, 2 new MTO plants will be ready in China and Algeria by 1H13. In fertilisers, 2 major new facilities in Qatar have already started to drag down urea and
ammonia prices and will continue to influence prices as they reach full utilisation. That said, new capacities could trickle down into demand for methanol (from MTO
plants), and paraxylene (from new polyester plants in China).
Slowed growth seen for FY13 and FY14 During FY11 and FPE11 (9MDec11), PChem’s net profit (+36% and +27% y-o-y
respectively) were buoyed by rising petrochemical prices despite that utilisation of the group’s plants was hampered by unplanned shutdowns, and decline in contributions from JV and associates.
Going into FY13 though, with demand growth likely to be met by new supplies, we expect only mild net profit growth of 4.1% which will be driven largely by improved methanol and paraxylene prices. We also caution for weakness in 3Q13 due to major ethane cracker maintenance activities.
Our outlook for FY14 is equally unexciting, with 4.2% profit growth on the back of improved utilisation and continued improvement in methanol prices.
Initiating coverage with a NEUTRAL call and TP of RM6.38 PChem currently trades at FY13 P/E of 13.7x which is generally in line with their peers 1-
year rolling forward average of 14.0x and peers long term average of 13.7x. Pegging our FY13 EPS to 13.7x P/E derives our TP of RM6.38 and given the lack of upside we initiate coverage with a NEUTRAL recommendation.
Downside risks include a slowdown in global economy which would dampen demand for petrochemicals or major unplanned plant downtime. Upside risks include lengthy downtime by peers, which could create supply imbalances thus push up prices or stronger than expected global growth, which drives demand.
Petronas Chemicals Group Neutral Chemicals Bloomberg Ticker: PCHEM MK | Bursa Code: 5183
Initiating Coverage
Analyst Arhnue Tan [email protected] +603 2604 3909 12-month upside potential Target price 6.38 Current price (as at 15 Mar) 6.37 Capital upside (%) 0.1 Net dividends (%) 3.7 Total return (%) 3.8 Key stock information Syariah-compliant? Yes Market Cap (RM m) 50,960.0 Shares outstanding (m) 8,000.0 Free float (%) 23.2 52-week high / low (RM) 6.65 / 5.66 3-mth avg volume ('000) 2,872.4 3-mth avg turnover (RM m) 17.9 Share price performance 1M 3M 6M Absolute (%) 4.4 2.9 -1.2 Relative (%) 4.7 4.9 -0.3 Share price chart
Major shareholders % PETRONAS 64.4 Employees Provident Fund 12.4
Initiating Coverage | Petronas Chemicals Group | 18 March 2013
2
SNAPSHOT OF FINANCIAL AND VALUATION METRICS
Figure 1 : Key financial data
FYE 31 Dec FPE11* FY12A FY13F FY14F FY15F Revenue (RM m) 11,887.0 16,599.0 16,838.1 17,376.5 17,529.1 EBITDA (RM m) 4,508.0 5,464.0 5,883.0 6,132.7 6,139.6 EBIT (RM m) 3,721.0 5,802.0 6,207.8 6,474.8 6,432.5 Pretax profit (RM m) 3,897.0 4,550.0 5,381.9 5,634.6 5,646.2 Reported net profit (RM m) 2,621.0 3,518.0 3,723.8 3,882.1 3,856.4 Core net profit (RM m) 2,621.0 3,576.0 3,723.8 3,882.1 3,856.4 EPS (sen) 32.8 44.0 46.5 48.5 48.2 Core EPS (sen) 32.8 44.7 46.5 48.5 48.2 Alliance / Consensus (%) 96.1 98.0 93.9 Core EPS growth (%) (12.3) 36.4 4.1 4.2 (0.7) P/E (x) 19.4 14.3 13.7 13.1 13.2 EV/EBITDA (x) 10.1 7.9 6.7 6.1 5.8 ROE (%) 13.1 17.3 15.7 15.1 14.0 Net gearing (%) Net Cash Net Cash Net Cash Net Cash Net Cash Net DPS (sen) 16.00 21.5 23.3 24.3 24.1 Net dividend yield (%) 2.51 3.4 3.7 3.8 3.8 BV/share (RM) 2.51 2.54 2.97 3.21 3.45 P/B (x) 2.5 2.5 2.1 2.0 1.8 *FPE11 reflects a 9M period due to change of financial year from March to Dec Source: Alliance Research, Bloomberg
Initiating Coverage | Petronas Chemicals Group | 18 March 2013
3
Figure 4 : Peer comparison
Company Call Local Currency
Target price
Share price
Mkt Cap (USD m)
EPS Growth (%) P/E (x) P/BV (x) ROE (%)
Net Dividend Yield (%)
CY13 CY14 CY13 CY14 CY13 CY14 CY13 CY14 CY13 CY14 Petronas Chemicals Neutral RM 6.38 6.37 16,328.1 4.1 4.2 13.7 13.1 2.1 2.0 15.7 15.1 3.7 3.8 PTT Global Chemicals NR THB NR 73.75 11,226.5 5.5 5.6 9.4 8.9 1.4 1.3 15.1 14.6 4.4 4.8 Siam Cement NR THB NR 500.00 20,256.6 40.5 21.3 18.1 14.9 3.6 3.1 21.3 22.6 2.9 3.3 Indorama Ventures NR THB NR 23.40 3,803.3 154.3 30.3 14.7 11.3 1.7 1.5 11.3 13.7 2.2 2.7 Tata Chemicals NR INR NR 320.90 1,512.8 21.3 10.4 8.7 7.9 1.1 1.0 13.2 13.8 3.4 3.7 Sabic NR SAR NR 94.00 75,195.0 13.6 4.4 10.0 9.6 1.8 1.7 18.0 17.6 5.6 5.8 Yanbu National NR SAR NR 51.75 7,762.0 12.6 6.7 10.6 9.9 2.0 1.8 19.6 19.0 5.1 6.4 NIC NR SAR NR 30.10 5,368.8 10.5 16.4 10.3 8.9 1.6 1.4 14.7 14.7 5.5 6.4 Sinopec Shanghai NR CNY NR 6.04 5,724.8 153.0 6.6 49.5 46.5 2.5 2.4 -8.8 6.5 0.1 N/A Formosa Chem& Fib NR TWD NR 73.90 14,156.8 218.9 10.6 19.8 17.9 1.7 1.7 2.6 6.1 3.0 4.0 Formosa Plastics NR TWD NR 74.50 15,351.2 74.9 13.8 17.8 15.6 1.9 1.8 6.0 10.0 3.3 4.5 Dow Chemical NR US NR 33.81 40,719.6 24.6 24.7 14.3 11.5 1.9 1.8 13.7 15.7 3.9 4.0 Eastman Chemicals NR US NR 72.60 11,177.2 19.3 11.5 11.3 10.1 3.8 3.1 33.0 37.8 1.5 1.7 Average 39.7 11.8 14.0 12.5 2.1 1.9 16.0 16.7 4.1 4.6 Source: Alliance Research, Bloomberg Share price date: 15 Mar 2013
Initiating Coverage | Petronas Chemicals Group | 18 March 2013
4
BACKGROUND Malaysia’s leading integrated gas based petrochemicals producer Petronas Chemicals Group (PChem) is the leading integrated natural gas based petrochemicals producer in Malaysia and one of the largest petrochemical producers in South East Asia. PChem was listed in Nov 2010 and is a subsidiary of PETRONAS Group which has a 64.4% stake in the company. Having been in operation for more than 25 years, PChem manufactures, markets and sells a diversified range of petrochemical products, including olefins, polymers, fertilisers, methanol and other basic chemicals and derivative products. In South East Asia, PChem is one of the only 2 natural gas based producers of petrochemicals, the other company being Thailand’s PTT Global Chemicals (PTTCH). PChem has a total production capacity of more than 11m mtpa inclusive of its joint ventures and associates. The company has 2 integrated olefin and derivatives (O&D) petrochemical complexes (IPC) at Kertih and Gebeng and 3 manufacturing complexes in Gurun, Bintulu and Labuan which focus on methanol and fertiliser (M&F). Associate company Idemitsu Styrene Monomer is located in Pasir Gudang, Johor while a joint venture with BASF is located in Gebeng which produces ethylene derivative products. Outside Malaysia, PChem has a PVC plant in Vung Tau, Vietnam. A snapshot of PChem’s corporate structure is in Figure 5 below.
Figure 5 : PChem’s corporate structure
Source: Company
One of only two natural gas based petrochemical producers in SEA
More than 11m mtpa total production capacity
Operating out of Kertih, Gebeng,
Gurun, Bintulu, Labuan, Pasir Gudang and Vietnam
Initiating Coverage | Petronas Chemicals Group | 18 March 2013
5
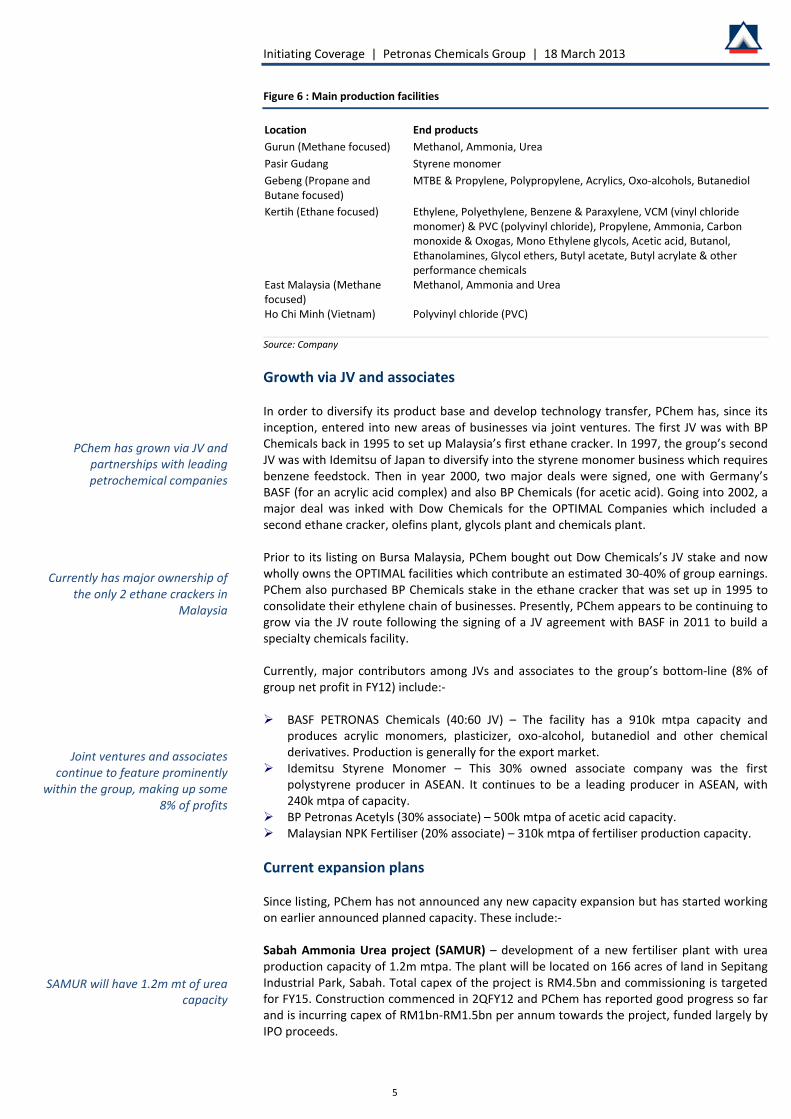
Figure 6 : Main production facilities
Location End products Gurun (Methane focused) Methanol, Ammonia, Urea Pasir Gudang Styrene monomer Gebeng (Propane and Butane focused)
Ho Chi Minh (Vietnam) Polyvinyl chloride (PVC) Source: Company Growth via JV and associates In order to diversify its product base and develop technology transfer, PChem has, since its inception, entered into new areas of businesses via joint ventures. The first JV was with BP Chemicals back in 1995 to set up Malaysia’s first ethane cracker. In 1997, the group’s second JV was with Idemitsu of Japan to diversify into the styrene monomer business which requires benzene feedstock. Then in year 2000, two major deals were signed, one with Germany’s BASF (for an acrylic acid complex) and also BP Chemicals (for acetic acid). Going into 2002, a major deal was inked with Dow Chemicals for the OPTIMAL Companies which included a second ethane cracker, olefins plant, glycols plant and chemicals plant. Prior to its listing on Bursa Malaysia, PChem bought out Dow Chemicals’s JV stake and now wholly owns the OPTIMAL facilities which contribute an estimated 30-40% of group earnings. PChem also purchased BP Chemicals stake in the ethane cracker that was set up in 1995 to consolidate their ethylene chain of businesses. Presently, PChem appears to be continuing to grow via the JV route following the signing of a JV agreement with BASF in 2011 to build a specialty chemicals facility. Currently, major contributors among JVs and associates to the group’s bottom-line (8% of group net profit in FY12) include:- BASF PETRONAS Chemicals (40:60 JV) – The facility has a 910k mtpa capacity and
produces acrylic monomers, plasticizer, oxo-alcohol, butanediol and other chemical derivatives. Production is generally for the export market.
Idemitsu Styrene Monomer – This 30% owned associate company was the first polystyrene producer in ASEAN. It continues to be a leading producer in ASEAN, with 240k mtpa of capacity.
BP Petronas Acetyls (30% associate) – 500k mtpa of acetic acid capacity. Malaysian NPK Fertiliser (20% associate) – 310k mtpa of fertiliser production capacity. Current expansion plans Since listing, PChem has not announced any new capacity expansion but has started working on earlier announced planned capacity. These include:- Sabah Ammonia Urea project (SAMUR) – development of a new fertiliser plant with urea production capacity of 1.2m mtpa. The plant will be located on 166 acres of land in Sepitang Industrial Park, Sabah. Total capex of the project is RM4.5bn and commissioning is targeted for FY15. Construction commenced in 2QFY12 and PChem has reported good progress so far and is incurring capex of RM1bn-RM1.5bn per annum towards the project, funded largely by IPO proceeds.
PChem has grown via JV and partnerships with leading petrochemical companies
Currently has major ownership of the only 2 ethane crackers in
Malaysia
Joint ventures and associates continue to feature prominently
within the group, making up some 8% of profits
SAMUR will have 1.2m mt of urea capacity
Initiating Coverage | Petronas Chemicals Group | 18 March 2013
6
Participation in RAPID – Refinery and Petrochemical Integrated Development (RAPID) is a PETRONAS project but given its 50% petrochemical component, we believe that PChem will be involved in it. RAPID hopes to have 3m mtpa of olefin capacity and we view that PChem’s involvement will likely be for the ethane cracker within the facility. PETRONAS has kicked off awards for RAPID, giving INEOS Technologies (INEOS) the LL/HDPE (low linear and high density polyethylene) portion of the RAPID project. The INEOS facility will have a capacity of 350k mtpa. PETRONAS also signed a letter of intent with Evonik to jointly embark on the development of production facilities of specialty chemicals. Further to that, in mid-2012, PETRONAS had also signed a Heads of Agreement with Versalis SpA to construct and operate an elastomer plant within RAPID. PChem’s investment commitment for RAPID will be known in mid-2013 and the project is currently earmarked to commence in 2016. To note, the entire RAPID project is estimated to cost USD20bn and the petrochemicals portion has been guided to be up to 50% of that sum. Portfolio optimisation – discontinuing vinyl business in Malaysia Besides the adding of new capacity, PChem has also recently announced that they were taking their vinyl business offline. The vinyl business consists of 3 plants which produce vinyl chloride monomer (VCM), which is then turned into polyvinyl chloride (PVC). PVC is typically marketed to industries which convert it into items like pipes, roofing tiles, wires and cables. The discontinuation of the vinyl business was completed in 4QFY12 and will incur a charge of up to RM560m which will take full impact in 1Q13. The group stated that the RM560m charge includes decommissioning costs (50%), contract termination dues (30%), and the remaining relating of impairment of remaining assets. So far, the group has provided for RM490m in 4QFY12. PChem’s rationale for exiting the PVC business in Malaysia was that the vinyl business was not performing up to mark and was also not fully integrated with the rest of the group’s O&D business. Furthermore, up to 320,000 mtpa of the vinyl’s business ethylene di-chloride (EDC) feedstock is sourced from the open market with only up to 90,000 mtpa of ethylene supplied by PChem’s ethane cracker. As such, the group’s vinyl business has been highly susceptible to the cyclicality of EDC feedstock market. To note, PChem continues to run their PVC business in Vung Tau, Vietnam but this is also earmarked to be sold in FY13 or FY14. Also, as the group is ceasing the vinyl business in Malaysia, they would free up roughly 90,000mtpa of ethylene feedstock which we believe will be directed into the polymer business or sold to the market. Besides the charge of RM560m, earnings impact from the cessation of the vinyl business in FY13 onwards is negligible, at <5% of bottom line only.
INVESTMENT CASE Two core segments PChem’s business can be divided into two operating business segments which are:- Olefins and derivatives (O&D) Methanol and fertilisers (M&F) The O&D segment has a feedstock base of ethane, propane, butane and heavy naphta. Key products of the segment include ethylene glycols (MEG), polymers (polyethylene and poly-propylene), aromatics (paraxylene and benzene) as well as other derivatives. O&D are produced out of the 2 IPC’s in Kertih and Gebeng. In FY12, the segment is the largest contributor to group revenue at 71% and the largest contributor to group EBITDA at 67%. The M&F segment has a feedstock base of methane and key products include methanol, ammonia and urea. Production bases are at Gurun, Bintulu and Labuan. The M&F division is much smaller than the O&D division. In FY12, it made up 29% of group revenue and 33% of group EBITDA.
PChem expected to feature prominently in the RAPID project
come mid 2013
Besides adding capacity, PChem is also streamlining their business via discontinuation of the PVC business
The PVC business has not been performing and is not fully
integrated with the group’s operations
Additional ethylene capacity will be freed up with the closure of the
vinyl business
O&D segment makes up 67% of group FY12 EBITDA
M&F segment contributes 33% of group FY12 EBITDA
Initiating Coverage | Petronas Chemicals Group | 18 March 2013
7
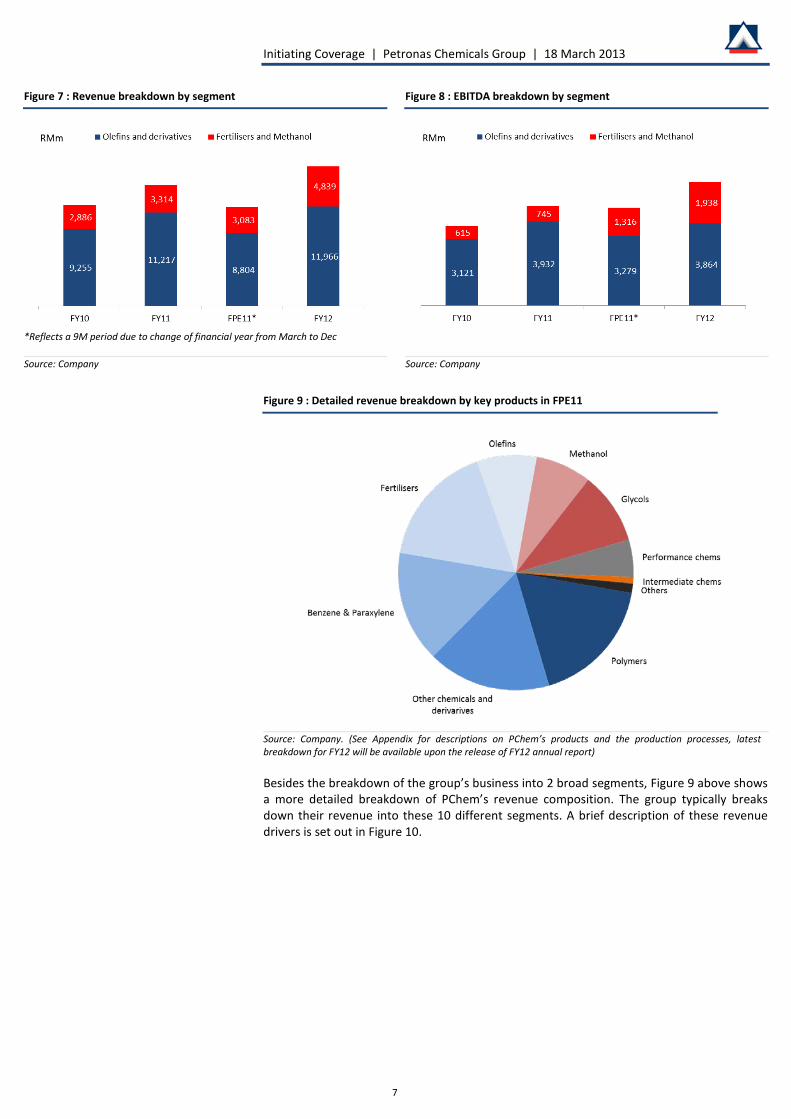
Figure 7 : Revenue breakdown by segment Figure 8 : EBITDA breakdown by segment
*Reflects a 9M period due to change of financial year from March to Dec Source: Company Source: Company
Figure 9 : Detailed revenue breakdown by key products in FPE11
Source: Company. (See Appendix for descriptions on PChem’s products and the production processes, latest breakdown for FY12 will be available upon the release of FY12 annual report) Besides the breakdown of the group’s business into 2 broad segments, Figure 9 above shows a more detailed breakdown of PChem’s revenue composition. The group typically breaks down their revenue into these 10 different segments. A brief description of these revenue drivers is set out in Figure 10.
Initiating Coverage | Petronas Chemicals Group | 18 March 2013
8
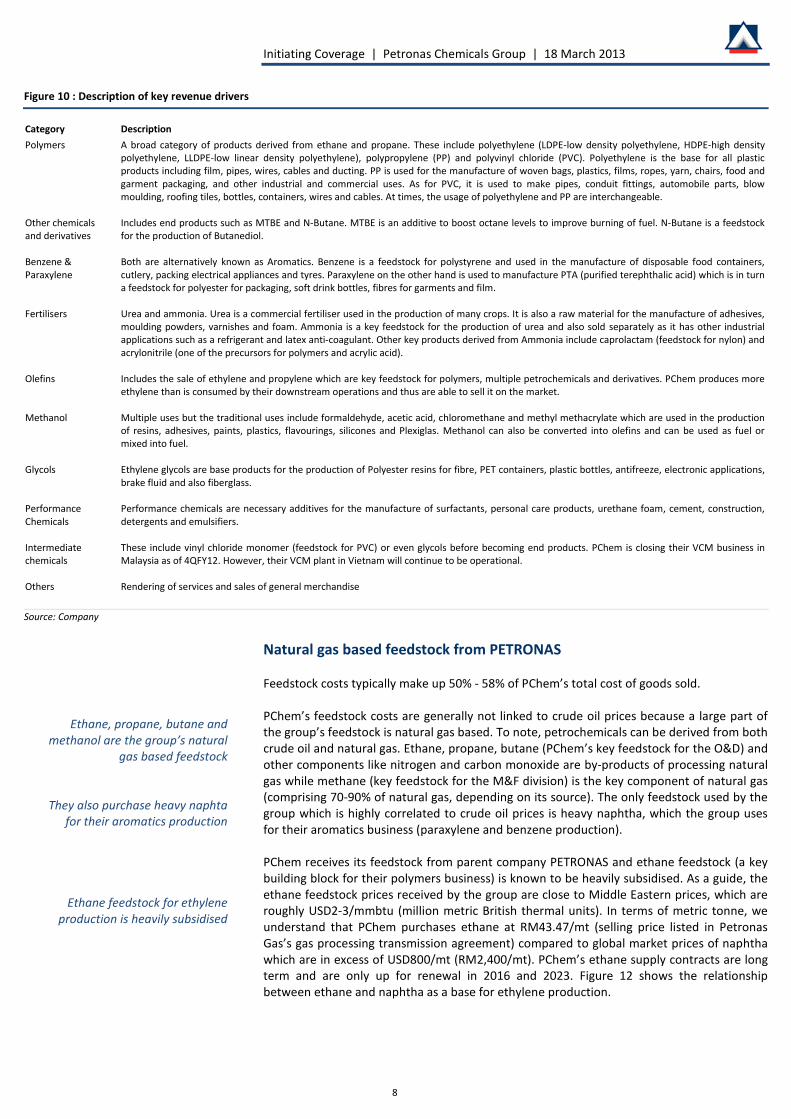
Figure 10 : Description of key revenue drivers
Category Description Polymers A broad category of products derived from ethane and propane. These include polyethylene (LDPE-low density polyethylene, HDPE-high density
polyethylene, LLDPE-low linear density polyethylene), polypropylene (PP) and polyvinyl chloride (PVC). Polyethylene is the base for all plastic products including film, pipes, wires, cables and ducting. PP is used for the manufacture of woven bags, plastics, films, ropes, yarn, chairs, food and garment packaging, and other industrial and commercial uses. As for PVC, it is used to make pipes, conduit fittings, automobile parts, blow moulding, roofing tiles, bottles, containers, wires and cables. At times, the usage of polyethylene and PP are interchangeable.
Other chemicals and derivatives
Includes end products such as MTBE and N-Butane. MTBE is an additive to boost octane levels to improve burning of fuel. N-Butane is a feedstock for the production of Butanediol.
Benzene & Paraxylene
Both are alternatively known as Aromatics. Benzene is a feedstock for polystyrene and used in the manufacture of disposable food containers, cutlery, packing electrical appliances and tyres. Paraxylene on the other hand is used to manufacture PTA (purified terephthalic acid) which is in turn a feedstock for polyester for packaging, soft drink bottles, fibres for garments and film.
Fertilisers Urea and ammonia. Urea is a commercial fertiliser used in the production of many crops. It is also a raw material for the manufacture of adhesives, moulding powders, varnishes and foam. Ammonia is a key feedstock for the production of urea and also sold separately as it has other industrial applications such as a refrigerant and latex anti-coagulant. Other key products derived from Ammonia include caprolactam (feedstock for nylon) and acrylonitrile (one of the precursors for polymers and acrylic acid).
Olefins Includes the sale of ethylene and propylene which are key feedstock for polymers, multiple petrochemicals and derivatives. PChem produces more ethylene than is consumed by their downstream operations and thus are able to sell it on the market.
Methanol Multiple uses but the traditional uses include formaldehyde, acetic acid, chloromethane and methyl methacrylate which are used in the production of resins, adhesives, paints, plastics, flavourings, silicones and Plexiglas. Methanol can also be converted into olefins and can be used as fuel or mixed into fuel.
Glycols Ethylene glycols are base products for the production of Polyester resins for fibre, PET containers, plastic bottles, antifreeze, electronic applications, brake fluid and also fiberglass.
Performance Chemicals
Performance chemicals are necessary additives for the manufacture of surfactants, personal care products, urethane foam, cement, construction, detergents and emulsifiers.
Intermediate chemicals
These include vinyl chloride monomer (feedstock for PVC) or even glycols before becoming end products. PChem is closing their VCM business in Malaysia as of 4QFY12. However, their VCM plant in Vietnam will continue to be operational.
Others Rendering of services and sales of general merchandise Source: Company
Natural gas based feedstock from PETRONAS Feedstock costs typically make up 50% - 58% of PChem’s total cost of goods sold. PChem’s feedstock costs are generally not linked to crude oil prices because a large part of the group’s feedstock is natural gas based. To note, petrochemicals can be derived from both crude oil and natural gas. Ethane, propane, butane (PChem’s key feedstock for the O&D) and other components like nitrogen and carbon monoxide are by-products of processing natural gas while methane (key feedstock for the M&F division) is the key component of natural gas (comprising 70-90% of natural gas, depending on its source). The only feedstock used by the group which is highly correlated to crude oil prices is heavy naphtha, which the group uses for their aromatics business (paraxylene and benzene production). PChem receives its feedstock from parent company PETRONAS and ethane feedstock (a key building block for their polymers business) is known to be heavily subsidised. As a guide, the ethane feedstock prices received by the group are close to Middle Eastern prices, which are roughly USD2-3/mmbtu (million metric British thermal units). In terms of metric tonne, we understand that PChem purchases ethane at RM43.47/mt (selling price listed in Petronas Gas’s gas processing transmission agreement) compared to global market prices of naphtha which are in excess of USD800/mt (RM2,400/mt). PChem’s ethane supply contracts are long term and are only up for renewal in 2016 and 2023. Figure 12 shows the relationship between ethane and naphtha as a base for ethylene production.
Ethane, propane, butane and methanol are the group’s natural
gas based feedstock
They also purchase heavy naphta for their aromatics production
Ethane feedstock for ethylene production is heavily subsidised
Initiating Coverage | Petronas Chemicals Group | 18 March 2013
9
As for propane and butane, we understand that PChem buys these feedstocks at close to market prices. According to the Petronas Gas GPTA (gas processing and transmission agreement), it is indeed the case that the group’s propane and butane are sold at market prices which are above USD900/mt. As for methane, we understand that prices are subsidised and below market but purchase prices are not disclosed. However, the group has noted that methane prices still fluctuate a little as it tracks a specific basket of global prices. Naphta is also purchased at market prices and make up an estimated 30-40% of raw material costs. Feedstocks are delivered to PChem’s IPCs and manufacturing plants via the Peninsula Gas Utility pipeline owned by Petronas Gas and also directly from PETRONAS offshore facilities to processing plants in Bintulu and Labuan. PChem does not purchase feedstock from any other suppliers. Even heavy naptha feedstock is purchased from PETRONAS cracking plants for their aromatics business. According to studies done by Nexant, PChem is amongst the lowest cost major producers of ethylene (ethylene is derived from cracking ethane or naphtha) and ethylene derivatives in the world.
Figure 11 : Feedstock used by PChem
Raw material Usage Supplier Methane Feedstock for methanol, ammonia and urea PETRONAS Ethane Feedstock for ethylene PETRONAS Carigali Propane Feedstock for propylene PETRONAS Butane Feedstock for n-butane and MTBE PETRONAS Heavy Naptha Feedstock for paraxylene and benzene PETRONAS Penapisan (Terengganu) Source: Company
Figure 12 : Ethane vs. Naphta Figure 13 : Olefin producers in Asia
Other feedstock like propane, butane, naphtha and methane are
purchased at prices close to market prices
PChem’s ethane feedstock is one of the lowest priced globally
Initiating Coverage | Petronas Chemicals Group | 18 March 2013
10
One of the strongest margins in the industry Having a gas based petrochemical operation hinges upon the proximity of gas supply and also feedstock arrangements with a supplier like PETRONAS. As shown in Figure 13 above, there are currently only 2 gas based petrochemical producers in South East Asia which are PChem and Thailand’s PTT Global Chemicals. In greater Asia, gas based producers also include the Middle East while globally, producers in China and the US are becoming increasingly gas based. A predominantly low cost gas based feedstock as opposed to a largely naphtha based feedstock is highly advantageous for petrochemical production as can be seen in Figure 12 and Figure 14 which maps out the latest margins of PChem’s peers. We highlight from the table that the PChem’s EBITDA margins which are above 30% are on par with the Middle East producers which have one of the strongest margins in the industry. Comparatively, naphtha based producers are seen to have EBITDA margins largely below 15%.
Figure 14 : EBITDA margin comparisons with peers
12M12
EBITDA 12M11 EBITDA
Notes
PChem Group 35.0% 37.0% Cheap and/or subsidised natural gas based feedstock
- O&D 32.3% 36.8% Subsidised ethane feedstock provides the group with strong margins
PTT Global Chem 9.5% 11.2% Combination of gas based feedstock and naphtha. Includes refining business. No M&F division.
Siam Cement 8.7% 9.8% Naphtha based feedstock
Chandra Asri
2.3%^ 4.3% Naphtha based feedstock
Indorama 5.7% 8.2% Combination of gas based feedstock and naphtha. More focus on downstream paraxylene business for polyester.
SABIC 28.8% 31.9% Low cost natural gas based ethane feedstock. Has both O&D and F&M business.
YANSAB 41.9% 48.0% Low cost natural gas based feedstock for ethylene chain products
FORMOSA Chem & Fib 4.1%^ 14.1% Naphtha based feedstock
Formosa Plastics -0.5%^ 9.9% Naphtha based feedstock
Formosa Petrochemical -0.3%^ 4.2% Naphtha based feedstock
Dow Chemicals 11.5% 11.3% Combination of gas based feedstock and naphtha. Includes refining business
Eastman Chemicals 15.8% 16.7% Combination of gas based feedstock and naphtha.
^Based on the 9MCY12 period as 4QCY12 data is not yet available Source: Bloomberg, Company data
PTT Global Chemical from Thailand is the only other gas based
petrochemical producer in SEA
PChem’s margins are higher than peers except those from the Middle
East which have access to cheap feedstock
Initiating Coverage | Petronas Chemicals Group | 18 March 2013
11
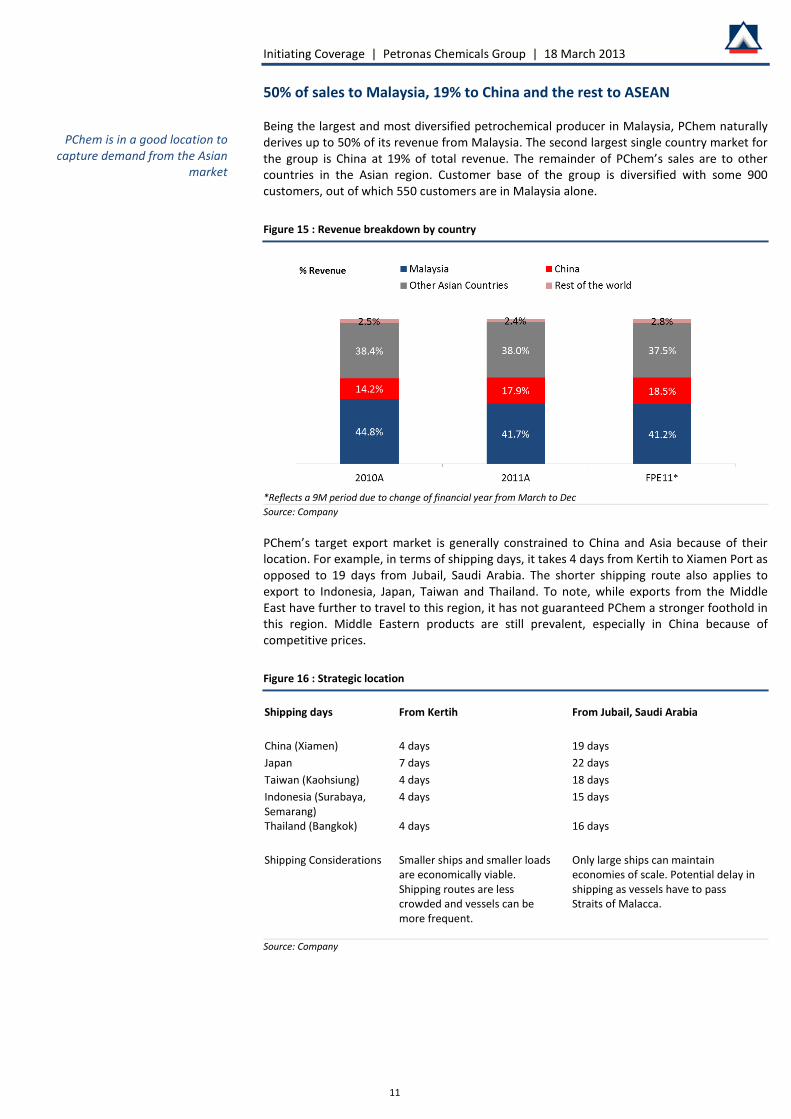
50% of sales to Malaysia, 19% to China and the rest to ASEAN Being the largest and most diversified petrochemical producer in Malaysia, PChem naturally derives up to 50% of its revenue from Malaysia. The second largest single country market for the group is China at 19% of total revenue. The remainder of PChem’s sales are to other countries in the Asian region. Customer base of the group is diversified with some 900 customers, out of which 550 customers are in Malaysia alone.
Figure 15 : Revenue breakdown by country
*Reflects a 9M period due to change of financial year from March to Dec Source: Company PChem’s target export market is generally constrained to China and Asia because of their location. For example, in terms of shipping days, it takes 4 days from Kertih to Xiamen Port as opposed to 19 days from Jubail, Saudi Arabia. The shorter shipping route also applies to export to Indonesia, Japan, Taiwan and Thailand. To note, while exports from the Middle East have further to travel to this region, it has not guaranteed PChem a stronger foothold in this region. Middle Eastern products are still prevalent, especially in China because of competitive prices.
Figure 16 : Strategic location
Shipping days From Kertih From Jubail, Saudi Arabia China (Xiamen) 4 days 19 days Japan 7 days 22 days Taiwan (Kaohsiung) 4 days 18 days Indonesia (Surabaya, Semarang)
4 days 15 days
Thailand (Bangkok) 4 days 16 days Shipping Considerations Smaller ships and smaller loads
are economically viable. Shipping routes are less crowded and vessels can be more frequent.
Only large ships can maintain economies of scale. Potential delay in shipping as vessels have to pass Straits of Malacca.
Source: Company
PChem is in a good location to capture demand from the Asian
market
Initiating Coverage | Petronas Chemicals Group | 18 March 2013
12
INDUSTRY OUTLOOK – O&D Steady demand growth expected over the longer term ICIS (Independent Chemical Information Service) has forecasted that barring severe global economic downturn, emerging markets and global economic recovery will be able to drive O&D industry demand by 4% annually over the next 3-4 years. This would equate to the need for 10m mt of new capacity annually. Over the longer term, ICIS continues to forecast annual O&D demand growth of 3.5% per annum, still translating into demand for 10-11m mt of new capacity annually. Immediate demand is inducing price recovery Prices of O&D have been mixed over 2012. Polymer, MEG and aromatics prices were generally weak in 1HFY12 due to slow demand from China. However, prices were seen recovering in June 2012 onwards on the back of improved demand for MEG and polymers while aromatics prices trended up strongly as new PTA (purified terepthalic acid, a raw material for polyester) capacity drove demand for paraxylene.
ICIS forecasts steady demand growth for O&D going forward
Initiating Coverage | Petronas Chemicals Group | 18 March 2013
13
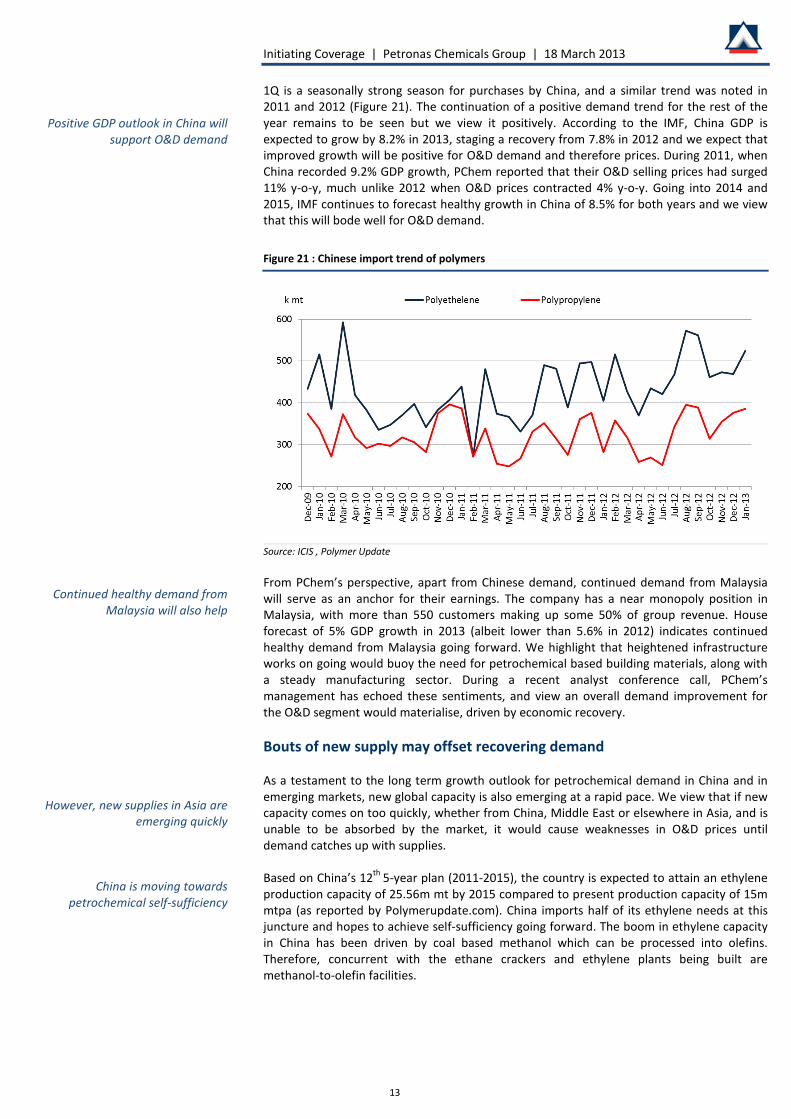
1Q is a seasonally strong season for purchases by China, and a similar trend was noted in 2011 and 2012 (Figure 21). The continuation of a positive demand trend for the rest of the year remains to be seen but we view it positively. According to the IMF, China GDP is expected to grow by 8.2% in 2013, staging a recovery from 7.8% in 2012 and we expect that improved growth will be positive for O&D demand and therefore prices. During 2011, when China recorded 9.2% GDP growth, PChem reported that their O&D selling prices had surged 11% y-o-y, much unlike 2012 when O&D prices contracted 4% y-o-y. Going into 2014 and 2015, IMF continues to forecast healthy growth in China of 8.5% for both years and we view that this will bode well for O&D demand.
Figure 21 : Chinese import trend of polymers
Source: ICIS , Polymer Update From PChem’s perspective, apart from Chinese demand, continued demand from Malaysia will serve as an anchor for their earnings. The company has a near monopoly position in Malaysia, with more than 550 customers making up some 50% of group revenue. House forecast of 5% GDP growth in 2013 (albeit lower than 5.6% in 2012) indicates continued healthy demand from Malaysia going forward. We highlight that heightened infrastructure works on going would buoy the need for petrochemical based building materials, along with a steady manufacturing sector. During a recent analyst conference call, PChem’s management has echoed these sentiments, and view an overall demand improvement for the O&D segment would materialise, driven by economic recovery. Bouts of new supply may offset recovering demand As a testament to the long term growth outlook for petrochemical demand in China and in emerging markets, new global capacity is also emerging at a rapid pace. We view that if new capacity comes on too quickly, whether from China, Middle East or elsewhere in Asia, and is unable to be absorbed by the market, it would cause weaknesses in O&D prices until demand catches up with supplies. Based on China’s 12th 5-year plan (2011-2015), the country is expected to attain an ethylene production capacity of 25.56m mt by 2015 compared to present production capacity of 15m mtpa (as reported by Polymerupdate.com). China imports half of its ethylene needs at this juncture and hopes to achieve self-sufficiency going forward. The boom in ethylene capacity in China has been driven by coal based methanol which can be processed into olefins. Therefore, concurrent with the ethane crackers and ethylene plants being built are methanol-to-olefin facilities.
Positive GDP outlook in China will support O&D demand
Continued healthy demand from Malaysia will also help
However, new supplies in Asia are emerging quickly
China is moving towards petrochemical self-sufficiency
Initiating Coverage | Petronas Chemicals Group | 18 March 2013
14
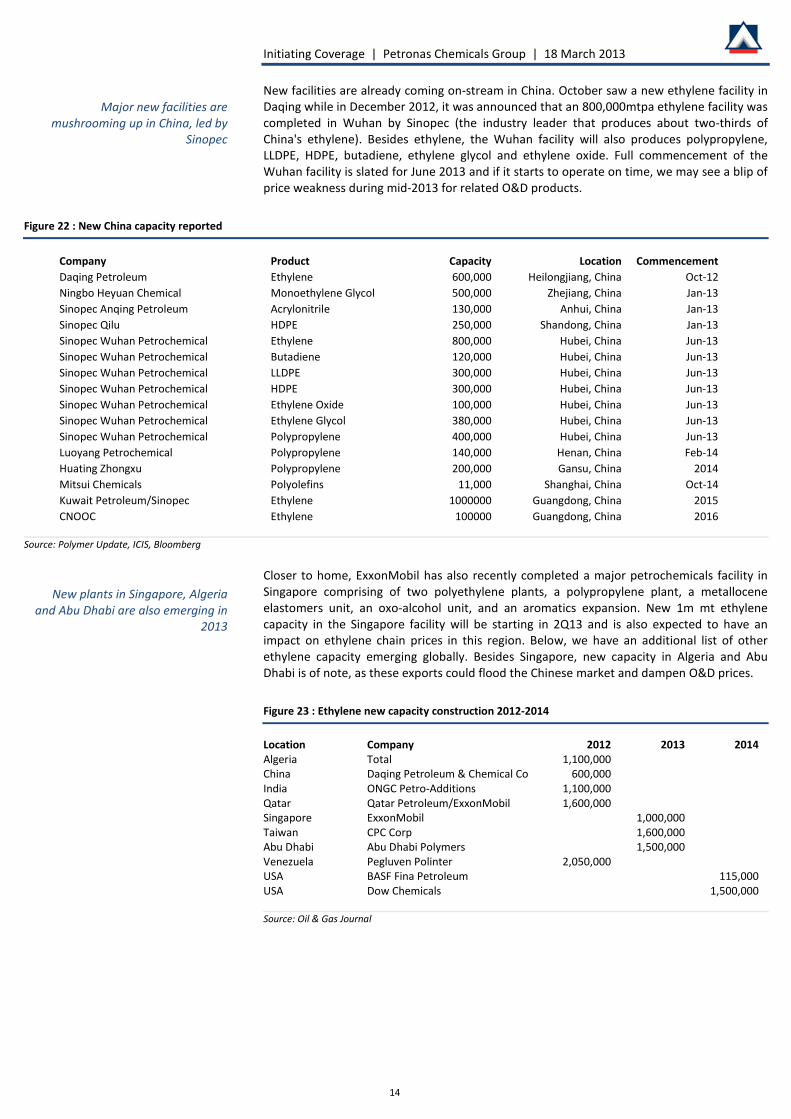
New facilities are already coming on-stream in China. October saw a new ethylene facility in Daqing while in December 2012, it was announced that an 800,000mtpa ethylene facility was completed in Wuhan by Sinopec (the industry leader that produces about two-thirds of China's ethylene). Besides ethylene, the Wuhan facility will also produces polypropylene, LLDPE, HDPE, butadiene, ethylene glycol and ethylene oxide. Full commencement of the Wuhan facility is slated for June 2013 and if it starts to operate on time, we may see a blip of price weakness during mid-2013 for related O&D products.
Figure 22 : New China capacity reported
Company Product Capacity Location Commencement Daqing Petroleum Ethylene 600,000 Heilongjiang, China Oct-12 Ningbo Heyuan Chemical Monoethylene Glycol 500,000 Zhejiang, China Jan-13 Sinopec Anqing Petroleum Acrylonitrile 130,000 Anhui, China Jan-13 Sinopec Qilu HDPE 250,000 Shandong, China Jan-13 Sinopec Wuhan Petrochemical Ethylene 800,000 Hubei, China Jun-13 Sinopec Wuhan Petrochemical Butadiene 120,000 Hubei, China Jun-13 Sinopec Wuhan Petrochemical LLDPE 300,000 Hubei, China Jun-13 Sinopec Wuhan Petrochemical HDPE 300,000 Hubei, China Jun-13 Sinopec Wuhan Petrochemical Ethylene Oxide 100,000 Hubei, China Jun-13 Sinopec Wuhan Petrochemical Ethylene Glycol 380,000 Hubei, China Jun-13 Sinopec Wuhan Petrochemical Polypropylene 400,000 Hubei, China Jun-13 Luoyang Petrochemical Polypropylene 140,000 Henan, China Feb-14 Huating Zhongxu Polypropylene 200,000 Gansu, China 2014 Mitsui Chemicals Polyolefins 11,000 Shanghai, China Oct-14 Kuwait Petroleum/Sinopec Ethylene 1000000 Guangdong, China 2015 CNOOC Ethylene 100000 Guangdong, China 2016
Source: Polymer Update, ICIS, Bloomberg
Closer to home, ExxonMobil has also recently completed a major petrochemicals facility in Singapore comprising of two polyethylene plants, a polypropylene plant, a metallocene elastomers unit, an oxo-alcohol unit, and an aromatics expansion. New 1m mt ethylene capacity in the Singapore facility will be starting in 2Q13 and is also expected to have an impact on ethylene chain prices in this region. Below, we have an additional list of other ethylene capacity emerging globally. Besides Singapore, new capacity in Algeria and Abu Dhabi is of note, as these exports could flood the Chinese market and dampen O&D prices.
Figure 23 : Ethylene new capacity construction 2012-2014
Location Company 2012 2013 2014 Algeria Total 1,100,000 China Daqing Petroleum & Chemical Co 600,000 India ONGC Petro-Additions 1,100,000 Qatar Qatar Petroleum/ExxonMobil 1,600,000 Singapore ExxonMobil 1,000,000 Taiwan CPC Corp 1,600,000 Abu Dhabi Abu Dhabi Polymers 1,500,000 Venezuela Pegluven Polinter 2,050,000 USA BASF Fina Petroleum 115,000 USA Dow Chemicals 1,500,000 Source: Oil & Gas Journal
Major new facilities are mushrooming up in China, led by
Sinopec
New plants in Singapore, Algeria and Abu Dhabi are also emerging in
2013
Initiating Coverage | Petronas Chemicals Group | 18 March 2013
15
Silver lining for aromatics While the outlook on polymers and MEG is unexciting in 2013 because demand growth is likely to be met by supply growth, there is a silver lining for aromatics like paraxylene, we believe. Along with new ethylene chain capacity in China, new PTA capacity is also emerging. From PolymerUpdate data, it was noted that some 2.25m mtpa of new PTA capacity will be completed in 2013 in China and with the lack of new aromatics capacity emerging to support the new PTA plants, we view that the outlook for paraxylene is positive. To note, a key feedstock to produce PTA (key use is to be made into fibres like polyester) is paraxylene. Currently, aromatics contribute to about 15% of PChem’s total revenue and an estimated 6-8% of group profits.
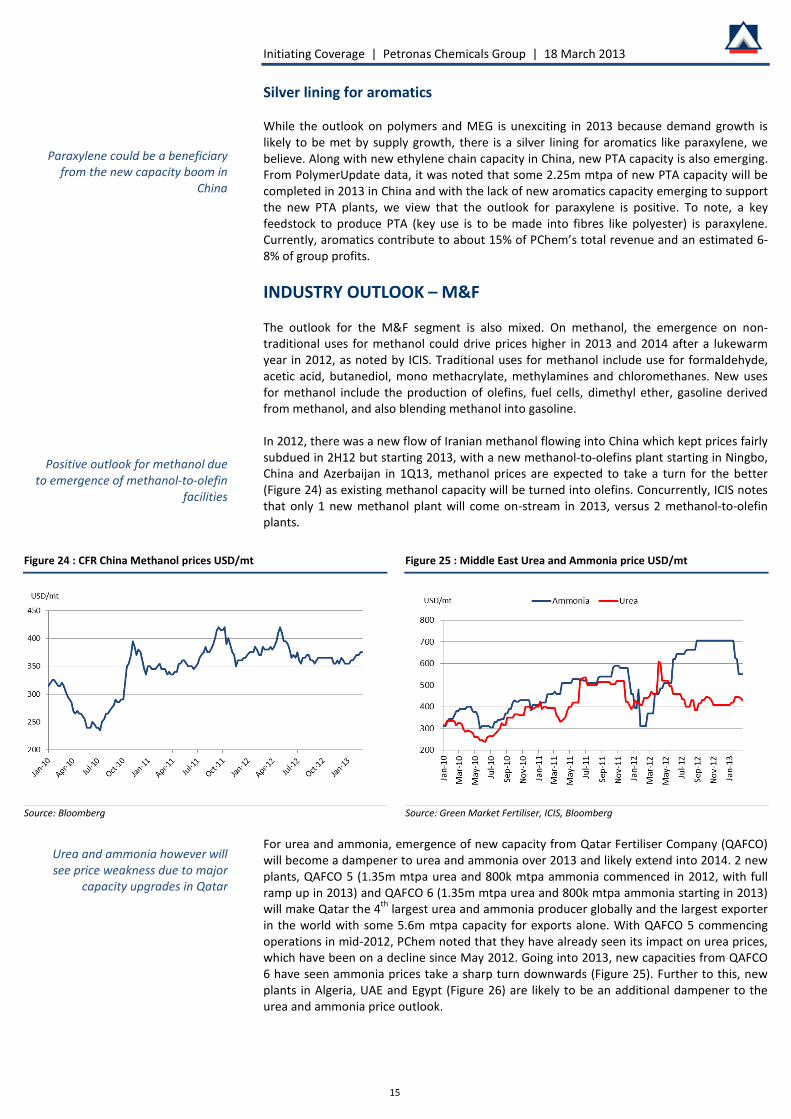
INDUSTRY OUTLOOK – M&F The outlook for the M&F segment is also mixed. On methanol, the emergence on non-traditional uses for methanol could drive prices higher in 2013 and 2014 after a lukewarm year in 2012, as noted by ICIS. Traditional uses for methanol include use for formaldehyde, acetic acid, butanediol, mono methacrylate, methylamines and chloromethanes. New uses for methanol include the production of olefins, fuel cells, dimethyl ether, gasoline derived from methanol, and also blending methanol into gasoline. In 2012, there was a new flow of Iranian methanol flowing into China which kept prices fairly subdued in 2H12 but starting 2013, with a new methanol-to-olefins plant starting in Ningbo, China and Azerbaijan in 1Q13, methanol prices are expected to take a turn for the better (Figure 24) as existing methanol capacity will be turned into olefins. Concurrently, ICIS notes that only 1 new methanol plant will come on-stream in 2013, versus 2 methanol-to-olefin plants.
Figure 24 : CFR China Methanol prices USD/mt Figure 25 : Middle East Urea and Ammonia price USD/mt
Source: Bloomberg Source: Green Market Fertiliser, ICIS, Bloomberg
For urea and ammonia, emergence of new capacity from Qatar Fertiliser Company (QAFCO) will become a dampener to urea and ammonia over 2013 and likely extend into 2014. 2 new plants, QAFCO 5 (1.35m mtpa urea and 800k mtpa ammonia commenced in 2012, with full ramp up in 2013) and QAFCO 6 (1.35m mtpa urea and 800k mtpa ammonia starting in 2013) will make Qatar the 4th largest urea and ammonia producer globally and the largest exporter in the world with some 5.6m mtpa capacity for exports alone. With QAFCO 5 commencing operations in mid-2012, PChem noted that they have already seen its impact on urea prices, which have been on a decline since May 2012. Going into 2013, new capacities from QAFCO 6 have seen ammonia prices take a sharp turn downwards (Figure 25). Further to this, new plants in Algeria, UAE and Egypt (Figure 26) are likely to be an additional dampener to the urea and ammonia price outlook.
Paraxylene could be a beneficiary from the new capacity boom in
China
Positive outlook for methanol due to emergence of methanol-to-olefin
facilities
Urea and ammonia however will see price weakness due to major
capacity upgrades in Qatar
Initiating Coverage | Petronas Chemicals Group | 18 March 2013
16
Figure 26 : New urea capacity in 2013
Source: Fertecon, Yara International
FINANCIAL HIGHLIGHTS Key earnings variables PChem’s are generally affected by the following variables:- Product prices of petrochemicals. Product prices of petrochemicals move up and down according to the general economic climate (demand) and industry capacity availability (supply). There is also a general understanding that product prices, especially olefins, are correlated to crude oil prices. This has resulted in PChem’s share price having a mild 0.36 correlation to crude oil price. However, our correlation tests indicate weak correlation to close to non-existent correlation for crude oil and petrochemicals over the past 24 months. The weak correlation to crude oil price could be due to many reasons, we believe. One of our theories is that there is growing capacity of natural gas based feedstock in recent years and this could have distorted the direct relationship between crude oil and petrochemicals. In terms of earnings sensitivity, we calculate that if overall O&D prices increase by 10%, PChem’s earnings will be higher by about 20% and vice versa. If overall M&F prices go up 10%, it would raise earnings by roughly 10% and vice versa.
Figure 27 : Correlation test for Mar 2011 to Mar 2013
Most significantSignificantLess SignificantLeast Significant
Product prices are influenced by demand for and supply of
petrochemicals
PChem’s earnings sensitivity to changes in petrochemical prices is
high
We found weak correlation of price movements to crude oil
Initiating Coverage | Petronas Chemicals Group | 18 March 2013
17
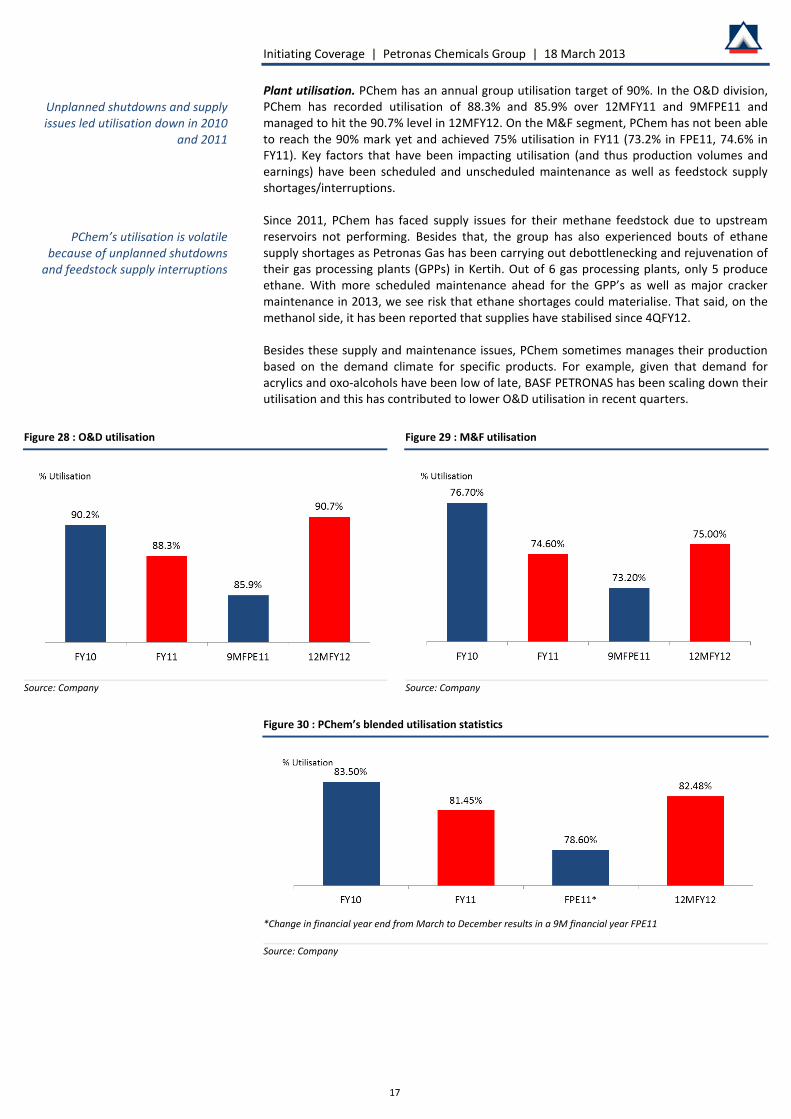
Plant utilisation. PChem has an annual group utilisation target of 90%. In the O&D division, PChem has recorded utilisation of 88.3% and 85.9% over 12MFY11 and 9MFPE11 and managed to hit the 90.7% level in 12MFY12. On the M&F segment, PChem has not been able to reach the 90% mark yet and achieved 75% utilisation in FY11 (73.2% in FPE11, 74.6% in FY11). Key factors that have been impacting utilisation (and thus production volumes and earnings) have been scheduled and unscheduled maintenance as well as feedstock supply shortages/interruptions. Since 2011, PChem has faced supply issues for their methane feedstock due to upstream reservoirs not performing. Besides that, the group has also experienced bouts of ethane supply shortages as Petronas Gas has been carrying out debottlenecking and rejuvenation of their gas processing plants (GPPs) in Kertih. Out of 6 gas processing plants, only 5 produce ethane. With more scheduled maintenance ahead for the GPP’s as well as major cracker maintenance in 2013, we see risk that ethane shortages could materialise. That said, on the methanol side, it has been reported that supplies have stabilised since 4QFY12. Besides these supply and maintenance issues, PChem sometimes manages their production based on the demand climate for specific products. For example, given that demand for acrylics and oxo-alcohols have been low of late, BASF PETRONAS has been scaling down their utilisation and this has contributed to lower O&D utilisation in recent quarters.
*Change in financial year end from March to December results in a 9M financial year FPE11 Source: Company
Unplanned shutdowns and supply issues led utilisation down in 2010
and 2011
PChem’s utilisation is volatile because of unplanned shutdowns
and feedstock supply interruptions
Initiating Coverage | Petronas Chemicals Group | 18 March 2013
18
Feedstock prices. Feedstock prices of the group are generally stable because of supply agreements signed with PETRONAS. The group only has some exposure to market prices for propane used in Gebeng and naphtha used for aromatics. A significant change to feedstock prices occurred in FY10, when PETRONAS had adjusted prices upwards for propane, butane and methane. As for ethane prices, they will only be up for renewal in 2016 and 2023. While in the immediate term there has been no indication on feedstock price adjustments, we view that it is a risk to earnings given the government’s plan to reduce subsidies. Out of total group feedstock costs, propane and naphtha are the largest expenses making up 30% and 40% of costs. FY11 and FPE11 led upwards by improved product prices For the financial year ended 31 March 2011 (FY11), PChem’s net profits grew 36% y-o-y on the back of healthy demand for petrochemicals from China, India and ASEAN. The group saw production volumes improved by 8% y-o-y while average product prices for O&D was up 11% y-o-y and average product prices for M&F was up 14% y-o-y. Group utilisation during the period was fairly healthy at 81.5% with O&D utilisation at 88.3% (90.2% in FY10) and M&F utilisation at 74.6% (76.7% in FY10). O&D utilisation was below the group’s targeted 90% as there was catalyst change out activity at PChem’s ethylene derivatives plants. These activities usually take place every 18 months. As for the M&F division, utilisation was lower y-o-y because during the 1HFY11 period, one of the methanol plants was down due to water supply issue. During FY11, PChem recorded EBITDA margins of 32.1% (31.2% in FY10) on the back of higher product prices. On contributions from JV and associates, FY11 saw a strong jump of 290% to RM714m on the back of improving demand for and prices of products like acetyls and styrene monomer and also acrylics and oxo-alcohols. During this time, BASF was also benefiting from tax allowances. Going into the 9 months period ending 31 December 2011 (FPE11), PChem’s earnings continued to improve on the back of strong petrochemical prices. Compared y-o-y (with 9MDec10), PChem’s net profits were stronger by 27%. The group noted that overall group prices were up 29% y-o-y on the back of healthy demand and this managed to offset lower production volume which was down 7% y-o-y. For the period, total group utilisation was lower y-o-y at 78.6% (79.7% in 9MDec10) because of supply issues with ethane and also unplanned shutdowns. O&D utilisation was 85.9% (86.8% in 9MDec10) while M&F utilisation was 73.2% (71.8% in 9MDec10). O&D utilisation was lower because during 1QFPE11, PChem undertook major scheduled maintenance activities at their O&D plants (aromatics, ethylene cracker and MTBE plants) and in 3QFPE11, PChem suffered a power outage at one of their ethylene crackers. As for M&F, utilisation was mildly higher y-o-y as 9MDec10 saw water supply problems at the methanol plants. That said, the M&F division was not without issues during FPE11 as methane supply problems cropped up starting 1QFPE11. Methane gas is supplied to PChem from PETRONAS’s offshore developments which have been experiencing reservoir problems. To note, methane gas supply problems were persistent throughout FPE11 with almost no supply experienced in 3QFPE11. On EBITDA margins during the period, FPE11 saw margins surge up to 38% from 31% in 9MDec10 due to the aforementioned improvement in petrochemical prices. On contributions from JV and associates, PChem saw a decline to RM273m from RM550m in 9MDec10 as there was major maintenance at Petronas BASF plant and there were no more tax allowances to claim. Demand for acrylics and oxo-alcohols were also reported to be weak during this period, resulting in the group taking opportunity to perform maintenance activities.
Feedstock prices for ethane will be up for review in 2016
FY11 was a good year, with improved volumes coupled with
rising selling prices
FPE11 was also a strong period, with profits growing 36% y-o-y on
higher petrochemical prices
However, utilisation was choppy with some unplanned shutdowns and feedstock supply challenges
Lower contributions from JV and associates were also offset by
strong petrochemical prices
Initiating Coverage | Petronas Chemicals Group | 18 March 2013
19
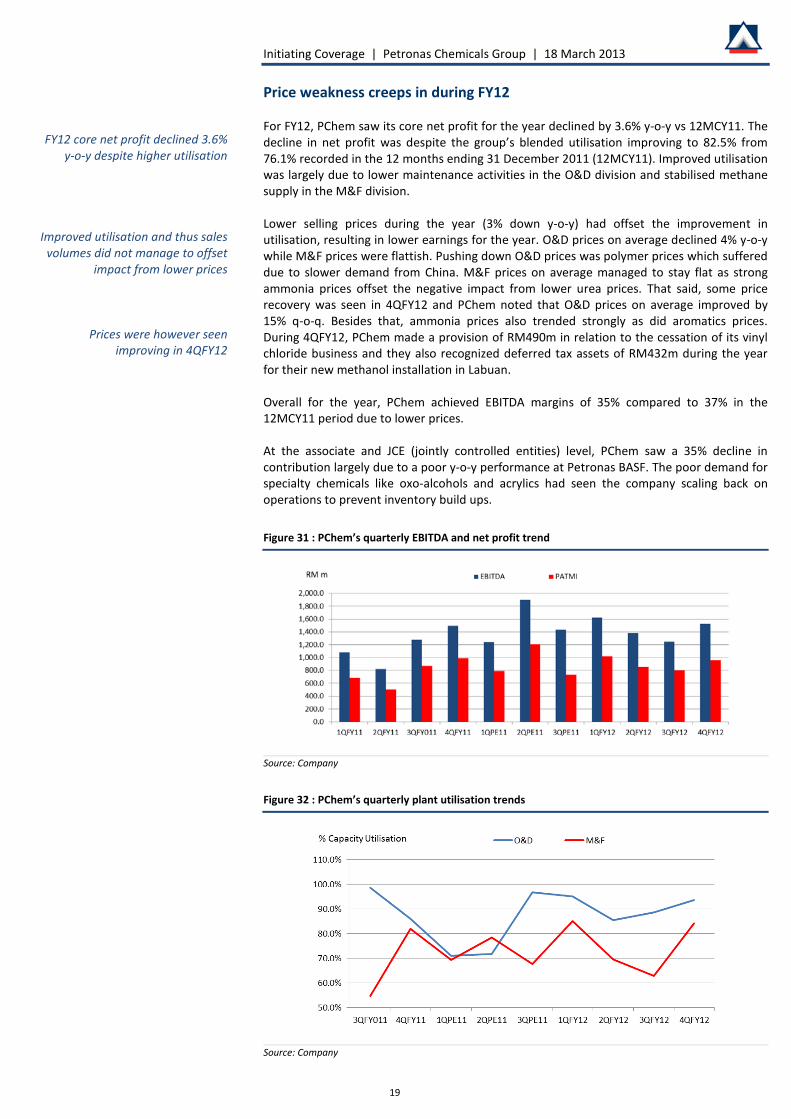
Price weakness creeps in during FY12 For FY12, PChem saw its core net profit for the year declined by 3.6% y-o-y vs 12MCY11. The decline in net profit was despite the group’s blended utilisation improving to 82.5% from 76.1% recorded in the 12 months ending 31 December 2011 (12MCY11). Improved utilisation was largely due to lower maintenance activities in the O&D division and stabilised methane supply in the M&F division. Lower selling prices during the year (3% down y-o-y) had offset the improvement in utilisation, resulting in lower earnings for the year. O&D prices on average declined 4% y-o-y while M&F prices were flattish. Pushing down O&D prices was polymer prices which suffered due to slower demand from China. M&F prices on average managed to stay flat as strong ammonia prices offset the negative impact from lower urea prices. That said, some price recovery was seen in 4QFY12 and PChem noted that O&D prices on average improved by 15% q-o-q. Besides that, ammonia prices also trended strongly as did aromatics prices. During 4QFY12, PChem made a provision of RM490m in relation to the cessation of its vinyl chloride business and they also recognized deferred tax assets of RM432m during the year for their new methanol installation in Labuan. Overall for the year, PChem achieved EBITDA margins of 35% compared to 37% in the 12MCY11 period due to lower prices. At the associate and JCE (jointly controlled entities) level, PChem saw a 35% decline in contribution largely due to a poor y-o-y performance at Petronas BASF. The poor demand for specialty chemicals like oxo-alcohols and acrylics had seen the company scaling back on operations to prevent inventory build ups.
Figure 31 : PChem’s quarterly EBITDA and net profit trend
FY12 core net profit declined 3.6% y-o-y despite higher utilisation
Improved utilisation and thus sales volumes did not manage to offset
impact from lower prices
Prices were however seen improving in 4QFY12
Initiating Coverage | Petronas Chemicals Group | 18 March 2013
20
Figure 33 : Results commentaries
4QFY12 4QCY11 % y-o-y change
% q-o-q change 12MFY12 12MCY11
% y-o-y change Comments
Key financial highlights Revenue (RM m) 4,379.0 3,904.0 12.2 11.3 16,599.0 16,237.0 2.2 Higher due to improved sales volumes from
higher group utilisation Operating profit (RM m) 754.0 1,111.0 (32.1) (24.1) 4,346.0 5,154.0 (15.7) Lower due to lower selling prices. Pretax profit (RM m) 819.0 1,139.0 (28.1) (20.5) 4,550.0 5,461.0 (16.7) Net profit (RM m) 902.0 735.0 22.7 21.6 3,518.0 3,769.0 (6.7) Core net profit (RM m) 960.0 735.0 30.6 20.3 3,632.0 3,769.0 (3.6) Adjusted for RM490m in provision for the
cessation of vinyl chloride business and RM432m for deferred tax assets
Per share data EPS (sen) 11.3 9.2 22.7 21.6 45.4 47.1 (3.6) Core EPS (sen) 12.0 9.2 30.6 20.3 45.4 47.1 (3.6) Net DPS (sen) 14.0 8.0 22.0 19.0 BV/share (RM) 2.54 - 2.54 - Margins Pretax (%) 18.7 29.2 (10.5) (7.5) 27.4 33.6 (6.2) Net profit (%) 21.9 18.8 3.1 1.6 21.9 23.2 (1.3) Prices started to improve in 4QFY12 Source: Company, Alliance Research
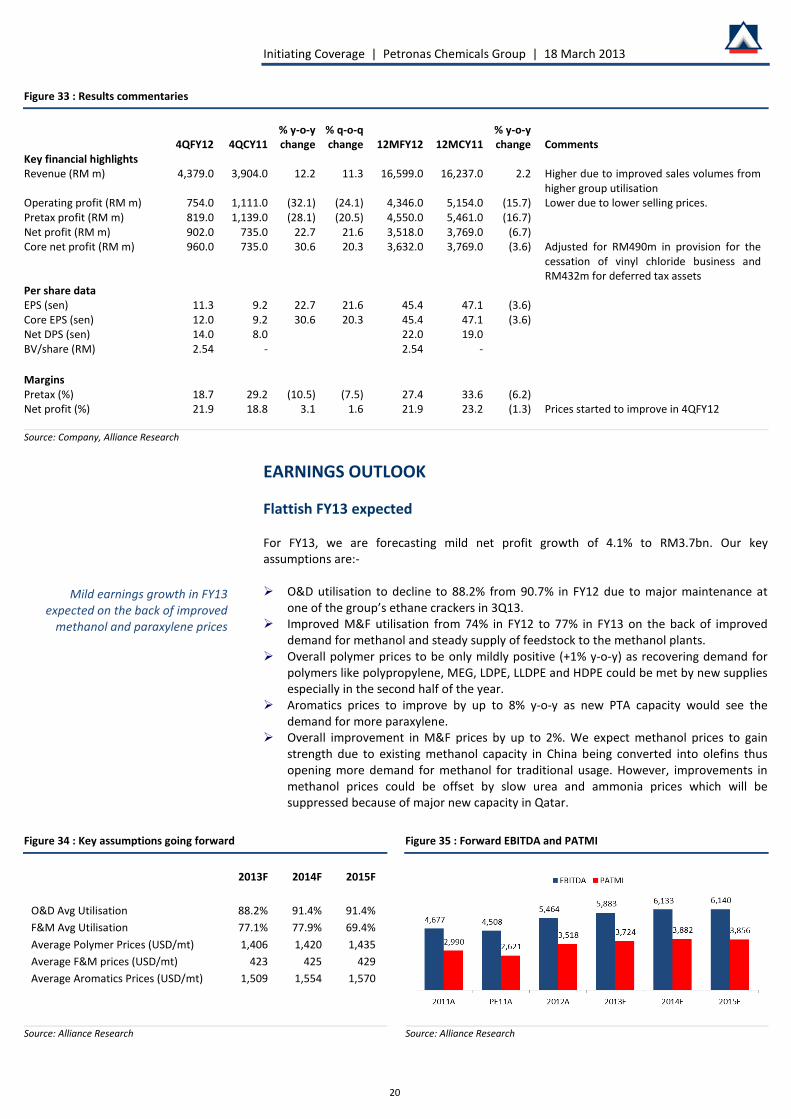
EARNINGS OUTLOOK Flattish FY13 expected For FY13, we are forecasting mild net profit growth of 4.1% to RM3.7bn. Our key assumptions are:- O&D utilisation to decline to 88.2% from 90.7% in FY12 due to major maintenance at
one of the group’s ethane crackers in 3Q13. Improved M&F utilisation from 74% in FY12 to 77% in FY13 on the back of improved
demand for methanol and steady supply of feedstock to the methanol plants. Overall polymer prices to be only mildly positive (+1% y-o-y) as recovering demand for
polymers like polypropylene, MEG, LDPE, LLDPE and HDPE could be met by new supplies especially in the second half of the year.
Aromatics prices to improve by up to 8% y-o-y as new PTA capacity would see the demand for more paraxylene.
Overall improvement in M&F prices by up to 2%. We expect methanol prices to gain strength due to existing methanol capacity in China being converted into olefins thus opening more demand for methanol for traditional usage. However, improvements in methanol prices could be offset by slow urea and ammonia prices which will be suppressed because of major new capacity in Qatar.
Source: Alliance Research Source: Alliance Research
Mild earnings growth in FY13 expected on the back of improved
methanol and paraxylene prices
Initiating Coverage | Petronas Chemicals Group | 18 March 2013
21
Little excitement in FY14 as well Going into FY14, we view little excitement in earnings as well and expect flattish net profit growth of 4.2%. Our key assumptions are:- O&D utilisation may improve to 91.4% from 88.2% in FY13 because of no major
maintenance during the period and also on the assumption that ethane supplies will be consistent throughout the year.
Continued improvement in M&F capacity to 77.9% from 77.1% as methanol operations continue to scale up. We are cautious to push up utilisation estimates further as facilities at Bintulu fertiliser are aged and may be subject to unforeseen maintenance.
Flattish polymer prices in FY14 as more new facilities in China come on-stream. By FY14, new methanol-to-olefins plants would have ramped up to full capacity and flood the market with new olefin supply. This in turn would place pressure on polymer prices and related products in the ethylene chain like ethylene glycols (MEG) and ethylene dioxide.
Aromatics will continue to be a driver for the O&D segment, albeit modestly. Aromatics prices will again be driven by new PTA capacity in China.
Flattish M&F prices as improved methanol demand (from the growth in the methanol-to-olefin market) may again be offset with flattish to weak ammonia and urea capacity. By FY14 new fertiliser capacity in Qatar, Egypt, Algeria and UAE would be in full swing.
Lack of major growth opportunities cited in FY15 onwards For now, we are conservative with our FY15 estimates, expecting a 0.7% contraction in earnings. Our key concern in FY15 is new capacity emerging in China and the Middle East may exceed demand growth. This would then keep overall petrochemical prices and spreads subdued. To note in FY15 is that Petronas Chemical’s new SAMUR fertiliser plant will also be ready and we expect start-up costs to be incurred during the year.
KEY INVESTMENT RISKS Higher feedstock costs due to government’s subsidy rationalisation In line with the government’s initiative to lower subsidies, there may be adjustments to feedstock prices like methane, propane and butane in the coming years. For ethane, the nearest adjustment is only seen in 2016 and 2023 where long term contracts will be up for review. If the group is required to use the feedstock that comes in via the regasification plant in Malacca starting 2013, we view that an adjustment to prices could be sooner than later. Feedstock supply issues PChem’s supply of feedstock is dependent on PETRONAS’s ability to ensure a reliable flow of gas from offshore sources. Incidents like fires, reservoir complications or extended maintenance would see lower throughput to PChem and thus lower utilisation and earnings. Further to this, PChem is also reliant on Petronas Gas’s (PGas) gas processing facilities and their supply of utilities like water and electricity. Any major incident or even schedule maintenance undertaken by PGas will have an impact on PChem. Global economic climate Demand for petrochemical products is cyclical and generally dependent on global economic climate given that petrochemicals are used in a wide range of industries across the economy. A deteriorating economic outlook would dampen demand and therefore product prices, thereby impacting PChem’s margins.
FY14 could be another tepid year because of new capacity emerging
in Asia
Conservative on FY15 assumptions for now and we foresee start-up
costs at SAMUR
Price adjustments may occur earlier than expected if PChem is reliant on
the new regasification terminals
Random supply issues can crop up at offshore or gas processing plants
Demand for petrochemicals is dependent on global economic
climate
Initiating Coverage | Petronas Chemicals Group | 18 March 2013
22
Foreign exchange risk A significant portion of the group’s revenue is denominated in USD. As such, any decline in the USD against the RM will negatively impact earnings. We calculate that for every 0.5 change in the USD, PChem’s earnings will vary by roughly 4%. Industry overcapacity As discussed in the report, with increasing sources of cheap gas based feedstock globally (especially China and US), global petrochemical capacities are increasing and this will in turn dampen petrochemical prices if demand is not able to catch up. This is a crucial development to watch especially with mega projects like SAMUR and RAPID coming on-stream in the future. There is concern that there will not be enough demand for the output from these plants when they are ready. Either that, petrochemical prices could be much lower by the time these plants come on-stream in 2015 onwards. Regulatory risks Changes in laws, regulations or policies of governments or other governmental activities in the countries that PChem exports to could reduce demand or their ability to sell their products in those markets. These would most likely be in the form of import or export duties.
VALUATION AND RECOMMENDATION Initiating coverage with a NEUTRAL recommendation We have an overall neutral outlook on the petrochemical industry going forward, as seen in our tepid growth expectations for PChem with <5% growth per annum in FY13 and FY14. Despite positive outlook in the aromatics and methanol segments, we view that weakness in polymer and fertiliser prices will offset gains to be made in the aforementioned segments. PChem currently trades at FY13 P/E of 13.7x which is generally in line with their peers 1-year rolling forward average of 14.0x (Figure 36). We view this reasonable as PChem has stronger margins compared to peers on average because of their feedstock agreements with PETRONAS but the company has much poorer growth prospects than peers. We view this to be due to a combination of reasons including:- (1) Peers with naphtha based feedstock have a lower base in earnings and therefore earnings growth can be erratic when there are changes in price spreads, and, (2) PChem has no immediate capacity coming on stream until 2015 unlike peers like Sinopec. Looking back at historical mean valuations of peers also indicate that PChem is currently trading within the industry’s range. We calculate that PChem’s peers trade at a long term mean of 13.7x. Using this long term average and pegging it to PChem’s FY13 EPS of 46.5sen derives our target price of RM6.38. We view that PChem is fully valued at this juncture and initiate coverage on the stock with a NEUTRAL recommendation. Dividend payout min 50% In terms of dividend payout, PChem has a policy for a minimum 50% payout. For FY12, the group paid out 50% (21.5 sen or 3.4% dividend yield) and for FY13, we expect a payout of 23.3sen which translates into a 3.7% dividend yield.
Every 0.5 change in the USD would impact earnings by roughly 4%
Ramp up in global petrochemicals capacity may not be matched by
demand
\
Overall neutral industry outlook
PChem trades on par with peers
Initiating Coverage | Petronas Chemicals Group | 18 March 2013
23
Figure 36 : Peer comparison
Company Call Local Currency
Target price
Share price
Mkt Cap (USD m)
EPS Growth (%) P/E (x) P/BV (x) ROE (%)
Net Dividend Yield (%)
CY13 CY14 CY13 CY14 CY13 CY14 CY13 CY14 CY13 CY14 Petronas Chemicals Neutral RM 6.38 6.37 16,328.1 4.1 4.2 13.7 13.1 2.1 2.0 15.7 15.1 3.7 3.8 PTT Global Chemicals NR THB NR 73.75 11,226.5 5.5 5.6 9.4 8.9 1.4 1.3 15.1 14.6 4.4 4.8 Siam Cement NR THB NR 500.00 20,256.6 40.5 21.3 18.1 14.9 3.6 3.1 21.3 22.6 2.9 3.3 Indorama Ventures NR THB NR 23.40 3,803.3 154.3 30.3 14.7 11.3 1.7 1.5 11.3 13.7 2.2 2.7 Tata Chemicals NR INR NR 320.90 1,512.8 21.3 10.4 8.7 7.9 1.1 1.0 13.2 13.8 3.4 3.7 Sabic NR SAR NR 94.00 75,195.0 13.6 4.4 10.0 9.6 1.8 1.7 18.0 17.6 5.6 5.8 Yanbu National NR SAR NR 51.75 7,762.0 12.6 6.7 10.6 9.9 2.0 1.8 19.6 19.0 5.1 6.4 NIC NR SAR NR 30.10 5,368.8 10.5 16.4 10.3 8.9 1.6 1.4 14.7 14.7 5.5 6.4 Sinopec Shanghai NR CNY NR 6.04 5,724.8 153.0 6.6 49.5 46.5 2.5 2.4 -8.8 6.5 0.1 N/A Formosa Chem& Fib NR TWD NR 73.90 14,156.8 218.9 10.6 19.8 17.9 1.7 1.7 2.6 6.1 3.0 4.0 Formosa Plastics NR TWD NR 74.50 15,351.2 74.9 13.8 17.8 15.6 1.9 1.8 6.0 10.0 3.3 4.5 Dow Chemical NR US NR 33.81 40,719.6 24.6 24.7 14.3 11.5 1.9 1.8 13.7 15.7 3.9 4.0 Eastman Chemicals NR US NR 72.60 11,177.2 19.3 11.5 11.3 10.1 3.8 3.1 33.0 37.8 1.5 1.7 Average 39.7 11.8 14.0 12.5 2.1 1.9 16.0 16.7 4.1 4.6 Source: Alliance Research, Bloomberg Share price date: 15 Mar 2013
Figure 37 : Price to earnings multiple
-1 std dev Average +1 std dev
Petronas Chemicals 13.0 14.2 15.7 PTT Global Chemicals 6.7 8.4 16.0 Siam Cement 10.1 15.6 22.4 Indorama Ventures 3.7 18.0 41.0 Tata Chemicals 8.8 10.9 15.6 Sabic 8.0 10.8 13.5 Yanbu National 7.0 10.8 16.4 National Industraliasation Co 5.7 9.8 15.4 Sinopec Shanghai Petrochemicals -15.7 13.7 34.5 Formosa Chemical and Fib 6.8 15.9 25.0 Formosa Plastics 7.3 13.6 19.9 Dow Chemical 10.4 23.8 48.2 Eastman Chemicals 7.5 12.6 22.1
Initiating Coverage | Petronas Chemicals Group | 18 March 2013
24
APPENDICES APPENDIX 1 – Olefins and derivatives
Figure 40 : Olefins and derivatives produced by PChem
Product Description Feedstock Primary End Users
Benzene An aromatic hydrocarbon in the form of a colourless flammable liquid
Heavy naptha Feedstock for styrene monomer production and raw material for derivatives used in manufacture of disposable food containers, cutlery, packing electrical appliances and tyres
Ethylene An olefinic hydrocarbon recovered from petrochemical processes in the form of a colourless gas
Ethane Ethylene is the largest volume olefin used in the manufacture of polymers such as polyethylene (PE), polyester, polyvinyl chloride (PVC) and polystyrene (PS). The main intermediate chemicals produced from ethylene include ethylene oxide and ethylene glycol, ethylene dichloride (EDC) and vinyl chloride monomer (VCM), ethylbenzene and styrene, vinyl acetate monomer (VAM), alpha olefins and industrial ethanol. These products are used in a wide variety of industrial and consumer markets such as the packaging, transportation, electronic, textile and construction industries.
Mono-Ethylene glycol
An organic chemical compound derived from the oxidation of ethylene
Ethylene, oxygen Polyester resins for fibres and PET containers and bottles, antifreeze, electronic applications and brake fluid formulation
Di-Ethylene glycol
An organic chemical compound derived from the oxidation of ethylene
Ethylene, oxygen Fiberglass application and brake fluid formulation
MTBE An organic ether that is volatile, combustible in the form of colourless liquid that is categorised as an oxygenated due to its ability to boost the oxygen content and octane rating of gasoline
Propane, butane, methanol
Gasoline additive to boost octane levels to improve burning of fuel and reduce level of emissions
Used primarily for the production of textiles and non-woven fibres, adhesives, paint and paper coatings, detergents and plastic modifiers / Used to manufacture paints and coatings, cables, wires and floor tiles / Used to produce polyesters, polyurethanes and plasticizers / Feedstock production polystyrene and unsaturated polyester resins used in the manufacture of plastic casings, insulation materials and rubber goods
Paraxylene An aromatic hydrocarbon in the form of a colourless flammable liquid
Heavy naptha Production of purified terephthalic acid, which in turn us used in the manufacturing of polyester for packaging applications, soft drink bottles, fibres and film
Performance chemicals
Chemicals produced in small volumes used for critical applications requiring stringent performance
Ethylene oxide Production of surfactants, personal care products, urethane foam, cement and construction applications, detergents and emulsifiers
Polyethylene (HDPE, LLDPE & LDPE)
A polymer derived from polymerisation of ethylene
Ethylene Feedstock in manufacture of plastic products, including film, pipes, wires, cables and ducting
Polypropylene A polymer derived from polymerisation of propylene
Propylene Feedstock in manufacture of woven bags, plastics, films, ropes, yarn, chairs, food and garment packaging and other industrial and consumer products
Propylene An olefinic hydrocarbon recovered from petrochemical processes in the form of a colourless gas
Propane Propylene consumption is dominated by polypropylene (PP), which accounts for 60% of global consumption. Injection moulding is the largest PP market but it can also be made into fibres, film and sheet and extruded into pipe and conduit. Other important derivatives of propylene are acrylonitrile (ACN), oxo alcohols, propylene oxide, cumene and acrylic acid..
PVC A versatile thermoplastic polymer produced from VCM
VCM Feedstock in manufacture of pipes, pipe and conduit fittings, automobiles, blow moulding, roofing tiles, bottles, containers, films, wires and cables
VCM Colourless reactive gas primarily used to manufacture PVC
Ethyl Dichloride, ethylene, oxygen
Feedstock in production of PVC
Source: ICIS, Company
Initiating Coverage | Petronas Chemicals Group | 18 March 2013
25
APPENDIX 2 – Methanol and fertilisers
Figure 41 : Fertiliser and methanol derivatives produced by PChem
Product Description Feedstock Primary End Users
Acetic acid Chemical intermediate in the form of colourless liquid
Methanol, carbon monoxide
Raw material for petrochemical intermediates and end-products, including vinyl acetate monomer for coatings and adhesives, purified terephthalic acid for polyester production, acetate esters, cellulose acetate, acetic anhydride and monochloroacetic acid
Ammonia A nitrogen and hydrogen compound in the form of colourless gas with a characteristic pungent odour
Methane, hydrogen and nitrogen
Feedstock for the production of urea and other industrial applications, including as a refrigerant and latex anti-coagulant
Carbon Monoxide Colourless, odourless and tasteless gas that is lighter than air
Methane, hydrogen and nitrogen
Feedstock production for production of acetic acid
Methanol Simplest organic alcohol and is a colourless, flammable liquid
Methane Used to produce, among other things, formaldehyde, acetic acid, chloromethanes and methyl methacrylate, which are used in the production of, among other things, resins, adhesives, paints, plastics, flavourings, silicones and plexiglass
Oxogas Gas consisting primarily of carbon monoxide and hydrogen
Methane Feedstock for production of butanol
Urea A fertiliser with a minimum nitrogen content of approximately 46% by weight
Ammonia, carbon dioxide
Commercial fertiliser used in the production of many crops; raw material for the manufacture of adhesives, moulding powders, varnishes and foams
Source: ICIS, Company
Initiating Coverage | Petronas Chemicals Group | 18 March 2013
26
APPENDIX 3 – Integrated production process
Figure 42 : Olefins and Derivatives production process and end products
Source: Company
Initiating Coverage | Petronas Chemicals Group | 18 March 2013
27
*Period reflecting 9 months as there was a change in financial year end from March to December
Petronas Chemicals Group Financial Summary
Balance Sheet Income StatementFY 31 Dec (RM m) FPE11A* 2012A 2013F 2014F 2015F FY 31 Dec (RM m) FPE11A* 2012A 2013F 2014F 2015F
Initiating Coverage | Petronas Chemicals Group | 18 March 2013
28
DISCLOSURE Stock rating definitions Strong buy - High conviction buy with expected 12-month total return (including dividends) of 30% or more Buy - Expected 12-month total return of 15% or more Neutral - Expected 12-month total return between -15% and 15% Sell - Expected 12-month total return of -15% or less Trading buy - Expected 3-month total return of 15% or more arising from positive newsflow. However, upside may not be sustainable Sector rating definitions Overweight - Industry expected to outperform the market over the next 12 months Neutral - Industry expected to perform in-line with the market over the next 12 months Underweight - Industry expected to underperform the market over the next 12 months Commonly used abbreviations Adex = advertising expenditure EPS = earnings per share PBT = profit before tax bn = billion EV = enterprise value P/B = price / book ratio BV = book value FCF = free cash flow P/E = price / earnings ratio CF = cash flow FV = fair value PEG = P/E ratio to growth ratio CAGR = compounded annual growth rate FY = financial year q-o-q = quarter-on-quarter Capex = capital expenditure m = million RM = Ringgit CY = calendar year M-o-m = month-on-month ROA = return on assets Div yld = dividend yield NAV = net assets value ROE = return on equity DCF = discounted cash flow NM = not meaningful TP = target price DDM = dividend discount model NTA = net tangible assets trn = trillion DPS = dividend per share NR = not rated WACC = weighted average cost of capital EBIT = earnings before interest & tax p.a. = per annum y-o-y = year-on-year EBITDA = EBIT before depreciation and amortisation PAT = profit after tax YTD = year-to-date
Initiating Coverage | Petronas Chemicals Group | 18 March 2013
29
DISCLAIMER This report has been prepared for information purposes only by Alliance Research Sdn Bhd (Alliance Research), a subsidiary of Alliance Investment Bank Berhad (AIBB). This report is strictly confidential and is meant for circulation to clients of Alliance Research and AIBB only or such persons as may be deemed eligible to receive such research report, information or opinion contained herein. Receipt and review of this report indicate your agreement not to distribute, reproduce or disclose in any other form or medium (whether electronic or otherwise) the contents, views, information or opinions contained herein without the prior written consent of Alliance Research. This report is based on data and information obtained from various sources believed to be reliable at the time of issuance of this report and any opinion expressed herein is subject to change without prior notice and may differ or be contrary to opinions expressed by Alliance Research’s affiliates and/or related parties. Alliance Research does not make any guarantee, representation or warranty (whether express or implied) as to the accuracy, completeness, reliability or fairness of the data and information obtained from such sources as may be contained in this report. As such, neither Alliance Research nor its affiliates and/or related parties shall be held liable or responsible in any manner whatsoever arising out of or in connection with the reliance and usage of such data and information or third party references as may be made in this report (including, but not limited to any direct, indirect or consequential losses, loss of profits and damages). The views expressed in this report reflect the personal views of the analyst(s) about the subject securities or issuers and no part of the compensation of the analyst(s) was, is, or will be directly or indirectly related to the inclusion of specific recommendation(s) or view(s) in this report. Alliance Research prohibits the analyst(s) who prepared this report from receiving any compensation, incentive or bonus based on specific investment banking transactions or providing a specific recommendation for, or view of, a particular company. This research report provides general information only and is not to be construed as an offer to sell or a solicitation to buy or sell any securities or other investments or any options, futures, derivatives or other instruments related to such securities or investments. In particular, it is highlighted that this report is not intended for nor does it have regard to the specific investment objectives, financial situation and particular needs of any specific person who may receive this report. Investors are therefore advised to make their own independent evaluation of the information contained in this report, consider their own individual investment objectives, financial situations and particular needs and consult their own professional advisers (including but not limited to financial, legal and tax advisers) regarding the appropriateness of investing in any securities or investments that may be featured in this report. Alliance Research, its directors, representatives and employees or any of its affiliates or its related parties may, from time to time, have an interest in the securities mentioned in this report. Alliance Research, its affiliates and/or its related persons may do and/or seek to do business with the company(ies) covered in this report and may from time to time act as market maker or have assumed an underwriting commitment in securities of such company(ies), may sell or buy such securities from customers on a principal basis and may also perform or seek to perform significant investment banking, advisory or underwriting services for or relating to such company(ies) as well as solicit such investment, advisory or other services from any entity mentioned in this report. AIBB (which carries on, inter alia, corporate finance activities) and its activities are separate from Alliance Research. AIBB may have no input into company-specific coverage decisions (i.e. whether or not to initiate or terminate coverage of a particular company or securities in reports produced by Alliance Research) and Alliance Research does not take into account investment banking revenues or potential revenues when making company-specific coverage decisions. In reviewing this report, an investor should be aware that any or all of the foregoing, among other things, may give rise to real or potential conflicts of interest. Additional information is, subject to the overriding issue of confidentiality, available upon request to enable an investor to make their own independent evaluation of the information contained herein. Published & printed by: ALLIANCE RESEARCH SDN BHD (290395-D) Level 19, Menara Multi-Purpose Capital Square 8, Jalan Munshi Abdullah 50100 Kuala Lumpur, Malaysia Tel: +60 (3) 2604 3333 Fax: +60 (3) 2604 3921 Bernard Ching Email: [email protected] Executive Director / Head of Research


![Welcome 3 [ ] · PDF fileWelcome 3 Message from the Managing Director 3 BASF PETRONAS Chemicals 4 ... procedures for various processes including leak sealing](https://static.documents.pub/doc/80x56/5a79f0f27f8b9adf778b4e3c/welcome-3-3-message-from-the-managing-director-3-basf-petronas-chemicals-4-.jpg)

