50
Strategic Advisors in Global Energy PFC Energy’s Global Crude Oil and Natural Gas Liquids Supply Forecast September 2004

Strategic Advisors in Global Energy
PFC Energy’s Global Crude Oil and Natural Gas Liquids
Supply Forecast
September 2004

Key Messages
1. The world is not in imminent danger of running out of oil, but certain countries/regions are depleting much faster than others. This will cause a shift in the geographic dominance of production sources.
2. In spite of high oil prices, Non-OPEC production has been stagnant with the notable exception of the FSU. This trend is likely to continue through this decade.
3. Exploration results in the last 10 years (with a few exceptions like Angola, Sudan, Mauritania) have been much less significant than in previous decades. Without a significant reversal of this trend, Non-OPEC production is likely to peak just after 2010 and begin a long term decline.

Key Messages
5. Every year, in every region (including OPEC), the world producesmore oil than it finds. It is only logical to conclude that inevitably this will lead to dwindling supplies.
6. As demand continues to grow beyond 2010 and Non-OPEC production capacity plateaus or falls, OPEC will have an increasing burden to make up the difference resulting in an inevitable increase in dependency on OPEC sources.
7. OPEC production capacity and reserves will suffer from the additional strain and some models suggest that even OPEC will struggle to fill the differential between Non-OPEC supply and global demand beyond 2015-2020.

Non-OPEC Supply ForecastAssumes Exploration Reserve Additions Typical of the Last 15 Years
0
10,000
20,000
30,000
40,000
50,000
60,000
1985
1988
1991
1994
1997
2000
2003
2006
2009
2012
2015
2018
Dai
ly P
rodu
ctio
n (m
bopd
)
Non-OPEC Oil SandsNon-OPEC NGLFSUNon OPEC/Non FSU
This production profile is based on a model which takes into account known discovered oil, historical production, all known (large and small) discoveries that are undeveloped, likely future exploratory drilling, trends in discovery sizes, and decline rates.

The Problem - The Expected Growing Gap Between Global Demand and Global Non-OPEC Supply in the Next Decade
0
20,000
40,000
60,000
80,000
100,000
120,000
198519871989199119931995199719992001200320052007200920112013201520172019
Dai
ly P
rodu
ctio
n (m
bopd
)
0
20,000
40,000
60,000
80,000
100,000
120,000
Non OPECCrude Oil Non-OPEC NGL
Non-OPEC Oil Sands 1.1% Grow th
1.8% Grow th 2.4% Grow th
The Growing Differential Between Non-OPEC Supply Capacity and
Global Demand

Egypt – A Typical Life Cycle for an Oil Producing Country
Total Onshore Wells
0
10
20
30
40
50
60
7019
64
1966
1968
1970
1972
1974
1976
1978
1980
1982
1984
1986
1988
1990
1992
1994
1996
1998
Wells
0%
5%
10%
15%
20%
25%
30%
35%
Dry HolesDiscoveriesSmoothed Success Rate
Exploration usually begins with a play concept which if successful (results in oil discoveries) leads to increasing numbers of wells over time –generally speaking the percentage of exploration wells which arediscoveries does not change much over time

Egypt Total Country
0
2,000
4,000
6,000
8,000
10,000
12,000
1953 1963 1973 1983 1993 2003Year Discovered
Cum
ulat
ive
Dis
cove
red
Res
erve
s (m
mbo
)
CUMULATIVE RESERVES DISCOVERED
Typically large reserve growth occurs in the early years with large steps followed by smaller steps and much lower rates of reserve additions in the later years
Total of 6 billion barrels found by the mid 1960s
Total of 9 billion barrels found by the early 1980s
Much lower rates of reserve growth once exploration matures
Egypt – A Typical Life Cycle for an Oil Producing Country

0
100
200
300
400
500
600
700
1950-1970 1970-1980 1980-1990 1990-Present
Mea
n Fi
eld
Size
(mill
ions
of b
arre
ls)
0
10
20
30
40
50
60
70
Num
ber
of N
ew D
isco
veri
es
Mean Field Size Number of Discoveries
In most cases as exploration matures field sizes drop but the numbers of actual discoveries increase – even though there are often more new fields in recent years, the much smaller field sizes has the net effect of much lower rates of reserve additions
Egypt – A Typical Life Cycle for an Oil Producing Country

As reserve additions fall and production rates increase countries evolve from having net a positive annual reserve balance to a negative annual petroleum balance – in the case of Egypt there have been 20 consecutive years where 250 mmbo more oil is produced than discovered every year
0
100
200
300
400
500
600
700
800
900
1000
1950
1953
1956
1959
1962
1965
1968
1971
1974
1977
1980
1983
1986
1989
1992
1995
1998
2001
2004
Dai
ly P
rodu
ctio
n (m
bopd
)
-500
-250
0
250
500
750
1000
1250
1500
1750
2000
Ann
ual B
bls
Dis
c - A
nnua
l Bbl
s Pr
od (m
mbo
)
ProductionOil Disc - Oil Produced3 per. Mov. Avg. (Oil Disc - Oil Produced)
Egypt – A Typical Life Cycle for an Oil Producing Country

0
100
200
300
400
500
600
700
800
900
1000
1950
1954
1958
1962
1966
1970
1974
1978
1982
1986
1990
1994
1998
2002
Dai
ly P
rodu
ctio
n (m
bopd
)
0.00
0.10
0.20
0.30
0.40
0.50
0.60
0.70
0.80
0.90
1.00
Cum
Pro
duct
ion/
Cum
Res
erve
s
Daily Production
Cum Production/Cum Reserves
Once large discoveries are no longer made and production rates increase, depletion levels (percentage of oil discovered that has been produced) accelerate – this depletion history has been mapped for every major oil and most minor producing countries
Growth Plateau Decline
Egypt – A Typical Life Cycle for an Oil Producing Country

1960
1962
1964
1966
1968
1970
1972
1974
1976
1978
1980
1982
1984
1986
1988
1990
1992
1994
1996
1998
2000
2002
2004
USA Tunisia
PeruDem Rep
CameroonOther_Eur
EgyptPNG
SyriaNew_Zeal
GabonArgentina
UKColombiaAustralia
NorwayOmanCongo
PakistanYemen
CanadaDenmark
IndiaChina
MalaysiaBrunei
Mexico
Non-OPEC Countries that are Either in Decline or Currently in a Plateau
The above bars show the onset and duration of documented production peaks or plateaus – tracking country life cycle shows an acceleration of the number of countries passing from peak to decline
Countries in the decline phase
Countries in the plateau phase
Onset of Plateau
Duration of Plateau
Onset of Decline

0%
10%
20%
30%
40%
50%
60%
70%
80%
90%
100%
Papua N
ew Guinea
Camero
onCon
goSyriaPeruOmanEgyp
tColumbia
Norway
GabonTunis
iaYem
en
New Zea
land
Dem R
ep C
ongoArg
entin
aPakis
tan UKAus
tralia
Non-OPEC Countries that are in Decline
The above bars shows the depletion level at the transition from peak/plateau to decline – tracking depletion level is a good way to anticipate the cessation of growth and the onset of decline
Depletion Ranges for Decline
Depletion Ranges for Growth or Plateaus
Average depletion level which corresponds to the
onset of decline – 54%
Transition from Growth
to Decline

Non-OPEC Countries that are in Plateau
The above bars shows the depletion level of several producers which have reached a production plateau – several significant producers are rapidly approaching critical (60 – 65%) depletion levels which typically signal the onset of production declines
0%10%20%30%40%50%60%70%80%90%
100%
Mexico
Brunei
China
Malaysia
Denmark
IndiaDepletion Ranges for Decline

China - Non OPEC Country in Plateau but are Declines Likely in the Near Term?
0
500
1,000
1,500
2,000
2,500
3,000
3,50019
65
1967
1969
1971
1973
1975
1977
1979
1981
1983
1985
1987
1989
1991
1993
1995
1997
1999
2001
2003
Dai
ly P
rodu
ctio
n (m
bopd
)
-1500
-1000
-500
0
500
1000
1500
2000
Oil
Dis
cove
red
- Oil
Prod
uced
(mm
bl)
ProductionAnnual Balance3 per. Mov. Avg. (Annual Balance)
0
500
1000
1500
2000
2500
3000
3500
4000
1965
1968
1971
1974
1977
1980
1983
1986
1989
1992
1995
1998
2001
2004
Dai
ly P
rodu
ctio
n (m
bopd
)
0.00
0.10
0.20
0.30
0.40
0.50
0.60
0.70
0.80
Cum
Pro
duct
ion/
Cum
Res
erve
s
Daily Production
Cum Production/Cum Reserves
China’s production volumes have exceeded new discovered volumes for all but 4 years since 1975.
China’s depletion level has reached 60% and production levels have gone flat over the last 3 years.

Mexico – Non-OPEC Country in Plateau but are Declines Likely in the Near Term?
0
500
1,000
1,500
2,000
2,500
3,000
3,50019
60
1963
1966
1969
1972
1975
1978
1981
1984
1987
1990
1993
1996
1999
2002
Dai
ly P
rodu
ctio
n (m
bopd
)
-2000
-1000
0
1000
2000
3000
4000
5000
Oil
Dis
cove
red
- Oil
Prod
uced
(mm
bl)
0
500
1000
1500
2000
2500
3000
3500
4000
1965
1970
1975
1980
1985
1990
1995
2000
Dai
ly P
rodu
ctio
n (m
bopd
)
0.00
0.10
0.20
0.30
0.40
0.50
0.60
0.70
0.80
Cum
Pro
duct
ion/
Cum
Res
erve
s
Daily Production
Cum Production/Cum Reserves
Mexico’s depletion level has reached 50% although production levels have continued to increase over the last few years – based on current rates 60% depletion would likely occur in 2008, however the Mexican Government has stated that absent significant new discoveries in the deepwater GOM, 14% declines are expected to start in 2006.
Mexico’s production volumes have exceeded new discovered volumes for all but 1 year since 1984.

India - Non OPEC Country in Plateau but are Declines Likely in the Near Term?
0
100
200
300
400
500
600
700
800
900
1,00019
65
1968
1971
1974
1977
1980
1983
1986
1989
1992
1995
1998
2001
2004
Dai
ly P
rodu
ctio
n (m
bopd
)
-500
-250
0
250
500
750
1000
1250
1500
1750
2000
Oil
Dis
cove
red
- Oil
Prod
uced
(mm
bl)
0
100
200
300
400
500
600
700
800
1965
1968
1971
1974
1977
1980
1983
1986
1989
1992
1995
1998
2001
2004
Dai
ly P
rodu
ctio
n (m
bopd
)
0.00
0.10
0.20
0.30
0.40
0.50
0.60
0.70
0.80
Cum
Pro
duct
ion/
Cum
Res
erve
s
Daily Production
Cum Production/Cum Reserves
India’s production volumes have exceeded new discovered volumes for all but 3 years since 1980.
India’s production levels have been relatively flat since the mid 1990s as depletion levels have continued to increase – current depletion is estimated at 65% which would imply that near term declines should begin unless reserves have been somewhat underestimated.

0%
10%
20%
30%
40%
50%
60%
70%
80%
90%
100%
Maurit
ania
ChadIvo
ry Coas
tThaila
ndSudan
Eq GuineaBraz
ilAngolaViet
namEcu
ador
Non-OPEC, Non-FSU Countries with Production Growth Profiles
The above bars shows the depletion level of several producers which have new discoveries and are considered very likely to increase production – Azerbaijan, Kazakhstan and Russia are also expected to have growth profiles
Depletion Ranges for Decline

Historical Crude Production (Excluding OPEC, FSU, Natural Gas Liquids and Canadian Oil Sands)
0
5000
10000
15000
20000
25000
30000
35000
1965
1968
1971
1974
1977
1980
1983
1986
1989
1992
1995
1998
2001
2004
Dai
ly P
rodu
ctio
n (m
bopd
)
Latin AmericaWest AFricaMiddle EastAsiaMexicoEuropeCanadaUSA
Several key producing regions have reached or exceeded the critical depletion point of 50-60% which typically marks the onset of production decline. It is worth noting that production gains from large new projects have not increased the aggregate production capacity of these regions for about 8 years.
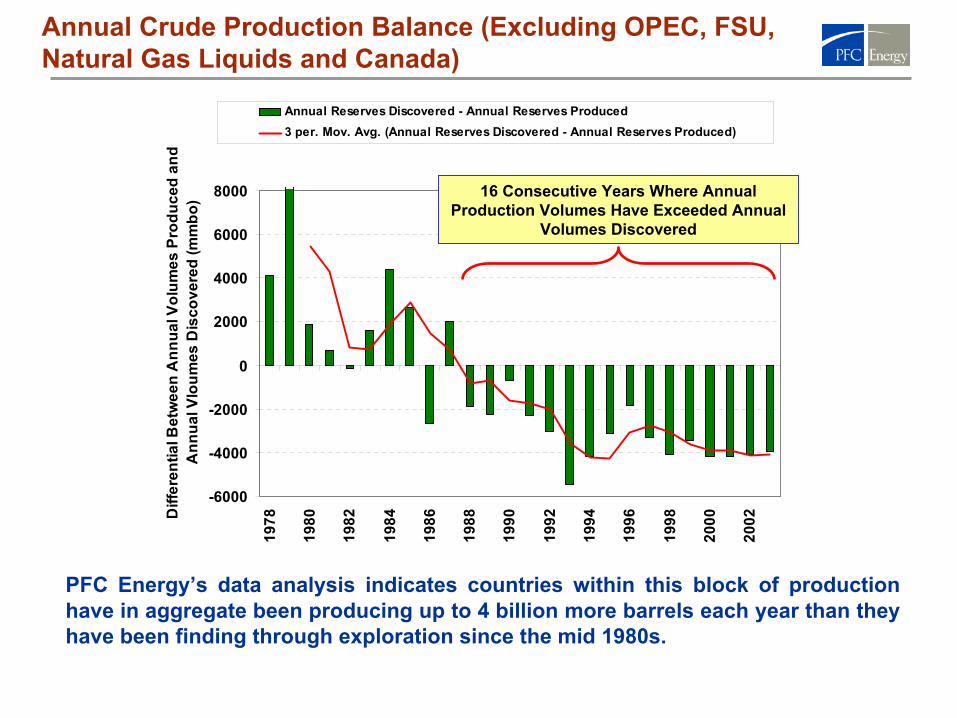
Annual Crude Production Balance (Excluding OPEC, FSU, Natural Gas Liquids and Canada)
-6000
-4000
-2000
0
2000
4000
6000
8000
1978
1980
1982
1984
1986
1988
1990
1992
1994
1996
1998
2000
2002D
iffer
entia
l Bet
wee
n A
nnua
l Vol
umes
Pro
duce
d an
d A
nnua
l Vlo
umes
Dis
cove
red
(mm
bo)
Annual Reserves Discovered - Annual Reserves Produced3 per. Mov. Avg. (Annual Reserves Discovered - Annual Reserves Produced)
PFC Energy’s data analysis indicates countries within this block of production have in aggregate been producing up to 4 billion more barrels each year than they have been finding through exploration since the mid 1980s.
16 Consecutive Years Where Annual Production Volumes Have Exceeded Annual
Volumes Discovered

Egypt – Modeling Different Reserve Categories
0
100
200
300
400
500
600
700
800
900
100019
50
1954
1958
1962
1966
1970
1974
1978
1982
1986
1990
1994
1998
2002
2006
2010
2014
2018
2022
2026
2030
Dai
ly P
rodu
ctio
n (m
bopd
)
Exploration
PUDs
New Source Projects
Base Production
Actual Production
0
100
200
300
400
500
600
700
800
900
1000
1950
1955
1960
1965
1970
1975
1980
1985
1990
1995
2000
2005
2010
2015
2020
2025
2030
Dai
ly P
rodu
ctio
n (m
bopd
)
P90 Forecast
P10 Forecast
P25 Forecast
P50 Forecast
P75 Forecast
Actual Production
With Exploration
Reserves for each country are separated and modeled independently. Each category is modeled probabilistically, using country typical, peak rates, decline rates, announced project schedules, historical drilling levels, recent field size distributions, and commercial thresholds.
Egypt is a good example where if we assume another 10 years of exploration results similar to the last 10 years, the incremental volumes are small relative to historical rates.
Modeled production uncertainty for each reserve category is combined to create production probability ranges for each country.
High probability that production will exceed this level
Low probability that production will exceed this level
Most likely production path
0
500
1000
1500
2000
2500
3000
3500
1965
1970
1975
1980
1985
1990
1995
2000
2005
2010
2015
2020
2025
2030
Dai
ly P
rodu
ctio
n (m
bopd
)
P90 Forecast
P10 Forecast
P25 Forecast
P50 Forecast
P75 Forecast
Actual Production
With Exploration
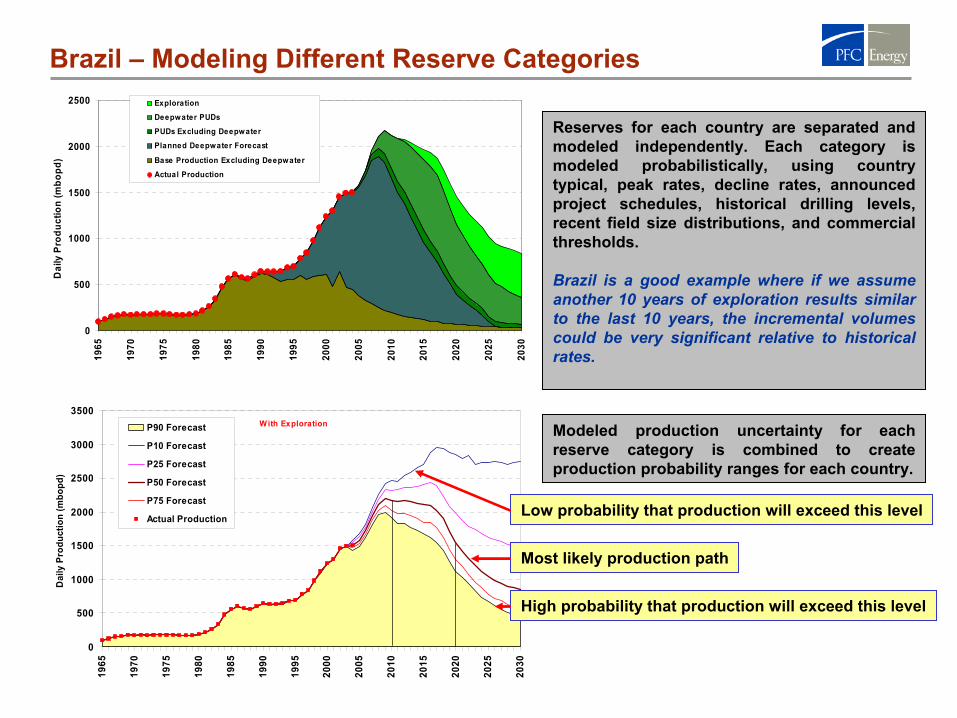
Brazil – Modeling Different Reserve Categories
Reserves for each country are separated and modeled independently. Each category is modeled probabilistically, using country typical, peak rates, decline rates, announced project schedules, historical drilling levels, recent field size distributions, and commercial thresholds.
Brazil is a good example where if we assume another 10 years of exploration results similar to the last 10 years, the incremental volumes could be very significant relative to historical rates.
Modeled production uncertainty for each reserve category is combined to create production probability ranges for each country.
High probability that production will exceed this level
Low probability that production will exceed this level
Most likely production path
0
500
1000
1500
2000
250019
65
1970
1975
1980
1985
1990
1995
2000
2005
2010
2015
2020
2025
2030
Dai
ly P
rodu
ctio
n (m
bopd
)
Exploration
Deepwater PUDs
PUDs Excluding Deepwater
Planned Deepwater Forecast
Base Production Excluding Deepwater
Actual Production

Global: Non-OPEC Non FSU Crude Supply Forecast (With Exploration)
-
5,000
10,000
15,000
20,000
25,000
30,000
35,000
1965
1970
1975
1980
1985
1990
1995
2000
2005
2010
2015
2020
Dai
ly C
rude
Pro
duct
ion
(mb/
d)
P10e Forecast
P25e Forecast
P50e Forecast
P75e Forecast
P90e Forecast
Crude Oil Production Forecast with an Exploration Component (Excluding OPEC, Natural Gas Liquids, FSU, and Canadian Oil Sands)
PFC Energy’s models suggest that the flat trend noted since the late 1990s is very likely to continue through the end of this decade with production declines beginning in the early part of the next decade – going forward it is possible that for a few years production could increase before declines start in the next decade or it is possible that production could start a gentle decline sooner
Possible production path if exploration results and decline rates fall at the more pessimistic end of the scale
Most likely production path
Possible production path if exploration results and decline rates fall at the more optimistic end of the scale

Historical Crude Production (Excluding OPEC, Natural Gas Liquids and Canadian Oil Sands)
Post 1998 Non-OPEC conventional crude oil production growth was largely drivenby growth in the FSU and specifically Russia.
0
5000
10000
15000
20000
25000
30000
35000
40000
45000
1965
1968
1971
1974
1977
1980
1983
1986
1989
1992
1995
1998
2001
2004
Dai
ly P
rodu
ctio
n (m
bopd
)
FSULatin AmericaWest AFricaMiddle EastAsiaMexicoEuropeCanadaUSA
FSU Data incomplete prior to 1985

FSU Crude Oil Production Forecast with Exploration
PFC Energy’s models suggest that FSU production could grow though the end of this decade (peaking at about 14 million barrels per day), however the increasing level of reserve base depletion will inevitably result in production declines in the next decade.
Russia and CIS: Non-OPEC Crude Supply Forecast (With Exploration)
-
2,000
4,000
6,000
8,000
10,000
12,000
14,000
16,000
18,00019
85
1990
1995
2000
2005
2010
2015
2020
Dai
ly C
rude
Pro
duct
ion
(mb/
d)
P10e Forecast
P25e Forecast
P50e Forecast
P75e Forecast
P90e Forecast
Possible production path if exploration results and decline rates fall at the more optimistic end of the scale
Possible production path if exploration results and decline rates fall at the more pessimistic end of the scale
Most likely production path

Production Forecast from Canadian Oil Sands
0
500
1000
1500
2000
2500
3000
3500
4000
4500
1980
1985
1990
1995
2000
2005
2010
2015
2020
Dai
ly P
rodu
ctio
n (m
bopd
)P90 Forecast
Current Forecast
P75 Forecast
P50 Forecast
P25 Forecast
P10 Forecast
A review of various project proposals suggests that in an optimistic case Canadian Oil Sand production could quadruple by 2020 although the Canadian Government has stated the most likely case is a doubling of production by 2012 and continued growth beyond

NGL Production Forecast
0
2000
4000
6000
8000
10000
12000
14000
1600019
93
1995
1997
1999
2001
2003
2005
2007
2009
2011
2013
2015
2017
2019
Dai
ly N
GL
Prod
uctio
n (m
bopd
)
OPEC
FSU
North America
Middle East
Latin America
Europe
Asia
0
1000
2000
3000
4000
5000
6000
7000
8000
9000
1993
1995
1997
1999
2001
2003
2005
2007
2009
2011
2013
2015
2017
2019
Dai
ly P
rodu
ctio
n (m
bopd
)
P90 Forecast
P75 Forecast
P50 Forecast
P25 Forecast
P10 Forecast
NGL Production will grow as large scale global gas projects are built to supply growing demands for natural gas. Much of the NGL growth is located within OPEC group countries like Qatar, UAE, Nigeria and others.

Global Non-OPEC Total Liquids with Exploration
A combined forecast of Non-OPEC crude as well as Non-OPEC natural gas liquids and Canadian Oil Sand production suggests that production will grow to between 52 and 55 million barrels per day with declines beginning in the early to middle part of the next decade.
Global: Non-OPEC All Liquids Supply Forecast (With Exploration)
-
10,000
20,000
30,000
40,000
50,000
60,000
1985
1990
1995
2000
2005
2010
2015
2020
Dai
ly C
rude
Pro
duct
ion
(mb/
d)
P10e Forecast
P25e Forecast
P50e Forecast
P75e Forecast
P90e Forecast

Global Non-OPEC Total Liquids without Exploration
There are forecasts out there or coming out which argue that the peak is already here or very close – most forecasts do not build in an exploration component which has been attempted in PFC Energy’s methodology
Global: Non-OPEC All Liquids Supply Forecast (Without Exploration)
-
10,000
20,000
30,000
40,000
50,000
60,000
1985
1990
1995
2000
2005
2010
2015
2020
Dai
ly C
rude
Pro
duct
ion
(mb/
d)P10 Forecast
P25 Forecast
P50 Forecast
P75 Forecast
P90 Forecast

Global Non-OPEC Total Liquids with Exploration
A combined forecast of Non-OPEC crude as well as Non-OPEC natural gas liquids and Canadian Oil Sand production suggests that production will grow to between 52 and 55 million barrels per day with declines beginning in the early to middle part of the next decade.
0
10,000
20,000
30,000
40,000
50,000
60,000
1985
1987
1989
1991
1993
1995
1997
1999
2001
2003
2005
2007
2009
2011
2013
2015
2017
2019
Dai
ly P
rodu
ctio
n (m
bopd
)
Canadian Oil SandsNGL
FSUAustral Asia
North AmericaNon OPEC MENA
Latin AmericaEurope
West Africa
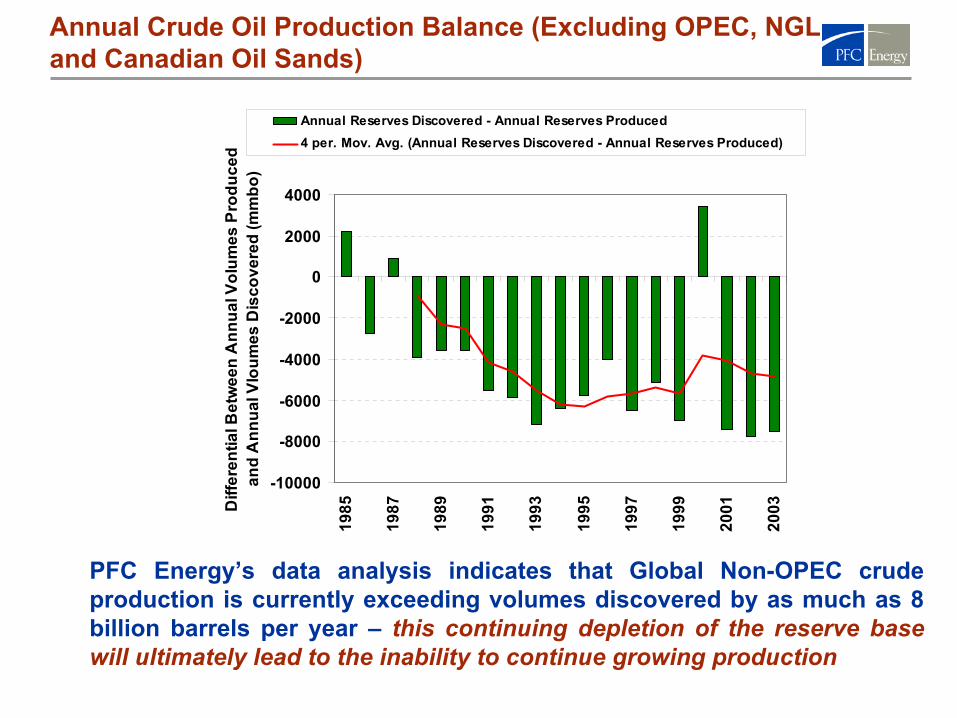
Annual Crude Oil Production Balance (Excluding OPEC, NGL and Canadian Oil Sands)
-10000
-8000
-6000
-4000
-2000
0
2000
4000
1985
1987
1989
1991
1993
1995
1997
1999
2001
2003D
iffer
entia
l Bet
wee
n A
nnua
l Vol
umes
Pro
duce
d an
d A
nnua
l Vlo
umes
Dis
cove
red
(mm
bo)
Annual Reserves Discovered - Annual Reserves Produced4 per. Mov. Avg. (Annual Reserves Discovered - Annual Reserves Produced)
PFC Energy’s data analysis indicates that Global Non-OPEC crude production is currently exceeding volumes discovered by as much as 8 billion barrels per year – this continuing depletion of the reserve base will ultimately lead to the inability to continue growing production

The Problem - The Expected Growing Gap Between Global Demand and Global Non-OPEC Supply
0
20,000
40,000
60,000
80,000
100,000
120,000
1985
1987
1989
1991
1993
1995
1997
1999
2001
2003
2005
2007
2009
2011
2013
2015
2017
2019
Dai
ly P
rodu
ctio
n (m
bopd
)
0
20,000
40,000
60,000
80,000
100,000
120,000
Non OPECCrude Oil Non-OPEC NGL
Non-OPEC Oil Sands 1.1% Growth
1.8% Growth 2.4% Growth
The Growing Differential Between Non-OPEC Supply Capacity and
Global Demand

Global Demand Trends
PFC demand scenarios in historical context: demand (excluding the FSU) grew by 1.7% between 1980 and 2004
-3.0%
-2.0%
-1.0%
0.0%
1.0%
2.0%
3.0%
4.0%
1980 1985 1990 1995 2000
2.4% growth rate1.8% growth rate1.1% growth rate

OPEC Creaming Curve
Cumulative Reserves (mmbo)
0
200,000
400,000
600,000
800,000
1,000,000
1,200,000
1950
1954
1958
1962
1966
1970
1974
1978
1982
1986
1990
1994
1998
2002
Cum
ulat
ive
Res
erve
s (m
mbo
)
OPEC’s creaming curve is no different from creaming curves for other basins, countries, or regions – hundreds of new fields were discovered during the period 1975 to Present but like other areas they are considerably smaller than fields discovered in years prior

OPEC Historical Annual Crude Production Balance (OPEC)
Chart Title
-10000
-8000
-6000
-4000
-2000
0
2000
4000
6000
8000
10000
1965
1968
1971
1974
1977
1980
1983
1986
1989
1992
1995
1998
2001
Diff
eren
tial B
etw
een
Ann
ual V
olum
es P
rodu
ced
and
Ann
ual V
loum
es D
isco
vere
d (m
mbo
)
Annual Reserves Discovered - Annual Reserves Produced3 per. Mov. Avg. (Annual Reserves Discovered - Annual Reserves Produced)
Like all other areas of the world, PFC Energy’s data analysis indicates that Global OPEC crude production is currently exceeding volumesdiscovered. OPEC specifically is producing about 8 billion barrels per year more than it has been finding.

Historical Production and Depletion Levels (OPEC)
0
4000
8000
12000
16000
20000
24000
28000
32000
36000
40000
1965
1968
1971
1974
1977
1980
1983
1986
1989
1992
1995
1998
2001
2004
Dai
ly P
rodu
ctio
n (m
bopd
)
0%
10%
20%
30%
40%
50%
60%
70%
80%
90%
100%
Cum
Pro
d/C
um R
eser
ves
Daily Production
Cum Production/Cum Reserves
OPEC as a group is depleting at a rate of about 1% per year, even taking into account new discoveries – during the 1990s reserves likely depleted by another 10 percentage points

0%10%20%30%40%50%60%70%80%90%
100%
Iraq
UAEKuwait
LibyaSau
diAlgeri
aNigeri
a
Iran
Venez
uelaQata
rIndones
iaR
eser
ve B
ase
Dep
letio
n (%
)
Historical Production and Depletion Levels (OPEC)
In Decline
Conventional Oil Production has been declining for several years calling into question currently
reported reserves
At or Near Plateau
OPEC as a whole is depleting but some countries are depleting faster than others

When Is The Tipping Point in a Low (1.1%) Demand Growth Scenario?In a low demand growth scenario, as in all demand growth scenarios, OPEC will see a growing market share as non OPEC liquids production falls in the latter part of the next decade. Based on estimates of remaining OPEC reserves and persistent negative annual petroleum balances, there will come a time when OPEC production will not be able to fill the growing gap between demand and non-OPEC production capacity. In a low demand growth scenario, OPEC production will likely meet global demand in the through the end of the next decade but not beyond 2025.
2030405060708090
100
2005
2007
2009
2011
2013
2015
2017
2019
Non OPEC Proc GainNGLs OPEC ProductionDemand
Global Supply and Demand; million b/d

When Is The Tipping Point in a Base Case (1.8%) Demand Growth Scenario?
In a base case demand growth scenario, as in all demand growth scenarios, OPEC will see a growing market share as non OPEC liquids production falls in the latter part of the next decade. Based on estimates of remaining OPEC reserves and persistent negative annual petroleum balances, there will come a time when OPEC production will not be able to fill the growing gap between demand and non-OPEC production capacity. In a base case demand growth scenario, OPEC production will likely not be able to meet global demand in the latter part of the next decade.
Global Supply and Demand; million b/d
2030405060708090
100110
2005
2007
2009
2011
2013
2015
2017
2019
Non OPEC Proc GainNGLs OPEC ProductionDemand

When Is The Tipping Point in a High (2.4%) Demand Growth Scenario?
In a high demand growth scenario, as in all demand growth scenarios, OPEC will see a growing market share as non OPEC liquids production falls in the latter part of the next decade. Based on estimates of remaining OPEC reserves and persistent negative annual petroleum balances, there will come a time when OPEC production will not be able to fill the growing gap between demand and non-OPEC production capacity. In a high demand growth scenario, OPEC production will likely not be able to meet global demand as early as the middle part of the next decade.
Global Supply and Demand; million b/d
20
40
60
80
100
120
2005
2007
2009
2011
2013
2015
2017
2019
Non OPEC Proc GainNGLs OPEC ProductionDemand

Production Declining In The OECD Countries
0
1,000
2,000
3,000
4,000
5,000
6,000
7,000
1997 2002 2007 2012 2017
mmb/d
Europe North America
8,000
9,000
10,000
11,000
12,000
1997 2002 2007 2012 2017
mmb/d

Latin America And Asia Not Keeping Up
AsiaLatin America
2,000
2,500
3,000
3,500
4,000
4,500
1997 2002 2007 2012 2017
mmb/d
4,500
5,500
6,500
7,500
1997 2002 2007 2012 2017
mmb/d

Increasing Dependency From Less Stable Areas
West AfricaFSU
4,000
6,000
8,000
10,000
12,000
14,000
1997 2002 2007 2012 2017
mmb/d
1,000
2,000
3,000
4,000
1997 2002 2007 2012 2017
mmb/d

The Persian Gulf Can Grow Production
17,000
21,000
25,000
29,000
33,000
1997 2002 2007 2012 201724%
28%
32%
36%OPEC Persian Gulf Production
OPEC PG Production as % of Global Supply
mmb/d

+0.55- 0.09
+ 0.50
- 0.15+0.88
Do Not Include The Totality of Suppliers. Only the Most significant flows are shown.The Map Includes Exports from Canada, Latin America, Middle East, North Sea, West Africa, West Africa, FSU to Selected Regions
Middle EastWest AfricaNorth SeaCanadaSE AsiaFSULatin America
+0.20
+4.2-0.7
-2.60 +3.7
+2.9 Imports From
- 0.30
2010-1997 Delta Growth in Crude FlowsFor Selected Consuming Regions
Increasing Dependency From Less Stable Areas
mmb/d

+53%-19%
+30%
-15%+25%
Do Not Include The Totality of Suppliers. Only the Most significant flows are shown.The Map Includes Exports from Canada, Latin America, Middle East, North Sea, West Africa, West Africa, FSU to Selected Regions
+20%-70%
+670%
-26%
2010-1997 World Flows % Change To Selected Consuming Regions
Supply Fears Due To Concentrated Exports
+269%- 21%
+60%

0
2,000
4,000
6,000
8,000
10,000
97
Canada
Latin America
NWE
Middle East
West Africa
Others0
2,000
4,000
6,000
8,000
10,000
12,000
09
Crude Flows To The US
kb/d
Exports To The US From Selected Suppliers
TOTAL = 8,900 kb/d
kb/d
3,5354,430
1,2201,770
1,7471,590
1,692 2,200
493 398
1997 2010
Exports To The US From Selected Suppliers
TOTAL = 10,800 kb/d

0
2,000
4,000
6,000
8,000
10,000
97
SE Asia
Middle East
West Africa
Others
0
2,000
4,000
6,000
8,000
10,000
12,000
14,000
16,000
09kb/d
Exports To Asia1 From Selected Suppliers
kb/d
1997 2010
Exports To Asia1 From Selected Suppliers
6,300
10,050
4423,340
1,160
790
TOTAL = 8,000 kb/d
TOTAL = 14,200 kb/d
Crude Flows To Asia1
1. Asia = China, Japan, Korea, India

Price Implications
The excess capacity that existed after 1985 has now disappeared
Who is willing to recreate a capacity cushion in the world oil market?– Iran, Russia, Venezuela, Iraq– Kuwait, UAE, Saudi Arabia
Between 2005 and 2008, both West Africa and the FSU will bring large projects on line, creating a window of vulnerability for oil prices (depending on the demand scenario)
In the medium term, if the key producers do not build excess capacity (beyond the 1.5 million b/d that Saudi Arabia appears to be willing to maintain),
– prices will move structurally higher,
– and face greater volatility
The oil market does not work well without a supply safety net

Strategic Implications
Higher volumes and higher prices will bring back large financialsurpluses to the Middle East and the Persian Gulf.
The new-found wealth will alter the present strategic relationship with the US: despite louder calls for reforms from the US, the region will spend its way out of reforms, and the regimes will have the opportunity to use their financial might to co-opt and divide the different interest groups.
The US will face more competition from emerging strategic players to secure access to oil.
There is no alternative to dependence on Middle Eastern oil, but there will be alternatives to oil.
Managing demand becomes a key strategic issue for the US

Strategic Advisors in Global Energy
Offices
1300 Connecticut Avenue, N.W. Suite 800Washington, DC 20036 USATel: (1 202) 872 1199 Fax: (1 202) 872 1219
3, cité Paradis75010 Paris, FranceTel: (33 1) 47 70 29 00 Fax: (33 1) 47 70 27 37
Houston, TexasTel: (1 281) 599 7099 Fax: (1 281) 599 9891
London, United KingdomTel: 44 (0)1256 760678Fax: 44 (0)1256 760678
[email protected] www.pfcenergy.com


