44
1 ST - 31 ST March 2016 . Vol 3 Issue 2. For Private Circulation Only pg 31. INTERVIEW: Dr A Velumani pg 34. INDIAN ECONOMY– Trend indicators pg 36. PhillipCapital Coverage Universe

1ST - 31ST March 2016 . Vol 3 Issue 2. For Private Circulation Only
pg 31. INTERVIEW: Dr A Velumani
pg 34. INDIAN ECONOMY– Trend indicators
pg 36. PhillipCapital Coverage Universe
3GROUND VIEW GROUND VIEW 1 - 31 March 2016 1 - 31 March 2016 2
VOL 3 . ISSUE 2 . 1ST - 31ST MAR 2016
Vineet Bhatnagar- Managing Director and CEO
EDITORIAL BOARDNaveen Kulkarni, Manish Agarwalla, Kinshuk Bharti Tiwari
COVER & MAGAZINE DESIGN Chaitanya Modak, www.inhousedesign.co.in
EDITORRoshan Sony
RESEARCHBanking, NBFCs Manish Agarwalla | Pradeep Agrawal | Paresh JainConsumer, Media, TelecomNaveen Kulkarni | Jubil Jain | Manoj BeheraCementVaibhav Agarwal Economics Anjali Verma Engineering, Capital Goods Jonas Bhutta | Hrishikesh BhagatInfrastructure & IT ServicesVibhor SinghalLogistics, Transportation & MidcapVikram SuryavanshiMidcap Amol RaoMetals & AutomobilesDhawal Doshi | Nitesh Sharma | Yash DoshiAgri Inputs Gauri AnandOil & Gas Sabri HazarikaPharmaceuticals Surya Patra | Mehul Sheth
PORTFOLIO STRATEGYAnindya Bhowmik
TECHNICALSSubodh Gupta
PRODUCTION MANAGERGanesh Deorukhkar
MID-CAPS & DATABASE MANAGERDeepak Agrawal
SR. MANAGER - EQUITIES SUPPORTRosie Ferns
FOR EDITORIAL QUERIES:PhillipCapital (India) Private Limited No. 1, 18th Floor, Urmi Estate, 95 Ganpatrao Kadam Marg, Lower Parel West, Mumbai 400 013
SALES & DISTRIBUTION Ashvin Patil, Shubhangi Agrawal, Kishor Binwal, Bhavin Shah, Varun Kumar, Ashka Gulati
CORPORATE COMMUNICATIONS Zarine Damania
1st Jan 2016 Issue 1 1st Dec 2015 Issue 9
1st Dec 2015 Issue 8 1st Nov 2015 Issue 7
Ground View - Previous Issues
1st Oct 2015 Issue 6 1st July 2015 Issue 5
3GROUND VIEW GROUND VIEW 1 - 31 March 2016 1 - 31 March 2016 2
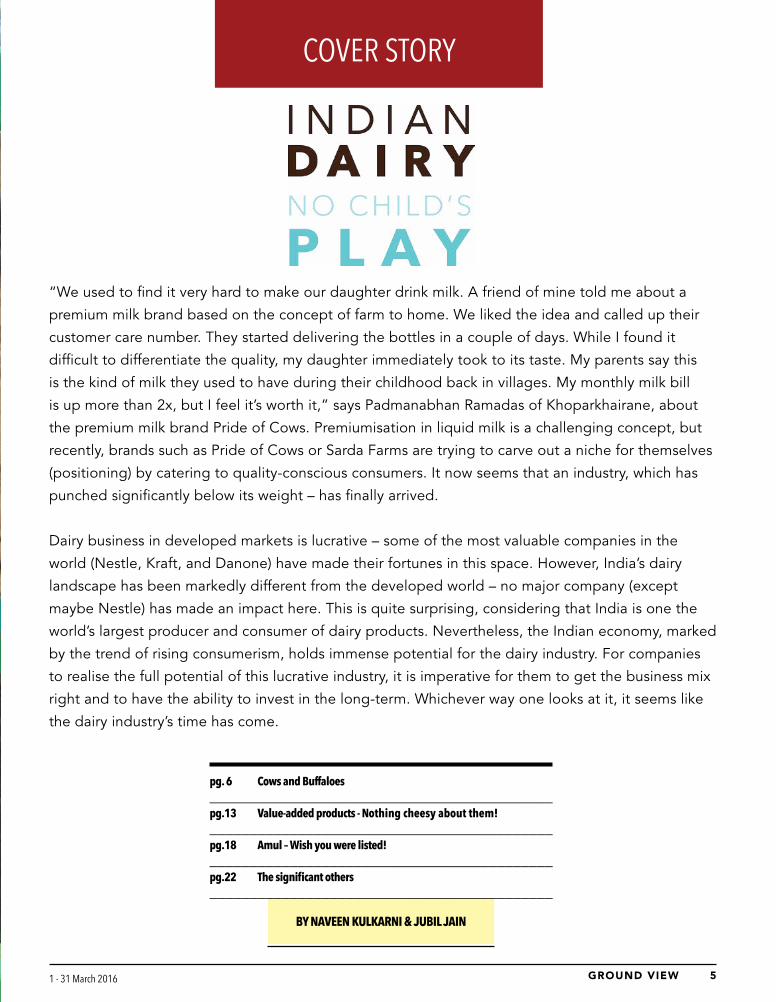
4. COVER STORY: INDIAN DAIRY: NO CHILD’S PLAY
Ground View explores the dynamics of the Indian dairy industry - its opportunities and challenges
31. INTERVIEW: Dr A Velumani CMD, Thyrocare Technologies Ltd.
He has revolutionised the Indian diagnostic indus-try with Thyrocare’s focus on preventive care (vs. competitions’ focus on sick care) and maintains high profitability, despite disruptive pricing practice.
34. Indian Economy
Trend indicators
36. PhillipCapital Coverage Universe:
Valuation Summary
LETTER FROM THE MANAGING DIRECTORSince ancient times, the cow has been a symbol
of wealth in India. It was venerated by Mahatma
Gandhi. It’s no surprise that India is the home to the
world’s largest herd of domesticated cattle. Intuitive-
ly, this implies that India should be the global leader
for dairy products. However, this is far from reality.
While India is the largest producer of milk, it is not
known for its dairy products. Even as Indian per
capita dairy consumption has increased three-fold in
the last forty five years, it is significantly lower than
the global average. No wonder the industry growth
continues to remain high and business opportunities
abound.
However, these opportunities come with great
challenges. Unlike the developed markets where
examples of successful dairy businesses are rife, the
Indian market has evolved very differently. Co-oper-
atives such as Gujarat Cooperative Milk Marketing
Federation (GCMMF), owner of the iconic brand
Amul, dominate the market. While this scenario will
persist, private players are slowly finding their foot-
ing and exploring innovative business models.
Our cover story on the Indian dairy industry –
penned by our research analysts Naveen Kulkarni
and Jubil Jain – delves deep into the nuances of
the rising industry. It explores the business mod-
els, product mix, and long-term strategy required
to succeed in this business. Also read in this issue,
an interview with Dr Velumani, CMD of Thyrocare,
where he talks about the trends and developments
in the fast-growing and exciting diagnostics industry.
Best Wishes
Vineet Bhatnagar
CONTENTS

5GROUND VIEW GROUND VIEW 1 - 31 March 2016 1 - 31 March 2016 4
A calf at Parag Milk Foods’ Bhagyalaxmi dairy farm cosying up to visitors
5GROUND VIEW GROUND VIEW 1 - 31 March 2016 1 - 31 March 2016 4
COVER STORY
BY NAVEEN KULKARNI & JUBIL JAIN
pg. 6 Cows and Buffaloes___________________________________________pg.13 Value-added products - Nothing cheesy about them! ___________________________________________pg.18 Amul – Wish you were listed!___________________________________________pg.22 Thesignificantothers___________________________________________
“We used to find it very hard to make our daughter drink milk. A friend of mine told me about a
premium milk brand based on the concept of farm to home. We liked the idea and called up their
customer care number. They started delivering the bottles in a couple of days. While I found it
difficult to differentiate the quality, my daughter immediately took to its taste. My parents say this
is the kind of milk they used to have during their childhood back in villages. My monthly milk bill
is up more than 2x, but I feel it’s worth it,” says Padmanabhan Ramadas of Khoparkhairane, about
the premium milk brand Pride of Cows. Premiumisation in liquid milk is a challenging concept, but
recently, brands such as Pride of Cows or Sarda Farms are trying to carve out a niche for themselves
(positioning) by catering to quality-conscious consumers. It now seems that an industry, which has
punched significantly below its weight – has finally arrived.
Dairy business in developed markets is lucrative – some of the most valuable companies in the
world (Nestle, Kraft, and Danone) have made their fortunes in this space. However, India’s dairy
landscape has been markedly different from the developed world – no major company (except
maybe Nestle) has made an impact here. This is quite surprising, considering that India is one the
world’s largest producer and consumer of dairy products. Nevertheless, the Indian economy, marked
by the trend of rising consumerism, holds immense potential for the dairy industry. For companies
to realise the full potential of this lucrative industry, it is imperative for them to get the business mix
right and to have the ability to invest in the long-term. Whichever way one looks at it, it seems like
the dairy industry’s time has come.

7GROUND VIEW GROUND VIEW 1 - 31 March 2016 1 - 31 March 2016 6
In India, dairy is a very sensitive industry be-
cause of the sheer number of people involved.
“The welfare of farmers and animals is the
most critical aspect of the business,” says Mr R
S Sodhi, MD of Gujarat Cooperative Milk Market-
ing Federation, which markets its products under
the iconic brand Amul. The number of people in-
volved in the dairy industry in India is the largest
in the world. However, the industry is still largely
unorganised. Small farmers (who do not own
more than two animals) produce nearly 80% of
milk. Because of this, most farmers are unable to
get advantages of mechanisation that large herds
can avail of – hence, milk yields in India are very
low. The World Society for the Protection of Ani-
mals pegs India’s average yield per dairy cow per
CO W S A N D B U F FA LO E S
Highly sensitive, but largely unorganised
– Due to small average herd sizes, milk yields in India are far below global averages
– The unorganised sector accounts for 70% of India’s total dairy volumes
year at 1.3tonnes vs. 6.2tonnes in the European
Union and 9.1tonnes in the United States.
It is not just the milk sourcing, it is also the struc-
ture – the unorganised sector accounts for 70% of
total volumes. Half of the 140mn tonnes of milk
produced in FY14 was consumed at source. Out of
the remaining 70mn tonnes, 28mn tonnes or 40%
was sold to the organised sector and the rest to
the unorganised sector. Co-operatives dominate
the organised dairy industry (80% of revenue) be-
cause of raw-material sourcing dynamics working
in their favour.
Milk - Sectorwise usage
Source: Amul, PhillipCapital India Research Estimates
7GROUND VIEW GROUND VIEW 1 - 31 March 2016 1 - 31 March 2016 6
Co-operative is king….
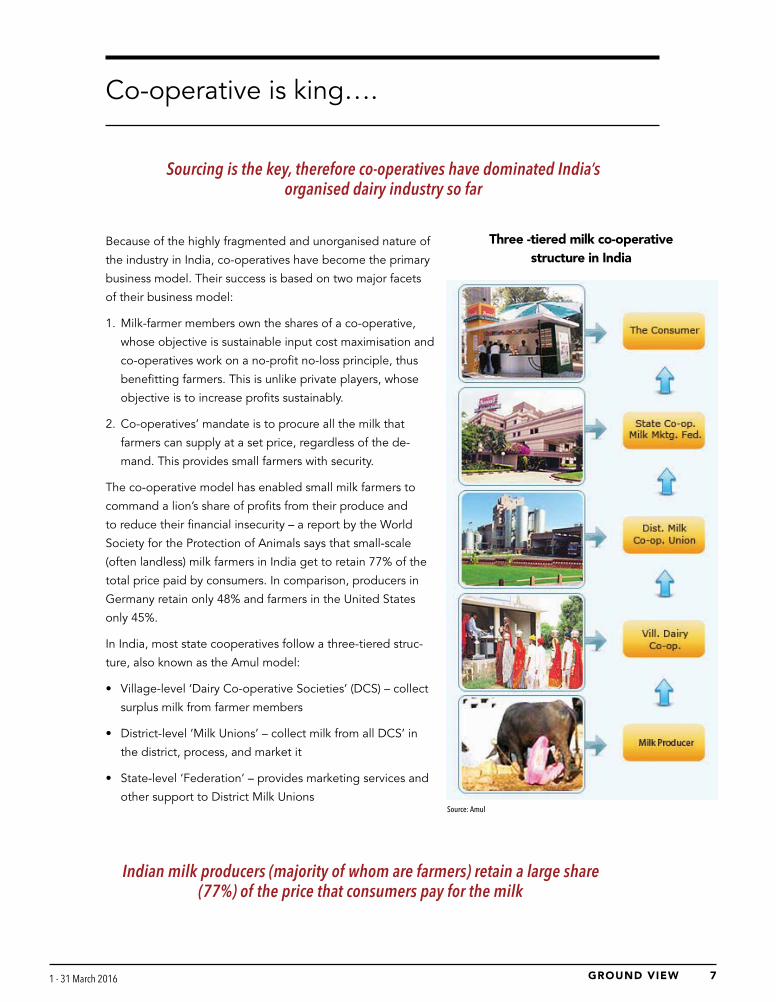
Sourcing is the key, therefore co-operatives have dominated India’s organised dairy industry so far
Indian milk producers (majority of whom are farmers) retain a large share (77%) of the price that consumers pay for the milk
Because of the highly fragmented and unorganised nature of
the industry in India, co-operatives have become the primary
business model. Their success is based on two major facets
of their business model:
1. Milk-farmer members own the shares of a co-operative,
whose objective is sustainable input cost maximisation and
co-operatives work on a no-profit no-loss principle, thus
benefitting farmers. This is unlike private players, whose
objective is to increase profits sustainably.
2. Co-operatives’ mandate is to procure all the milk that
farmers can supply at a set price, regardless of the de-
mand. This provides small farmers with security.
The co-operative model has enabled small milk farmers to
command a lion’s share of profits from their produce and
to reduce their financial insecurity – a report by the World
Society for the Protection of Animals says that small-scale
(often landless) milk farmers in India get to retain 77% of the
total price paid by consumers. In comparison, producers in
Germany retain only 48% and farmers in the United States
only 45%.
In India, most state cooperatives follow a three-tiered struc-
ture, also known as the Amul model:
• Village-level ‘Dairy Co-operative Societies’ (DCS) – collect
surplus milk from farmer members
• District-level ‘Milk Unions’ – collect milk from all DCS’ in
the district, process, and market it
• State-level ‘Federation’ – provides marketing services and
other support to District Milk Unions
Three -tiered milk co-operative structure in India
Source: Amul

9GROUND VIEW GROUND VIEW 1 - 31 March 2016 1 - 31 March 2016 8
…but, co-operative is not always a very strong king
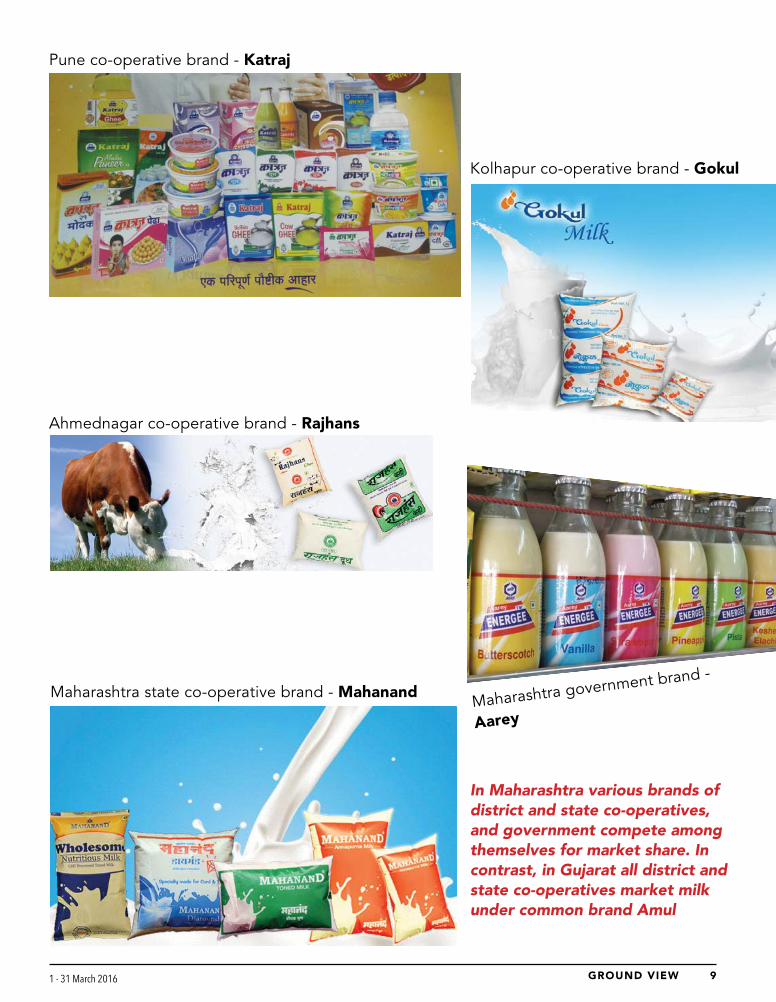
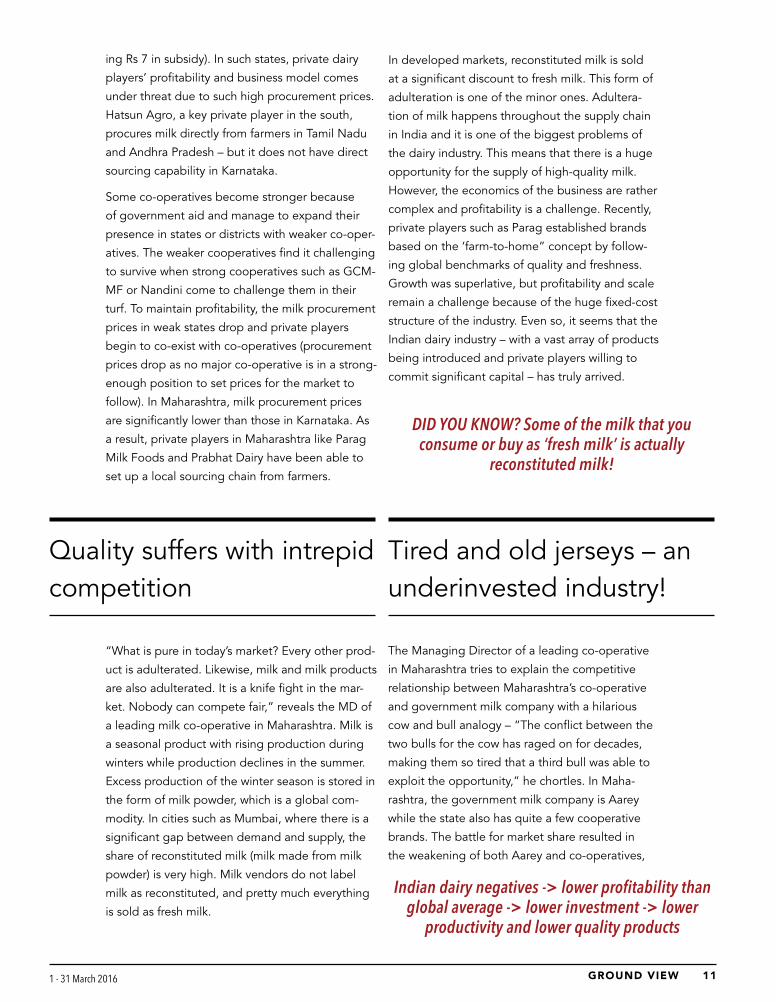
In Gujarat and Karnataka, state co-operatives direct all dis-
trict co-operatives to market products under a single um-
brella brand (Amul for Gujarat and Nandini for Karnataka). In
other states, such as Maharashtra, the co-operative structure
is weak and each district milk union markets goods under a
different brand (Katraj in Pune, Gokul in Kolhapur).
The Managing Director of a district cooperative in Maharash-
tra (who did not wish to be named) says, “States that have a
common state-wide dairy brand have outperformed weaker
ones that don’t have one. This is because of consistency
and economies of scale in marketing products, which helps
strong states strengthen their sales and distribution chain.”
He explains what is wrong with the state-controlled side of
Maharashtra’s dairy industry – “In Maharashtra, the state
co-operative markets products under the Mahananda brand,
which is distinct from district-level brands like Katraj, Gokul
and others. To complicate things further, the government
of Maharashtra also markets dairy products under a distinct
Aarey brand. In Maharashtra, as district milk unions, state
cooperatives, and the state government compete amongst
themselves for market share, individual brands lose their
economies of scale, impacting sales potential for coopera-
tives – thereby paving the way for private dairies.”
Besides sourcing skills, the presence of a strong single state-wide brand seems to be the cornerstone of a co-operative’s success
Co-operative structure in Gujarat
Source: Amul
9GROUND VIEW GROUND VIEW 1 - 31 March 2016 1 - 31 March 2016 8
Kolhapur co-operative brand - Gokul
Pune co-operative brand - Katraj
Maharashtra government brand -
Aarey
Ahmednagar co-operative brand - Rajhans
Maharashtra state co-operative brand - Mahanand
In Maharashtra various brands of district and state co-operatives, and government compete among themselves for market share. In contrast, in Gujarat all district and state co-operatives market milk under common brand Amul

11GROUND VIEW GROUND VIEW 1 - 31 March 2016 1 - 31 March 2016 10
Farmers suffer because of a weak co-operative
Private dairies and bulk milk collectors – the cogs in the wheel
While Gujarat co-operative’s Amul brand has been
a success story and competes with not only strong
domestic brands, but also with global ones, Ma-
harashtra’s local co-operative brands (Mahananda
and others) have been ineffective in competing
with other co-operatives and private brands. This
has adversely affected the bargaining power of
milk farmers. “In Maharashtra, where procurement
prices for milk have reduced to as low as Rs 15-16
from Rs 25-27, the situation is particularly exacer-
bated because of lack of a strong cooperative. In
Gujarat, the situation is much better because our
procurement prices are significantly higher”, says
Mr R S Sodhi of Amul.
Milk co-operatives not only offer farmers among
the highest prices for milk procurement, but also
have a mandate to purchase all the milk that a
farmer sells, irrespective of near-term demand. Pri-
vate dairies and bulk-milk traders, which generally
procure milk at lower/equal prices, also play an
important role in milk production. Prabhat Dairy
sources 65% of its milk directly through farmers
and buys the rest from bulk-milk vendors. Kwality
Dairy procures as much as 85% of its milk from
vendors.
Why should private milk collectors exist?
Even as co-operatives offer the highest procure-
ment prices to farmers and buy all the milk for
sale, private dairies and bulk-milk vendors tend
to be stronger in villages with lower access to
organised banking. In these villages, small farmers
borrow funds from local landlords, and in many
cases from private milk collectors. These small
farmer-borrowers, in many cases, repay milk
collectors in kind – by supplying milk. As farmers
develop an association with private milk collectors,
and once the latter become a reliable source of
funds, farmers begin selling milk regularly to these
private milk collectors, despite co-operatives offer-
ing higher prices.
Room for all, even in the long term
The business models of private players and co-op-
eratives are in perpetual conflict, but India is and
will continue to be a surplus producer of milk with
a very large unorganised market (even in the very
long-term), and this provides room for all types
of players. However, co-operatives have been
aggressively competing for market share, keeping
selling prices low – this has impacted the quality of
products and profitability of the industry.
Subsidies offered to co-operatives embolden
the strong ones
For nearly three years (from July 2013 to January
2016) the Karnataka government provided a subsi-
dy of Rs 4 per litre to dairy producers and families.
In January 2016, the government increased this
subsidy to Rs 7 per litre. As a result, farmers in
Karnataka get ~Rs 28 per litre for cow milk (includ-
Co-operatives’ practice of keeping selling prices low and maximising buying prices has affected
the quality of products
India volumes (mn tonnes) Production Consumption
FY11 122 113
FY12 128 119
FY13 132 125
FY14 140 130
FY15 147 138
Milk production and consumption in India
Source: IMARC report
11GROUND VIEW GROUND VIEW 1 - 31 March 2016 1 - 31 March 2016 10
ing Rs 7 in subsidy). In such states, private dairy
players’ profitability and business model comes
under threat due to such high procurement prices.
Hatsun Agro, a key private player in the south,
procures milk directly from farmers in Tamil Nadu
and Andhra Pradesh – but it does not have direct
sourcing capability in Karnataka.
Some co-operatives become stronger because
of government aid and manage to expand their
presence in states or districts with weaker co-oper-
atives. The weaker cooperatives find it challenging
to survive when strong cooperatives such as GCM-
MF or Nandini come to challenge them in their
turf. To maintain profitability, the milk procurement
prices in weak states drop and private players
begin to co-exist with co-operatives (procurement
prices drop as no major co-operative is in a strong-
enough position to set prices for the market to
follow). In Maharashtra, milk procurement prices
are significantly lower than those in Karnataka. As
a result, private players in Maharashtra like Parag
Milk Foods and Prabhat Dairy have been able to
set up a local sourcing chain from farmers.
Quality suffers with intrepid competition
Tired and old jerseys – an underinvested industry!
“What is pure in today’s market? Every other prod-
uct is adulterated. Likewise, milk and milk products
are also adulterated. It is a knife fight in the mar-
ket. Nobody can compete fair,” reveals the MD of
a leading milk co-operative in Maharashtra. Milk is
a seasonal product with rising production during
winters while production declines in the summer.
Excess production of the winter season is stored in
the form of milk powder, which is a global com-
modity. In cities such as Mumbai, where there is a
significant gap between demand and supply, the
share of reconstituted milk (milk made from milk
powder) is very high. Milk vendors do not label
milk as reconstituted, and pretty much everything
is sold as fresh milk.
In developed markets, reconstituted milk is sold
at a significant discount to fresh milk. This form of
adulteration is one of the minor ones. Adultera-
tion of milk happens throughout the supply chain
in India and it is one of the biggest problems of
the dairy industry. This means that there is a huge
opportunity for the supply of high-quality milk.
However, the economics of the business are rather
complex and profitability is a challenge. Recently,
private players such as Parag established brands
based on the ‘farm-to-home” concept by follow-
ing global benchmarks of quality and freshness.
Growth was superlative, but profitability and scale
remain a challenge because of the huge fixed-cost
structure of the industry. Even so, it seems that the
Indian dairy industry – with a vast array of products
being introduced and private players willing to
commit significant capital – has truly arrived.
DID YOU KNOW? Some of the milk that you consume or buy as ‘fresh milk’ is actually
reconstituted milk!
The Managing Director of a leading co-operative
in Maharashtra tries to explain the competitive
relationship between Maharashtra’s co-operative
and government milk company with a hilarious
cow and bull analogy – “The conflict between the
two bulls for the cow has raged on for decades,
making them so tired that a third bull was able to
exploit the opportunity,” he chortles. In Maha-
rashtra, the government milk company is Aarey
while the state also has quite a few cooperative
brands. The battle for market share resulted in
the weakening of both Aarey and co-operatives,
Indian dairy negatives -> lower profitability than global average -> lower investment -> lower
productivity and lower quality products

13GROUND VIEW GROUND VIEW 1 - 31 March 2016 1 - 31 March 2016 12
which in turn led to private companies winning
market share. In Maharashtra, milk procurement
prices are now one of the lowest in the country, as
no major co-operative has been able to set prices
for the market to follow. This has not only helped
private players establish their business models, but
cooperatives from other states have also forayed
into the market.
This phenomenon is seen across many states –
private players have been able to establish their
brands, but the profitability of the industry is sig-
nificantly lower than in developed markets. Lower
profitability meant that investments have been be-
low par while in reality this industry requires huge
investments in supply chain, factories and farms.
Due to this, the number of dairy brands known for
their quality is very few.
Indian dairy positives -> growing per capita consumption, growing scope for value-added
products and premiumisation
Per capita consumption (litres/year)
US 285
EU27 281
Russia 220
Brazil 156
India 97
China 24Source: IMARC report
Per capita consumption of milk globally
Although profitability is low for the industry,
growth is not a concern. The per-capita consump-
tion of milk is growing, but more importantly,
value-added products are growing faster. This
segment has higher gross margins and immense
scope for premiumisation. However, there is a
catch – value-added products and liquid milk
supply chain economics are inextricably linked to
each other.
Industry size in 2010 (Rs bn)
Industry size in 2014 (Rs bn)
Industry size in 2020 (Rs bn)
CAGR 2014-2020 CAGR 2014-2020
Liquid milk 1501 2,621 6,068 15% 15%
Ghee 345 618 1,367 16% 14%
Paneer 164 293 654 16% 14%
Curd 124 216 493 15% 15%
Butter *96 168 382 15% 15%
Skimmed milk powder
28 50 113 15% 15%
UHT milk 10 26 104 27% 26%
Buttermilk 6 14 43 23% 21%
Cream 7 13 30 16% 15%
Flavoured milk 5 13 48 26% 25%
Lassi 5 12 39 26% 21%
Cheese 5 12 59 24% 31%
Whey (powder) *1.5 3 10 20% 21%
Flavoured & Frozen Yoghurt
1 2 12 23% 32%
Total 2,298 4,061 9,397 15% 15%Source: IMARC report; * - PhillipCapital India Research estimates
Historical and projected growth of milk and value added products

13GROUND VIEW GROUND VIEW 1 - 31 March 2016 1 - 31 March 2016 12
VA LU E A D D E D P R O D U C T S
Nothing cheesy about them!
Nobody can survive selling only val-
ue-added products. The dairy industry
supply chain rides on milk and its
procurement,” says Mr RS Sodhi of
GCMMF. Milk has two constituents – fat and SNF
(solid non-fat). Fat can be used for making butter,
ghee, and other value-added products, but after
extracting the fat, the SNF has to be sold. If milk
is sold separately while a company only focuses
on the supply-chain for value-added products,
then the supply-chain economics do not work out
in a fiercely competitive market.
While supply-chain economics are challenging,
cheese presents an interesting proposition. The
by-product for cheese is whey, but it is produced
in limited quantities. The market for cheese is
large in developed economies. Some of the big-
gest companies of the world, such as Kraft, built
their businesses on producing high-quality cheese.
While cheese could technically be a successful business by itself, the market for cheese in India (so far) is limited
Cheese is among the more profitable value-added milk products with gross margins higher than 25% vs. ghee with 5-10% margins
Cheese consumption growth in India
The value addition in cheese can be significant, as
aging is a critical component in manufacturing of
cheese. The level of premiumisation that cheese
offers is absent in any other dairy product. While
premiumisation opportunities are significant, and
there is a global precedence of successful business
models built on cheese, the market for cheese in
India is rather limited currently. It is seeing magnif-
icent growth rates, but hasn’t become a standard
grocery item such as ghee or butter.
Cheese-making commands higher gross mar-
gins than ghee, because it is a complex process.
Cheese requires aging of three months or more,
depending on the grade. This aging is done in
cold storage, which significantly pushes up the
Sour
ce: I
MAR
C re
port

15GROUND VIEW GROUND VIEW 1 - 31 March 2016 1 - 31 March 2016 14
Cheese – Buffalo milk
BOM Quantity (kg)
Retail Rate Rs/kg
Total amount
Input – Milk 100 34 3400
Output – Cheese 12 350 4200
Output - Whey Powder 4 40 160
Revenue (Rs) 4360
COGS (Rs) 3400
Gross Profit (Rs) 960
Gross margin (%) 22%
Cheese – Cow milk
BOM Quantity (kg)
Retail Rate Rs/kg
Total amount
Input – Milk 100 24 2400
Output – Cheese 9 350 3150
Output - Whey Powder 4 40 160
Revenue (Rs) 3310
COGS (Rs) 2400
Gross Profit (Rs) 910
Gross margin (%) 28%
Product portfolio profile and gross margins of key private dairy players
PARAG MILK FOODS PRABHAT DAIRY (2014 DATA) KWALITY DAIRY (ADJ.) HATSUN AGRO
Share in Sales
Milk and value added milk 25% 1% 51% 74%
Cheese/Paneer/Other high margin products
32% 71% 8%
Low margin products 43% 28% 49%
Unclassified 18%
Gross margin 23.6% 22.4% 10.6% 25.5%
Ghee – Buffalo milk
BOM Quantity (kg)
Retail Rate Rs/kg
Total amount
Input - Milk 100 34 3400
Output - Ghee 6.5 350 2275
Output - Skimmed Milk Powder 9.5 140 1330
Revenue (Rs) 3605
COGS (Rs) 3400
Gross Profit (Rs) 205
Gross margin (%) 6%
Ghee – Cow milk
BOM Quantity (kg)
Retail Rate Rs/kg
Total amount
Input - Milk 100 24 3000
Output - Ghee 3.5 350 1225
Output - Skimmed Milk Powder 9 140 1260
Revenue (Rs) 2485
COGS (Rs) 2400
Gross Profit (Rs) 85
Gross margin (%) 3.5
Gross margins of cheese vs. ghee
working capital and fixed capital requirements. The return
on investment on cheese depends on the retail and whole-
sale (institutional) mix as well as the ability to utilise capacity.
Moreover, the wide range of cheese – from basic mozzarella
to exotic varieties – offers significant brand-building avenues.
A recent example is Parag Dairy’s introduction of a premi-
um cheese spread under the brand name Almette. Building
brands in dairy businesses has been challenging, and only
products that command pricing power can be considered
brands. However, established brands can command a premi-
um to regional and local products and generate higher gross
margins.
Apart from cheese, the range of value-added products is
quite large in India. These products are less impacted by
changing global commodity prices. For example, in the
current scenario of a sharp correction in global skimmed
milk powder (SMP) prices, domestic ghee prices have been
relatively steady. The decline in global SMP prices has led to
a complete stalling of SMP exports from India. Private players
involved in SMP exports have significantly reduced their
Low margin products shareHigh margin products shareSource: Company, PhillipCapital India Research Estimates
Source: PhillipCapital India Research Estimates

15GROUND VIEW GROUND VIEW 1 - 31 March 2016 1 - 31 March 2016 14
procurement of milk, and cooperatives have had to step up
procurement. For the dairy industry, in the current scenario,
ghee and buffalo milk (with higher fat content) have emerged
as saviours. Buffalo milk prices are expected to bounce back
as the lean summer season ensues.
Other high-margin value-added products like UHT (ul-
tra-high-temperature) milk and flavoured milk provide gross
margins of around 50% and 70% respectively. However, the
capital investment required for such products is high due to
the complex nature of operations and asset turnover tends to
be in low to mid-single digits.
Needless to say, a wide portfolio of value-added products is
critical to the dairy business model, but so is liquid milk, as it
forms the key cog of the supply-chain and branding.
The supply-chain and branding enigma of the dairy
industry
“If I have to pick the most critical success factor for the dairy
business, it has to be the supply chain. We calculate supply
chain costs in paise and we keep our costs very low, which
helps us to win markets,” says Mr Sodhi. In dairy, everything
depends on efficient supply chain. Product quality to profit-
ability – all depend on its efficiency. Most dairy products are
highly perishable and require cold chains. A cost-efficient
supply chain is a pre-requisite for most industries, but in
dairy, these efficiencies go much further. The biggest hurdle
in the dairy business is to build brands, and brands need
to be scalable. The answer lies in managing supply-chain
dynamics.
Consumer-facing businesses are all about brands. These
have pricing power and are able to withstand the vagaries of
economic cycles. The dairy industry is very large, but since it
is dominated by co-operatives, the challenge for companies
has been to build brands, considering lower gross margins
across products. This, however, is not the only difficult as-
pect; the bigger challenge in the dairy industry has been to
build brands by distributing liquid milk, which while provid-
ing unparalleled customer reach, is a rather dull business with
EBIDTA margins of around 5%. Nevertheless, it has multiple
advantages, which most private companies fail to commit to
“It is the buffalo that is probably going to save the dairy farmer,” believes Mr RS Sodhi, “as cow’s milk and SMP continue to remain under pressure”.
For a dairy producer, an efficient supply chain is far more important than for other industries, partly because of the perishable nature of the commodity
Pictures of Kwality Dairy’s Faridabad factory; Dairy industry requires very high capex

17GROUND VIEW GROUND VIEW 1 - 31 March 2016 1 - 31 March 2016 16
over the long term. The biggest advantages are:
• Supply of quality milk provides a direct connect with end
consumers at lower costs and results in branding
• Provides economies of scale; plus, it is a cash business
with lower working capital requirements
• Brings down the supply-chain costs on which other prod-
ucts can ride
All these three big advantages are a must for building a
scalable consumer business, but the challenge is the ‘right
to win’ in building such a consumer-facing franchise. Most
FMCG companies ask themselves three ‘right to win’ ques-
tions:
• Do we have any special skill or advantages in sourcing of
products?
• Do we have the brand/branding capabilities?
• Do we have the distribution infrastructure?
For most companies, getting a positive answer for any two
of these equals a green signal to develop those products.
However, in dairy, companies need to get all three questions
right. This seldom happens, but companies that do, go on to
build scalable businesses. Gujarat Cooperative Milk Mar-
keting Federation, owner of the iconic Amul brand, met all
the criteria and has exceeded expectations. Hatsun Agro is
another company that built a strong brand and capabilities,
while Parag Milk Foods is the other player that managed to
build a robust business model. These models have met with
success because of their long-term vision.
Extending brands to dairy: Strategy still in the lab
Building dairy brands are long-gestation projects. Companies
have to slog in the retail channels with low-margin products,
consistently improve efficiencies, and build higher-margin
value-added products. All this is a fairly long process. Brand
extensions are a seemingly easier route to brand building
in this segment, but the efficacy of this method is not fully
proven. Some of the leading FMCG companies have forayed
into the dairy business through brand extensions. Britannia
and Nestle are developing their dairy franchise around the
flagship brand. Nestle has met with the most success, primar-
ily because of its first-mover advantage in infant nutrition and
dairy creamer. The infant nutrition category is also impacted
by regulatory hurdles (not allowed to advertise), but Nestle
was able to take advantage of market conditions when regu-
latory hurdles were much lower. In the dairy-creamer cate-
gory too, the company enjoyed first-mover advantage and
it was able to build a very successful brand. Nestle’s success
in these two products has not been repeated by any other
player; in fact, even Nestle itself could not repeat its success
in other dairy categories, notwithstanding global expertise
and experience.
Britannia and ITC both have ambitious plans for the category,
but do not seem to have a coherent strategy in place yet.
However, since these companies have strong brands, experi-
ence in sourcing, and supply-chain management capabilities,
the ‘right to win’ is seemingly inherent. Strategically, most
FMCG companies shy away from low-margin businesses such
as liquid milk, as they find capital-efficiency lacking; their
preference is mostly towards high-margin categories. The
success of this strategy is yet to be proven or probably the
market is still to reach that inflection point to make a signifi-
cant impact.
In this context, the dairy market has surely not reached an
inflection point for growth to take off, but more important-
ly, products like cheese, dahi (curd), or tetra-pack milk by
leading FMCG players
are yet to capture the
people’s imagination.
In all probability, the
success for this kind of
a strategy would lie in a
company’s ability to in-
troduce new innovative
products that find wide
acceptance and still
have high margins.
For now, the big
boys of FMCG are in
a ‘wait-watch-devel-
opment’ mode for
distruptive
innovations.
Dairy is an exciting and lucrative segment (when done right) and most FMCG companies keep mulling over cost-effective ways of tapping into it
(Britannia and Nestle have strong presence in Dairy; ITC with its Aashirvaad Svasti ghee is the latest major FMCG entrant in the fray)
17GROUND VIEW GROUND VIEW 1 - 31 March 2016 1 - 31 March 2016 16
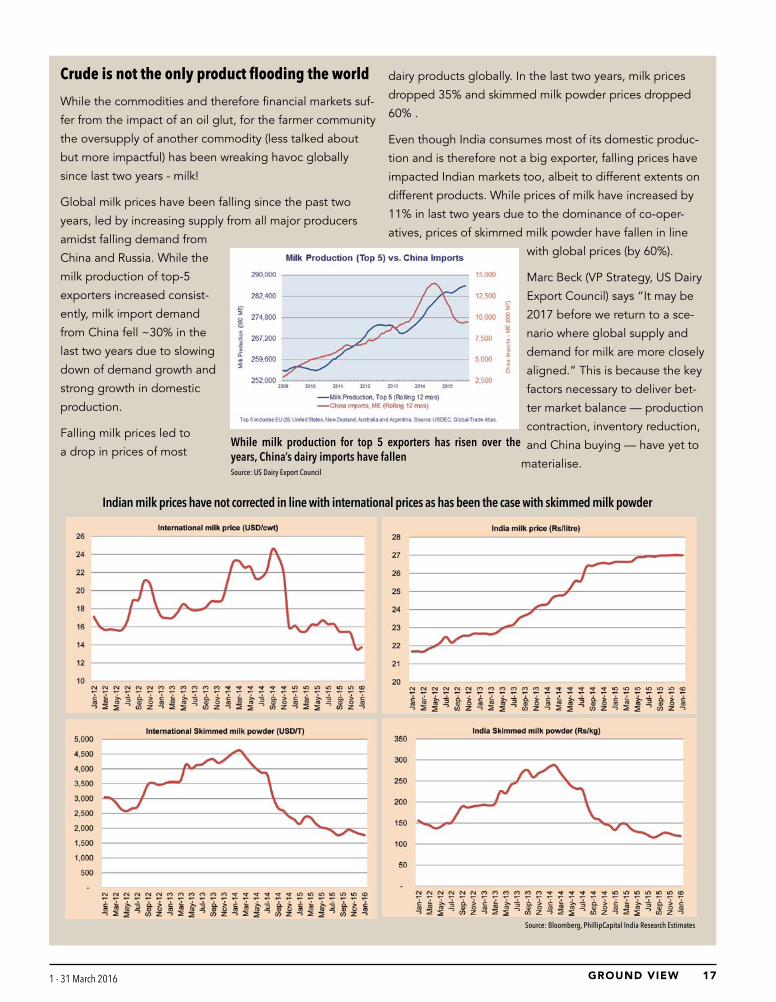
Crudeisnottheonlyproductfloodingtheworld
While the commodities and therefore financial markets suf-
fer from the impact of an oil glut, for the farmer community
the oversupply of another commodity (less talked about
but more impactful) has been wreaking havoc globally
since last two years - milk!
Global milk prices have been falling since the past two
years, led by increasing supply from all major producers
amidst falling demand from
China and Russia. While the
milk production of top-5
exporters increased consist-
ently, milk import demand
from China fell ~30% in the
last two years due to slowing
down of demand growth and
strong growth in domestic
production.
Falling milk prices led to
a drop in prices of most
dairy products globally. In the last two years, milk prices
dropped 35% and skimmed milk powder prices dropped
60% .
Even though India consumes most of its domestic produc-
tion and is therefore not a big exporter, falling prices have
impacted Indian markets too, albeit to different extents on
different products. While prices of milk have increased by
11% in last two years due to the dominance of co-oper-
atives, prices of skimmed milk powder have fallen in line
with global prices (by 60%).
Marc Beck (VP Strategy, US Dairy
Export Council) says “It may be
2017 before we return to a sce-
nario where global supply and
demand for milk are more closely
aligned.” This is because the key
factors necessary to deliver bet-
ter market balance — production
contraction, inventory reduction,
and China buying — have yet to
materialise.
While milk production for top 5 exporters has risen over the years, China’s dairy imports have fallenSource: US Dairy Export Council
Indian milk prices have not corrected in line with international prices as has been the case with skimmed milk powder
Source: Bloomberg, PhillipCapital India Research Estimates

19GROUND VIEW GROUND VIEW 1 - 31 March 2016 1 - 31 March 2016 18
A M U L – W I S H YO U W E R E L I S T E D !
When milk became a symbol of protest
The seeds of this unusual saga were
sown more than 70 years ago in Anand,
a small town in Gujarat in western India.
The exploitative trade practices fol-
lowed by the local milk trade cartel triggered off
the co-operative movement. Angered by unfair
and manipulative practices that were followed,
farmers of the district approached Sardar Vallabh-
bhai Patel for a solution. He advised them to get
rid of middlemen and form their own co-opera-
tive, which would keep procurement, processing,
and marketing under the farmers’ control. In
1946, farmers of Anand went on a ‘milk strike’, re-
fusing to be cowed down by the cartel. Under the
inspiration of Sardar Patel, and the guidance of
leaders like Morarji Desai and Tribhuvandas Patel,
they formed their own cooperative in 1946, which
later evolved into a state-wide dairy cooperative
– today known as Amul.
Biggest and the best!
Amul, flagship brand of Gujarat Cooperative
Milk Marketing Federation (GCMMF), is the most
successful co-operative brand in the country, and
Amul is credited with spurring the ‘milk revolution’ of India, which propelled the country to becoming the world’s largest producer of milk

19GROUND VIEW GROUND VIEW 1 - 31 March 2016 1 - 31 March 2016 18
Amul’s iconic hoardings

21GROUND VIEW GROUND VIEW 1 - 31 March 2016 1 - 31 March 2016 20
India’s largest fully integrated food brand. With
21% CAGR in last five years, Amul posted reve-
nues of Rs 207bn in FY15. Its product portfolio
includes liquid milk and value-added products like
infant nutrition, cheese, and butter. Amul has a
pan-India presence with 56 sales offices, 10,000
dealers and a million retailers. It handles 15mn kg
of milk per day (~4% of India’s total dairy volumes
and 25% of organised sector volumes) and is also
India’s largest exporter of dairy products.
Strong brand backed by stronger distribution
Amul’s retail sales are driven by liquid milk, which
accounts for around 50% of production volumes.
Liquid milk acts as the carrier brand for its val-
ue-added products such as infant milk food,
cheese, paneer, flavoured milk, and ghee. Milk is
the largest contributor to its revenues (Rs 80bn PC
estimate). Its second-largest category is infant milk
food, Amul Spray, which has revenues of Rs 42bn.
Other important categories include butter (market
share of >90%), ghee, ice creams, and cream. Be-
cause of its strong brand equity and retail portfo-
lio, Amul operates on cash-and-carry principle and
has negligible receivables (two days). In compar-
ison, companies like Kwality Dairy, Prabhat Dairy,
and Parag Milk Foods have major institutional
presence and receivables days of 40-80.
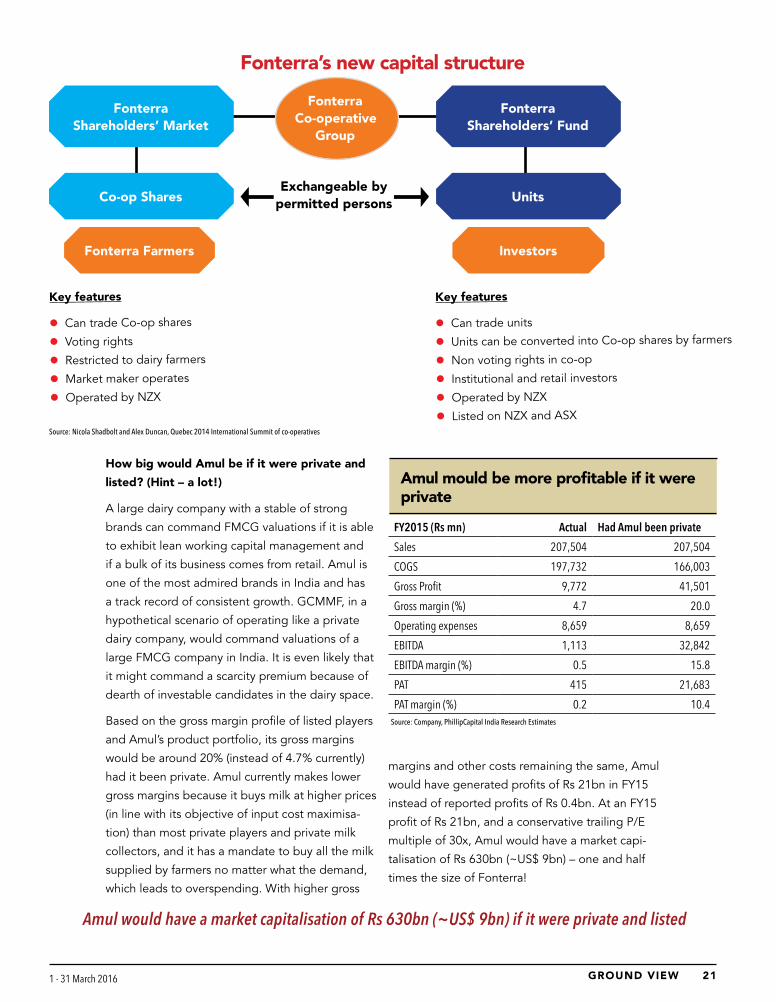
Listed cooperative: Fonterra case study
Fonterra Co-operative Group Ltd.
is a New Zealand dairy co-oper-
ative owned by 10,500 farmers.
It is the world’s largest dairy
co-operative and exports 95% of
its local production to over 100
countries. The company is also
known for being one of the few dairy cooperatives
listed on a stock exchange.
Until November 2012, Fonterra shares were
owned only by its milk-producing members in the
ratio of amount of milk produced by each mem-
ber. Members could then redeem these shares if
their production declined, and the cooperative
was obligated to buy back the shares from these
members. In 2007-09, due to volatility in milk pric-
es, Fonterra faced severe redemption pressures
from struggling farmers.
In November 2012, Fonterra implemented a
capital structure that allowed it to list its shares
on New Zealand’s stock exchange, while letting
farmer members retain ownership of shares. As
per the structure, derivative units of underlying
cooperative shares are available to investors and
these units entitle investors to receive economic
rights to the shares (dividend and gain/loss in unit
value). The units could be transacted freely on the
stock exchange. However, since farmers retain
ownership of shares of the cooperative, voting
rights were made available only to them. The
structure also allows farmers to purchase shares
worth two times than previously available for
their three-year average production. This helped
increase market depth. Fonterra shares currently
trade at more than 19 times trailing earnings and
the company has a market capitalisation of US$
6bn (NZD 9.1bn).
Amul owns +90% market share in butter
21GROUND VIEW GROUND VIEW 1 - 31 March 2016 1 - 31 March 2016 20
How big would Amul be if it were private and
listed? (Hint – a lot!)
A large dairy company with a stable of strong
brands can command FMCG valuations if it is able
to exhibit lean working capital management and
if a bulk of its business comes from retail. Amul is
one of the most admired brands in India and has
a track record of consistent growth. GCMMF, in a
hypothetical scenario of operating like a private
dairy company, would command valuations of a
large FMCG company in India. It is even likely that
it might command a scarcity premium because of
dearth of investable candidates in the dairy space.
Based on the gross margin profile of listed players
and Amul’s product portfolio, its gross margins
would be around 20% (instead of 4.7% currently)
had it been private. Amul currently makes lower
gross margins because it buys milk at higher prices
(in line with its objective of input cost maximisa-
tion) than most private players and private milk
collectors, and it has a mandate to buy all the milk
supplied by farmers no matter what the demand,
which leads to overspending. With higher gross
margins and other costs remaining the same, Amul
would have generated profits of Rs 21bn in FY15
instead of reported profits of Rs 0.4bn. At an FY15
profit of Rs 21bn, and a conservative trailing P/E
multiple of 30x, Amul would have a market capi-
talisation of Rs 630bn (~US$ 9bn) – one and half
times the size of Fonterra!
FY2015 (Rs mn) Actual Had Amul been private
Sales 207,504 207,504
COGS 197,732 166,003
Gross Profit 9,772 41,501
Gross margin (%) 4.7 20.0
Operating expenses 8,659 8,659
EBITDA 1,113 32,842
EBITDA margin (%) 0.5 15.8
PAT 415 21,683
PAT margin (%) 0.2 10.4
Amul mould be more profitable if it were private
Fonterra Shareholders’ Market
Fonterra Co-operative
Group
Co-op Shares
Fonterra Farmers
Fonterra Shareholders’ Fund
Units
Investors
Key features
l Can trade Co-op shares
l Voting rights
l Restricted to dairy farmers
l Market maker operates
l Operated by NZX
Key features
l Can trade units
l Units can be converted into Co-op shares by farmers
l Non voting rights in co-op
l Institutional and retail investors
l Operated by NZX
l Listed on NZX and ASX
Exchangeable by permitted persons
Source: Nicola Shadbolt and Alex Duncan, Quebec 2014 International Summit of co-operatives
Fonterra’s new capital structure
Amul would have a market capitalisation of Rs 630bn (~US$ 9bn) if it were private and listed
Source: Company, PhillipCapital India Research Estimates

23GROUND VIEW GROUND VIEW 1 - 31 March 2016 1 - 31 March 2016 22
T H E S I G N I F I C A N T OT H E R S
Hatsun Agro: Done with the heavy lifting
Many people in India do not know
about Hatsun Agro, but most
people in south India know Arun
ice cream. It is a brand that reaches
most cities in south India and has one of the best
distribution networks for an ice cream brand in
India. Apart from Arun ice cream, Hatsun Agro’s
liquid milk brand, Arokya, is well established and
it has managed to successfully hold its turf in the
highly competitive Tamil Nadu market, where the
state cooperative brand Aavin is very strong. Hat-
sun’s success is built on slow-and-steady growth
with an eye on the long term.
The Chennai-based Hatsun Agro Products was
founded in 1986 and it is listed on the BSE since
1996. It is one of the largest private dairy play-
ers in the country. It serves Tamil Nadu (60% of
sales), Andhra Pradesh, Telangana, Karnataka, and
Maharashtra. The company operates majorly in the
retail segment and its product portfolio includes
milk, ice creams, and other value-added products.
With a capacity of 2.5mn litres of milk per day, it
currently handles 1.9mn litres of milk per day and
has manufacturing plants at 12 locations.
Lean and strong – tricks of the trade
At 90%, the company has the highest share of
sales from the retail segment among private dairy
players. Since retail sales operate on cash/advance
payment principle, it has receivables of only two
days vs. more than two months for other listed
players. Hatsun Agro derives a major portion of
its revenues through sales of base milk (72%). Milk
sales have seen 23% CAGR in the last five years
and its primary focus is to increase milk sales in
the retail market in the medium term. Ice creams
(7% of sales) have grown in line at 23%. However,
milk products (18% of sales) grew slower at 14%
CAGR. The slower growth of milk products can be
23GROUND VIEW GROUND VIEW 1 - 31 March 2016 1 - 31 March 2016 22
attributed to (1) more focus on growing milk sales,
and (2) lower focus on working-capital-intensive
institutional business for milk products.
Some risks with its retail model…
The company is prone to regulatory challenges
like milk subsidies given by state governments
to co-operatives. For example, in July 2013, the
newly elected government in Karnataka doubled
the subsidy to dairy farmers in the co-operative
sector to Rs 4 per litre from Rs 2 per per litre.
From 5th January 2016, this subsidy was increased
further by Rs 3 per litre. Currently, Hatsun Agro
directly procures milk from farmers in Tamil Nadu
and Andhra Pradesh, but in Karnataka, it procures
milk only from dealers. We believe further involve-
ment of government in milk procurement markets
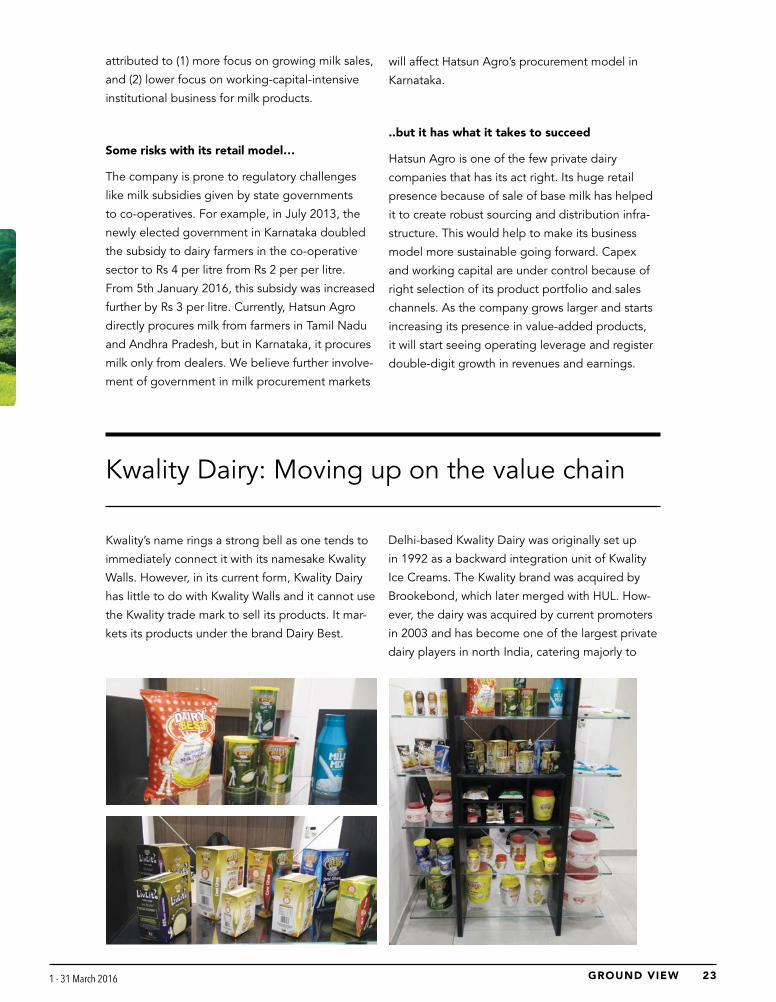
Kwality’s name rings a strong bell as one tends to
immediately connect it with its namesake Kwality
Walls. However, in its current form, Kwality Dairy
has little to do with Kwality Walls and it cannot use
the Kwality trade mark to sell its products. It mar-
kets its products under the brand Dairy Best.
will affect Hatsun Agro’s procurement model in
Karnataka.
..but it has what it takes to succeed
Hatsun Agro is one of the few private dairy
companies that has its act right. Its huge retail
presence because of sale of base milk has helped
it to create robust sourcing and distribution infra-
structure. This would help to make its business
model more sustainable going forward. Capex
and working capital are under control because of
right selection of its product portfolio and sales
channels. As the company grows larger and starts
increasing its presence in value-added products,
it will start seeing operating leverage and register
double-digit growth in revenues and earnings.
Delhi-based Kwality Dairy was originally set up
in 1992 as a backward integration unit of Kwality
Ice Creams. The Kwality brand was acquired by
Brookebond, which later merged with HUL. How-
ever, the dairy was acquired by current promoters
in 2003 and has become one of the largest private
dairy players in north India, catering majorly to
Kwality Dairy: Moving up on the value chain

25GROUND VIEW GROUND VIEW 1 - 31 March 2016 1 - 31 March 2016 24
the urban market of Delhi. It has milk processing
capacity of around 3mn litres per day with six
plants in Haryana, UP, and Rajasthan. It produces
a variety of dairy products and is in the process of
commissioning new facilities that will help gen-
erate additional revenues from the sale of high-
er-margin value-added products.
Light and heavy
Kwality Dairy’s gross margins at 11% are far lower
than other key private players’ such as Hatsun
Agro and Prabhat Dairy (22-25%),
because of a higher proportion
of lower margin products such as
ghee and skimmed milk powder in
its portfolio. As gross fixed assets
required to produce low-margin
products is lower, its gross-fixed-as-
sets to turnover is 42 vs 3.2/3.3/3.6
for Hatsun Agro/Prabhat Dairy/Parag
Milk Foods.
However, due to significant insti-
tutional sales (69% in FY15), its
receivable days are very high at 80
and it has short-term borrowings
of Rs 10.9bn for annual sales of
Rs 41.5bn. While it used to earlier
operate majorly in the B2B segment,
it has increased its retail sales proportion to 31%
of sales by FY15 from from 9% in FY10. Retail sales
will be augmented by expansion at its Softa plant
(by 0.85mn litres per day) to produce primarily
value-added products such as flavoured milk,
variants of cheese, UHT milk, butter in tubs, cream
in tetrapacks, etc. The addition of high-margin
milk products for the retail channel will also help
to improve gross margins, increase revenue and
reduce working capital days.
Inflexion point still away
Once its new capacity addition at the Softa plant
becomes operational, the company will have the
ability to increase presence in the retail segment.
However, currently, it is severely dependant on
sales of low-margin milk products to institutional
clients and it will take time for the company to
decrease this dependence. This is because it has
huge working capital employed in the institutional
business and needs steady income to service its
debt annually. Thus, institutional sales will continue
to form a significant part of its revenues for some
time and working capital will remain high.
(Title: Kwality Dairy majorly produces low margin products like ghee, skimmed milk powder, ghee. etc.)
Prabhat Dairy: Seeking fortunes at the middle of the pyramid
“We will boost sales of our retail portfolio by
making available quality products to the tier-2 and
tier-3 markets,” says Ahmednagar-based Prabhat
Dairy, a key private dairy player in Maharashtra.
While tier-1 markets are highly penetrated and see
fierce competition among various players, tier 2-3
towns are often less penetrated and have benign
competition. Prabhat Dairy was incorporated in
1998 and listed on the BSE in 2015. The company
has two manufacturing facilities with an aggregate
milk-processing capacity of 1.5mn litres per day
and handles 0.95mn litres a day. The company

25GROUND VIEW GROUND VIEW 1 - 31 March 2016 1 - 31 March 2016 24
operates majorly in the B2B seg-
ment (72% of sales in Q2FY16)
and has partnerships with many
major food players.
Better ingredients, better
business
“Dairy business typically has three major lines –
ingredients, consumers, and professional services.
We chose the ingredients business because of the
lack of a credible player in this space that has the
capability to supply quality products. We posi-
tioned ourselves on manufacturing excellence,
which appealed to international companies like
Modelez and now we supply to them globally,”
says Amit Gala, CFO of Prabhat Dairy.
In 2006, Prabhat entered the dairy ingredients
space, which did not have the presence of a
strong domestic company. Driven by manufactur-
ing excellence, it has built partnerships with top
FMCG players such as Kraft Foods, Mondelez, Bri-
tannia, Nestle, and others. The company has very
high receivable days (66) because of the payment
policies of top FMCG companies to vendors.
Milking tier 2/3 markets
While the company is very strong in the institution-
al segment (72% of sales in Q3FY16), it wishes to
gradually increase the share of sales from retail.
While retail markets of tier-1 cities are rife, the
company plans to penetrate tier-2 and tier-3 towns
where the presence of major dairy brands is lower
or non-existent. We believe
that the company can expand
the category in tier 2/3 markets
through strong distribution and
promotions, and gain share in
tier-1 markets through trader
incentives.
High and dry
While both Prabhat Dairy and Kwality Dairy have a
high proportion of sales coming from institutional
segments, Prabhat’s dairy gross margins are higher
at 22% vs. Kwality Dairy’s 11%, because the former
manufactures high-margin value-added products
like condensed and concentrated milk and cheese.
The largest product for the company is condensed
milk (25% of sales) and it has the third-largest
cheese-manufacturing capacity in the country and
produces 1000 tonnes per month. The company
has a huge fixed assets base, as it produces high-
er-margin products and has gross asset turnover of
3x vs. 40x for Kwality Dairy.
Prabhat Dairy has only recently commissioned
its cheese plant production. Since cheese re-
quires aging of 60-90 days, it will continue to see
increase in working capital. We believe that its
strategy to expand sales in tier 2/3 towns will help
in the medium term by helping improve margins
and reducing working capital. However, in the
short term, increasing distribution reach will entail
higher expenses and investments into the trade
channel, which will strain margins and cash flows.

27GROUND VIEW GROUND VIEW 1 - 31 March 2016 1 - 31 March 2016 26
A few years ago, modern trade was suddenly flooded by a
brand called ‘Go Cheese’, which most people thought was
an international brand. The quality of product met inter-
national standards and soon people in investment circles
started enquiring about the relatively inconspicuous dairy
company “Parag Milk Foods,” which owns the Go Cheese
brand. Armed with private equity funding from Motilal Oswal
in 2008 and a vision of building a dairy company capable of
churning out international quality products, Parag Milk Foods
has one of the most promising narratives in the Indian dairy
industry.
Pune-based Parag Milk Foods, founded in 1992, is one of
the largest private dairies in Maharashtra with a distribution
network spread across various states in the country. It has an
aggregate milk processing
capacity of 2mn litres per
day and two manufacturing
plants in Maharashtra and
Andhra Pradesh. It also has
the largest cheese plant in
India with a production ca-
pacity of 40 tonnes per day
and produces base milk and
value-added products.
Innovations galore
With a focus on product differentiation, Parag has one of the
largest portfolios of products in the dairy sector. The com-
pany produces various types of cheese including mozzarella,
shredded, and cheddar, each in a variety of flavours. For
example, its cheese wedges are available in four flavours –
black pepper, tomato salsa, Mexican twist, and plain. The
company also produces flavoured yoghurt (eight different fla-
vours), buttermilk in (two flavours), liquid milk (three variants),
flavoured milk (six flavours). The company has a very strong
distribution system with presence across 13 states with 3000
distributors. Currently, its retail sales comprise 80% of the
portfolio. Major institutional clients include leading restaurant
and café chains such as Pizza Hut, Dominos, KFC, and others.
Taking pride in premiumisation
“Our average yield per cow is around 22 litres, but our high-
Parag Milk Foods: Innovating its way out
est yielding cow gives a whopping 52 litres of milk a day. Mr
Shah has nicknamed her Aishvarya,” says the dairy guide at
Bhagyalaxmi Dairy Farm. Spread over 35 acres, Bhagyalaxmi
dairy farm houses 2,500 cows and is equipped with one of
India’s first rotary parlours, which has mechanised the whole
milking process. The dairy farm markets its fresh milk under
the brand Pride of Cows, which is based on the concept of
fresh farm milk delivered directly to home within hours of
milking. The farm at Manchar, Pune, has one of the highest
yielding breed of cows of the Dutch Holstein Friesian breed,
which is known for quality and high yield of milk of ~23 litres/
day (6x the Indian counterparts). The cows are kept in a
happy, stress free, free-range environment, and on a healthy
regimented diet, which is conducive for milk production of
the highest quality. The cows
are milked three times a
day using milking machines.
Using automation, the milk is
instantly pasteurized, chilled,
and packaged in bottles in
less than three hours, and
sent immediately for dis-
patch. The company currently
distributes around 15,000
litres per day in Mumbai and
Pune, and has the capacity of
25,000 litres per day.
Initially, the distribution started for product savvy consumers
of south Mumbai, but as word of mouth spread and more
and more people started enquiring about the brand, the
company expanded its distribution. Now Pride of Cows
reaches almost the whole of Mumbai and Pune. The brand-
ing and marketing is based on interesting concept of dairy
tourism, where people are encouraged to visit the farm
themselves to get a first-hand feel of the product. While the
farm is managing to sell around 60% of its capacity in retail,
if the model succeeds, it could be one of the most promising
ones in the long-term and could become a benchmark for
premiumisation.
Picking up steam
Over the years, Parag Milk Foods has developed a supply
27GROUND VIEW GROUND VIEW 1 - 31 March 2016 1 - 31 March 2016 26
chain network in over 3400 villages in Maharashtra
and south India. The company also has a high-
er bargaining power compared to its suppliers,
which is evident from its payable days (highest
among peers). The free cash flow from 2011-14
was negative (in line with the rest of the industry).
However, higher payables and reduction in capital
investment helped turn the free cash flow positive
in 2015. The lower capacity utilization for Parag
Foods currently indicates that peak of cyclical
capex is already done and free cash flow should
be strong for the next few years. The company will
continue to gain share in retail due to strong dis-
tribution chain and innovations. Parag Milk Foods
will be among the few successful private players in
the medium to long term and the oncoming IPO
of the company will sail through smoothly.
Conclusion
The Indian dairy industry is immensely complex and
it is certainly not for the faint-hearted. Co-operatives
will continue to dominate because of their traditional
strength in milk sourcing. Consolidation of district milk
brands in states such as Maharashtra (that has multiple
district union brands) will help to further cement their
dominance. However, the ability of co-operatives to in-
vest and deliver quality products will remain constrained
because of lower margins and negligible profitability.
The biggest opportunity for private players is in premiu-
misation. The evolution of private players in the Indian
dairy industry will depend on two factors – (1) their
ability to increase retail presence and (2) their ability to
invest in high-quality infrastructure, including supply
chain. Both factors are long gestational. Retail presence
depends on building brands through selling liquid milk
while returns on large-scale investments are constrained
by the margin profile of products.
Companies such as Hatsun Agro and Parag Milk Foods
have the most promising business models because
of strong retail presence and vision for value-added
products. Hatsun has a strong portfolio in liquid milk,
which will help it to expand profitably. Because of its
strong presence in retail segments of ghee, cheese, and
buttermilk, Parag Milk Foods will continue to outperform
its peers. Due to strong competition in value-added
milk products, other players such as Prabhat Dairy and
Kwality Dairy will have to increase their retail presence
by focussing more on liquid milk in core geographies,
and then expanding into nearby geographies gradually.
The focus on liquid milk will also help emerging players
develop strong sustainable sourcing models that are
necessary to establish a strong brand. Apart from the
pure dairy players, other FMCG players such as Britannia
have ambitious dairy-business plans. The case for de-
veloping a scalable business model is yet to be proven.
However, in the case of brand extensions a lot depends
on product saliency. With product innovations like dairy
whitener (ahead of market when launched) Nestle has
proven itself while others are still grappling with this
aspect. Most players still have me-too portfolios and a
highly innovative offering has been elusive. So, the wait
continues.
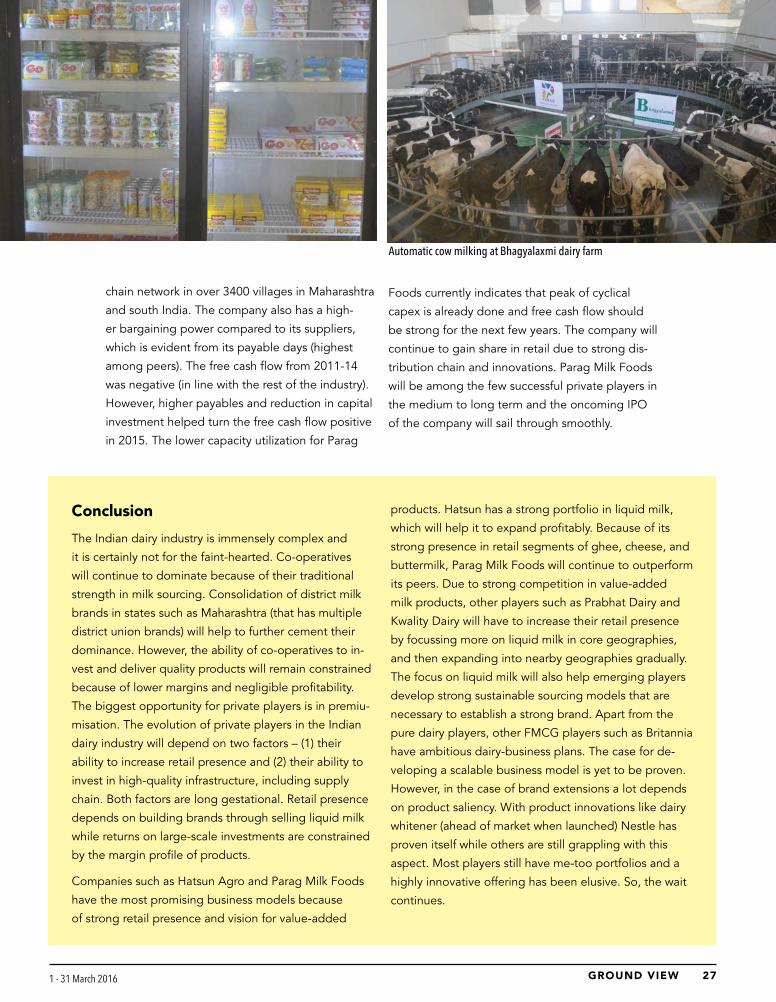
Automatic cow milking at Bhagyalaxmi dairy farm

29GROUND VIEW GROUND VIEW 1 - 31 March 2016 1 - 31 March 2016 28
Sales (Rs mn) Gross margin
Profit marginEBITDA margin
FOCUS CHARTS
Except Kwality Dairy which sells more of low margin
products, others have gross margins in range of 20-
25%. Margins have not improved or fallen in last two
years because of fall in prices of global commodities
like skimmed milk powder
Sales have increased for all key players over the years
Dairy industry profit margins are lower than those of
FMCG peers because dairy requires higher capital ex-
penditure and higher working capital
EBITDA margins are lower for dairy industry as a whole
because of higher operating expenses
Source: Company, PhillipCapital India Research Estimates

29GROUND VIEW GROUND VIEW 1 - 31 March 2016 1 - 31 March 2016 28
Receivable days
Payable days
Inventory days
Free cash flow (Rs mn)
Except Hatsun Agro which has major portion of sales
portfolio in retail, others have very high recievable days
Parag Milk Foods has the highest bargaining power with
suppliers
Parag milk foods has high inventory days due to higher
share of cheese in sales (cheese requires 3-6 months
aging)
Most worrisome aspect of dairy industry is that free cash
flow has been negative for most companies for most
years because of high capital investment
Source: Company, PhillipCapital India Research Estimates

31GROUND VIEW GROUND VIEW 1 - 31 March 2016 1 - 31 March 2016 30
Net Debt (Rs mn)
RoE
Net Debt / EBITDA
RoCE
Most companies have seen continuous deterioration of
RoE
Net debt and net debt/EBITDA for all four companies is
very high
Net debt and net debt/EBITDA for all four companies is
very high
RoCE for dairy industry is poor because of high invest-
ment required
Source: Company, PhillipCapital India Research Estimates

31GROUND VIEW GROUND VIEW 1 - 31 March 2016 1 - 31 March 2016 30
Dr A Velumani CMD, Thyrocare Technologies Ltd.
The Indian diagnostic market is set for robust annual growth of 20-
25% over the next 20 years led by the rising age of the demograph-
ic, says Dr A Velumani, CMD – Thyrocare Technologies Ltd. He has
revolutionised the Indian diagnostic industry with Thyrocare’s focus
on preventive care (vs. competitions’ focus on sick care) and high
profitability, despite disruptive pricing practice.Ground View spoke
to Dr Velumani, to get an idea about the growth outlook and pricing
scenario. Here are the excerpts from the interview
BY SURYA PATRA

33GROUND VIEW GROUND VIEW 1 - 31 March 2016 1 - 31 March 2016 32
What are the ground realities for the diagnostics
market and how are they different from percep-
tion? Could you juxtapose this with ‘known’ facts
such as size (~US$ 6bn), annualised growth of
15-20%, and transition to regulated play?
A market size of ~US$ 6.5bn for the Indian diagnos-
tic market is grossly under-reported – this is because
our country lacks any system of documentation for
diagnostic or healthcare services, which is largely
catered by the unorganised sector. Similarly, report-
ed growth of 15-20% seems low, considering that
India’s demographic is shifting towards a higher age
from a predominantly younger one.
Ground realities of the Indian diagnostic services
industry indicate accelerated growth. While the
annual per capita spend in the US on diagnostics is
around US$100, it is >US$6 in India, implying sig-
nificant scope for growth led by increasing income
levels. India is still a young country with average age
of around 25 years – and the need for diagnostic
services grows with age. So, as India’s demographic
begins to move towards a higher age, its diagnostic
market is set for 20-25% growth over the next 20
years.
While the industry saw steady progress, its prof-
itability seems to be under pressure. What drives
that and how does one handle it?
Profit margins for diagnostics in India are certain-
ly challenged due to the market’s nature. In the
western world, this business is driven by hospitals
while in India, it is driven by individual doctors. Since
doctors drive healthcare/diagnostic, standalone
laboratories become vital and such laboratories are
non-accredited. These unorganised laboratories hurt
the profitability of organised players. Even so, the
scope of volume expansion in diagnostics services
in India is enormous. Some efficiency in operations
can weed out all margin pressure. All in all, I feel the
unorganised market is not a big concern for organ-
ised players.
Do you see incremental competition from MNCs
due to 100% FDI in diagnostics?
Healthcare and diagnostics are largely local subjects
and domestic players understand the needs well
and cater accordingly. No MNC can pose a threat to
local diagnostic players. Few MNCs have tried their
luck in India over the last two decades, but failed.
Quest is the only MNC in India with some respect-
able presence. About FDI, I do not think that the
Indian diagnostic industry requires it since this is not
a very capital-intensive business, unlike hospitals.
On pricing power, which factors according to you
will have an impact on diagnostic services? How
do you see the pricing per test unfold over the
next 4-5 years?
Pricing of diagnostic tests will definitely fall, but this
is unlikely to hurt profitability. Why should prices
go down? Not because of competition – rather, this
correction would be led by tremendous expansion of
volumes and consolidation.
There are about 500 different types of tests in diag-
nostics and prices for about 50 have already fallen to
optimal levels, but many players arrive at the pricing
of most other tests after considering their patient
pool (usually rich and upper middle class). There is
robust scope for volume expansion in the lower mid-
dle class population and this will drive down prices.
Do you believe that a price-disruptive strategy
is the key to success in the context of the Indian
diagnostic market?
Yes, I still emphasise the fact that volume-led bene-
fits in the Indian diagnostics are enormous, as organ-
ised players still account for only about 15-20% of
the total reported diagnostic market, which is grossly
under reported.
Thyrocare already earns a margin of around 44% and
I can dilute this a bit to enhance market penetration,
hence growth momentum, and ultimate profitability.
What has been Thyrocare’s performance YTD and
what is your outlook going ahead?
In FY15, Thyrocare saw 20% revenue growth to Rs
1.8bn with an EBITDA of Rs 736mn (implying a mar-
gin of ~41%) and a PAT of Rs 458mn. We are closing
FY16 with sales growth of around 28-30%. Over last

33GROUND VIEW GROUND VIEW 1 - 31 March 2016 1 - 31 March 2016 32
three year, we have seen 20% CAGR and we are con-
fident about similar growth over the next three.
The key to our success has been a price disruptive
strategy with a focus on volume, and of course our
differentiated business approach to tap preventive
care diagnostic market compared to the competi-
tion’s focus on sick-care diagnostic services.
What progress are you seeing for your cancer
diagnostic operation under Nueclear Healthcare?
Thyrocare’s 100% subsidiary – Nueclear Healthcare –
focuses on PET-CT test (used to detect cancer). The
objective of the subsidiary is to address the huge
unmet need in cancer care and to offer affordable
PET-CT tests. Believing ‘scale/volume’ is the only
principle for success. Thyrocare offers PET scan at
Rs 9,999 per test against competitors’ prices of Rs
20,000-25,000. With such pricing, we have already
initiated a disruptive pricing game in cancer diagnos-
tics, but in India, volume is still too low for impact-
ful disruption. Therefore, we are a bit slow on this
business front.
The IPO of Dr Lal Path Lab in December 2015
was a great success. Could you tell us about your
listing aspirations and timeline?
SEBI has already cleared Thyrocare’s DRHP and we
are likely to file our RHP before the end of March
2016 – our issue would be open for subscription by
mid April 2016.
About Thyrocare
Thyrocare is one of the leading pan-India diagnostic
chains and offers 192 tests and 54 profiles of tests
to detect health disorders – such as thyroid, growth,
metabolism, auto-immunity, diabetes, anaemia, car-
diovascular, infertility and various infectious diseases.
It profiles of tests are administered under the brand
name ‘Aarogyam’.
It has been operating from its central processing
laboratories in Navi Mumbai and setup four regional
centres in New Delhi, Coimbatore, Hyderabad, and
Kolkata in 2014. As a result, Thyrocare’s daily aver-
age test volumes jumped 37% (to 131,073 in FY15
(from 95,610 FY14) and by 26% to 165,672 until
September 2015. However, the diagnostic services
offered at the regional processing labs primarily
constitute routine tests.
Through its subsidiary NHL’s network of molecu-
lar imaging centers (in Mumbai, New Delhi and
Hyderabad), Thyrocare offers PET-CT scan services
to assist in cancer diagnosis, staging, monitoring of
treatment, and efficacy and evaluation of disease
recurrence. On a low base, PET-CT scan volume has
jumped 5-fold to 11,173 scans in FY15.
Financial Health
As per the annualised H1FY16 performance, Thyro-
care is likely to report 30% growth in consolidated
sales (to Rs 2.38bn) in FY16 with EBITDA margins
of 44%, which are the highest in the industry. Its
annualised PAT of Rs 600mn implies a PAT margin of
25%. Thyrocare is a debt-free company.
Proposed IPO: At the end of February 2016, the
Securities and Exchange Board of India approved
Thyrocare’s draft initial public offering (IPO) propos-
al of 10.7mn shares. Thyrocare’s IPO is an offer for
sale by private equity investor CX Partners and the
firm’s promoters. CX Partners holds 21% stake in the
company, of which it plans to sell almost 90% in the
public issue. Other PE investors in the company in-
clude Norwest Venture Partners (9.43%) and Samara
Capital (2%), who are not selling their stakes in the
IPO. The promoter’s holding will dilute to 63.96%
(from 64.96%) after the IPO.

35GROUND VIEW GROUND VIEW 1 - 31 March 2016 1 - 31 March 2016 34
Indian Economy – Trend Indicators
Monthly Economic Indicators
Quarterly Economic Indicators
Growth Rates (%) Jan-15 Feb-15 Mar-15 Apr-15 May-15 Jun-15 Jul-15 Aug-15 Sep-15 Oct-15 Nov-15 Dec-15 Jan-16 Feb-16
IIP 2.8 4.8 2.5 3.0 2.5 4.2 4.3 6.3 3.8 9.9 -3.4 -1.2 -1.5 -PMI 52.9 51.2 52.1 51.3 52.6 51.3 52.7 52.3 51.2 50.7 50.3 49.1 51.1 51.1
Core sector 2.3 1.4 -0.1 -0.4 4.4 3.0 1.1 2.6 3.2 3.2 -1.3 0.9 2.9 -WPI -0.9 -2.1 -2.3 -2.4 -2.2 -2.1 -4.0 -5.1 -4.6 -3.7 -2.0 -0.7 -0.9 -1.0
CPI 5.2 5.4 5.3 4.9 5.0 5.4 3.7 3.7 4.4 5.0 5.4 5.6 5.7 5.2
Money Supply 10.8 11.2 11.1 11.0 11.0 11.0 11.5 11.3 11.0 10.9 10.7 11.0 11.1 11.3
Deposit 10.9 11.2 11.4 11.4 11.5 11.4 11.8 11.9 11.3 11.1 10.4 10.9 11.1 11.0
Credit 8.9 7.2 8.7 9.7 8.8 9.5 9.4 9.0 7.5 9.0 9.8 11.1 11.4 11.6
Exports -9.3 -13.3 -21.1 -14.0 -20.2 -15.8 -10.3 -20.7 -24.3 -17.5 -24.4 -14.7 -13.6 -5.7
Imports -11.2 -14.7 -13.4 -7.5 -16.5 -13.4 -10.3 -9.9 -25.4 -21.2 -30.3 -3.9 -11.0 -5.0
Trade deficit (USD Bn) -7.9 -6.7 -11.8 -11.0 -10.4 -10.8 -12.8 -12.5 -10.5 -9.8 -9.8 -11.7 -7.6 -6.5
Net FDI (USD Bn) 1.1 1.2 1.8 0.5 0.8 0.8 1.1 1.4 2.0 2.7 3.3 4.8 5.7 -FII (USD Bn) 6.6 3.8 2.0 3.1 -2.8 -2.0 -0.7 -3.5 -2.4 4.5 -3.8 -2.6 -2.0 -ECB (USD Bn) 113.6 114.5 115.1 116.4 118.4 119.9 120.6 119.4 121.8 122.5 121.2 122.6 121.7 -
NRI Deposits (USD Bn) 61.9 61.8 62.5 63.4 63.8 63.7 64.1 66.5 65.6 65.3 66.7 66.2 67.8 68.4
Dollar-Rupee 327.9 338.1 341.4 344.6 352.5 355.2 353.3 355.4 350.0 353.6 351.6 352.1 349.2 346.8
FOREX Reserves (USD Bn) 295.8 291.9 293.4 296.4 287.9 284.6 280.2 275.5 276.3 283.0 291.3 295.7 292.2 294.4
Balance of Payment (USD Bn) Q2FY14 Q3FY14 Q4FY14 Q1FY15 Q2FY15 Q3FY15 Q4FY15 Q1FY16 Q2FY16Exports 81.2 79.8 83.7 81.7 85.3 79.0 70.8 68.0 67.6Imports 114.5 112.9 114.3 116.3 123.9 118.3 102.5 102.2 105.0Trade deficit -33.3 -33.2 -30.7 -34.6 -38.6 -39.3 -31.7 -34.2 -37.4Net Invisibles 28.1 29.1 29.3 26.7 28.5 30.9 30.2 28.0 29.2CAD -5.2 -4.1 -1.3 -7.9 -10.1 -8.4 -1.5 -6.1 -8.2CAD (% of GDP) 1.2 0.9 0.3 1.6 2.0 1.7 0.3 1.2 1.6Capital Account -4.8 23.8 9.2 19.2 16.5 23.6 30.7 18.1 7.2BoP -10.4 19.1 7.1 11.2 6.9 13.2 30.1 11.4 -0.9
GDP and its Components (YoY, %) Q3FY14 Q4FY14 Q1FY15 Q2FY15 Q3FY15 Q4FY15 Q1FY16 Q2FY16 Q3FY16Agriculture & allied activities 3.8 4.4 2.6 2.8 -2.4 -1.4 1.6 2.0 -1.0Industry 5.5 5.5 8.1 6.2 3.4 7.2 7.1 8.4 11.0Mining & Quarrying 4.2 11.5 4.3 7.0 9.1 2.3 8.6 5.0 6.5Manufacturing 5.9 4.4 8.4 5.8 1.7 8.4 7.3 9.0 12.6Electricity, Gas & Water Supply 3.9 5.9 10.1 8.8 8.8 4.2 4.0 7.5 6.0Services 8.3 5.6 8.4 9.9 11.7 8.0 8.5 8.3 8.6Construction 3.8 1.2 6.5 5.3 4.9 1.4 6.0 1.2 4.0Trade, Hotel, Transport and Communications 12.4 9.9 12.1 8.4 6.2 14.1 10.5 8.1 10.1Finance, Insurance, Real Estate & Business Services 5.7 5.5 9.3 12.7 12.1 10.2 9.3 11.6 9.9Community, Social & Personal Services 9.1 2.4 2.8 10.3 25.3 0.1 6.1 7.1 7.5GDP at FC 6.6 5.3 7.4 8.1 6.7 6.1 7.2 7.5 7.1

35GROUND VIEW GROUND VIEW 1 - 31 March 2016 1 - 31 March 2016 34
Annual Economic Indicators and Forecasts Indicators Units FY8 FY9 FY10 FY11 FY12 FY13 FY14 FY15 FY16E FY17E
Real GDP growth % 9.3 6.7 8.6 8.9 6.7 4.5 4.7 7.2 6.8 7.5
Agriculture % 5.8 0.1 0.8 8.6 5.0 1.4 4.7 0.2 2.0 4.0
Industry % 9.2 4.1 10.2 8.3 6.7 0.9 -0.1 6.6 5.7 6.7
Services % 10.3 9.4 10.0 9.2 7.1 6.2 6.0 9.4 8.5 8.8
Real GDP Rs Bn 38966 41587 45161 49185 52475 54821 91698 98271 104953 112825
Real GDP US$ Bn 967 908 953 1079 1096 1008 1517 1611 1615 1684
Nominal GDP Rs Bn 49864 56301 64778 77841 90097 101133 113451 126538 137626 153212
Nominal GDP US$ Bn 1237 1229 1367 1707 1881 1859 1876 2074 2117 2287
Population Mn 1138 1154 1170 1186 1202 1219 1236 1254 1271 1302
Per Capita Income US$ 1087 1065 1168 1439 1565 1525 1518 1655 1666 1757
WPI (Average) % 4.7 8.1 3.8 9.6 8.7 7.4 6.0 2.0 -2.0 4.0
CPI (Average) % 6.4 9.0 12.4 10.4 8.3 10.2 9.5 6.0 5.0 5.0
Money Supply % 22.1 20.5 19.2 16.2 15.8 13.6 13.5 12.0 12.0 13.0
CRR % 7.50 5.00 5.75 6.00 4.75 4.00 4.00 4.0 4.0 4.0
Repo rate % 7.75 5.00 5.00 6.75 8.50 7.50 8.00 7.50 6.75 6.25-6.5
Reverse repo rate % 6.00 3.50 3.50 5.75 7.50 6.50 7.00 6.50 5.75 5.25-5.5
Bank Deposit growth % 22.4 19.9 17.2 15.9 13.5 14.4 14.6 11.4 12.0 13.5
Bank Credit growth % 22.3 17.5 16.9 21.5 17.0 15.0 14.3 9.5 10.0 12.0
Centre Fiscal Deficit Rs Bn 1437 3370 4140 3736 5160 5209 5245 5107 5351 5339
Centre Fiscal Deficit % of GDP 2.9 6.0 6.4 4.8 5.7 5.2 4.6 4.1 3.9 3.5
Gross Central Govt Borrowings Rs Bn 1681 2730 4510 4370 5098 5580 5641 5920 5850 6000
Net Central Govt Borrowings Rs Bn 1318 2336 3984 3254 4362 4674 4536 4531 4406 4252
State Fiscal Deficit % of GDP 1.5 2.4 2.9 2.1 1.9 2.0 2.5 2.4 2.0 1.5
Consolidted Fiscal Deficit % of GDP 4.4 8.4 9.3 6.9 7.6 6.9 7.1 6.6 5.9 5.0
Exports US$ Bn 166.2 189.0 182.4 251.1 309.8 306.6 318.6 316.7 270.0 283.5
YoY Growth % 28.9 13.7 -3.5 37.6 23.4 -1.0 3.9 -0.6 -14.8 5.0
Imports US$ Bn 257.6 308.5 300.6 381.1 499.5 502.2 466.2 460.9 406.0 428.3
YoY Growth % 35.1 19.7 -2.5 26.7 31.1 0.5 -7.2 -1.1 -11.9 5.5
Trade Balance US$ Bn -91.5 -119.5 -118.2 -129.9 -189.8 -195.6 -147.6 -144.2 -136.0 -144.8
Net Invisibles US$ Bn 75.7 91.6 80.0 84.6 111.604 107.5 115.2 116.2 118.8 121.1
Current Account Deficit US$ Bn -15.7 -27.9 -38.2 -45.3 -78.2 -88.2 -32.4 -27.9 -17.2 -23.7
CAD (% of GDP) % -1.3 -2.3 -2.8 -2.6 -4.2 -4.7 -1.7 -1.4 -0.8 -1.0
Capital Account Balance US$ Bn 106.6 7.8 51.6 62.0 67.8 89.3 48.8 90.0 50.4 75.5
Dollar-Rupee (Average) 40.3 45.8 47.4 45.6 47.9 54.4 60.5 61.2 65.0 67.0
Source: RBI, CSO, CGA, Ministry of Agriculture, Ministry of commerce, Bloomberg, PhillipCapital India Research

37GROUND VIEW GROUND VIEW 1 - 31 March 2016 1 - 31 March 2016 36
Note
: For
ban
ks, E
BITD
A is
pre-
prov
ision
pro
fit
CMP
Mkt
Cap
Ne
t Sal
es (R
s mn)
EB
IDTA
(Rs
mn)
PAT (
Rs m
n)EP
S (R
s)
EPS
Grow
th (%
) P
/E (x
) P
/B (x
) EV
/EBI
TDA
(x)
ROE
(%)
ROCE
(%)
Nam
e of
com
pany
Sect
orRs
Rs m
nFY
16E
FY17
EFY
16E
FY17
EFY
16E
FY17
EFY
16E
FY17
EFY
16E
FY17
EFY
16E
FY17
EFY
16E
FY17
EFY
16E
FY17
EFY
16E
FY17
EFY
16E
FY17
E
Cham
bal F
ertil
isers
Agri
Inpu
ts 5
6 2
3,09
7 1
06,6
26
105
,340
8
,258
8
,387
3
,619
3
,692
9
9
3
6.9
2.0
6
.3
6.2
0
.9
0.8
6
.5
6.1
1
4.4
13.
3 6
.9
6.9
Zuar
i Agr
oche
mica
lsAg
ri In
puts
131
5
,510
5
1,04
6 5
4,93
0 2
,470
3
,230
1
81
828
4
2
0 -6
6.8
358
.3
30.
5 6
.7
0.7
0
.6
10.
7 7
.6
2.2
9
.5
0.6
2
.7
Ralli
s Ind
iaAg
ri In
puts
163
3
1,63
0 1
6,41
7 1
8,66
0 2
,433
2
,934
1
,323
1
,638
7
8
-1
5.9
23.
8 2
3.9
19.
3 3
.5
3.2
1
3.4
10.
9 1
4.7
16.
4 1
3.3
15.
1
Tata
Che
mica
ls Lt
dAg
ri In
puts
349
8
8,96
1 1
81,3
31
190
,743
2
3,76
6 2
6,24
5 8
,950
1
0,28
4 3
5 4
0 1
1.8
14.
9 9
.9
8.7
1
.5
1.3
6
.4
5.6
1
4.6
15.
1 8
.4
9.2
Kave
ri Se
eds
Agri
Inpu
ts 3
97
27,
422
9,2
47
11,
136
2,0
80
2,7
84
1,9
90
2,8
42
29
41
-33.
9 4
2.8
13.
7 9
.6
3.0
2
.5
12.
2 8
.7
22.
1 2
5.7
23.
4 2
7.5
Unite
d Ph
osph
orus
Agri
Inpu
ts 4
40
188
,693
1
28,9
03
141
,881
2
5,31
5 2
7,29
6 1
1,37
5 1
3,48
9 2
7 3
1 -3
.3
18.
6 1
6.6
14.
0 3
.0
2.6
8
.2
7.6
1
8.5
19.
8 1
6.0
16.
1
Mon
sant
o In
dia
Agri
Inpu
ts 1
,785
3
0,81
4 4
,943
5
,764
8
90
1,0
43
790
9
56
46
55
-26.
9 2
1.0
39.
0 3
2.2
8.1
8
.2
33.
8 2
8.8
20.
6 2
5.3
17.
9 1
9.8
PI In
dustr
ies
Agri
Inpu
ts 5
72
78,
430
22,
849
27,
361
4,4
77
5,3
55
2,8
71
3,6
37
21
27
16.
7 2
6.7
27.
2 2
1.5
6.9
5
.4
17.
2 1
4.0
25.
3 2
5.3
26.
1 2
6.0
Coro
man
del I
nter
nAg
ri In
puts
173
5
0,39
8 9
8,38
6 1
05,6
72
7,4
89
9,7
63
3,3
71
4,9
66
12
17
-16.
8 4
7.3
14.
9 1
0.1
1.8
1
.6
8.2
5
.9
12.
0 1
6.1
13.
7 1
7.2
Tata
Mot
ors
Auto
mob
iles
368
1
,195
,946
2
,582
,235
2
,766
,233
3
85,5
05
456
,242
1
19,8
25
158
,535
3
7 4
9 -1
4.9
32.
3 9
.9
7.5
1
.7
1.4
4
.6
3.9
1
7.4
18.
7 8
.2
9.4
Bhar
at Fo
rge
Auto
mob
iles
810
1
88,6
22
75,
839
85,
114
15,
970
17,
919
8,5
56
10,
428
37
45
19.
2 2
1.9
22.
1 1
8.1
4.6
3
.9
12.
5 1
0.8
21.
0 2
1.4
15.
4 1
7.3
Mah
indr
a & M
ahin
dra
Auto
mob
iles
1,2
11
751
,832
3
83,8
40
426
,543
5
2,58
6 5
9,71
6 3
3,77
6 3
9,06
9 5
7 6
6 9
.4
15.
7 2
1.2
18.
3 3
.2
2.9
1
4.5
12.
5 1
5.2
15.
6 1
2.9
13.
8
Asho
k Ley
land
Auto
mob
iles
97
276
,619
1
75,3
38
212
,276
1
9,07
7 2
3,82
5 8
,908
1
2,37
5 3
4
2
80.9
3
8.9
31.
1 2
2.4
4.7
4
.0
15.
0 1
1.8
15.
3 1
7.9
12.
7 1
5.5
Apol
lo Ty
res
Auto
mob
iles
171
8
7,17
0 1
18,4
04
118
,681
1
9,24
1 1
8,75
2 1
0,26
9 9
,107
2
0 1
8 -3
.1
-11.
3 8
.5
9.6
1
.4
1.3
4
.8
5.3
1
8.6
14.
1 1
5.8
12.
3
Mar
uti S
uzuk
iAu
tom
obile
s 3
,669
1
,108
,332
5
57,9
84
678
,681
8
9,87
5 1
07,6
52
47,
990
67,
041
159
2
22
29.
3 3
9.7
23.
1 1
6.5
4.0
3
.3
12.
3 1
0.0
17.
3 2
0.0
17.
4 2
0.6
Mah
indr
a CIE
Auto
mob
iles
178
5
7,63
5 6
0,66
4 6
8,33
4 7
,519
9
,345
3
,171
4
,607
1
0 1
4 3
2.9
45.
3 1
8.2
12.
5 2
.6
2.2
9
.2
6.9
1
4.3
17.
7 1
0.5
14.
5
Baja
j Aut
oAu
tom
obile
s 2
,317
6
70,4
49
224
,979
2
78,0
66
48,
131
59,
019
37,
355
43,
542
129
1
50
18.
4 1
6.6
18.
0 1
5.4
5.2
4
.3
13.
6 1
0.8
29.
1 2
8.2
26.
6 2
6.5
Hero
Mot
oCor
pAu
tom
obile
s 2
,808
5
60,7
42
283
,477
3
17,0
12
44,
724
49,
335
31,
533
34,
996
158
1
75
24.
1 1
1.0
17.
8 1
6.0
6.9
5
.8
12.
5 1
1.3
38.
9 3
6.1
38.
7 3
6.0
Cum
min
s Ind
iaCa
pita
l Goo
ds 8
40
232
,848
4
8,07
4 5
6,01
4 8
,184
1
0,07
4 7
,992
9
,102
2
9 3
3 1
4.9
13.
9 2
9.1
25.
6 7
.3
6.6
2
8.4
23.
0 2
5.1
25.
7 2
1.6
22.
7
Engi
neer
s Ind
iaCa
pita
l Goo
ds 1
62
54,
719
15,
978
15,
186
1,7
36
2,1
95
2,7
22
2,8
03
8
8
-17.
6 3
.0
20.
1 1
9.5
2.0
2
.0
17.
4 1
4.3
10.
1 1
0.1
10.
2 1
0.3
Siem
ens
Capi
tal G
oods
1,0
36
368
,887
1
03,6
09
112
,998
8
,137
1
0,25
9 6
,169
8
,582
1
7 2
4 7
3.7
39.
1 5
9.8
43.
0 7
.8
7.1
4
2.2
32.
6 1
3.0
16.
6 1
0.6
13.
6
Crom
pton
Gre
aves
Capi
tal G
oods
155
9
7,33
4 1
27,7
03
142
,459
6
,220
8
,709
1
,486
3
,578
2
6
-1
9.3
140
.8
65.
5 2
7.2
2.4
2
.3
18.
4 1
2.8
3.7
8
.4
3.2
6
.5
VA Te
ch W
abag
Capi
tal G
oods
526
2
8,66
8 2
8,94
2 3
3,62
2 2
,388
2
,883
1
,225
1
,483
2
3 2
7 9
.6
21.
0 2
3.3
19.
3 2
.9
2.6
1
1.5
9.8
1
2.3
13.
4 9
.8
10.
6
Volta
sCa
pita
l Goo
ds 2
52
83,
251
55,
468
58,
401
3,3
26
4,6
15
2,7
11
3,6
90
8
11
-18.
5 3
6.1
30.
7 2
2.6
3.6
3
.2
24.
8 1
7.3
11.
8 1
4.3
12.
0 1
4.9
BHEL
Capi
tal G
oods
107
2
61,6
48
258
,137
2
95,1
31
-10,
904
15,
208
-5,4
73
12,
262
-2
5
n.a
. n
.a.
-47.
8 2
1.3
0.8
0
.8
-10.
7 9
.6
-1.6
3
.5
-1.2
2
.8
Alsto
m T&
DCa
pita
l Goo
ds 3
91
100
,089
4
1,95
0 4
3,90
4 3
,793
4
,236
1
,821
2
,096
7
8
4
0.5
15.
1 5
5.0
47.
8 6
.8
6.4
2
6.6
23.
4 1
2.4
13.
4 1
2.4
13.
1
Phill
ipC
apita
l Ind
ia C
over
age
Uni
vers
e: V
alua
tio
n Su
mm
ary

37GROUND VIEW GROUND VIEW 1 - 31 March 2016 1 - 31 March 2016 36
Phill
ipC
apita
l Ind
ia C
over
age
Uni
vers
e: V
alua
tio
n Su
mm
ary
CMP
Mkt
Cap
Ne
t Sal
es (R
s mn)
EB
IDTA
(Rs
mn)
PAT (
Rs m
n)EP
S (R
s)
EPS
Grow
th (%
) P
/E (x
) P
/B (x
) EV
/EBI
TDA
(x)
ROE
(%)
ROCE
(%)
Nam
e of
com
pany
Sect
orRs
Rs m
nFY
16E
FY17
EFY
16E
FY17
EFY
16E
FY17
EFY
16E
FY17
EFY
16E
FY17
EFY
16E
FY17
EFY
16E
FY17
EFY
16E
FY17
EFY
16E
FY17
EFY
16E
FY17
E
ABB
Indi
aCa
pita
l Goo
ds 1
,139
2
41,3
74
81,
403
92,
625
7,1
25
8,6
33
2,9
99
3,8
85
14
18
15.
8 2
9.6
80.
5 6
2.1
8.0
7
.5
33.
9 2
7.9
10.
0 1
2.1
9.5
1
1.0
Lars
en &
Toub
roCa
pita
l Goo
ds 1
,186
1
,105
,060
1
,017
,884
1
,127
,411
1
19,2
64
138
,973
4
4,07
9 5
4,79
3 4
7 5
9 -0
.2
24.
3 2
5.2
20.
3 2
.5
2.3
1
7.4
14.
9 1
0.0
11.
4 4
.4
4.9
KEC
Inte
rnat
iona
lCa
pita
l Goo
ds 1
16
29,
809
87,
242
93,
074
6,7
69
7,5
31
1,8
07
2,2
90
7
9
59.
4 2
6.7
16.
5 1
3.0
2.0
1
.8
7.6
6
.6
12.
2 1
3.8
9.5
1
0.3
Ther
max
Capi
tal G
oods
763
9
0,85
7 5
4,82
8 5
1,41
6 4
,676
4
,543
2
,825
2
,720
2
4 2
3 2
1.0
-3.7
3
2.2
33.
4 3
.9
3.7
1
9.7
19.
5 1
2.2
11.
0 9
.6
8.6
Inox
Win
dCa
pita
l Goo
ds 2
53
56,
168
42,
332
49,
830
6,7
64
8,5
19
4,5
31
5,7
15
20
26
71.
0 2
6.1
12.
4 9
.8
3.2
2
.6
9.5
7
.5
26.
1 2
6.3
18.
0 1
8.3
Alsto
m In
dia
Capi
tal G
oods
605
4
0,70
0 2
3,14
4 n
.a.
1,1
74
-26,
159
918
-2
6,42
9 1
4 -3
93
-33.
8 n
.a.
44.
3 -1
.5
3.6
n
.a.
24.
8 -1
.1
8.0
8.5
n
.a.
Dalm
ia B
hara
t Ltd
Cem
ent
725
5
8,93
8 6
5,28
8 8
0,83
0 1
3,49
5 2
0,02
0 1
,308
5
,202
1
5 5
9 n
.a.
297
.7
49.
2 1
2.4
1.4
1
.4
9.1
6
.1
2.9
1
1.6
5.0
7
.7
Shre
e Ce
men
tCe
men
t
397
,562
6
0,80
3 8
8,59
1 1
4,34
0 2
5,23
4 5
,323
1
1,14
6 2
04
320
6
6.5
57.
1 5
6.0
35.
7 6
.9
6.0
2
7.0
14.
9 1
2.4
16.
7 1
1.8
17.
1
Man
gala
m C
emen
tCe
men
t 1
83
4,8
78
8,4
61
9,6
55
513
1
,075
-1
87
220
-7
8
n
.a.
n.a
. -2
6.0
22.
2 1
.0
0.9
2
0.2
9.1
-3
.7
4.2
0
.9
4.6
OCL I
ndia
Cem
ent
408
2
3,19
3 2
5,12
1 2
9,24
5 4
,144
5
,573
1
,878
3
,025
3
3 5
3 3
8.2
61.
0 1
2.4
7.7
1
.7
1.4
5
.7
3.7
1
3.5
18.
7 1
1.1
16.
5
JK La
kshm
i Cem
ent
Cem
ent
287
3
3,81
8 2
5,75
4 3
2,67
1 4
,009
5
,450
7
05
1,9
04
6
16
-57.
9 1
70.2
4
8.0
17.
8 2
.4
2.2
1
3.2
9.2
5
.0
12.
4 5
.5
8.4
JK C
emen
tCe
men
t 5
79
40,
457
34,
229
40,
965
4,5
96
6,5
98
638
1
,910
9
2
7 -4
8.9
199
.5
63.
5 2
1.2
2.4
2
.2
14.
7 1
0.1
3.8
1
0.6
4.6
6
.9
Heid
elbe
rgCe
men
t Ce
men
t 7
4 1
6,72
4 1
8,15
1 2
0,06
1 2
,156
2
,962
3
62
989
2
4
n
.a.
173
.3
46.
2 1
6.9
1.8
1
.7
11.
8 7
.9
4.0
9
.8
4.2
6
.8
Indi
a Cem
ent
Cem
ent
76
23,
223
58,
814
65,
319
8,2
24
9,9
26
966
2
,430
3
8
n
.a.
151
.7
24.
1 9
.6
0.6
0
.6
6.2
4
.7
2.7
6
.0
4.6
6
.4
Ambu
ja C
emen
tCe
men
t 2
05
317
,829
2
17,5
73
257
,518
2
8,95
5 4
1,40
1 1
3,50
6 1
8,53
1 7
9
-2
9.3
37.
2 3
0.1
21.
9 2
.2
2.1
1
0.3
7.1
7
.2
9.5
1
0.4
10.
7
ACC
Cem
ent
1,2
37
232
,147
1
14,3
28
126
,246
1
1,73
0 1
5,91
7 7
,520
9
,415
4
0 5
0 -3
5.3
25.
2 3
0.9
24.
7 2
.8
2.7
1
8.7
14.
0 8
.9
10.
8 8
.1
9.7
Ultra
tech
Cem
ent
Cem
ent
3,0
03
824
,189
2
69,1
93
323
,990
4
8,32
1 6
5,05
6 2
2,32
1 3
3,55
7 8
1 1
22
6.4
5
0.3
36.
9 2
4.6
3.9
3
.5
18.
8 1
3.3
10.
6 1
4.1
8.2
1
1.0
LIC H
ousin
g Fin
ance
Finan
cials
458
2
31,3
63
124
,490
1
47,1
47
25,
186
29,
807
16,
280
19,
248
32
38
17.
4 1
8.2
14.
2 1
2.0
2.5
2
.2
9.2
7
.8
19.
2 1
9.4
1.3
1
.3
DCB
Bank
Finan
cials
76
21,
546
6,2
08
7,6
81
3,5
53
3,2
10
1,6
23
1,2
98
6
5
-15.
1 -2
0.0
13.
2 1
6.5
1.4
1
.3
6.1
6
.7
10.
0 7
.4
0.9
0
.6
Indu
sind
Bank
Finan
cials
924
5
49,7
81
44,
382
56,
026
41,
529
51,
525
23,
347
29,
163
39
46
14.
1 1
8.3
23.
9 2
0.2
3.2
2
.8
13.
2 1
0.7
16.
9 1
5.7
1.9
3
.2
Repc
o Ho
me
Finan
ce
Finan
cials
588
3
6,74
3 2
,508
1
0,98
7 2
,508
3
,196
1
,492
1
,901
2
4 3
0 2
0.7
n.a
. 2
4.7
19.
4 3
.9
0.1
1
4.6
14.
9 1
7.0
18.
4 2
.2
2.2
Punj
ab N
atio
nal B
ank
Finan
cials
83
163
,175
1
72,7
75
195
,620
1
27,1
47
140
,053
3
1,25
9 4
3,19
5 1
6 2
1 -3
.9
31.
7 5
.2
4.0
0
.5
0.5
1
.3
1.2
7
.9
9.8
0
.5
0.6
Bank
of I
ndia
Fin
ancia
ls 9
5 7
6,88
8 1
17,8
03
132
,038
7
0,15
0 8
0,84
1 -1
7,56
9 1
5,96
4 -2
1 1
7 -1
82.5
-1
78.1
-4
.5
5.7
0
.7
0.6
1
.1
1.0
-6
.3
5.5
-0
.3
0.2
Corp
orat
ion
bank
Finan
cials
42
42,
791
43,
339
49,
453
33,
140
37,
381
9,0
26
11,
653
22
26
28.
4 1
5.1
1.9
1
.6
0.1
0
.1
1.3
1
.1
8.0
9
.0
0.4
0
.5
Bank
of B
arod
a Fin
ancia
ls 1
42
327
,536
1
23,9
08
144
,969
8
5,90
3 1
03,2
71
-15,
488
35,
224
10
17
-33.
2 6
5.5
13.
9 8
.4
1.0
0
.9
3.8
3
.2
-4.0
8
.9
-0.2
0
.6
Stat
e Ba
nk o
f Ind
iaFin
ancia
ls 1
84
1,4
26,7
98
761
,480
8
65,2
03
504
,778
5
04,6
29
126
,779
1
45,0
77
24
28
4.2
1
5.1
7.7
6
.7
1.0
0
.9
2.8
2
.8
7.3
7
.6
0.4
0
.7

39GROUND VIEW GROUND VIEW 1 - 31 March 2016 1 - 31 March 2016 38
CMP
Mkt
Cap
Ne
t Sal
es (R
s mn)
EB
IDTA
(Rs
mn)
PAT (
Rs m
n)EP
S (R
s)
EPS
Grow
th (%
) P
/E (x
) P
/B (x
) EV
/EBI
TDA
(x)
ROE
(%)
ROCE
(%)
Nam
e of
com
pany
Sect
orRs
Rs m
nFY
16E
FY17
EFY
16E
FY17
EFY
16E
FY17
EFY
16E
FY17
EFY
16E
FY17
EFY
16E
FY17
EFY
16E
FY17
EFY
16E
FY17
EFY
16E
FY17
EFY
16E
FY17
E
Unio
n Ba
nk
Finan
cials
127
8
7,03
0 9
1,48
6 1
04,2
00
65,
071
72,
807
23,
291
31,
568
34
43
19.
7 2
6.8
3.8
3
.0
0.6
0
.5
1.3
1
.2
11.
8 1
3.8
0.6
0
.7
Cana
ra B
ank
Finan
cials
187
1
01,2
68
91,
757
99,
117
69,
458
71,
508
10,
027
14,
946
48
65
-15.
4 3
5.3
3.9
2
.9
0.5
0
.4
1.5
1
.4
3.7
5
.2
0.2
0
.4
Indi
an B
ank
Finan
cials
103
4
9,42
2 4
8,01
4 5
6,43
8 3
3,38
5 3
8,54
6 1
1,31
9 1
5,26
0 2
2 2
8 5
.3
28.
6 4
.7
3.6
0
.5
0.4
1
.5
1.3
8
.6
10.
4 0
.6
1.0
Orie
ntal
Ban
k of C
omFin
ancia
ls 8
9 2
6,74
7 5
2,85
1 5
8,87
0 4
2,89
8 4
6,47
1 1
0,31
3 1
5,49
7 3
1 4
3 8
6.7
38.
7 2
.9
2.1
0
.3
0.3
0
.6
0.6
7
.5
10.
1 0
.4
0.9
ICIC
I Ban
kFin
ancia
ls 2
24
1,3
00,5
16
211
,212
2
43,0
27
250
,632
2
56,0
01
120
,868
1
30,5
80
21
22
7.9
7
.8
10.
8 1
0.0
1.7
1
.5
5.2
5
.1
14.
3 1
4.0
1.8
2
.5
Shrir
am Tr
ansp
ort F
inFin
ancia
ls 9
38
212
,816
5
0,11
7 5
8,10
3 3
6,90
4 4
3,28
4 1
3,58
7 1
4,91
1 6
0 6
6 9
.8
9.7
1
5.7
14.
3 9
3.8
93.
8 5
.8
4.9
1
3.9
13.
5 2
.1
2.0
Shrir
am C
ity U
nion
Fin
Finan
cials
1,5
10
99,
553
23,
845
27,
169
13,
950
15,
987
6,1
54
6,8
84
93
104
1
0.3
11.
9 1
6.2
14.
5 2
.2
2.0
7
.1
6.2
1
4.3
14.
4 3
.2
3.2
AXIS
Ban
kFin
ancia
ls 4
17
992
,863
1
63,2
55
192
,698
1
59,0
84
181
,827
8
5,46
5 9
9,62
2 3
4 3
7 1
0.6
7.5
1
2.1
11.
3 2
.1
1.9
6
.2
5.5
1
7.7
17.
8 1
.7
1.7
Chol
aman
dala
m In
ves
Finan
cials
670
1
04,6
15
20,
710
24,
084
12,
220
14,
700
5,3
04
7,2
24
34
46
12.
5 3
6.2
19.
7 1
4.4
2.9
2
.4
8.6
7
.1
15.
6 1
8.2
2.1
2
.4
HDFC
Lim
ited
Finan
cials
1,1
38
1,7
96,9
61
311
,386
3
53,6
56
100
,235
1
14,4
00
69,
114
79,
030
32
38
17.
4 -
35.
3 2
9.9
5.1
4
.5
17.
9 1
5.7
21.
0 2
1.1
2.6
2
.6
Mah
indr
a Fin
ance
Finan
cials
229
1
29,9
63
31,
755
35,
666
20,
160
22,
752
5,5
09
7,6
02
10
13
-33.
8 3
8.0
23.
4 1
7.0
2.2
2
.0
6.4
5
.7
9.5
1
2.3
1.5
1
.9
HDFC
Ban
kFin
ancia
ls 1
,026
2
,592
,277
2
74,1
49
324
,937
2
23,3
51
263
,567
1
24,1
09
147
,056
5
0 5
9 2
1.5
18.
5 2
0.7
17.
5 3
.7
3.2
1
1.6
9.8
1
8.6
19.
1 1
.9
3.0
SKS
Micr
ofina
nce
Finan
cials
535
6
8,06
2 1
2,61
4 1
9,29
0 4
,149
6
,085
2
,964
4
,301
2
4 3
4 5
8.5
45.
1 2
2.7
15.
7 5
.0
3.8
1
6.4
11.
2 2
4.9
27.
7 4
.8
4.2
Andh
ra B
ank
Finan
cials
52
33,
888
49,
573
55,
968
33,
634
37,
297
9,2
08
12,
407
14
18
32.
4 2
6.6
3.7
2
.9
0.4
0
.4
1.0
0
.9
9.2
1
1.2
0.5
0
.5
Indi
an O
vers
eas B
ank
Finan
cials
28
47,
413
73,
446
n.a
. 4
8,07
2 n
.a.
11,
896
n.a
. 8
n
.a.
72.
2 n
.a.
3.3
n
.a.
0.4
n
.a.
1.0
n
.a.
7.1
-
0.3
-
Asia
n Pa
ints
FMCG
901
8
64,2
37
151
,051
1
72,6
81
27,
732
32,
997
17,
910
21,
074
19
22
25.
9 1
7.7
48.
3 4
1.0
15.
4 1
3.0
31.
1 2
5.8
31.
9 3
1.6
32.
6 3
1.9
Hind
usta
n Un
ileve
rFM
CG 8
52
1,8
43,6
18
317
,059
3
50,5
77
63,
333
71,
861
41,
131
46,
775
19
22
6.7
1
3.7
44.
9 3
9.5
52.
3 5
4.3
28.
7 2
5.2
116
.4
137
.6
113
.6
135
.2
Baja
j Cor
pFM
CG 3
91
57,
709
8,8
96
9,9
43
2,7
51
3,0
92
2,5
25
2,7
54
17
19
12.
9 9
.1
22.
9 2
1.0
11.
5 1
1.1
20.
4 1
8.0
50.
4 5
3.1
41.
0 5
0.4
ITCFM
CG 3
21
2,5
77,0
66
360
,415
3
94,4
83
143
,426
1
59,7
41
96,
533
107
,593
1
2 1
3 5
.1
11.
5 2
6.6
23.
8 7
.4
6.4
1
7.2
15.
3 2
7.7
27.
1 2
3.6
23.
7
Emam
iFM
CG 9
65
219
,081
2
6,59
7 3
2,69
1 7
,171
9
,652
5
,737
7
,602
2
5 3
3 1
8.2
32.
5 3
8.2
28.
8 1
4.9
12.
3 3
1.3
22.
7 3
9.1
42.
8 2
2.6
20.
8
Nestl
eFM
CG 5
,064
4
88,2
15
81,
236
99,
957
16,
018
21,
369
10,
410
12,
236
108
1
27
-12.
2 1
7.5
46.
9 3
9.9
20.
1 1
9.2
30.
0 2
2.4
42.
8 4
8.0
39.
5 4
9.1
Jubi
lant
Food
work
sFM
CG 1
,164
7
6,52
9 2
4,32
0 2
8,92
3 2
,730
3
,564
1
,081
1
,502
1
7 2
3 -1
2.3
38.
9 7
0.4
50.
7 9
.8
8.2
2
8.2
21.
5 1
3.9
16.
2 1
4.3
17.
0
Mar
ico In
dustr
ies
FMCG
249
3
20,8
66
61,
279
67,
287
10,
714
12,
741
7,2
35
8,6
63
6
7
29.
9 1
9.7
44.
3 3
7.0
14.
1 1
1.5
29.
7 2
4.6
31.
8 3
1.0
28.
7 2
8.8
Colg
ate
FMCG
838
2
27,9
92
40,
943
45,
004
9,4
77
11,
306
6,2
25
7,1
52
23
26
11.
4 1
4.9
36.
6 3
1.9
27.
1 2
4.5
23.
7 1
9.8
73.
9 7
6.9
77.
2 8
0.7
Agro
Tech
Food
sFM
CG 4
83
11,
770
7,7
90
8,3
04
623
7
60
304
3
92
12
16
-18.
5 2
9.2
38.
8 3
0.0
3.5
3
.2
18.
7 1
5.0
9.0
1
0.5
9.1
1
0.8
Dabu
r Ind
ia Lt
dFM
CG 2
51
441
,456
8
3,78
0 9
5,35
3 1
5,30
7 1
7,65
8 1
2,67
4 1
4,53
7 7
8
1
8.9
14.
7 3
4.8
30.
3 1
0.8
9.0
2
8.7
24.
5 3
1.0
29.
7 2
8.5
27.
9
Phill
ipC
apita
l Ind
ia C
over
age
Uni
vers
e: V
alua
tio
n Su
mm
ary

39GROUND VIEW GROUND VIEW 1 - 31 March 2016 1 - 31 March 2016 38
CMP
Mkt
Cap
Ne
t Sal
es (R
s mn)
EB
IDTA
(Rs
mn)
PAT (
Rs m
n)EP
S (R
s)
EPS
Grow
th (%
) P
/E (x
) P
/B (x
) EV
/EBI
TDA
(x)
ROE
(%)
ROCE
(%)
Nam
e of
com
pany
Sect
orRs
Rs m
nFY
16E
FY17
EFY
16E
FY17
EFY
16E
FY17
EFY
16E
FY17
EFY
16E
FY17
EFY
16E
FY17
EFY
16E
FY17
EFY
16E
FY17
EFY
16E
FY17
EFY
16E
FY17
E
Godr
ej C
onsu
mer
Pro
dFM
CG 1
,274
4
33,8
40
89,
448
98,
878
16,
194
18,
289
11,
313
12,
983
33
38
24.
4 1
4.8
38.
3 3
3.4
8.4
7
.1
27.
4 2
3.6
22.
0 2
1.3
16.
8 1
7.4
Brita
nnia
FMCG
2,8
07
336
,742
8
6,92
9 9
9,11
2 1
1,99
9 1
4,56
7 8
,528
1
0,41
1 7
1 8
7 5
7.2
22.
1 3
9.5
32.
3 1
8.6
13.
5 2
8.1
22.
6 4
7.1
41.
8 5
0.0
45.
2
Apco
tex I
ndus
tries
FMCG
204
4
,230
3
,940
4
,857
4
91
685
3
38
440
3
2 4
2 3
7.2
30.
0 6
.3
4.8
1
.7
1.4
8
.1
6.1
2
7.6
28.
7 2
7.1
29.
0
Glax
o Sm
ithkl
ine
Con
FMCG
5,6
33
236
,918
4
2,89
1 4
6,97
3 7
,104
7
,953
7
,023
7
,970
1
67
190
2
0.4
13.
5 3
3.7
29.
7 9
.5
8.3
3
0.6
26.
6 2
8.2
27.
8 3
0.3
29.
6
J Kum
ar In
frapr
ojec
tsIn
frastr
uctu
re 3
10
23,
456
14,
775
18,
469
2,7
19
3,3
71
1,1
54
1,6
14
15
21
4.2
3
9.8
20.
3 1
4.5
1.8
1
.6
8.4
7
.3
11.
1 1
1.8
10.
8 1
1.4
PNC
Infra
tech
Ltd
Infra
struc
ture
489
2
5,10
7 1
9,51
2 2
3,41
5 2
,576
3
,091
1
,264
1
,640
2
5 3
2 -2
.3
29.
8 1
9.9
15.
3 2
.0
1.8
1
0.1
8.7
1
2.7
12.
2 1
1.6
11.
3
GMR
Infra
struc
ture
Infra
struc
ture
11
69,
112
108
,828
9
4,38
8 4
6,07
6 3
3,26
7 -1
6,98
3 -2
8,98
5 -3
-5
-4
6.1
70.
7 -3
.7
-2.2
0
.9
1.6
1
1.0
14.
6 -2
4.9
-73.
7 2
.2
-0.6
GVK
Powe
rIn
frastr
uctu
re 7
1
0,77
0 2
9,88
5 4
8,60
5 1
8,89
7 2
8,26
4 -6
,809
-3
,136
-4
-2
3
3.8
-53.
9 -1
.6
-3.4
0
.7
0.7
1
2.7
8.4
-4
5.7
-21.
7 1
.2
3.4
MBL
Infra
struc
ture
s Ltd
In
frastr
uctu
re 1
38
5,7
06
21,
433
24,
648
2,3
58
2,7
11
705
7
83
17
19
-56.
0 1
1.1
8.1
7
.3
0.8
0
.7
5.5
5
.5
10.
4 1
0.5
9.9
9
.9
KNR
Cons
tructi
onIn
frastr
uctu
re 5
10
14,
344
10,
076
12,
594
1,5
11
1,8
89
1,1
60
1,1
24
41
40
58.
9 -3
.1
12.
4 1
2.8
2.1
1
.8
9.7
7
.8
18.
5 1
5.3
17.
4 1
4.6
NCC
Infra
struc
ture
69
38,
165
79,
658
83,
644
7,1
29
7,7
37
2,1
77
3,0
03
4
5
94.
8 3
7.9
17.
5 1
2.7
1.1
1
.0
7.9
6
.9
6.4
8
.1
10.
0 1
0.4
ITD C
emen
tatio
n In
frastr
uctu
re 1
06
16,
509
36,
304
41,
750
3,0
86
3,9
66
1,0
16
1,5
32
7
10
957
.1
50.
8 1
6.3
10.
8 2
.8
2.2
8
.0
6.4
1
7.2
20.
6 1
4.1
15.
8
Asho
ka B
uild
con
Infra
struc
ture
186
3
4,81
0 2
6,75
8 3
3,20
1 7
,950
1
0,98
9 9
63
1,3
93
5
7
0.3
4
4.5
36.
1 2
5.0
1.8
1
.7
9.6
6
.9
5.0
6
.7
4.5
6
.1
Adan
i Por
ts &
SEZ
Infra
struc
ture
232
4
80,6
68
70,
310
86,
162
47,
201
58,
344
26,
419
36,
357
13
18
14.
0 3
7.6
18.
2 1
3.2
3.6
2
.9
13.
8 1
1.0
20.
1 2
2.0
12.
0 1
3.7
IRB
Infra
struc
ture
Infra
struc
ture
234
8
2,18
7 4
9,10
4 5
5,49
2 2
6,35
5 3
1,49
5 5
,904
6
,378
1
7 1
8 2
.8
8.0
1
3.9
12.
9 1
.6
1.3
8
.3
7.5
1
1.2
10.
1 3
.2
3.5
Min
dtre
e Lt
dIT
Serv
ices
654
1
09,6
99
46,
226
54,
618
8,5
91
10,
911
6,3
16
7,8
72
75
94
17.
5 2
4.6
8.7
7
.0
2.2
1
.8
12.
4 9
.3
25.
6 2
5.7
27.
7 2
8.1
Wip
roIT
Serv
ices
537
1
,325
,738
5
05,3
32
536
,194
1
11,0
17
110
,651
9
0,56
2 9
4,87
6 3
7 3
9 4
.9
4.8
1
4.6
13.
9 2
.8
2.5
1
0.8
10.
4 1
9.4
18.
0 1
9.6
18.
1
NIIT
Tech
nolo
gies
IT Se
rvice
s 4
74
28,
987
26,
810
29,
197
4,7
49
5,0
10
2,7
88
3,0
10
46
50
144
.6
8.0
1
0.3
9.5
1
.8
1.6
5
.9
5.0
1
7.7
16.
7 1
7.9
16.
3
Info
sys T
echn
olog
ies
IT Se
rvice
s 1
,148
2
,645
,387
6
17,7
81
685
,081
1
70,1
27
191
,592
1
35,4
86
152
,489
5
9 6
7 9
.9
12.
5 1
9.4
17.
2 4
.6
4.1
1
3.4
11.
6 2
3.9
23.
9 2
4.3
25.
3
Tata
Con
sulta
ncy
IT Se
rvice
s 2
,338
4
,605
,875
1
,078
,943
1
,179
,978
3
05,5
86
321
,833
2
42,2
75
262
,189
1
23
133
2
3.0
8.2
1
8.9
17.
5 6
.7
5.6
1
4.9
14.
1 3
5.6
31.
9 3
7.2
33.
9
HCL T
echn
olog
ies
IT Se
rvice
s 8
13
1,1
46,0
80
424
,181
4
71,3
06
93,
035
104
,790
7
3,38
8 8
4,23
3 5
2 6
0 1
.0
14.
8 1
5.6
13.
6 4
.0
3.4
1
2.3
10.
8 2
5.6
25.
2 2
6.0
26.
1
Pers
isten
t Sys
tem
sIT
Serv
ices
607
4
8,59
6 2
2,28
2 2
4,55
6 4
,210
4
,605
2
,939
3
,350
3
7 4
2 1
.1
14.
0 1
6.5
14.
5 3
.0
2.6
1
1.3
10.
1 1
8.0
17.
7 1
7.2
17.
2
KPIT
Tech
nolo
gies
IT Se
rvice
s 1
43
28,
331
31,
923
33,
475
4,2
41
4,5
03
2,7
00
2,8
22
14
15
12.
1 4
.5
10.
2 9
.7
1.8
1
.5
6.7
5
.9
17.
3 1
5.5
15.
8 1
5.2
Tech
Mah
indr
aIT
Serv
ices
469
4
53,5
08
264
,235
2
87,4
52
42,
012
47,
890
28,
296
31,
128
29
32
5.9
1
0.0
15.
9 1
4.5
2.9
2
.5
10.
2 8
.5
18.
1 1
7.3
18.
7 1
7.9
Zee
Ente
rtain
men
tM
edia
396
3
80,4
34
59,
367
69,
706
15,
545
20,
346
9,9
85
13,
143
10
14
2.1
3
1.6
38.
1 2
8.9
7.0
6
.3
23.
6 1
7.7
18.
4 2
1.7
20.
8 2
3.5
DB C
orp
Limite
dM
edia
311
5
7,15
2 2
0,86
5 2
3,65
3 5
,978
7
,183
3
,378
4
,408
1
8 2
4 6
.8
30.
5 1
6.9
13.
0 3
.9
3.4
9
.4
7.5
2
3.3
26.
6 2
0.6
24.
0
Phill
ipC
apita
l Ind
ia C
over
age
Uni
vers
e: V
alua
tio
n Su
mm
ary

41GROUND VIEW GROUND VIEW 1 - 31 March 2016 1 - 31 March 2016 40
CMP
Mkt
Cap
Ne
t Sal
es (R
s mn)
EB
IDTA
(Rs
mn)
PAT (
Rs m
n)EP
S (R
s)
EPS
Grow
th (%
) P
/E (x
) P
/B (x
) EV
/EBI
TDA
(x)
ROE
(%)
ROCE
(%)
Nam
e of
com
pany
Sect
orRs
Rs m
nFY
16E
FY17
EFY
16E
FY17
EFY
16E
FY17
EFY
16E
FY17
EFY
16E
FY17
EFY
16E
FY17
EFY
16E
FY17
EFY
16E
FY17
EFY
16E
FY17
EFY
16E
FY17
E
Jagr
an P
raka
shan
Med
ia 1
49
48,
710
20,
941
23,
558
5,9
91
6,9
60
3,2
42
4,1
09
10
13
41.
1 2
6.7
14.
6 1
1.5
2.9
2
.4
8.4
6
.7
19.
8 2
1.2
16.
3 1
6.1
HT M
edia
Med
ia 8
1 1
8,84
1 2
4,89
8 2
7,36
3 3
,077
4
,074
1
,692
2
,431
7
1
0 -5
.9
43.
7 1
1.1
7.8
0
.9
0.8
7
.2
4.7
7
.8
9.9
9
.0
11.
0
Dish
TVM
edia
81
85,
959
30,
925
35,
240
9,8
89
11,
321
2,4
14
3,9
04
2
4
n.a
. 6
1.8
35.
6 2
2.0
-119
.3
27.
0 9
.6
8.1
-3
35.1
1
22.6
6
71.4
8
7.1
Hind
usta
n M
edia
Vent
Med
ia 2
57
18,
826
9,1
19
10,
193
2,1
79
2,6
05
1,7
47
2,0
80
24
28
24.
2 1
9.1
10.
8 9
.0
2.1
1
.7
8.3
6
.2
19.
3 1
8.9
22.
0 2
1.4
Eros
Inte
rnat
iona
lM
edia
161
1
5,02
5 1
8,24
7 2
0,03
5 4
,447
5
,265
3
,190
3
,694
3
4 4
0 2
9.1
15.
8 4
.7
4.0
0
.8
0.7
4
.1
3.3
1
7.8
17.
3 1
3.9
14.
0
NALC
O M
etal
s 3
9 1
01,0
28
64,
688
67,
074
7,9
87
8,3
34
6,7
75
7,1
50
3
3
-67.
1 5
.5
14.
9 1
4.1
0.8
0
.8
6.3
7
.1
5.2
5
.5
4.7
4
.9
SAIL
Met
als
42
175
,116
3
72,3
49
439
,027
-2
2,09
8 1
9,29
4 -3
1,36
4 -1
3,84
6 -8
-3
-2
43.8
-5
5.9
-5.6
-1
2.6
0.4
0
.4
-22.
1 2
6.6
-7.8
-3
.6
-2.3
0
.1
Tata
Ste
elM
etal
s 2
95
286
,606
1
,236
,774
1
,324
,421
6
4,73
6 1
43,8
92
3,1
50
32,
223
3
33
n.a
. 9
22.9
9
1.0
8.9
1
.0
0.9
1
6.1
7.0
1
.0
10.
0 1
.9
4.6
Veda
nta L
tdM
etal
s 8
8 2
61,1
90
626
,550
6
92,8
21
156
,308
1
76,3
09
30,
793
45,
927
8
12
-62.
1 4
9.1
10.
6 7
.1
0.5
0
.5
6.6
5
.9
4.7
6
.8
5.3
5
.8
JSW
Ste
elM
etal
s 1
,185
2
86,4
04
428
,642
5
44,9
23
62,
073
116
,228
9
30
34,
716
4
144
-9
5.0
n.a
. 3
07.9
8
.2
1.4
1
.2
11.
2 5
.7
0.5
1
4.9
-0.1
8
.1
Hind
usta
n Zi
ncM
etal
s 1
72
726
,332
1
38,5
71
137
,004
6
6,40
3 6
3,99
8 7
4,82
9 7
1,70
5 1
8 1
7 -8
.5
-4.2
9
.7
10.
1 1
.5
1.4
5
.7
5.4
1
5.7
13.
9 1
5.1
13.
3
Jinda
l Ste
el &
Pow
erM
etal
s 6
1 5
5,35
2 2
05,6
64
230
,731
4
1,47
7 5
1,15
9 -1
8,14
8 -1
0,75
7 -2
0 -1
2 -3
86.5
-4
0.7
-3.0
-5
.1
0.3
0
.3
11.
1 8
.7
-8.6
-5
.4
3.2
1
.3
Hind
alco
Inds
Met
als
85
174
,801
1
,004
,752
1
,055
,956
8
6,30
1 1
06,3
40
-4,3
99
8,0
81
-2
4
-115
.7
-283
.7
-39.
7 2
1.6
0.5
0
.5
9.0
7
.0
-1.2
2
.1
2.3
3
.4
Indr
apra
stha G
asOi
l & G
as 5
18
72,
499
37,
007
32,
238
7,7
97
7,9
71
4,2
41
4,4
63
31
32
-0.3
2
.3
16.
6 1
6.2
3.0
2
.6
9.2
8
.8
18.
0 1
6.2
14.
9 1
4.1
Petro
net L
NGOi
l & G
as 2
49
186
,450
2
81,1
50
272
,419
1
7,25
0 2
0,99
3 1
0,77
7 1
0,91
9 1
4 1
5 2
2.1
1.3
1
7.3
17.
1 2
.9
2.6
1
1.8
9.7
1
6.9
15.
2 1
0.0
10.
2
Guja
rat S
tate
Pet
rone
tOi
l & G
as 1
25
70,
446
10,
252
12,
500
8,8
66
11,
003
4,5
25
6,0
87
8
11
10.
3 3
4.5
15.
6 1
1.6
1.8
1
.6
8.4
6
.4
11.
4 1
3.6
9.2
1
1.2
GUJA
RAT G
AS LT
DOi
l & G
as 5
03
69,
183
59,
933
55,
787
7,3
01
9,7
79
1,6
86
3,9
66
12
29
-62.
1 1
35.2
4
1.0
17.
4 3
.3
2.9
1
2.4
9.3
8
.1
16.
6 5
.6
9.3
Cadi
la H
ealth
care
Phar
ma
345
3
53,2
42
95,
789
103
,242
2
2,74
7 2
4,13
9 1
4,72
3 1
6,50
9 1
4 1
6 2
4.8
12.
1 2
4.0
21.
4 6
.4
5.1
1
6.1
15.
0 2
6.9
24.
0 1
9.4
19.
5
Sun
Phar
ma
Phar
ma
852
2
,050
,482
2
83,1
81
337
,829
8
5,15
3 1
20,6
53
52,
444
80,
656
22
34
9.8
5
3.8
39.
1 2
5.4
6.9
5
.6
23.
4 1
6.0
17.
7 2
1.8
14.
5 1
8.6
Dr R
eddy
's La
bs.
Phar
ma
3,2
18
548
,775
1
57,4
09
167
,520
4
1,55
6 4
4,72
8 2
5,29
6 2
8,73
8 1
48
169
1
0.9
13.
6 2
1.7
19.
1 4
.1
3.4
1
3.6
12.
3 1
8.8
18.
1 1
3.1
13.
0
Auro
bind
o Ph
arm
aPh
arm
a 7
27
424
,988
1
40,0
96
158
,073
3
2,41
8 3
8,57
0 2
0,30
5 2
4,21
9 3
5 4
2 2
3.6
19.
3 2
0.8
17.
5 5
.9
4.5
1
4.4
11.
8 2
8.3
25.
7 2
5.4
26.
7
Cipl
a Ltd
Ph
arm
a 5
32
427
,395
1
4,11
8 1
7,89
6 2
,958
3
,454
1
,835
2
,040
2
3 2
5 4
4.2
11.
2 2
3.3
20.
9 3
.4
2.9
1
44.9
1
24.2
1
5.0
14.
5 -
-
Ipca
Labo
rato
ries
Phar
ma
544
6
8,63
7 2
8,66
3 3
7,89
6 4
,152
8
,079
1
,731
4
,786
1
4 3
8 -3
5.3
176
.5
39.
4 1
4.2
2.9
2
.4
18.
0 9
.3
7.3
1
7.2
5.5
1
3.0
Divi'
s Lab
orat
orie
sPh
arm
a 1
,001
2
65,8
40
35,
701
41,
757
13,
584
16,
076
10,
086
11,
935
38
45
17.
0 1
8.3
26.
4 2
2.3
6.4
5
.3
19.
6 1
6.5
24.
1 2
3.6
- -
Glen
mar
k Pha
rma
Phar
ma
830
2
34,1
91
73,
190
86,
822
16,
473
20,
148
8,5
55
11,
638
30
41
10.
3 3
6.0
27.
4 2
0.1
4.9
4
.0
15.
1 1
2.1
18.
1 2
0.0
12.
8 1
4.7
Lupi
nPh
arm
a 1
,776
8
00,1
47
130
,195
1
63,0
81
33,
541
46,
025
21,
128
29,
307
47
65
-12.
1 3
8.7
37.
8 2
7.2
7.5
6
.1
23.
6 1
6.8
19.
9 2
2.3
19.
9 -
Phill
ipC
apita
l Ind
ia C
over
age
Uni
vers
e: V
alua
tio
n Su
mm
ary

41GROUND VIEW GROUND VIEW 1 - 31 March 2016 1 - 31 March 2016 40
CMP
Mkt
Cap
Ne
t Sal
es (R
s mn)
EB
IDTA
(Rs
mn)
PAT (
Rs m
n)EP
S (R
s)
EPS
Grow
th (%
) P
/E (x
) P
/B (x
) EV
/EBI
TDA
(x)
ROE
(%)
ROCE
(%)
Nam
e of
com
pany
Sect
orRs
Rs m
nFY
16E
FY17
EFY
16E
FY17
EFY
16E
FY17
EFY
16E
FY17
EFY
16E
FY17
EFY
16E
FY17
EFY
16E
FY17
EFY
16E
FY17
EFY
16E
FY17
EFY
16E
FY17
E
Bioc
onPh
arm
a 4
83
96,
540
33,
578
38,
674
7,8
94
9,6
09
4,5
37
5,5
36
23
28
10.
1 2
2.0
21.
3 1
7.4
2.4
2
.2
11.
4 9
.2
11.
4 1
2.6
11.
0 -
Titan
Com
pany
Reta
il 3
43
304
,688
1
19,0
74
140
,492
1
1,17
2 1
3,27
6 7
,991
9
,735
9
1
1 -2
.1
21.
8 3
8.1
31.
3 8
.4
6.9
2
6.2
21.
0 2
3.6
24.
3 2
4.6
25.
3
Bhar
ti Ai
rtel
Tele
com
340
1
,359
,716
9
82,6
24
1,0
65,7
03
326
,641
3
54,8
85
51,
089
64,
256
13
16
-14.
6 2
5.8
26.
6 2
1.2
1.9
1
.6
7.8
6
.8
7.0
7
.4
5.1
5
.0
Idea
Cel
lula
rTe
leco
m 1
01
362
,747
3
57,9
74
390
,485
1
29,3
95
137
,572
3
4,96
9 1
7,12
6 1
0 5
9
.5
-51.
0 1
0.4
21.
1 1
.4
1.3
6
.5
5.9
1
3.2
6.1
7
.0
4.5
Tata
Com
mun
icatio
nsTe
leco
m 3
64
103
,612
2
10,5
30
223
,195
3
3,28
5 3
6,08
7 1
,714
2
,674
6
9
6
0.9
56.
0 6
0.5
38.
7 1
7.1
15.
0 5
.1
4.5
2
8.3
38.
8 4
.9
5.6
Bhar
ti In
frate
lTe
leco
m 3
74
710
,112
7
8,66
9 8
5,45
7 5
3,62
4 5
9,58
8 2
2,19
9 2
6,22
6 1
2 1
4 1
1.5
18.
1 3
1.9
27.
0 4
.4
4.5
1
3.3
11.
9 1
3.7
16.
8 1
0.4
11.
9
Relia
nce
Com
mTe
leco
m 5
2 1
30,0
49
234
,448
n
.a.
82,
810
n.a
. 1
4,14
3 n
.a.
7
n.a
. 4
7.7
n.a
. 7
.6
n.a
. 0
.4
n.a
. 5
.2
n.a
. 4
.8
- 4
.2
-
Coal
Indi
aUt
ilitie
s 2
98
1,8
80,3
82
773
,545
8
80,0
21
163
,466
1
98,2
41
145
,174
1
66,5
90
23
26
5.8
1
4.8
13.
0 1
1.3
4.1
3
.5
8.2
6
.3
31.
4 3
1.4
33.
2 3
3.2
PTC
Indi
aUt
ilitie
s 6
3 1
8,63
4 1
37,0
14
181
,612
1
0,80
2 1
3,07
9 3
,126
3
,371
1
1 1
1 -1
2.1
7.8
5
.9
5.5
0
.6
0.5
7
.5
7.0
9
.5
9.6
9
.8
7.7
Powe
r Grid
Cor
pUt
ilitie
s 1
39
726
,668
2
07,9
59
253
,694
1
83,3
27
225
,368
6
2,88
8 7
5,35
9 1
2 1
4 2
5.1
19.
8 1
1.6
9.6
1
.7
1.5
9
.7
8.3
1
5.5
16.
5 6
.2
6.7
NTPC
Utili
ties
127
1
,046
,349
7
25,0
44
798
,674
1
77,7
72
198
,808
8
5,71
1 9
7,72
9 1
0 1
2 2
.0
14.
0 1
2.2
10.
7 1
.2
1.1
1
0.2
10.
0 9
.8
10.
4 6
.1
6.2
Have
lls In
dia L
tdM
idca
p 2
94
183
,816
5
2,98
6 6
2,97
5 7
,110
8
,470
3
,547
6
,023
6
1
0 -2
3.7
69.
8 5
1.8
30.
5 6
.9
6.4
2
3.8
19.
7 1
3.4
21.
0 1
2.3
19.
1
Finol
ex C
able
s Ltd
Mid
cap
232
3
5,55
1 2
4,02
9 2
8,03
1 3
,112
3
,802
2
,168
2
,564
1
4 1
7 2
3.1
18.
3 1
6.4
13.
9 n
.a.
n.a
. 1
0.7
8.3
1
5.0
15.
6 1
5.2
15.
7
VGua
rd In
dustr
ies L
tdM
idca
p 8
42
25,
318
19,
436
23,
087
1,5
35
1,9
21
902
1
,142
3
0 3
8 2
7.5
26.
6 2
8.0
22.
1 n
.a.
n.a
. 1
6.6
13.
0 2
0.0
20.
9 1
8.9
20.
7
Baja
j Ele
ctrica
ls Lt
dM
idca
p 1
95
19,
705
47,
064
52,
624
2,6
41
3,1
66
906
1
,242
9
1
2 -7
49.0
3
7.1
21.
7 1
5.8
n.a
. n
.a.
10.
3 8
.6
11.
9 1
4.3
10.
0 1
1.4
Allca
rgo
Logi
stics
Mid
cap
159
4
0,07
1 6
3,63
4 7
2,95
3 5
,762
7
,150
2
,966
3
,772
1
2 1
5 2
3.7
27.
2 1
3.5
10.
6 1
.9
1.6
7
.4
5.5
1
3.8
15.
4 1
1.8
13.
5
VRL L
ogist
ics Lt
d M
idca
p 3
68
33,
582
17,
215
19,
077
2,8
51
3,2
48
1,1
66
1,4
54
13
16
33.
1 2
4.8
28.
8 2
3.1
n.a
. n
.a.
12.
7 1
0.9
21.
7 2
3.8
15.
1 1
7.6
Cont
aine
r Cor
p Of
Indi
aM
idca
p 1
,148
2
23,8
40
57,
711
67,
724
12,
015
14,
912
8,8
56
10,
859
45
56
-15.
5 2
2.6
25.
3 2
0.6
2.7
2
.4
16.
6 1
3.3
10.
5 1
1.8
10.
4 1
1.7
Sint
ex In
dustr
ies
Mid
cap
71
31,
839
79,
036
101
,178
1
3,53
1 1
7,82
4 6
,156
8
,252
1
4 1
9 1
1.8
34.
1 5
.2
3.9
n
.a.
n.a
. 6
.3
4.8
1
1.7
13.
7 7
.3
8.7
KDDL
Mid
cap
192
1
,934
4
,924
6
,148
4
77
641
1
12
193
1
1 1
9 6
4.0
72.
9 1
7.3
10.
0 n
.a.
n.a
. 6
.7
5.2
1
9.0
26.
6 9
.9
12.
3
Penn
ar In
ds.
Mid
cap
44
5,2
95
15,
098
19,
470
1,5
93
2,2
35
517
8
35
4
7
44.
0 6
1.6
10.
2 6
.3
1.1
1
.0
3.9
2
.8
11.
0 1
5.6
15.
7 1
9.1
Praj
Inds
.M
idca
p 8
4 1
4,90
3 1
0,83
3 1
3,92
0 1
,128
1
,803
6
96
1,1
50
4
6
52.
5 6
5.1
21.
3 1
2.9
2.3
2
.1
12.
2 7
.3
10.
8 1
6.5
8.9
1
3.9
The
Byke
Hos
pita
lity
Mid
cap
155
6
,231
2
,137
2
,761
4
49
580
2
41
329
6
8
2
0.3
36.
7 2
5.9
18.
9 #N
/A#N
/A 1
3.8
10.
5 2
0.6
23.
0 1
9.3
22.
5
Note
: For
ban
ks, E
BITD
A is
pre-
prov
ision
pro
fit
Phill
ipC
apita
l Ind
ia C
over
age
Uni
vers
e: V
alua
tio
n Su
mm
ary

43GROUND VIEW GROUND VIEW 1 - 31 March 2016 1 - 31 March 2016 42
“”

43GROUND VIEW GROUND VIEW 1 - 31 March 2016 1 - 31 March 2016 42
Disclosures and Disclaimers
PhillipCapital (India) Pvt. Ltd. has three independent equity research groups: Institutional Equities, Institutional Equity Derivatives and Private Client Group. This report has been prepared by Institutional Equities Group. The views and opinions expressed in this document may or may not match or may be contrary at times with the views, estimates, rating, target price of the other equity research groups of PhillipCapital (India) Pvt. Ltd.
This report is issued by PhillipCapital (India) Pvt. Ltd. which is regulated by SEBI. PhillipCapital (India) Pvt. Ltd. is a subsidiary of Phillip (Mauritius) Pvt. Ltd. References to "PCIPL" in this report shall mean PhillipCapital (India) Pvt. Ltd unless otherwise stated. This report is prepared and distributed by PCIPL for information purposes only and neither the information contained herein nor any opinion expressed should be construed or deemed to be construed as solicitation or as offering advice for the purposes of the purchase or sale of any security, investment or derivatives. The information and opinions contained in the Report were considered by PCIPL to be valid when published. The report also contains information provided to PCIPL by third parties. The source of such information will usually be disclosed in the report. Whilst PCIPL has taken all reasonable steps to ensure that this information is correct, PCIPL does not offer any warranty as to the accuracy or complete-ness of such information. Any person placing reliance on the report to undertake trading does so entirely at his or her own risk and PCIPL does not accept any liability as a result. Securities and Derivatives markets may be subject to rapid and unexpected price movements and past performance is not necessarily an indication to future performance.
This report does not have regard to the specific investment objec-tives, financial situation and the particular needs of any specific person who may receive this report. Investors must undertake independent analysis with their own legal, tax and financial advisors and reach their own regarding the appropriateness of investing in any securities or investment strategies discussed or recommended in this report and should understand that statements regarding future prospects may not be realized. In no circumstances it be used or considered as an offer to sell or a solicitation of any offer to buy or sell the Securities mentioned in it. The information contained in the research reports may have been taken from trade and statistical services and other sources, which we believe are reliable. PhillipCapital (India) Pvt. Ltd. or any of its group/associate/affiliate companies do not guarantee that such information is accurate or complete and it should not be relied upon as such. Any opinions expressed reflect judgments at this date and are subject to change without notice
Important: These disclosures and disclaimers must be read in conjunction with the research report of which it forms part. Receipt and use of the research report is subject to all aspects of these disclosures and disclaimers. Additional information about the issuers and securities discussed in this research report is available on request.
Certifications: The research analyst(s) who prepared this research report hereby certifies that the views expressed in this research report accurately reflect the research analyst’s personal views about all of the subject issuers and/or securities, that the analyst have no known conflict of interest and no part of the research analyst’s compensation was, is or will be, directly or indirectly, related to the specific views or recommen-dations contained in this research report. The Research Analyst certifies that he /she or his / her family members does not own the stock(s) covered in this research report.
Independence: PhillipCapital (India) Pvt. Ltd. has not had an investment banking relationship with, and has not received any compensation for investment banking services from, the subject issuers in the past twelve (12) months, and PhillipCapital (India) Pvt. Ltd does not anticipate receiving or intend to seek compensation for investment banking services from the subject issuers in the next three (3) months.
PhillipCapital (India) Pvt. Ltd is not a market maker in the securities mentioned in this research report, although it or its affiliates may hold either long or short positions in such securities. PhillipCapital (India) Pvt. Ltd does not hold more than 1% of the shares of the company(ies) covered in this report.
Suitability and Risks: This research report is for informational purposes only and is not tailored to the specific investment objectives, financial situation or particular requirements of any individual recipient hereof. Certain securities may give rise to substantial risks and may not be suitable for certain investors. Each investor must make its own deter-mination as to the appropriateness of any securities referred to in this research report based upon the legal, tax and accounting considerations applicable to such investor and its own investment objectives or strate-gy, its financial situation and its investing experience. The value of any security may be positively or adversely affected by changes in foreign exchange or interest rates, as well as by other financial, economic or political factors. Past performance is not necessarily indicative of future performance or results.
Sources, Completeness and Accuracy: The material herein is based upon information obtained from sources that PCIPL and the research analyst believe to be reliable, but neither PCIPL nor the research analyst represents or guarantees that the information contained herein is accurate or complete and it should not be relied upon as such. Opinions expressed herein are current opinions as of the date appearing on this material and are subject to change without notice. Furthermore, PCIPL is under no obligation to update or keep the information current.
Copyright: The copyright in this research report belongs exclusively to PCIPL. All rights are reserved. Any unauthorized use or disclosure is prohibited. No reprinting or reproduction, in whole or in part, is permit-ted without the PCIPL’s prior consent, except that a recipient may reprint it for internal circulation only and only if it is reprinted in its entirety.
Caution: Risk of loss in trading in can be substantial. You should carefully consider whether trading is appropriate for you in light of your experience, objectives, financial resources and other relevant circumstances.
For U.S. persons only: This research report is a product of Phillip-Capital (India) Pvt Ltd. which is the employer of the research analyst(s) who has prepared the research report. The research analyst(s) preparing the research report is/are resident outside the United States (U.S.) and are not associated persons of any U.S. regulated broker-dealer and therefore the analyst(s) is/are not subject to supervision by a U.S. broker-dealer, and is/are not required to satisfy the regulatory licensing requirements of FINRA or required to otherwise comply with U.S. rules or regulations regarding, among other things, communications with a subject company, public appearances and trading securities held by a research analyst account.
This report is intended for distribution by PhillipCapital (India) Pvt Ltd. only to "Major Institutional Investors" as defined by Rule 15a-6(b)(4) of the U.S. Securities andExchange Act, 1934 (the Exchange Act) and interpretations thereof by U.S. Securities and Exchange Commission (SEC) in reliance on Rule 15a 6(a)(2). If the recipient of this report is not a Major Institutional Investor as specified above, then it should not act upon this report and return the same to the sender. Further, this report may not be copied, duplicated and/or transmitted onward to any U.S. person, which is not the Major Institutional Investor.
In reliance on the exemption from registration provided by Rule 15a-6 of the Exchange Act and interpretations thereof by the SEC in order to conduct certain business with Major Institutional Investors, PhillipCapi-tal (India) Pvt Ltd. has entered into an agreement with a U.S. registered broker-dealer, Marco Polo Securities Inc. ("Marco Polo").Transactions in securities discussed in this research report should be effected through Marco Polo or another U.S. registered broker dealer
“”

PBGROUND VIEW GROUND VIEW 1 - 31 March 2016 1 - 31 March 2016 44


