33
Phaedra Corso, Ph.D. Associate Professor College of Public Health University of Georgia Program Evaluation from an Economic Perspective
| Date post: | 31-Dec-2015 |
| Category: |
Documents |
| Upload: | brittany-king |
| View: | 217 times |
| Download: | 1 times |

Phaedra Corso, Ph.D.
Associate ProfessorCollege of Public Health
University of Georgia
Program Evaluation from an Economic Perspective

Why Care About Why Care About Economics in the Economics in the
Context of Prevention?Context of Prevention? Maximizing outcomes is important.Maximizing outcomes is important.
Minimizing costs is important too.Minimizing costs is important too.
Resources are Resources are limitedlimited, so hard , so hard (resource allocation) decisions (resource allocation) decisions must be made.must be made.
Demonstrates the value provided Demonstrates the value provided from the resources expended from the resources expended (return on investment).(return on investment).

The PH Model for The PH Model for Prevention – Prevention – Economics?Economics?
Problem Identification
Program and Policy
Evaluation
Risk and Protective Factor
Identification
Implementation and
Dissemination
Program and Policy
Development
EconomicEvaluation
EconomicImpact - COI

EE MethodsEE Methods Partial evaluation – costs onlyPartial evaluation – costs only
Cost of illness (COI) analysisCost of illness (COI) analysis Cost analysis (program costs)Cost analysis (program costs)
Full evaluation – costs and outcomesFull evaluation – costs and outcomes Cost-benefit analysis (CBA)Cost-benefit analysis (CBA)
Cost-utility analysis (CUA)Cost-utility analysis (CUA)
Cost-effectiveness analysis (CEA)Cost-effectiveness analysis (CEA)

COI AnalysisCOI Analysis
Estimates total costs incurred because of a Estimates total costs incurred because of a disease or condition disease or condition (i.e., medical costs, non-medical costs, productivity (i.e., medical costs, non-medical costs, productivity
losses)losses)
Generally reported as Generally reported as annual total cost annual total cost average per person lifetime costaverage per person lifetime cost
Used to show potential benefits of prevention Used to show potential benefits of prevention effortsefforts

Costs of Violence Costs of Violence in the United in the United
StatesStates
Corso et al., Corso et al., AJPMAJPM 2007 2007

Cost ParametersCost Parameters Direct costsDirect costs
Medical careMedical care ED visitsED visits HospitalizationsHospitalizations Ambulance/paramedicAmbulance/paramedic MD visitsMD visits DentalDental Physical Therapy Physical Therapy Prescription DrugsPrescription Drugs Mental health careMental health care
Productivity lossesProductivity losses Work lossesWork losses Household productivity lossesHousehold productivity losses

IncidenceIncidence ~2.2. million medically-treated injuries ~2.2. million medically-treated injuries
associated with violence occurred in associated with violence occurred in 20002000
~17,000 homicides, ~30,000 suicides~17,000 homicides, ~30,000 suicides
People aged 15 to 44 years comprise 44 People aged 15 to 44 years comprise 44 percent of the population, but account percent of the population, but account for nearly 75 percent of violent injuries for nearly 75 percent of violent injuries

CostsCosts The total cost associated with nonfatal injuries and The total cost associated with nonfatal injuries and
deaths due to violence in 2000 was more than $70 deaths due to violence in 2000 was more than $70 billion.billion. $37 billion for interpersonal violence$37 billion for interpersonal violence $33 billion for self-inflicted violence$33 billion for self-inflicted violence
The average cost per homicide was $1.3 million in The average cost per homicide was $1.3 million in lost productivity and $4,906 in medical costs.lost productivity and $4,906 in medical costs.
The average cost per case for a non-fatal assault The average cost per case for a non-fatal assault resulting in hospitalization was $57,209 in lost resulting in hospitalization was $57,209 in lost productivity and $24,353 in medical costs.productivity and $24,353 in medical costs.
The average cost per case of suicide is $1 million The average cost per case of suicide is $1 million lost productivity and $2,596 in medical costs. lost productivity and $2,596 in medical costs.
The average cost for a non-fatal self inflicted injury The average cost for a non-fatal self inflicted injury was $9,726 in lost productivity and $7,234 in was $9,726 in lost productivity and $7,234 in medical costs.medical costs.
So What?So What? The incidence and economic burden of The incidence and economic burden of
injuries in the US is substantialinjuries in the US is substantial This information can be used to lobby for more This information can be used to lobby for more
prevention resourcesprevention resources
Implementation of effective interventions Implementation of effective interventions could reduce this burdencould reduce this burden
The cost to implement effective interventions The cost to implement effective interventions lessless the economic burden prevented – the economic burden prevented – represents the potential represents the potential returns on returns on investmentinvestment for prevention. for prevention. This is what economic evaluation This is what economic evaluation
is all about!!is all about!!

Cost Analysis (CA)Cost Analysis (CA) Estimates total costs of running a programEstimates total costs of running a program
Costs are the value of the resources (people, building, equipment and supplies) used to produce a good or a serviceCosts are the value of the resources (people, building, equipment and supplies) used to produce a good or a service
Important for realizing costs from varying perspectives Important for realizing costs from varying perspectives e.g., incurred by program, incurred by participante.g., incurred by program, incurred by participant
Includes not just Includes not just financialfinancial, but also , but also economiceconomic costs. costs.
Important for budget justification, decision making, and forecasting.Important for budget justification, decision making, and forecasting.
Also called: cost consequence or cost identification analysisAlso called: cost consequence or cost identification analysis
Provides the first step of a full economic evaluationProvides the first step of a full economic evaluation

Cost AnalysisCost Analysis of a national replication of a national replication
of a of a child maltreatment child maltreatment
programprogram
Corso et al., CDC, OCAN (in Corso et al., CDC, OCAN (in progress)progress)

**Type of Activity ***Activity Description (D) Direct: Client-focused, face-to-face activity a. Advocate
b. Assess c. Counseling/support d. Court representation e. Assist/provide f. Plan g. Refer h. Schedule i. Teach j. Transport
(I) Indirect: Collateral activities on behalf of client systems
a. Advocate b. Clinical documentation c. Research d. Preparation for court e. Testify in court f. Consult/Collaborate g. Locate resources h. Team meeting i. Risk management meeting j. Clinical Interdisciplinary team mtng k. I&R referral
(AC) Administrative-Client: Related to client activities
a. Gives supervision b. Receives supervision c. etc
(AP) Administrative-Program: Related to programmatic/management activities
Etc.
Define Cost CategoriesDefine Cost Categories

Preliminary Results at end Preliminary Results at end of Year 1of Year 1
The average cost per family referral ranged The average cost per family referral ranged from $2,319 to $8,906. from $2,319 to $8,906.
The average cost per family receiving The average cost per family receiving services ranged from $4,238 to $33,742. services ranged from $4,238 to $33,742.
At the end of the first year of implementation, At the end of the first year of implementation, pre-implementation costs as a percentage of pre-implementation costs as a percentage of total costs ranged from 23% to 42% of the total costs ranged from 23% to 42% of the total costs of the program.total costs of the program.
So What?So What? Provides information for Agency X who might Provides information for Agency X who might
want to implement the program in the future.want to implement the program in the future.
Provides the cost component of a full EE.Provides the cost component of a full EE.
Lessons learned on how to conduct a Lessons learned on how to conduct a programmatic CA:programmatic CA: Prospective data collectionProspective data collection Input from site implementersInput from site implementers Technical assistance throughout data Technical assistance throughout data
collectioncollection Revisions of cost collection templates along Revisions of cost collection templates along
the waythe wayReference: Applying Cost Analysis to Public Health Programs (at www.phf.org)

What is Economic What is Economic Evaluation (EE)?Evaluation (EE)?
Applied analytic methods to:Applied analytic methods to:IdentifyIdentify,,MeasureMeasure,,ValueValue,, and andCompareCompare
the costs and consequences of the costs and consequences of treatmenttreatment* and * and preventionprevention** ** strategies.strategies.
* Done a lot** Done “not so much”

Cost-benefit Analysis - Cost-benefit Analysis - CBACBA
A method used to compare costs and A method used to compare costs and benefits of an intervention benefits of an intervention where all the costs and benefits are where all the costs and benefits are
standardized or valued in standardized or valued in monetary termsmonetary terms.. Provides aProvides a list of list of allall costs and benefits costs and benefits
over time:over time:• Can have different time linesCan have different time lines• Can have different amounts at different timesCan have different amounts at different times
Provides a single value:Provides a single value:• Net Benefits: NB (Benefits – Costs)Net Benefits: NB (Benefits – Costs)

When is CBA When is CBA Used?Used?
To decide whether to implement specific programsTo decide whether to implement specific programs If NB > 0, implementIf NB > 0, implement
When choosing among competing optionsWhen choosing among competing options Implement program with highest NBImplement program with highest NB
For setting priorities on options given resource For setting priorities on options given resource constraintsconstraints
Quantify Benefits - Quantify Benefits - CBACBA
Cost-of-Illness (COI) approachCost-of-Illness (COI) approach
Willingness-to-Pay (WTP) or Willingness-to-Pay (WTP) or Contingent-valuation surveysContingent-valuation surveys• (e.g., how much is society (e.g., how much is society willing willing
to payto pay to to reduce the annual reduce the annual morbidity and mortality risk morbidity and mortality risk associated with a disease or associated with a disease or injury)injury)

Corso Survey (Fall 2007, Corso Survey (Fall 2007, Georgia)Georgia)
““Based on national data, Based on national data, 2 out of every 100,000 children 2 out of every 100,000 children annuallyannually, or an average of , or an average of 4 children every day4 children every day are are killed as a result of child maltreatment by parents or killed as a result of child maltreatment by parents or caretakers.”caretakers.”
“Now imagine we had a nationally-sponsored child maltreatment prevention program that was available to your state and this this program was proven to reduce the risk of a child being killed due to child maltreatment by 50%. This means that the number of children killed on average every day in the U.S. by child maltreatment is reduced from 4 per day to 2 per day.”
“If this program were available to your state, would you be willing to pay $150 in extra taxes per year to sponsor this program?”
YES – “Would you be willing to pay $225?”
NO – “Would you be willing to pay $75?”

Cost-utility Analysis - Cost-utility Analysis - CUACUA
A method used to compare costs and benefits of A method used to compare costs and benefits of interventions where benefits are expressed as the interventions where benefits are expressed as the number of life years saved number of life years saved adjustedadjusted to account for to account for loss of quality.loss of quality.
CombinesCombines• Length of life (survival), andLength of life (survival), and• Quality of lifeQuality of life
Compares disparate outcomes in terms of Compares disparate outcomes in terms of utilityutility• Quality-adjusted life years (QALYs)Quality-adjusted life years (QALYs)• Disability-adjusted life years (DALYs)Disability-adjusted life years (DALYs)
Derives a ratio of cost per health outcomeDerives a ratio of cost per health outcome• $/QALY or $/DALY$/QALY or $/DALY
When is CUA Used?When is CUA Used?
When quality of life is When quality of life is thethe important outcome. important outcome. When the program affects both morbidity and When the program affects both morbidity and
mortality.mortality. When the programs being compared have a When the programs being compared have a
wide range of different outcomes.wide range of different outcomes. When the program is being compared with a When the program is being compared with a
program that has already been evaluated using program that has already been evaluated using CUA.CUA.

Quantify Benefits - Quantify Benefits - CUACUA
Utilities are:Utilities are:• A “preference-based” measure A “preference-based” measure
of health, that relies on choice of health, that relies on choice and uncertainty to elicit and uncertainty to elicit preferencespreferences
• Typically based on a 0 (death) Typically based on a 0 (death) to 1 (perfect health) scaleto 1 (perfect health) scale

Example of Tool to Elicit Example of Tool to Elicit Utilities: Time Trade-Off Utilities: Time Trade-Off
(TTO)(TTO)
Quality of Life
Length of Life
Long and dull
Short and fun
Which life do you prefer?

Example: TTOExample: TTO
0
Utility
YearsDead
U(healthy) = 1.0
U (blind both eyes) = ?
2012
blind both eyes
healthy
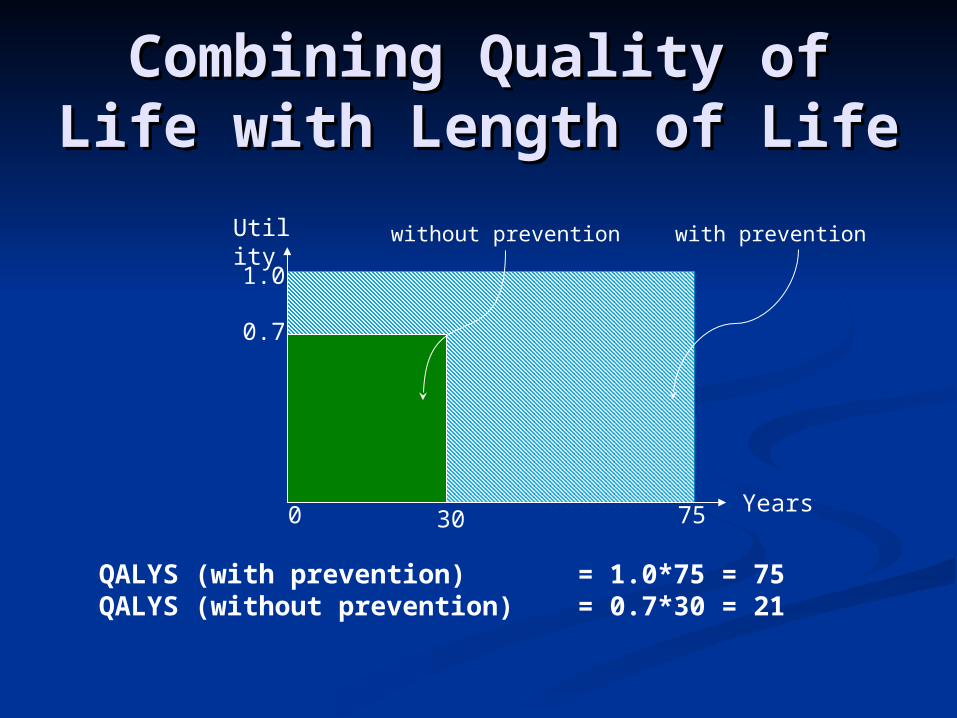
Combining Quality of Combining Quality of Life with Length of LifeLife with Length of Life
0.7
1.0
0 30 75
Utility without prevention with prevention
Years
QALYS (with prevention) = 1.0*75 = 75QALYS (without prevention) = 0.7*30 = 21

Cost-effectiveness Cost-effectiveness AnalysisAnalysis - CEA - CEA Estimates costs and outcomes of interventionsEstimates costs and outcomes of interventions
Expresses outcomes in Expresses outcomes in natural unitsnatural units e.g., cases prevented, lives savede.g., cases prevented, lives saved
Compares results with other interventions affecting Compares results with other interventions affecting the same outcome the same outcome
Summary measure: cost-effectiveness ratioSummary measure: cost-effectiveness ratio Cost per some outcome achievedCost per some outcome achieved e.g., cost per case prevented, cost per life savede.g., cost per case prevented, cost per life saved
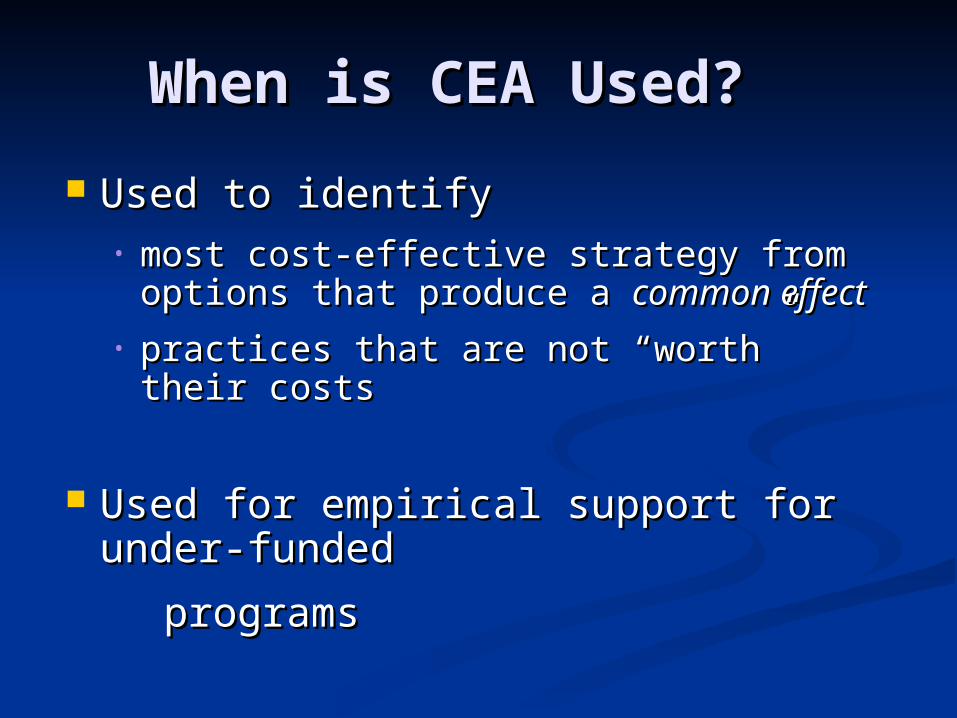
When is CEA Used?When is CEA Used?
Used to identify Used to identify • most cost-effective strategy from most cost-effective strategy from
options that produce a options that produce a common effectcommon effect • practices that are not “worth” their practices that are not “worth” their
costscosts
Used for empirical support for Used for empirical support for under-funded under-funded
programsprograms

Quantify Outcomes – CEA Quantify Outcomes – CEA of parenting interventionof parenting intervention
Intermediate outcomesIntermediate outcomes• Increased child self-esteem and mental health statusIncreased child self-esteem and mental health status• Increased family cohesiveness/coping skillsIncreased family cohesiveness/coping skills• Decreased depression in parentsDecreased depression in parents
Final outcomesFinal outcomes• QOL improvements in parents and childrenQOL improvements in parents and children• Child maltreatment cases preventedChild maltreatment cases prevented• Lives or life years savedLives or life years saved

CEA CaveatCEA Caveat Outcomes cannot be combined, so one or two of the Outcomes cannot be combined, so one or two of the
most important effectiveness measures should be most important effectiveness measures should be considered (separately) for the CEA.considered (separately) for the CEA.
The number of summary measures depends on the The number of summary measures depends on the number of outcomes chosen. number of outcomes chosen. If 2 outcomes, A and B, are considered the most important If 2 outcomes, A and B, are considered the most important
for evaluation, thenfor evaluation, then Cost/outcome ACost/outcome A Cost/outcome BCost/outcome B
This makes translation for policy makers difficult!!This makes translation for policy makers difficult!!
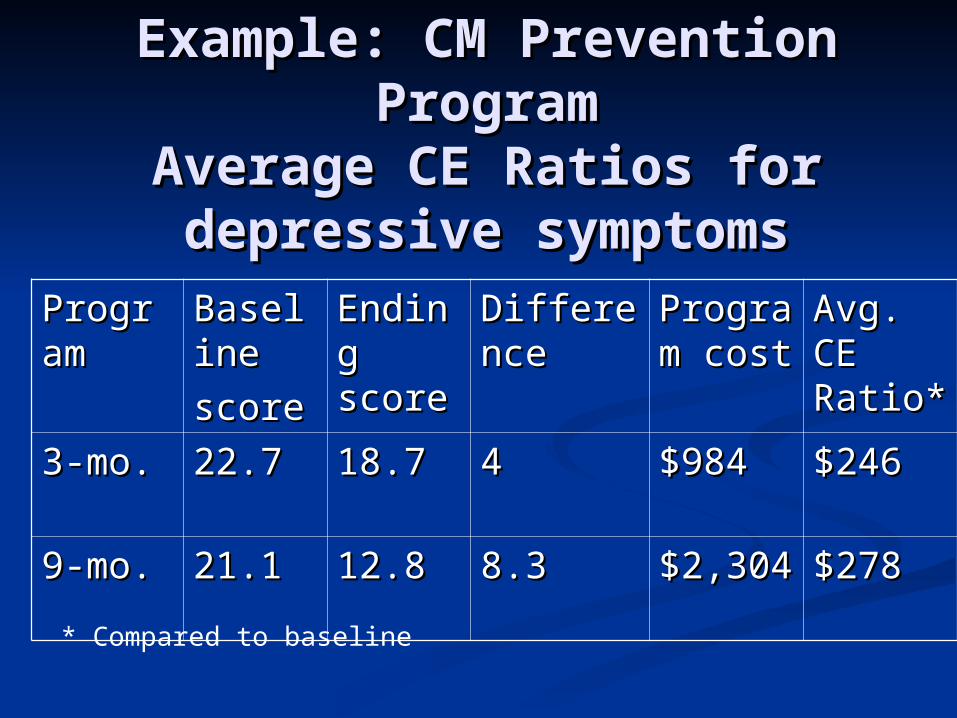
Example: CM Prevention Example: CM Prevention ProgramProgram
Average CE Ratios for Average CE Ratios for depressive symptomsdepressive symptoms
* Compared to baseline
PrograProgramm
BaseliBaselinene
scorescore
EndinEnding g scorescore
DifferenDifferencece
PrograProgram costm cost
Avg. Avg. CE CE Ratio*Ratio*
3-mo.3-mo. 22.722.7 18.718.7 44 $984$984 $246$246
9-mo.9-mo. 21.121.1 12.812.8 8.38.3 $2,304$2,304 $278$278

Final CommentsFinal Comments Economic evaluation (EE) is valuable to Economic evaluation (EE) is valuable to
decision making and for setting health policy.decision making and for setting health policy.
For new researchers in PH, this is an For new researchers in PH, this is an
important specialization to consider – because important specialization to consider – because
the demand for these skills is growing.the demand for these skills is growing.

Coming soon…..
Center for Economic Evaluation
Institute for Behavioral Research and
College of Public Health


