24
Pharmaceutical Case Competition 2007 Paul Di Capua, MD, MBA candidate Robert Stavert, MD, MBA candidate Adrian Garcia, MBA candidate November 30, 2007
| Date post: | 15-Jan-2016 |
| Category: |
Documents |
| View: | 218 times |
| Download: | 2 times |

Pharmaceutical Case Competition 2007
Paul Di Capua, MD, MBA candidateRobert Stavert, MD, MBA candidate
Adrian Garcia, MBA candidate
November 30, 2007

1. Sucessful biotech with proven track record
2. Growth of MS market3. Potential synergies4. So competition doesn’t acquire Biogen

“When we look back, this will seem a very expensive time.” – Tony Robinson, Head of Business Development and Licensing at Novartis
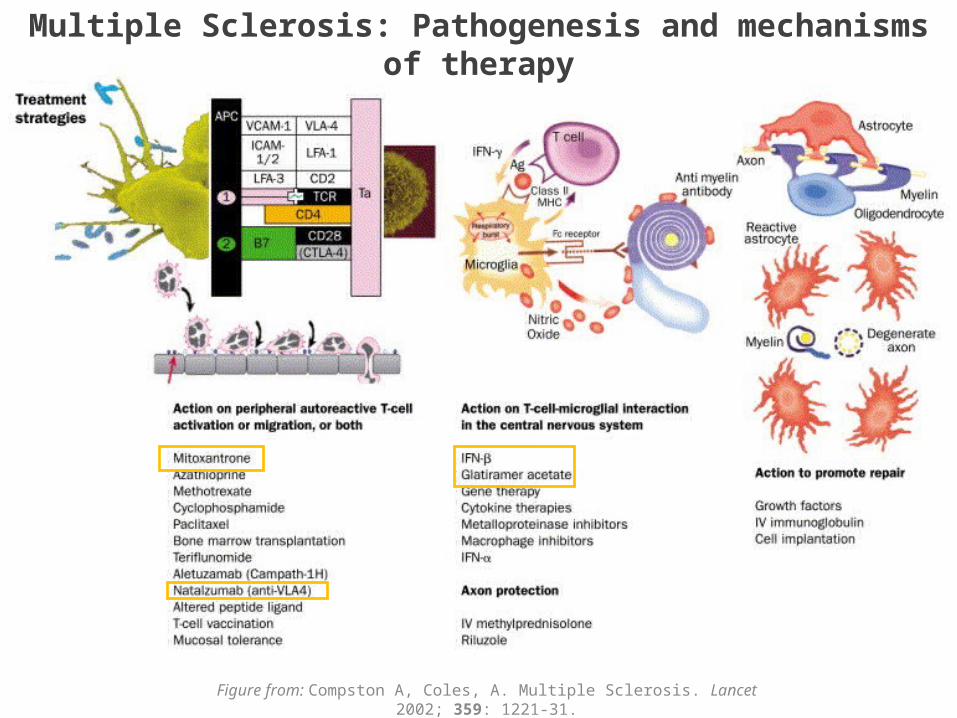
Figure from: Compston A, Coles, A. Multiple Sclerosis. Lancet 2002; 359: 1221-31.
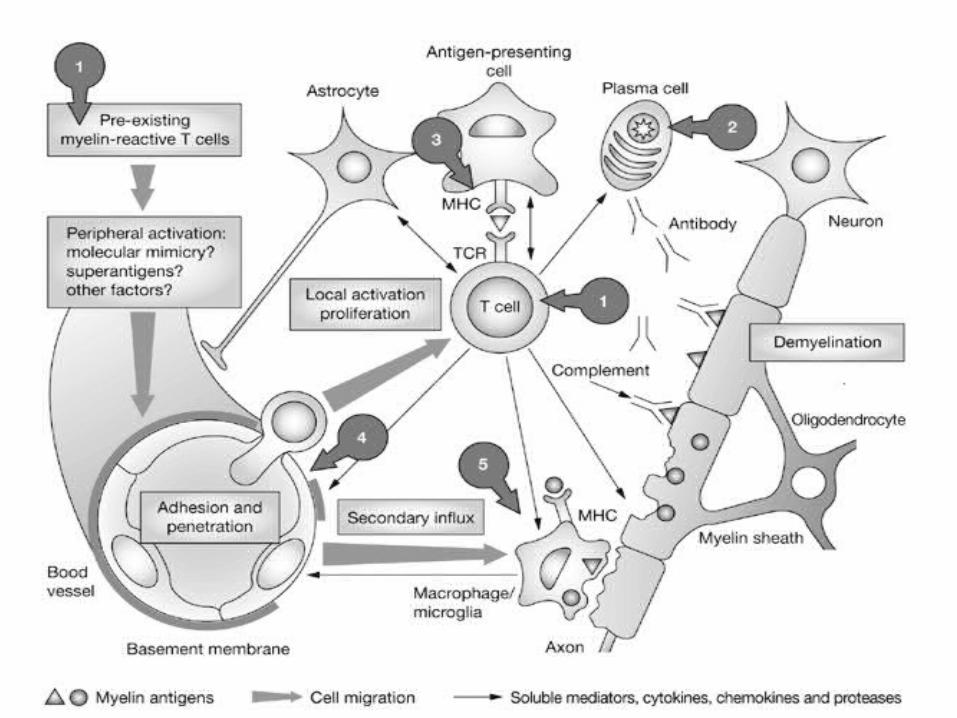
Multiple Sclerosis: Pathogenesis and mechanisms of therapy

Current MS therapies
Drug name molecule & mechanism firm patent
expiration route Notable features cost for 1 month of treatment
interferon β 1a 2011 IM Most used of DMT's $1,395.00
Natalizumab (monoclonal
antibody)2015 IV
• Touch process --> PML• reduces frequency of exacerbations for relapsing forms of MS
$2,225.00
Betaseron inteferon β 1b Bayer - Berlex off patent SC contraindicated in pregnancy $1,489.00
glatrimer acetate (mimics myelin
sheath)Teva 2014 SC
safest of main disease modifying drugs
(ABCR's)$1,370.00
interferon β 1a Pfizer-Serono 2011 SC risk of neutropenia and pancytopenia $1,470.00
mitoxantrone (intercalates DNA,
causing DNA damage)
Emd Serono / OSI Pharma 2010 IV
• Unique mechanism of intercalating DNA• risk of cardiotoxicity $1,453.00
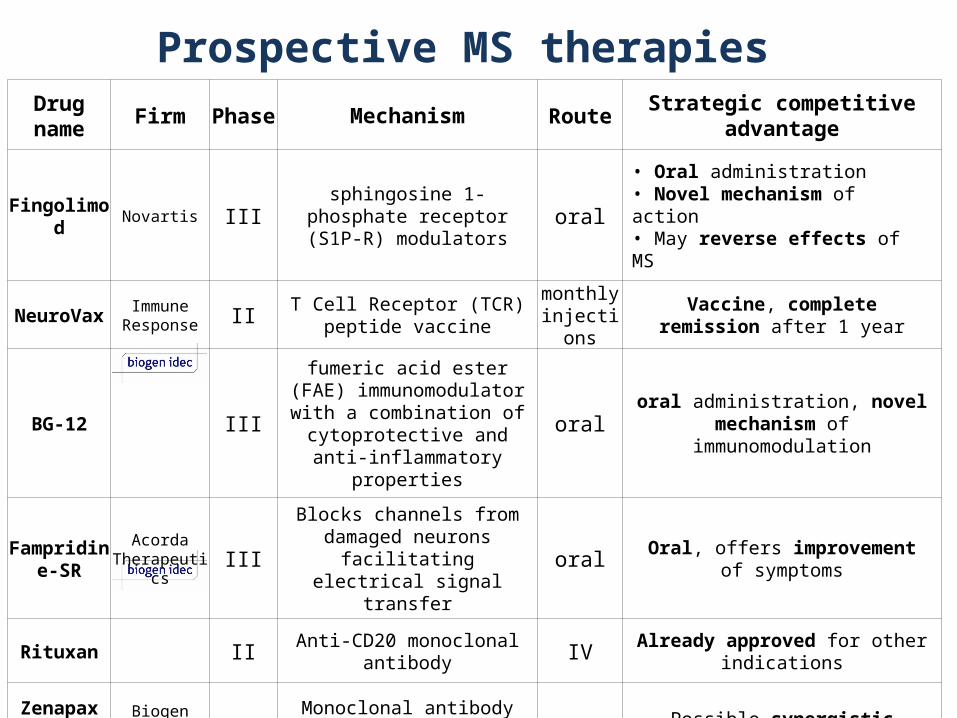
Prospective MS therapiesDrug name Firm Phase Mechanism Route Strategic competitive advantage
Fingolimod Novartis III sphingosine 1-phosphate receptor (S1P-R) modulators oral
• Oral administration• Novel mechanism of action • May reverse effects of MS
NeuroVax Immune Response II T Cell Receptor (TCR) peptide
vaccinemonthly
injectionsVaccine, complete remission after 1
year
BG-12 III
fumeric acid ester (FAE) immunomodulator with a
combination of cytoprotective and anti-inflammatory
properties
oral oral administration, novel mechanism of immunomodulation
Fampridine-SR
Acorda Therapeutics III
Blocks channels from damaged neurons facilitating electrical
signal transferoral Oral, offers improvement of symptoms
Rituxan II Anti-CD20 monoclonal antibody IV Already approved for other indications
Zenapax (daclizumab)
Biogen with PDL
BioPharmaII Monoclonal antibody that
targets IL-2 receptor antibodies IV Possible synergistic activity with interferons

Biogen Idec Valuation
Traditional DCF Method:Actual
2006 2007 2008 2009 2010 2011
$2,683.00 $3,353.80 $4,192.30 $5,240.30 $6,550.40 $8,188.00 815.9 911 1,072.60 1,280.90 1,547.10 1,885.80
$420.00 $404.20 $401.80 $445.60 $507.00 $590.50 Unlevered Free Cash
ProjectedFiscal Years ending
Net SalesEBITDA
Discount Rate (3) 13.0%Assumed EBITDA Exit Multiple 10.0x 20.0x 30.0x
PV of Terminal Value $ 10,235.2 $ 20,470.5 $ 30,705.7
PV of Free Cash Flows 1,612.7 1,612.7 1,612.7
Implied Enterprise Value $ 11,847.9 $ 22,083.1 $ 32,318.4
Discount Rate (3) 13.0%Assumed Perpetual Growth Rate 10.0% 11.0% 12.0%
Terminal Year + 1 Free Cash Flow $ 649.6 $ 655.5 $ 661.4 Terminal Value 21,653.2 32,775.0 66,140.6
PV of Terminal Value $ 11,752.5 $ 17,789.0 $ 35,898.4 PV of Free Cash Flows 1,612.7 1,612.7 1,612.7
Implied Enterprise Value $ 13,365.2 $ 19,401.7 $ 37,511.1

Valuation by industry multiples and recent acquisitions:
Current Market Value ($mn) LTM Multiples
Price Enterprise
Value Market Cap. Sales EBITDA EBIT P / E
Bio Gen 69.75 18,195.39 19,098.07 6.78 6.53 7.55 42.27
Amgen 54.02 57,333.94 61,476.94 4.x 4.6x 4.7x 12.7x
Genentech 76.01 81,868.48 82,157.48 8.8x 9.6x 10.1x 29.8x
Genzyme 73.53 15698.939 16303.039 4.9x 5.6x 6.4x 167.1x
Gilead 44.49 37015.251 37860.251 12.2x 14.x 14.3x -80.9x
Mean 7.5 8.47 8.87 32.18
Median 6.87 7.63 8.25 21.24
Industry Multiples Sales EBITDA EBIT Income
FY 2007E 3,354 911 671 438
Multiples 7.5 8.47 8.87 32.18
Ent. Value $25,149 $7,711 $5,952 $14,081
Acquisition Multiples Sales EBITDA EBIT Income
FY 2007E 3,354 911 671 438
Multiples 11.7 149 NM NM
Ent. Value $39,240 $135,733 NM NM

DCF Valuation by drug
2006 2007 2008 2009 2010 2011Market Size 175,000 195,000 215,000 235,000 257,000 281,000Pentetration Rate 37% 38% 39% 40% 41% 42%
Patients on AVONEX 64,750 74,100 83,850 94,000 105,370 118,020Sales Price per patient 1,395 1,430 1,430 1,430 1,430 1,430Annual Revenue per patient 16,740 17,159 17,159 17,159 17,159 17,159Total Annual Revnue 1,084 1,271 1,439 1,613 1,808 2,025
Costs 759 890 1,007 1,129 1,266 1,418
Gross Profit 325 381 432 484 542 608
Present Value $1,769
Value of BIOGEN’s MS line of drugs:
Avonex $1,769 M
Rituxan $551 M
Tysabri $339 M
BG12 $5,908 M
Total value (U.S) $8,566 M
Total (Worldwide): $14,277 M

Multiple valuations of BIOGEN-IDEC:


APPENDICES

The MS Pipeline: Phase III drugsDrug name Firm Mechanism Route strategic competitive advantage
BG-12 Biogen IDEC
fumeric acid ester (FAE) immunomodulator with a novel
mechanism of action with a combination of cytoprotective and anti-inflammatory
properties
oral Qday oral administration, novel mechanism of immunomodulation
CampathGenzyme and Bayer Schering
anti-CD52 monoclonal antibody Interim results compared Campath very favorably with Rebif
Fampridine-SRAcorda
Therapeutics
Blocks channels from damaged neurons facilitating electrical signal transfer Oral, offers improvement of symptoms
RevimmuneAccentia
Biopharmaceuticals
Using a ultra-high intensity cyclophosphamide, Revimmune is
intended to "reboot" a patient's immune system, thereby eliminating
autoimmunity
IV infusion for 4hours over for 4
days
improvement of symptoms and possibly complete remission via high-intesity IV
cyclophosphamide-mediated "reboot" of immune system
FTY720 (Fingolimod) Novartis sphingosine 1-phosphate receptor (S1P-R)
modulators - may repair damage oralNew mechanism of action with potential reversible effects; impact on CNS in addition to well established action on immune cells.
laquinimod Teva immunomodulatory effects oral would be first oral therapy for MS
MBP8298 BioMS Medical
Re-introduce a state of "tolerance" to a critical portion of the nerve's Myelin Basic
ProteinIV 1/6 mos
novel mechanism of action: restores "tolerance" to myelin basic protein; would
be one of few therapies targetted at secondary MS;

Drug name Firm mechanism strategic competitive advantage
RTL-1000 Artielle ImmunoTherapeutics
Inactivates pathogenic T cells through binding to them Novel mechanism, damage reversal
ATX-MS-1467 Apitope (UK) Vaccination with myelin basic protein (MBP) peptides to sensitize T cells Novel Mechanism, vaccination
CHR-1103 Chromos Molecular Systems monoclonal antibody directed against VLA-2
reduce the severity of a relapse; stem the residual neurological damage that often accompanies relapse
RPI-78M Nutra Pharma Corp Induces gamma-interferon and IL-27 to suppress auto-inflammatory processes Novel mechanism
Cyclophosphamide Generic intercalating agent Already approved for other indications
Ibidulast (MN-166) MediciNova Inhibits leukotrienes, phosphodiesterases, nitric oxide Novel mechanism, neuroprotection, oral administration
NeuroVax Immune response, Corp
an investigational T Cell Receptor (TCR) peptide vaccine for the treatment of relapsing-
remitting multiple sclerosis (MS).vaccine via T cell receptor mechanism
Rituxan Biogen Anti-CD20 monoclonal antibody Already approved for other indications
Zenapax (daclizumab)
Biogen with PDL BioPharma
Monoclonal antibody that targets IL-2 receptor antibodies Possible synergistic activity with interferons
Cladribine Merck Serono Nucleoside analogue that disrupts production of WBCs
oral medication, novel mechanism of action, potential to be first first-line oral approved drug for MS
BHT-3009 Bayhill Therapeutics Inc.
Autoimmune DNA vaccine that encodes MBP. It is designed to reprogram the immune
systemvaccine encoding human myelin basic protein
Tovaxin Opexa TherapeuticsThe induction of anti-idiotypic cytotoxic CD8+
effector T-cells and anti-ergotypic CD4+CD25+FoxP3 positive Tregs.
vaccine via T cell receptor mechanism
The MS Pipeline: Phase I & II drugs

Important features of licensing agreement:

2006 MS market share by firmPost acquisition MS market share by firmPost acquisition MS market share with synergies

THE FOLLOWING SLIDES DESCRIBE THE DETAILS OF THE DCF VALUATION

- DRAFT - Bio Gen
Income Statement ($ in millions, except per share amounts)
Historical FYE Dec. 31, Projected Fiscal Years Ending Dec. 31,2005A 2006A 2007E 2008E 2009E 2010E 2011E
Product $1,617.0 $1,781.3 $2,226.6 $2,783.3 $3,479.1 $4,348.9 $5,436.1 Unconsolidated Joint Business $708.9 $810.9 $1,013.6 $1,267.0 $1,583.7 $1,979.6 $2,474.6 Other Revenue $96.6 $90.9 $113.6 $142.0 $177.5 $221.9 $277.3 Net Sales $2,422.5 $2,683.0 $3,353.8 $4,192.3 $5,240.3 $6,550.4 $8,188.0 Cost of Goods Sales (373.6) (274.4) (335.4) (419.2) (524.0) (655.0) (818.8)Gross Profit 2,048.9 2,408.7 0 3,018.4 0 3,773.0 0 4,716.3 0 5,895.4 0 7,369.2
Margin 84.6% 89.8% 90.0% 90.0% 90.0% 90.0% 90.0% SG&A and Other (1,812.8) (1,968.6) (2,347.7) (2,934.6) (3,668.2) (4,585.3) (5,731.6)Total Costs and Expenses (1,812.8) (1,968.6) (2,347.7) (2,934.6) (3,668.2) (4,585.3) (5,731.6)Depreciation 402.2 375.9 240.2 # 234.1 # 232.8 # 237.1 # 248.2 EBITDA 638.2 815.9 911.0 1,072.6 1,280.9 1,547.1 1,885.8
EBITDA Margin 26.3% 30.4% 27.2% 25.6% 24.4% 23.6% 23.0%
Operating Income 236.0 440.0 670.8 838.5 1,048.1 1,310.1 1,637.6 Operating Income Margin 9.7% 16.4% 20.0% 20.0% 20.0% 20.0% 20.0%
Interest (Expense) 0.0 0.0 (3.4) (0.7) 0.0 0.0 0.0 Interest Income 20.2 52.1 0.0 0.0 0.0 0.0 0.0 Other Income (Expenses) 0.0 0.0 0.0 0.0 0.0 0.0 0.0
EBT 256.2 492.2 667.4 837.8 1,048.1 1,310.1 1,637.6 Income Tax Expense (95.5) (278.4) (233.6) (293.2) (366.8) (458.5) (573.2)Income from Continued Operations 160.7 213.7 433.8 544.5 681.2 851.6 1,064.4 Effect on Acct Change (net of taxes) 0.0 3.8 3.8 3.8 3.8 3.8 3.8 Net Income $160.7 $217.5 $437.6 $548.3 $685.0 $855.3 $1,068.2 Diluted Shares Outstanding 344.1 342.4 342.4 342.4 342.4 342.4 342.4 Diluted EPS (1) $0.47 $0.62 $1.27 $1.59 $1.99 $2.49 $3.11
First Call $3.36 $3.38 $3.66 $3.93
Dividends Per Share $0.00 $0.00 $0.00 $0.00 $0.00 $0.00 $0.00 Payout Ratio 0.0% 0.0% - - - - -
Assumed P/E 42.0x 107.3x 107.3x 107.3x 107.3x 107.3xImplied Share Price for Repurchase $26.21 $135.99 $170.70 $213.55 $266.94 $333.68 Shares to Repurchase 0MM Shares 0MM Shares 0MM Shares 0MM Shares 0MM Shares
One-Year Average Share Price $67.00 Implied '03 P/E 107.3x
(1)Based on Income from Continued Operations.

- DRAFT - Bio Gen
Balance Sheet ($ in millions)
Historical FYE Dec. 31, Projected Fiscal Years Ending Dec. 31,2005A 2006A 2007E 2008E 2009E 2010E 2011E
Cash and Cash Equivalents $850.8 $902.7 $1,128.4 $1,508.1 $1,957.5 $1,820.0 $2,754.8 Accounts Receivable (net) 280.5 317.4 387.5 472.9 576.8 703.0 856.3 Inventories 182.8 169.1 205.8 256.1 318.7 396.5 493.4 Due from unconsolidated business 141.1 168.7 210.9 263.6 329.5 411.9 514.9 Other current assets 177.7 154.7 193.4 241.7 302.2 377.7 472.1 Total Current Assets 1,632.9 1,712.6 2,125.9 2,742.4 3,484.6 3,709.1 5,091.5
Gross PP&E 1,389.6 1,589.0 Accumulated Depreciation (214.8) (308.6) Net PP&E 1,174.8 1,280.4 1,173.8 1,467.3 1,834.1 2,292.6 2,865.8
Marketable securities 1,204.4 1,412.2 1,765.3 2,206.6 2,758.3 3,447.8 4,309.8 Intangibles 2,975.6 2,747.2 2,747.2 2,747.2 2,747.2 2,747.2 2,747.2 Goodwill 1,130.4 1,154.8 1,154.8 1,154.8 1,154.8 1,154.8 1,154.8 Investments and other assets 264.1 245.6 307.0 383.8 479.7 599.7 749.6 Total Assets $8,382.1 $8,552.8 $7,508.8 $8,495.5 $9,700.5 $10,503.4 $12,608.9
Accounts Payable $99.8 $100.5 $122.8 $153.5 $191.9 $239.8 $299.8 Taxes Payable 200.2 145.5 181.9 227.4 284.2 355.3 444.1 Accrued Expenses 297.8 336.9 307.0 383.8 479.7 599.7 749.6 Total Current Liabilities 597.8 582.9 611.7 764.7 955.8 1,194.8 1,493.5
Notes Payable 43.4 96.7 25.4 0.0 0.0 0.0 340.5 Long Term deferred tax liablility 762.3 643.6 643.6 618.3 618.3 618.3 958.7 Other Long Term Liabilities 72.3 79.8 Total Long Term Liabilities 878.0 820.2 643.6 618.3 618.3 618.3 958.7
Common Stock 0.2 0.2 0.2 0.2 0.2 0.2 0.2 Additional Paid-in Capital 8,206.9 8,308.2 8,308.2 8,308.2 8,308.2 8,308.2 8,308.2 Other SE Items, incl. Treasury Stock (222.8) (319.7) (319.7) (319.7) (319.7) (319.7) (319.7)Deferred Stock Compensation (42.9)Accum. Other Comprehensive Income (13.9) 21.9 21.9 21.9 21.9 21.9 21.9 Retained Earnings (1,021.6) (860.8) (423.2) 125.1 810.1 1,665.4 2,733.7 Total Equity 6,905.9 7,149.8 7,587.4 8,135.7 8,820.7 9,676.0 10,744.3 Total Liabilities & SE $8,381.7 $8,552.8 $8,842.7 $9,518.6 $10,394.8 $11,489.1 $13,196.5 Assets-(Liabilities + SE) 0.395 0.000 (1,333.965) (1,023.110) (694.335) (985.667) (587.581)

- DRAFT - Bio Gen
Cash Flow Statement ($ in millions)
Projected Fiscal Years Ending Dec. 31,2007E 2008E 2009E 2010E 2011E
Net Income $437.6 $548.3 $685.0 $855.3 $1,068.2 Depreciation 240.2 234.1 232.8 237.1 248.2 Amortization 0.0 0.0 0.0 0.0 0.0 (Increase)/Decrease in Intangibles 0.0 0.0 0.0 0.0 0.0 (Increase)/Decrease in Investments and other assets (61.4) (76.8) (95.9) (119.9) (149.9)
Changes in Working Capital Accounts:(Increase)/Decrease in Accounts Receivable (net) (36.8) (70.1) (85.4) (103.9) (126.2) (153.3)(Increase)/Decrease in Inventories 13.7 (36.7) (50.3) (62.6) (77.9) (96.9)(Increase)/Decrease in Due from unconsolidated business (27.6) (42.2) (52.7) (65.9) (82.4) (103.0)(Increase)/Decrease in Other current assets 23.0 (38.7) (48.3) (60.4) (75.5) (94.4)Increase/(Decrease) in Accounts Payable 0.7 22.3 30.7 38.4 48.0 60.0 Increase/(Decrease) in Taxes Payable (54.7) 36.4 45.5 56.8 71.1 88.8 Increase/(Decrease) in Accrued Expenses 39.0 (29.8) 76.8 95.9 119.9 149.9 Total Changes in Working Capital (42.7) (158.8) (83.8) (101.6) (123.1) (148.9)Change in NWC as % of Sales 1.6% 2.0% 2.0% 2.0% 2.0% 2.0%Cash Provided / (Used) by Operating Activities (42.7) 519.0 698.6 816.2 969.3 1,167.5
Net Capital Spending (222.0) (293.5) (366.8) (458.5) (573.2)Other 0.0 0.0 0.0 0.0 0.0 Cash (Used) / Provided by Investing Activities (222.0) (293.5) (366.8) (458.5) (573.2)
Increase/(Decrease) in Common Equity 0.0 0.0 0.0 0.0 0.0 Dividends $0.0 $0.0 $0.0 $0.0 $0.0 Preferred Dividends 0.0 0.0 0.0 0.0 0.0 Cash (Used) / Provided by Financing Activities 0.0 0.0 0.0 0.0 0.0
Net Increase / (Decrease) in Cash Balance 297.0 405.1 449.4 510.8 594.3 Plus: Cash at Beginning of Period 902.7 1,128.4 1,508.1 1,957.5 1,820.0 Cash Available / (Deficit) to Reduce Revolver 1,199.7 1,533.5 1,957.5 2,468.3 2,414.3 Minimum Cash Balance 1,128.4 1,410.5 1,763.1 2,203.8 2,754.8 Cash (Used) / Drawn to Reduce Revolver (71.3) (25.4) 0.0 0.0 340.5 Cash at End of Period $1,128.4 $1,508.1 $1,957.5 $2,468.3 $2,754.8

- DRAFT - Bio Gen
Projections Assumptions ($ in millions)
Historical FYE Dec. 31, Projected Fiscal Years Ending Dec. 31,2005A 2006A 2007E 2008E 2009E 2010E 2011E
Income Statement
Net Sales Growth 10.8% 25.0% 25.0% 25.0% 25.0% 25.0% Cost of Goods Sales % of Net Sales 15.4% 10.2% 10.0% 10.0% 10.0% 10.0% 10.0%
SG&A and Other % of Net Sales 74.8% 73.4% 70.0% 70.0% 70.0% 70.0% 70.0%Interest on Cash Balance 6.1% 5.9% 4.0% 4.0% 4.0% 4.0% 4.0%
Effective Interest on Total Debt 0.0% 5.5% 5.5% 5.5% 5.5% 5.5%Effective Tax Rate 37.3% 56.6% 35.0% 35.0% 35.0% 35.0% 35.0%
Balance SheetMinimum Cash Balance $850.8 $902.7 $1,128.4 $1,410.5 $1,763.1 $2,203.8 $2,754.8
Min Cash Balance as % of Sales 35.1% 33.6% 33.6% 33.6% 33.6% 33.6% 33.6%Accounts Receivable Days 42.3 43.2 42.2 41.2 40.2 39.2 38.2
Inventory Days 178.6 224.9 223.9 222.9 221.9 220.9 219.9 Inventory Turns 2.0 1.6 1.6 1.6 1.6 1.7 1.7 Accounts Payable Days 97.5 133.6 133.6 133.6 133.6 133.6 133.6
Due from unconsolidated business % of Net Sales 5.8% 6.3% 6.3% 6.3% 6.3% 6.3% 6.3%Other current assets % of Net Sales 7.3% 5.8% 5.8% 5.8% 5.8% 5.8% 5.8%Total Current Assets % of Net Sales 67.4% 63.8% 63.8% 63.8% 63.8% 63.8% 63.8%Net PP&E % of Net Sales 48.5% 47.7% 47.7% 47.7% 47.7% 47.7% 47.7%Marketable securities % of Net Sales 49.7% 52.6% 52.6% 52.6% 52.6% 52.6% 52.6%Intangibles % of Net Sales 122.8% 102.4% 102.4% 102.4% 102.4% 102.4% 102.4%Goodwill % of Net Sales 46.7% 43.0% 43.0% 43.0% 43.0% 43.0% 43.0%
Investments and other assets % of Net Sales 10.9% 9.2% 9.2% 9.2% 9.2% 9.2% 9.2%
Taxes Payable % of Net Sales 8.3% 5.4% 5.4% 5.4% 5.4% 5.4% 5.4%Accrued Expenses % of Net Sales 10.9% 9.2% 9.2% 9.2% 9.2% 9.2% 9.2%
Total Current Liabilities % of Net Sales
Notes Payable % of Net Sales 0.0% # 0.0% 0.0% 0.0% 0.0% 0.0% 0.0%Long Term deferred tax liablility % of Net Sales 4.1% # 3.7% 3.7% 3.7% 3.7% 3.7% 3.7%
Other Long Term Liabilities % of Net Sales 8.3% # 5.4% 5.4% 5.4% 5.4% 5.4% 5.4%
Total Long Term Liabilities % of Net Sales 12.3% # 12.6% 12.6% 12.6% 12.6% 12.6% 12.6%
Cash Flow StatementCapital Spending (1) ($318.4) ($198.3) ($222.0) ($293.5) ($366.8) ($458.5) ($573.2)Sale of PP&E 408.1 74.2 0.0 0.0 0.0 0.0 0.0 Net Capital Spending $89.8 ($124.1) ($222.0) ($293.5) ($366.8) ($458.5) ($573.2)
% of Sales 13.1% 7.4% 6.6% 7.0% 7.0% 7.0% 7.0%
PPE 1,174.8 1,280.4 1,173.8 1,467.3 1,834.1 2,292.6 2,865.8% of Sales 48.5% 47.7% 35.0% 35.0% 35.0% 35.0% 35.0%
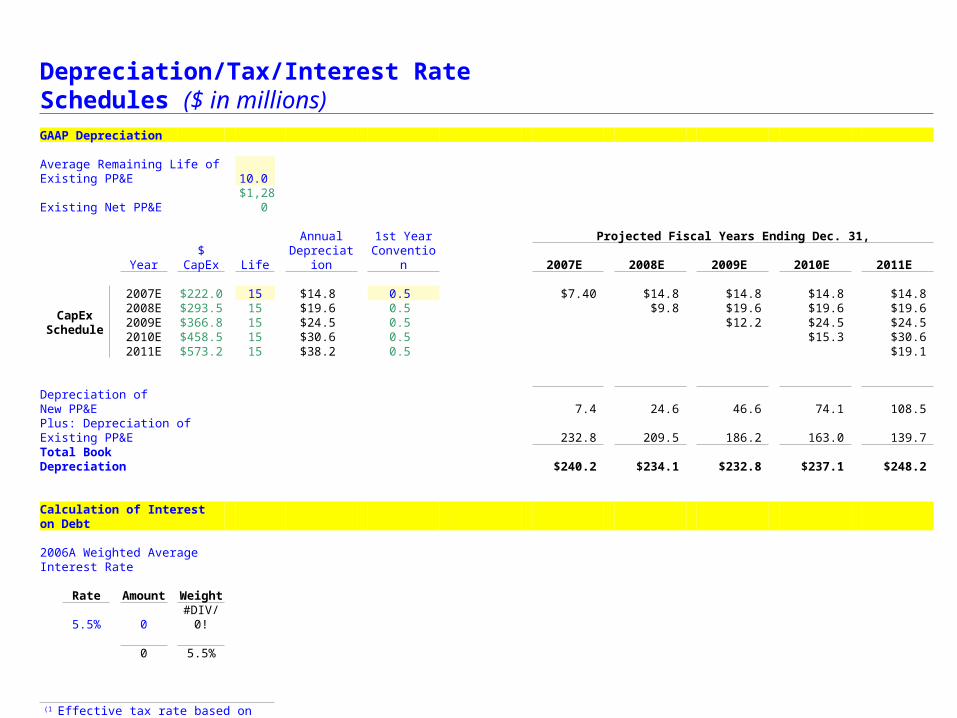
Depreciation/Tax/Interest Rate Schedules ($ in millions)
GAAP Depreciation
Average Remaining Life of Existing PP&E 10.0 Existing Net PP&E $1,280
Annual 1st Year Projected Fiscal Years Ending Dec. 31,Year $ CapEx Life Depreciation Convention 2007E 2008E 2009E 2010E 2011E
1 2 3 4 5
CapEx Schedule
2007E $222.0 15 $14.8 0.5 $7.40 $14.8 $14.8 $14.8 $14.8 2008E $293.5 15 $19.6 0.5 $9.8 $19.6 $19.6 $19.6 2009E $366.8 15 $24.5 0.5 $12.2 $24.5 $24.5 2010E $458.5 15 $30.6 0.5 $15.3 $30.6 2011E $573.2 15 $38.2 0.5 $19.1
Depreciation of New PP&E 7.4 24.6 46.6 74.1 108.5
Plus: Depreciation of Existing PP&E 232.8 209.5 186.2 163.0 139.7
Total Book Depreciation $240.2 $234.1 $232.8 $237.1 $248.2
Calculation of Interest on Debt
2006A Weighted Average Interest Rate
Rate Amount Weight5.5% 0 #DIV/0!
0 5.5%
(1) Effective tax rate based on published
research.- 1 -

Summary Financials ($ in millions, except per share amounts)
Historical FYE Dec. 31, Projected Fiscal Years Ending Dec. 31, CAGR2005A 2006A 2007E 2008E 2009E 2010E 2011E 2003-2008E
Operating Statistics 1 2 3 4 5 6 7 Net Sales $2,422.5 $2,683.0 $3,353.8 $4,192.3 $5,240.3 $6,550.4 $8,188.0 25.0%Gross Profit 2,048.9 2,408.7 3,018.4 3,773.0 4,716.3 5,895.4 7,369.2 25.1%Operating Income 236.0 440.0 670.8 838.5 1,048.1 1,310.1 1,637.6 30.1%Income from Continued Operations 160.7 213.7 433.8 544.5 681.2 851.6 1,064.4 37.9%Diluted EPS (1) 0.47 0.62 1.27 1.59 1.99 2.49 3.11 37.9%
EBITDA 638.2 815.9 911.0 1,072.6 1,280.9 1,547.1 1,885.8 18.2%Capital Spending 318.4 198.3 222.0 293.5 366.8 458.5 573.2 23.6%Free Cash Flow (EBITDA - Capital Spending) 319.9 617.6 689.0 779.1 914.1 1,088.6 1,312.6 16.3%
Growth RatesNet Sales 10.8% 25.0% 25.0% 25.0% 25.0% 25.0%Gross Profit 17.6% 25.3% 25.0% 25.0% 25.0% 25.0%Operating Income 86.4% 52.4% 25.0% 25.0% 25.0% 25.0%
EBITDA 27.8% 11.7% 17.7% 19.4% 20.8% 21.9%Free Cash Flow (EBITDA - Capital Spending) 93.1% 11.6% 13.1% 17.3% 19.1% 20.6%
MarginsGross Profit 89.8% 90.0% 90.0% 90.0% 90.0% 90.0%Operating Income 16.4% 20.0% 20.0% 20.0% 20.0% 20.0%Income from Continued Operations 8.0% 12.9% 13.0% 13.0% 13.0% 13.0%
EBITDA 30.4% 27.2% 25.6% 24.4% 23.6% 23.0%Free Cash Flow (EBITDA - Capital Spending) 23.0% 20.5% 18.6% 17.4% 16.6% 16.0%
Leverage / Credit StatisticsEBITDA / Total Interest Expense #DIV/0! #DIV/0! 271.3x 1,536.4x #DIV/0! #DIV/0! #DIV/0!FCF / Total Interest Expense #DIV/0! #DIV/0! 205.2x 1,116.0x #DIV/0! #DIV/0! #DIV/0!Average Total Debt / EBITDA -- 1.0x 0.8x 0.6x 0.5x 0.4x 0.4xDebt / Total Capital (Book) 10.5% 9.6% 8.6% 7.3% 6.4% 5.9% 7.6%Net Debt / Total Capital (Book) 0.3% -1.0% -6.5% -10.5% -13.8% -11.4% -14.2%
Operating ReturnsNet Sales / Assets (Average) -- 31.7% 41.8% 52.4% 57.6% 64.8% 70.9%Operating Income Return on Assets (Average) -- 5.2% 8.4% 10.5% 11.5% 13.0% 14.2%Return on Equity (Average) (1) -- 3.0% 5.9% 6.9% 8.0% 9.2% 10.4%
(1)Based on Income from Continued Operations
- 1 -


