41
PHARMACEUTICAL RESEARCH AND MANUFACTURERS OF AMERICA 950 F STREET, NW WASHINGTON, DC 20004 www.phrma.org | www.innovation.org PHARMACEUTICAL INDUSTRY 2012 profile

PHARMACEUTICAL RESEARCHAND MANUFACTURERS OF AMERICA
950 F STREET, NWWASHINGTON, DC 20004
www.phrma.org | www.innovation.org
P H A R M A C E U T I C A L I N D U S T R Y
2012profile
endnotes (continued from inside front cover)Key Facts
See inside back cover for endnotes.
Research and Development (R&D)
Time to develop a drug = 10 to 15 years1
Approvals
•Medicinesapproved2001–2011=3406
•Inthe29yearssincetheOrphanDrugActwas established,398orphandrugshavebeen approved.7
•Only2of10marketeddrugsreturnrevenues thatmatchorexceedR&Dcosts.8
Medicines in Development
2011=3,240compounds9
2001=2,040compounds10
Sales
Genericshareofmarket15
2000=49%
2011=80%
R&D Spending
Development Costs
Averagecosttodevelopadrug (includingthecostoffailures)2
Early2000s=$1.2billion
Late1990s=$800million*
Mid-1980s=$320million*
1970s=$140million*
Year PhRMA members3
2011 $49.5billion (est.)
2010 $50.7billion
2009 $46.4billion
2008 $47.4billion
2007 $47.9billion
2006 $43.0billion
2005 $39.9billion
2004 $37.0billion
2000 $26.0billion
1990 $8.4billion
1980 $2.0billion
Estimated Percentage of Sales That Went to R&D in 20114 DomesticR&D asapercentageofdomesticsales=21.1%
TotalR&D asapercentageoftotalsales=16.7%
Economic Impact of the Biopharmaceutical Sector5
Directjobs=Morethan650,000in2009
(most recent data)
Totaljobs(includingindirectandinducedjobs)
=About4millionin2009 (most recent data)
Value of Medicines
•Cancer:Since1980,lifeexpectancyforcancerpatientshasincreasedabout3 years,and83%ofthosegainsareattributabletonewtreatments,includingmedicines.11Anotherstudyfoundthatmedicinesspecificallyaccountfor50%to60%ofincreasesinsurvivalratessince1975.12
•Cardiovascular Disease:Accordingtoa2011 statisticsupdatebytheAmericanHeartAssocia-tion(AHA),deathratesforcardiovasculardiseasefelladramatic31%between1998and2008.13
•HIV/AIDS:Sincetheapprovaloftheantiretroviraltreatments(ART)in1995,theU.S.AIDSdeathratehasdroppedbymore than 80%.14
1J.A. DiMasi, “New Drug Development in U.S. 1963–1999,” Clinical Pharmacology & Therapeutics 69, no. 5 (2001): 286–296; M. Dickson and J.P. Gagnon, “Key Factors in the Rising Cost of New Drug Discovery and Development,” Nature Reviews Drug Discovery 3 (May 2004): 417–429; J.A. DiMasi, R.W. Hansen, and H.G. Grabowski, “The Price of Innovation: New Estimates of Drug Development Costs,” Journal of Health Economics 22 (2003): 151–185.2J.A. DiMasi and H.G. Grabowski, “The Cost of Biopharmaceutical R&D: Is Biotech Different?” Managerial and Decision Economics 28, no. 4–5 (2007): 469–479; J.A. DiMasi, R.W. Hansen, and H.G. Grabowski, “The Price of Innovation: New Estimates of Drug Development Costs,” Journal of Health Economics 22 (2003): 151–185.3Pharmaceutical Research and Manufacturers of America, PhRMA Annual Membership Survey (Washington, DC: PhRMA, 1981–2012).4Pharmaceutical Research and Manufacturers of America, PhRMA Annual Membership Survey (Washington, DC: PhRMA, 2012).5Battelle Technology Partnership Practice, The U.S. Biopharmaceuticals Sector: Economic Contribution of the Nation (Columbus, OH: Battelle Memorial Institute, July 2011). 6Pharmaceutical Research and Manufacturers of America, New Drug Approvals, 2001–2010 (Washington DC: PhRMA, 2002–2011); U.S. Food and Drug Administration, “2011 Biological License Application Approvals,” 2 March 2012, http://www.fda.gov/BiologicsBloodVaccines/DevelopmentApprovalProcess/BiologicalApprovalsbyYear/ucm242933.htm (accessed 10 February 2012); U.S. Food and Drug Administration, New Molecular Entity Approvals for 2011, 31 January 2012, http://www.fda.gov/Drugs/DevelopmentApprovalProcess/DrugInnovation/ucm285554.htm (accessed 10 February 2012).7Food and Drug Administration, Orphan Drug Designations and Approvals Database, www.accessdata.fda.gov/scripts/opdlisting/oopd/index.cfm (accessed 13 March 2012).8J.A. Vernon, J.H. Golec, and J.A. DiMasi, "Drug Development Costs When Financial Risk is Measured Using the Fama-French Three-Factor Model," Health Economics Letters 19, no. 8 (2010): 1002–1010. 9Adis R&D Insight Database, Wolters Kluwer Health (accessed 10 February 2012).10Adis R&D Insight Database, Wolters Kluwer Health, customized run, December 2007.11E. Sun, et al., “The Determinants of Recent Gains in Cancer Survival: An Analysis of the Surveillance, Epidemiology, and End Results (SEER) Database,” Journal of Clinical Oncology 26, suppl. 15 (2008): Abstract 6616.12F. Lichtenberg, “The Expanding Pharmaceutical Arsenal in the War on Cancer,” NBER Working Paper 10328 (National Bureau of Economic Research, February 2004).13V.L. Roger, et al., “Heart Disease and Stroke Statistics 2011 Update: A Report from the American Heart Association,” Circulation, published online, 15 December 2011. 14U.S. Department of Health and Human Services, Centers for Disease Control and Prevention, National Center for Health Statistics, Health, United States, 2010: With Special Feature on Death and Dying, table 35 (Hyattsville, MD: HHS, 2011), http://www.cdc.gov/nchs/data/hus/hus10.pdf#045; S.L. Murphy, et al., “Deaths: Final Data for 2010,” National Vital Statistics Reports 60, no. 4 (2012): 43 (table 2), http://www.cdc.gov/nchs/data/nvsr/nvsr60/nvsr60_04.pdf (accessed 2 March 2012).15IMS Health, analysis for PhRMA, March 2012.
*Note: Data is adjusted to 2000 dollars based on correspondence with J.A. DiMasi.

P H A R M A C E U T I C A L I N D U S T R Y
2012profile

0 Chapter title goes in this position, size + color
Letter from PhRMA’s President and CEO
Many scientists believe we are in a golden age of the life sciences. We are unraveling the molecular pathways underlying many diseases and uncovering new ways to alter the course of illnesses. And researchers in the
biopharmaceutical industry are working to translate this new knowledge into medicines that help prevent disease, improve health, and save lives.
Thanks to sustained investment in research and development, biopharmaceutical companies have helped to improve the outlook for many diseases. In the past year we’ve seen substantial progress against diseases such as melanoma, lupus and cystic fibrosis, to name a few.
At the same time, the biopharmaceutical industry faces many hurdles. The cost of developing new medicines has escalated, in part due to the focus on more complex conditions and increasing regulatory requirements. Market conditions have also become more challenging, and generics now account for 80% of prescriptions filled.
The industry is well focused on both the scientific potential and the business challenges. Companies are working to adapt to the changing conditions through reorganized R&D structures; more efficient drug discovery methods; new approaches, such as personalized medicine; and growing partnerships with academic medical centers, foundations, and government.
Biopharmaceutical companies are also continuing to invest in research and development. In 2011, PhRMA members alone invested an estimated $49.5 billion in R&D, representing the vast majority of private investment in new medicines in the United States. I am pleased to present the 2012 Pharmaceutical Industry Profile, which tells the evolving story of this complex, vital industry.
John J. Castellani President and Chief Executive Officer Pharmaceutical Research and Manufacturers of America
Permission to reproduce is granted if proper credit is given.
Suggested Citation:
Pharmaceutical Research and Manufacturers of America,
Pharmaceutical Industry Profile 2012 (Washington, DC: PhRMA, April 2012).
Copyright © 2012
by the Pharmaceutical Research and Manufacturers of America.
Pharmaceutical Research and Manufacturers of America
Washington, DC
www.phrma.org
2012
To enhance the content in the print version
of this year’s Profile, we have included quick
response (QR) codes that link you directly
to additional materials online. You can
find QR code readers for your smart phone or tablet in your
device’s app store, or you can access the interactive Industry
Profile online at www.phrma.org/industryprofile2012.
Cover image: An extracellular signaling molecule. Medicines often target these and other molecules in the body to fight disease.
Hear more from John J. Castellani here.Scan QR code >
Innovative Solutions for Patients and the Economy v
Table of Contents
Introduction
v Innovative Solutions for Patients and the Economy
1 New Medicines: Changing Lives and Managing Health Care Costs 4 Extending Lives4 Promoting Productive and Healthy Lives5 Managing Health Care Costs
13 Contributing Strongly to the U.S. Economy Despite a Challenging Environment
14 A Critical Pillar of the U.S. Economy16 Meeting Challenges Today and Tomorrow19 The U.S. Biopharmaceutical Industry Is Rising to Its Challenges
21 Bringing Medicines to Patients in Need
22 Medicare Part D: Increasing Access for Beneficiaries24 The Partnership for Prescription Assistance
27 The R&D Process: The Road to New Medicines
30 The R&D Process 36 PDUFA and Pediatric Research Legislation: Success Stories for Patients38 Collaboration and Innovation Go Hand in Hand
Conclusion
41 Continuing Commitment to World-Class Research and Innovation Leads to Better Health and a Strong Economy
Appendix
44 PhRMA Member Companies47 PhRMA Annual Membership Survey Definition of Terms49 List of Tables: Detailed Results From the PhRMA Annual Membership Survey
1
34
2
INTR
OD
UC
TIO
N
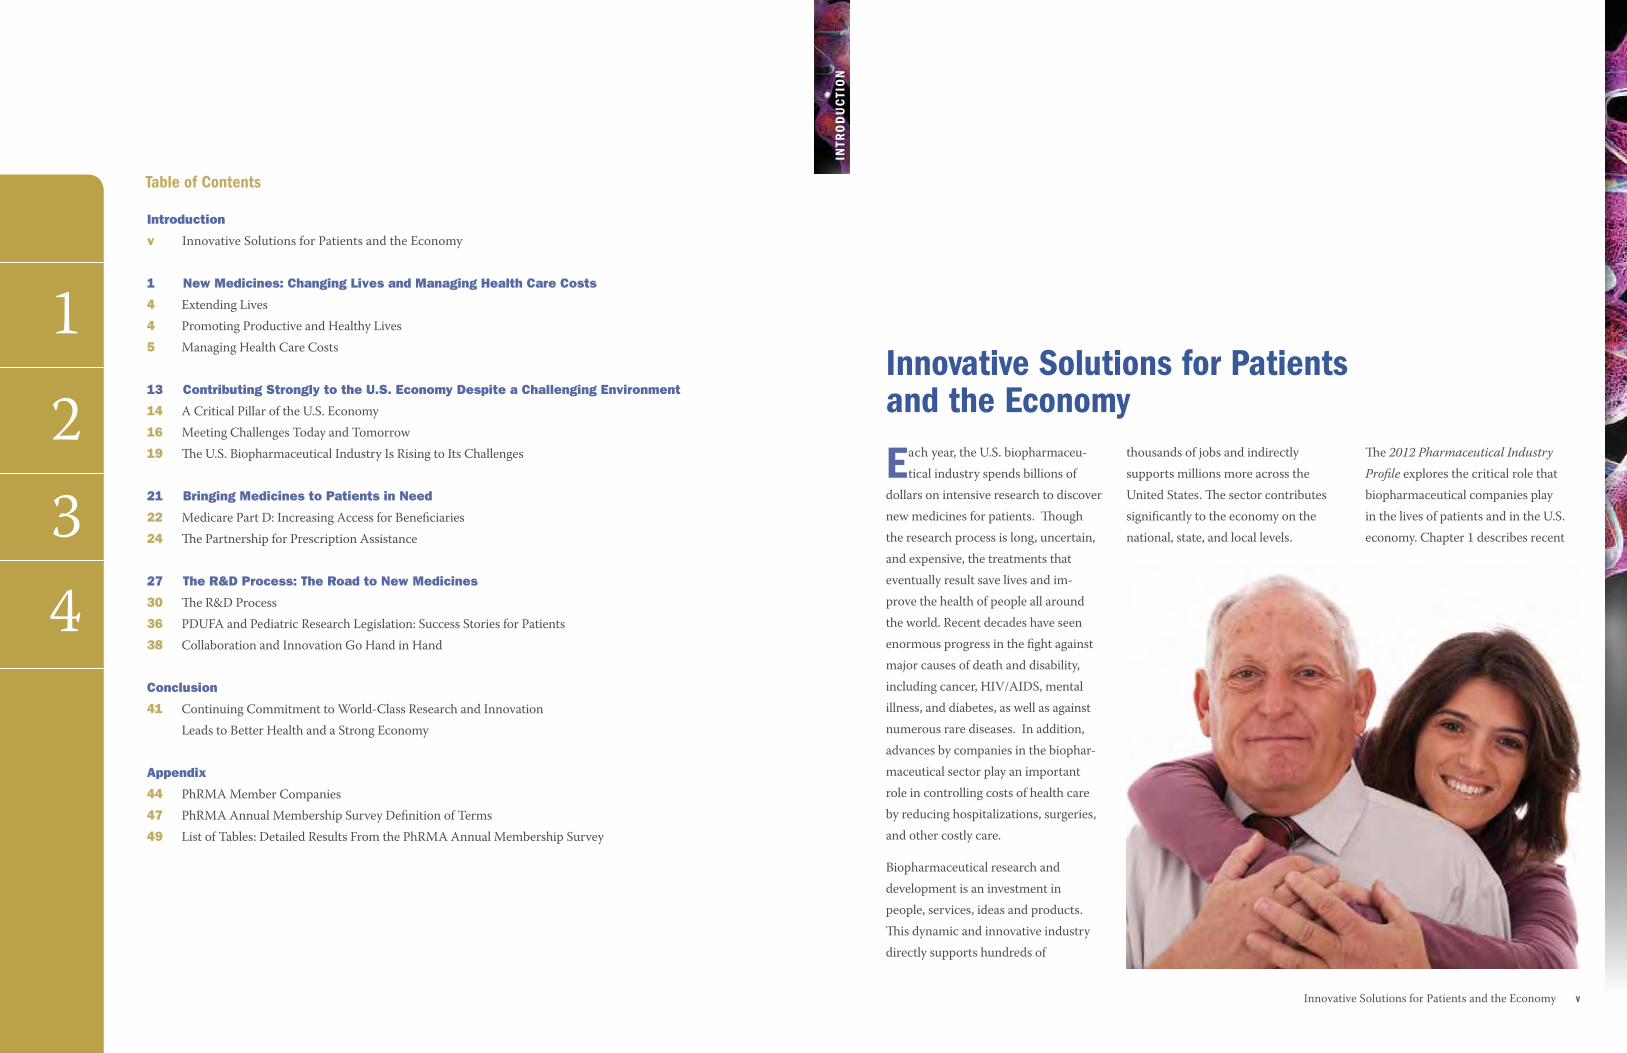
Innovative Solutions for Patientsand the Economy
Each year, the U.S. biopharmaceu-tical industry spends billions of
dollars on intensive research to discover new medicines for patients. Though the research process is long, uncertain, and expensive, the treatments that eventually result save lives and im-prove the health of people all around the world. Recent decades have seen enormous progress in the fight against major causes of death and disability, including cancer, HIV/AIDS, mental illness, and diabetes, as well as against numerous rare diseases. In addition, advances by companies in the biophar-maceutical sector play an important role in controlling costs of health care by reducing hospitalizations, surgeries, and other costly care.
Biopharmaceutical research and development is an investment in people, services, ideas and products. This dynamic and innovative industry directly supports hundreds of
thousands of jobs and indirectly supports millions more across the United States. The sector contributes significantly to the economy on the national, state, and local levels.
The 2012 Pharmaceutical Industry Profile explores the critical role that biopharmaceutical companies play in the lives of patients and in the U.S. economy. Chapter 1 describes recent

vi Innovative Solutions for Patients and the Economy
advances in medicines and the value medicines bring to patients and the health care system. Chapter 2 discusses the positive economic impact of the industry and describes several key challenges facing the industry today. Chapter 3 describes major programs that ensure that people have access to the medicines they need. Chapter 4 explains the research and development (R&D) process and how the biopharmaceutical industry fits into the vibrant life sciences ecosystem.
Through ongoing efforts to advance science and translate research findings into new medicines, biopharmaceutical companies bring value every day to patients, their families, and the entire economy.

New Medicines: Changing Lives and Managing Health Care Costs1
New Medicines: Changing Lives and Managing Health Care Costs 32 New Medicines: Changing Lives and Managing Health Care Costs
Ch
ap
ter
1
the risk of transmitting the virus to others.11 A large recent study spon-sored by the National Institute of Allergy and Infectious Diseases found that early initiation of antiretroviral therapy reduced transmission by 96%.12
Major advances have been achieved across a wide range of diseases and conditions, including cardiovascular disease, rheumatoid arthritis, and many others, as discussed below. Prescription medicines developed as a result of biopharmaceutical research have
•The life expectancy of a person with HIV was once measured in months. Today, a newly diagnosed young adult who receives combination HIV medicines according to established guidelines can expect to live 50 more years.9 A study by University of Chicago economists reports that the aggregate value of improved survival resulting from new HIV medicines since the start of the epidemic and into the future is $1.4 trillion.10
•Current HIV medicines not only help the person with HIV but can reduce
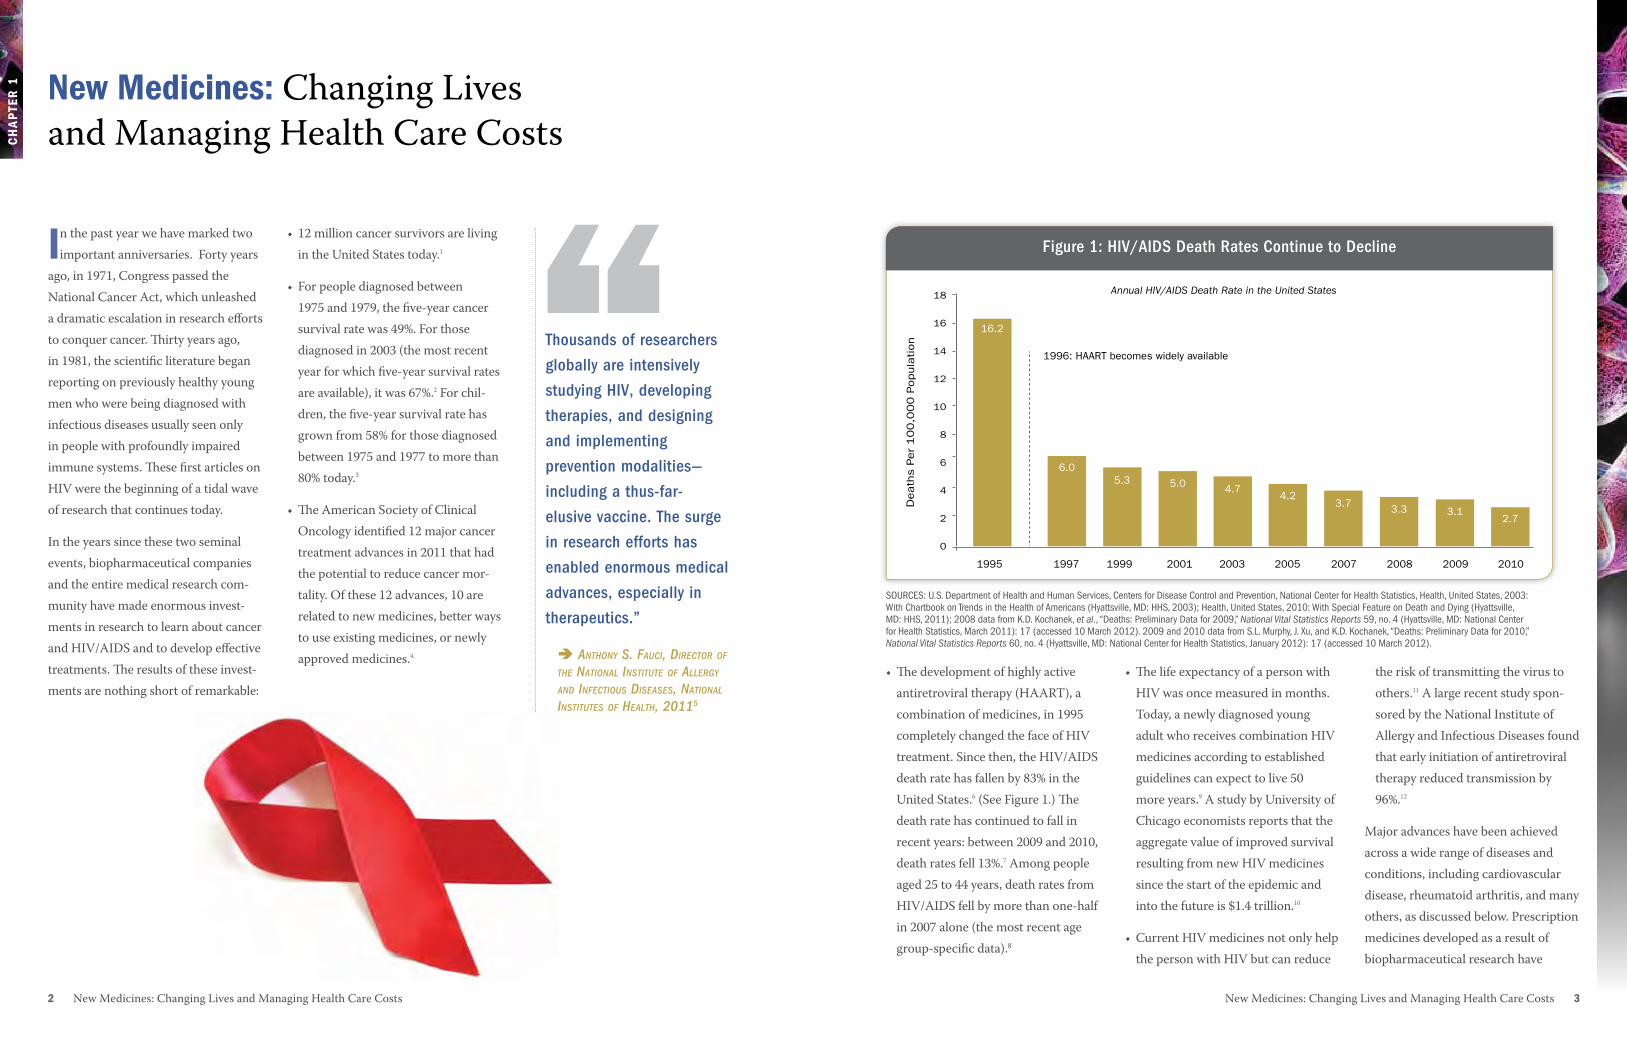
•The development of highly active antiretroviral therapy (HAART), a combination of medicines, in 1995 completely changed the face of HIV treatment. Since then, the HIV/AIDS death rate has fallen by 83% in the United States.6 (See Figure 1.) The death rate has continued to fall in recent years: between 2009 and 2010, death rates fell 13%.7 Among people aged 25 to 44 years, death rates from HIV/AIDS fell by more than one-half in 2007 alone (the most recent age group-specific data).8
• 12 million cancer survivors are living in the United States today.1
• For people diagnosed between 1975 and 1979, the five-year cancer survival rate was 49%. For those diagnosed in 2003 (the most recent year for which five-year survival rates are available), it was 67%.2 For chil-dren, the five-year survival rate has grown from 58% for those diagnosed between 1975 and 1977 to more than 80% today.3
•The American Society of Clinical Oncology identified 12 major cancer treatment advances in 2011 that had the potential to reduce cancer mor-tality. Of these 12 advances, 10 are related to new medicines, better ways to use existing medicines, or newly approved medicines.4
In the past year we have marked two important anniversaries. Forty years
ago, in 1971, Congress passed the National Cancer Act, which unleashed a dramatic escalation in research efforts to conquer cancer. Thirty years ago, in 1981, the scientific literature began reporting on previously healthy young men who were being diagnosed with infectious diseases usually seen only in people with profoundly impaired immune systems. These first articles on HIV were the beginning of a tidal wave of research that continues today.
In the years since these two seminal events, biopharmaceutical companies and the entire medical research com-munity have made enormous invest-ments in research to learn about cancer and HIV/AIDS and to develop effective treatments. The results of these invest-ments are nothing short of remarkable:
New Medicines: Changing Lives and Managing Health Care Costs
“1995
16.2
6.0
1997
5.3
1999
5.0
2001
4.7
2003
4.2
2005
3.7
2007
3.3
2008
3.1
2009
2.7
2010
18
16
14
12
10
8
6
4
2
0
1996: HAART becomes widely available
Annual HIV/AIDS Death Rate in the United States
Death
s P
er
10
0,0
00
Popula
tion
Figure 1: HIV/AIDS Death Rates Continue to DeclineFigure 1: HIV/AIDS Death Rates Continue to Decline
SOURCES: U.S. Department of Health and Human Services, Centers for Disease Control and Prevention, National Center for Health Statistics, Health, United States, 2003: With Chartbook on Trends in the Health of Americans (Hyattsville, MD: HHS, 2003); Health, United States, 2010: With Special Feature on Death and Dying (Hyattsville, MD: HHS, 2011); 2008 data from K.D. Kochanek, et al., “Deaths: Preliminary Data for 2009,” National Vital Statistics Reports 59, no. 4 (Hyattsville, MD: National Center for Health Statistics, March 2011): 17 (accessed 10 March 2012). 2009 and 2010 data from S.L. Murphy, J. Xu, and K.D. Kochanek, “Deaths: Preliminary Data for 2010,” National Vital Statistics Reports 60, no. 4 (Hyattsville, MD: National Center for Health Statistics, January 2012): 17 (accessed 10 March 2012).
Thousands of researchers
globally are intensively
studying HIV, developing
therapies, and designing
and implementing
prevention modalities—
including a thus-far-
elusive vaccine. The surge
in research efforts has
enabled enormous medical
advances, especially in
therapeutics.”
Anthony S. FAuci, Director oF the nAtionAl inStitute oF Allergy AnD inFectiouS DiSeASeS, nAtionAl inStituteS oF heAlth, 20115
Ch
ap
ter
1
4 New Medicines: Changing Lives and Managing Health Care Costs New Medicines: Changing Lives and Managing Health Care Costs 5
disease. People recently diagnosed with diabetes can now expect to live longer than those diagnosed 10 or 20 years ago. And while heart disease is a frequent complication of diabe-tes, today people with diabetes who take medicines are 31% less likely to develop lipid disorders such as high cholesterol and 13% less likely to develop high blood pressure—two major risk factors for premature death from heart disease—than those not taking medicines.15
promoting productive and healthy LivesPrescription medicines can prevent disease progression and serious
contributed to significant reductions in deaths from many diseases. These medicines bring great value, allowing people to live productive and healthy lives and offering new hope and improved quality of life to millions of patients.
In addition to improving and extending life for patients, proper use of medi-cines also plays an important role in limiting health care costs by reducing chronic disease progression and avoid-ing expensive emergency room visits, hospitalizations, and medical and surgical procedures.
extending LivesNew medicines and better prevention have made significant contributions to reducing death and disability from many diseases. For example:
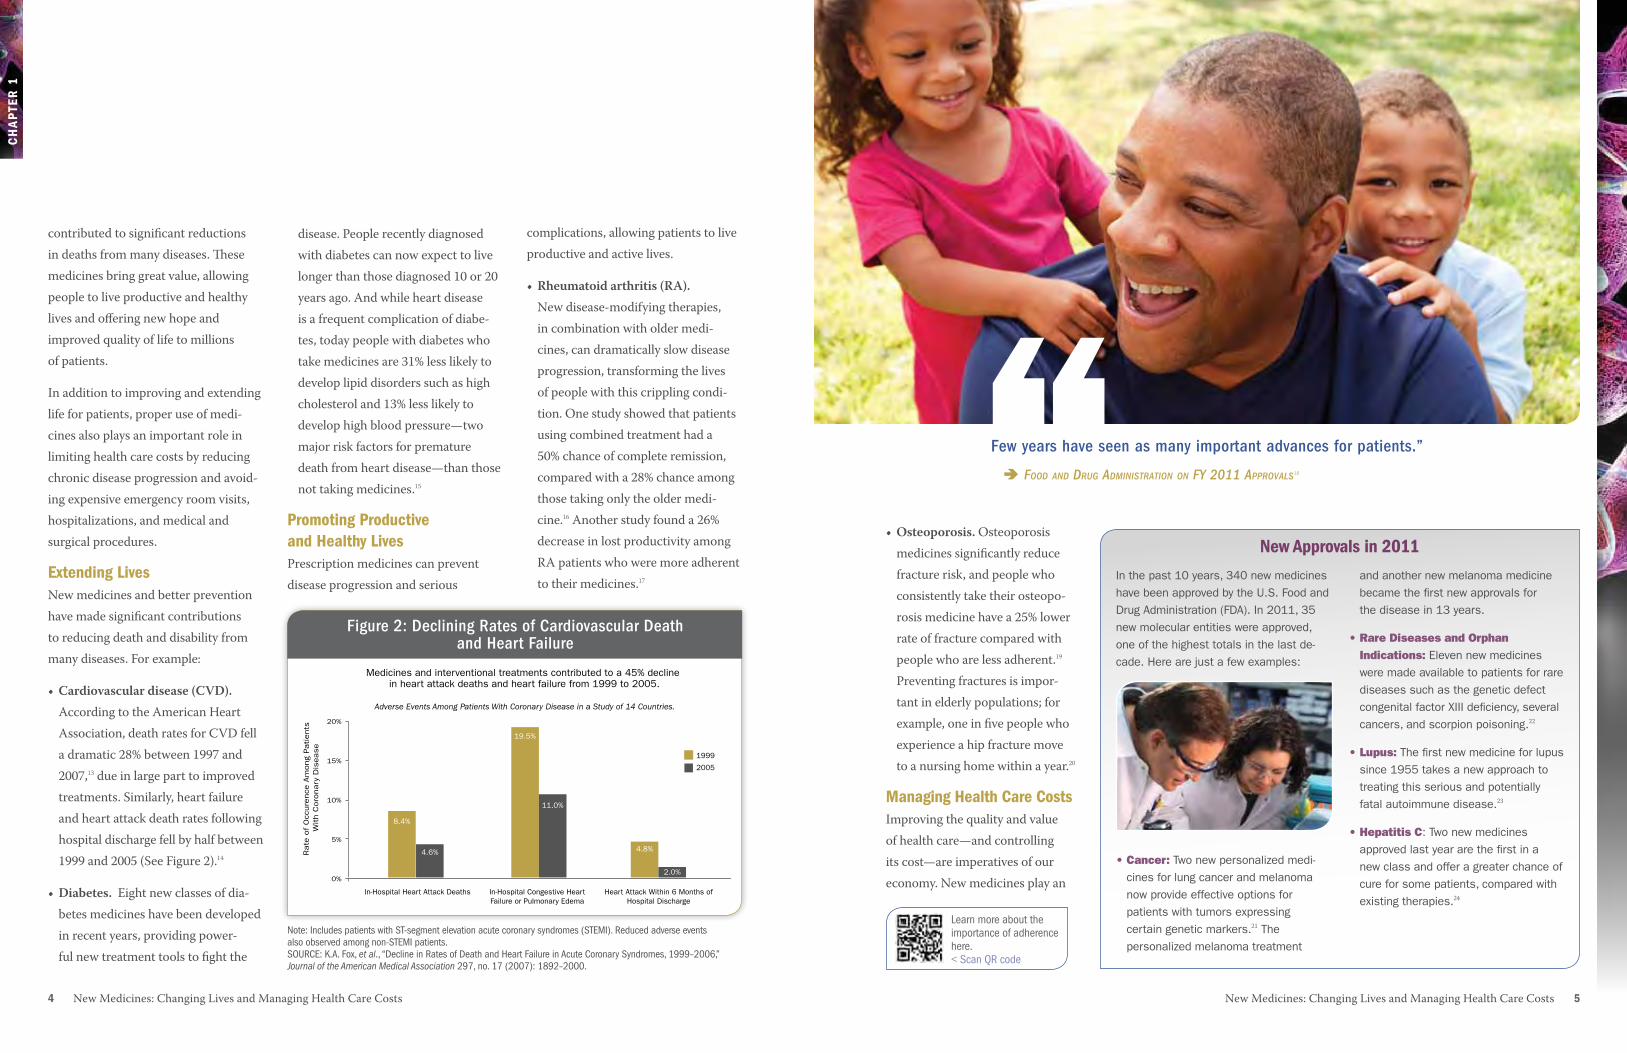
•Cardiovascular disease (CVD). According to the American Heart Association, death rates for CVD fell a dramatic 28% between 1997 and 2007,13 due in large part to improved treatments. Similarly, heart failure and heart attack death rates following hospital discharge fell by half between 1999 and 2005 (See Figure 2).14
•Diabetes. Eight new classes of dia-betes medicines have been developed in recent years, providing power-ful new treatment tools to fight the
complications, allowing patients to live productive and active lives.
•Rheumatoid arthritis (RA). New disease-modifying therapies, in combination with older medi-cines, can dramatically slow disease progression, transforming the lives of people with this crippling condi-tion. One study showed that patients using combined treatment had a 50% chance of complete remission, compared with a 28% chance among those taking only the older medi-cine.16 Another study found a 26% decrease in lost productivity among RA patients who were more adherent to their medicines.17
In-Hospital Heart Attack Deaths In-Hospital Congestive Heart Failure or Pulmonary Edema
Heart Attack Within 6 Months of Hospital Discharge
1999
2005
8.4%
4.6%
19.5%
11.0%
4.8%
2.0%
20%
15%
10%
5%
0%
Medicines and interventional treatments contributed to a 45% decline in heart attack deaths and heart failure from 1999 to 2005.
Adverse Events Among Patients With Coronary Disease in a Study of 14 Countries.
Rate
of
Occ
ure
nce
Am
ong
Patients
With C
oro
nary
Dis
ease
Figure 2: Declining Rates of Cardiovascular Death and Heart Failure
•Osteoporosis. Osteoporosis medicines significantly reduce fracture risk, and people who consistently take their osteopo-rosis medicine have a 25% lower rate of fracture compared with people who are less adherent.19 Preventing fractures is impor-tant in elderly populations; for example, one in five people who experience a hip fracture move to a nursing home within a year.20
Managing health Care CostsImproving the quality and value of health care—and controlling its cost—are imperatives of our economy. New medicines play an
“Few years have seen as many important advances for patients.”
FooD AnD Drug ADminiStrAtion on Fy 2011 ApprovAlS18
New approvals in 2011
Figure 2: Declining Rates of Cardiovascular Death and Heart Failure
Note: Includes patients with ST-segment elevation acute coronary syndromes (STEMI). Reduced adverse events also observed among non-STEMI patients. SOURCE: K.A. Fox, et al., “Decline in Rates of Death and Heart Failure in Acute Coronary Syndromes, 1999–2006,” Journal of the American Medical Association 297, no. 17 (2007): 1892–2000.
Learn more about the importance of adherence here.< Scan QR code
In the past 10 years, 340 new medicines have been approved by the U.S. Food and Drug Administration (FDA). In 2011, 35 new molecular entities were approved, one of the highest totals in the last de-cade. Here are just a few examples:
•Cancer: Two new personalized medi-cines for lung cancer and melanoma now provide effective options for patients with tumors expressing certain genetic markers.21 The personalized melanoma treatment
and another new melanoma medicine became the first new approvals for the disease in 13 years.
•RareDiseasesandOrphanIndications: Eleven new medicines were made available to patients for rare diseases such as the genetic defect congenital factor XIII deficiency, several cancers, and scorpion poisoning.22
•Lupus:The first new medicine for lupus since 1955 takes a new approach to treating this serious and potentially fatal autoimmune disease.23
•HepatitisC: Two new medicines approved last year are the first in a new class and offer a greater chance of cure for some patients, compared with existing therapies.24
6 New Medicines: Changing Lives and Managing Health Care Costs New Medicines: Changing Lives and Managing Health Care Costs 7
Ch
ap
ter
1
•Asthma. A program designed to improve asthma care for children led to a 47% increase in the use of medicines to prevent asthma attacks, a 56% reduction in outpatient visits, and a 91% decrease in emergency room visits for treatment of asthma.31
•Parkinson’s disease. A study pub-lished in 2010 found that relative to patients with Parkinson’s disease who took their medicines as directed, nonadherent patients experienced significantly more annual hospitaliza-tions, office visits, and use of ancillary
care. On average, 12-month total health care costs for the nonadherent group exceeded those of adherent patients by $2,383 per patient. Each one percentage point increase in medication adherence reduced total medical costs by $54 while increas-ing pharmacy costs by $16, for a total offset of $38.32
Correct and consistent use of prescribed medicines is essential to successful treatment, yet studies show that medicines often are not used as directed. This can lead to poor
Hospitalizations for Stroke/HeartAttack (2002)
Potential Additional Prevention if All Untreated Patients Used MedicationActual Prevention Based on Patients Treated With Medication
Premature Deaths (2001)
1,400,000
1,200,000
1,000,000
800,000
600,000
400,000
200,000
0
Appropriate Use of Antihypertensive Medicines ReducesHospitalizations and Premature Deaths
Num
ber
of Adve
rse E
vents
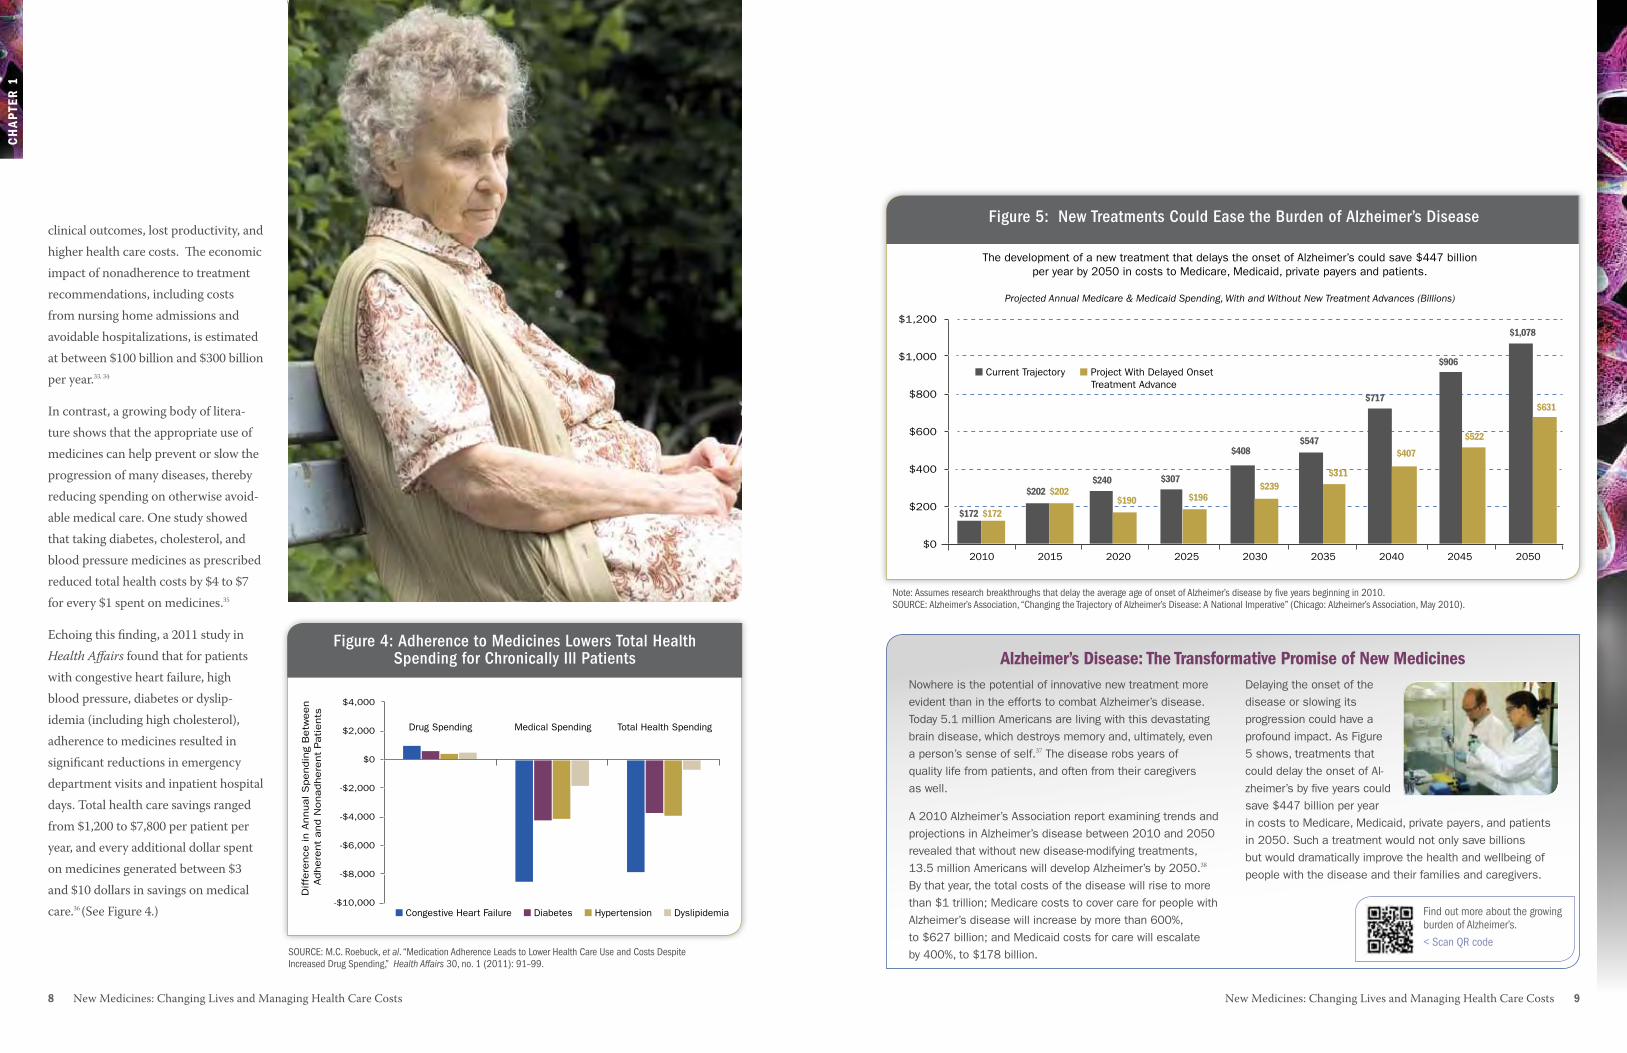
Figure 3: High Blood Pressure Medicines Reduce Hospitalizations and Deaths
420,000
89,00086,000
833,000
important role in achieving these criti-cal goals. Managing health care costs is particularly important given the large and growing number of people with chronic conditions that can lead over time to serious complications. Chronic conditions affect nearly half of Ameri-cans, and care for these patients ac-counts for $3 out of every $4 spent on medical care.29 Examples of the role of medicines in offsetting costs are found throughout the research literature:
•Cardiovascular disease. It is estimat-ed that if all patients with high blood pressure were given antihypertensive medications as guidelines recom-mend, 89,000 premature deaths and 420,000 hospitalizations could be avoided every year, saving $10.7 bil-lion in direct costs from fewer strokes and $5.8 billion from fewer heart attacks.30 (See Figure 3.)
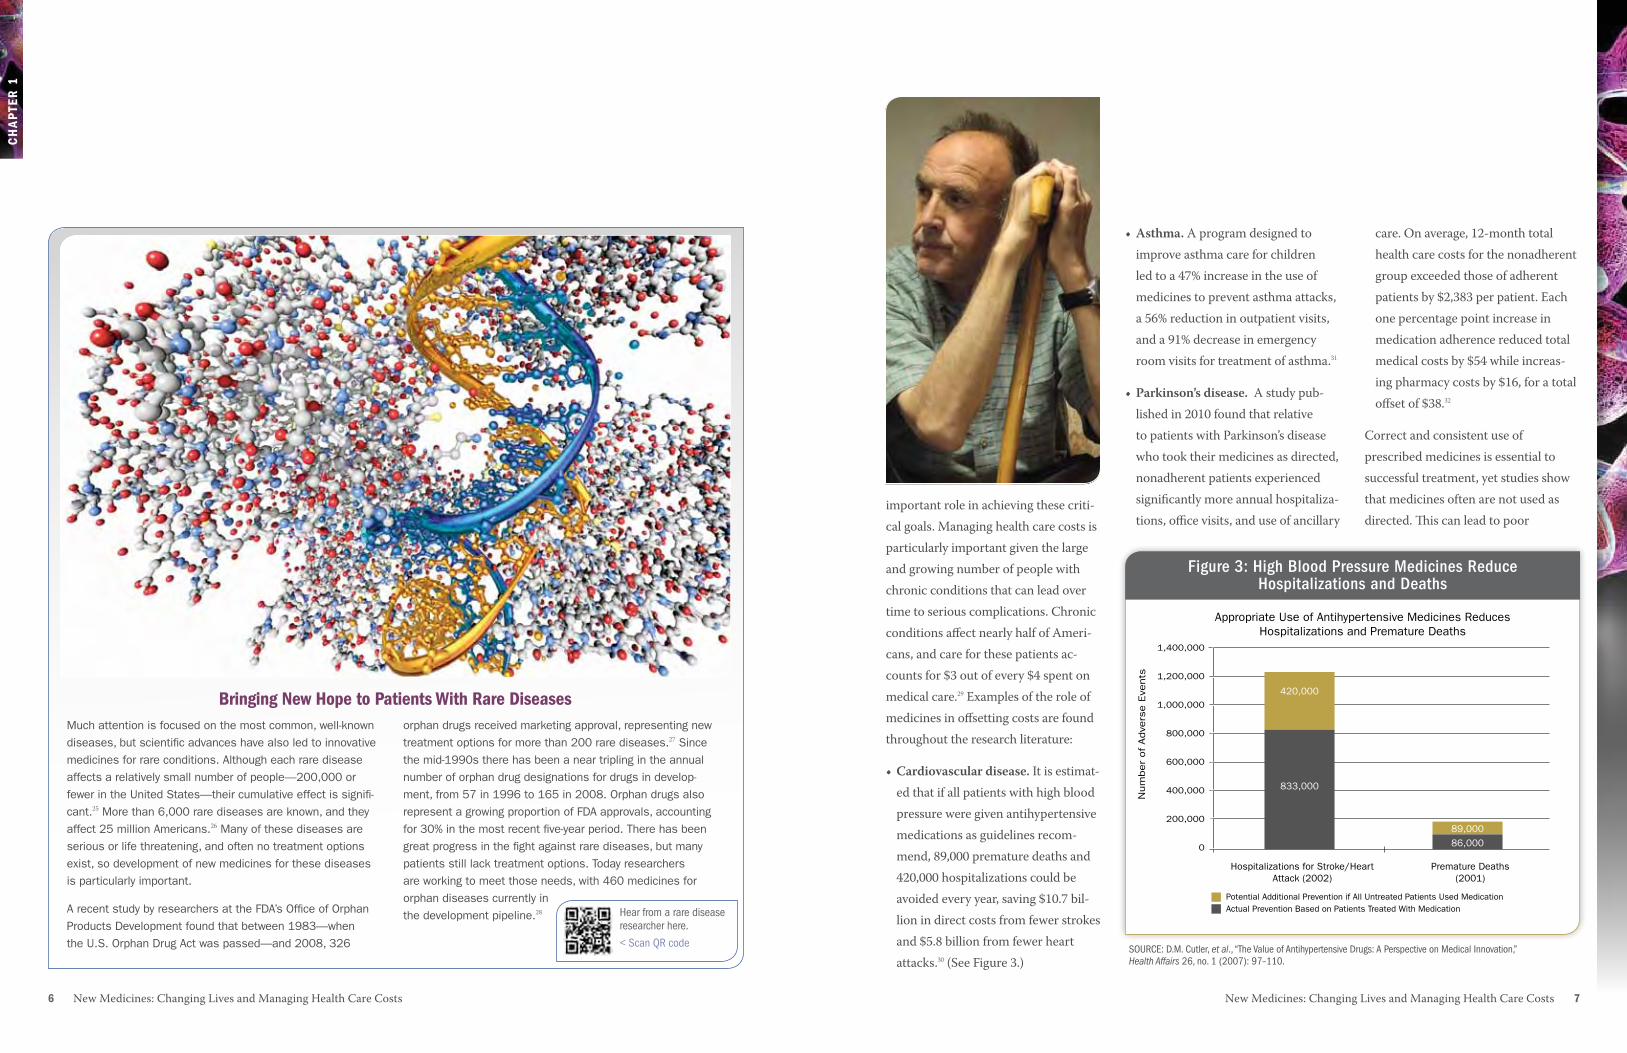
Much attention is focused on the most common, well-known diseases, but scientific advances have also led to innovative medicines for rare conditions. Although each rare disease affects a relatively small number of people—200,000 or fewer in the United States—their cumulative effect is signifi-cant.25 More than 6,000 rare diseases are known, and they affect 25 million Americans.26 Many of these diseases are serious or life threatening, and often no treatment options exist, so development of new medicines for these diseases is particularly important.
A recent study by researchers at the FDA’s Office of Orphan Products Development found that between 1983—when the U.S. Orphan Drug Act was passed—and 2008, 326
orphan drugs received marketing approval, representing new treatment options for more than 200 rare diseases.27 Since the mid-1990s there has been a near tripling in the annual number of orphan drug designations for drugs in develop-ment, from 57 in 1996 to 165 in 2008. Orphan drugs also represent a growing proportion of FDA approvals, accounting for 30% in the most recent five-year period. There has been great progress in the fight against rare diseases, but many patients still lack treatment options. Today researchers are working to meet those needs, with 460 medicines for orphan diseases currently in the development pipeline.28
Bringing New hope to patients With rare Diseases
Figure 3: High Blood Pressure Medicines Reduce Hospitalizations and Deaths
SOURCE: D.M. Cutler, et al., “The Value of Antihypertensive Drugs: A Perspective on Medical Innovation,” Health Affairs 26, no. 1 (2007): 97–110.
Hear from a rare disease researcher here.
< Scan QR code
8 New Medicines: Changing Lives and Managing Health Care Costs New Medicines: Changing Lives and Managing Health Care Costs 9
Ch
ap
ter
1
$1,200
$1,000
$800
$600
$400
$200
$0
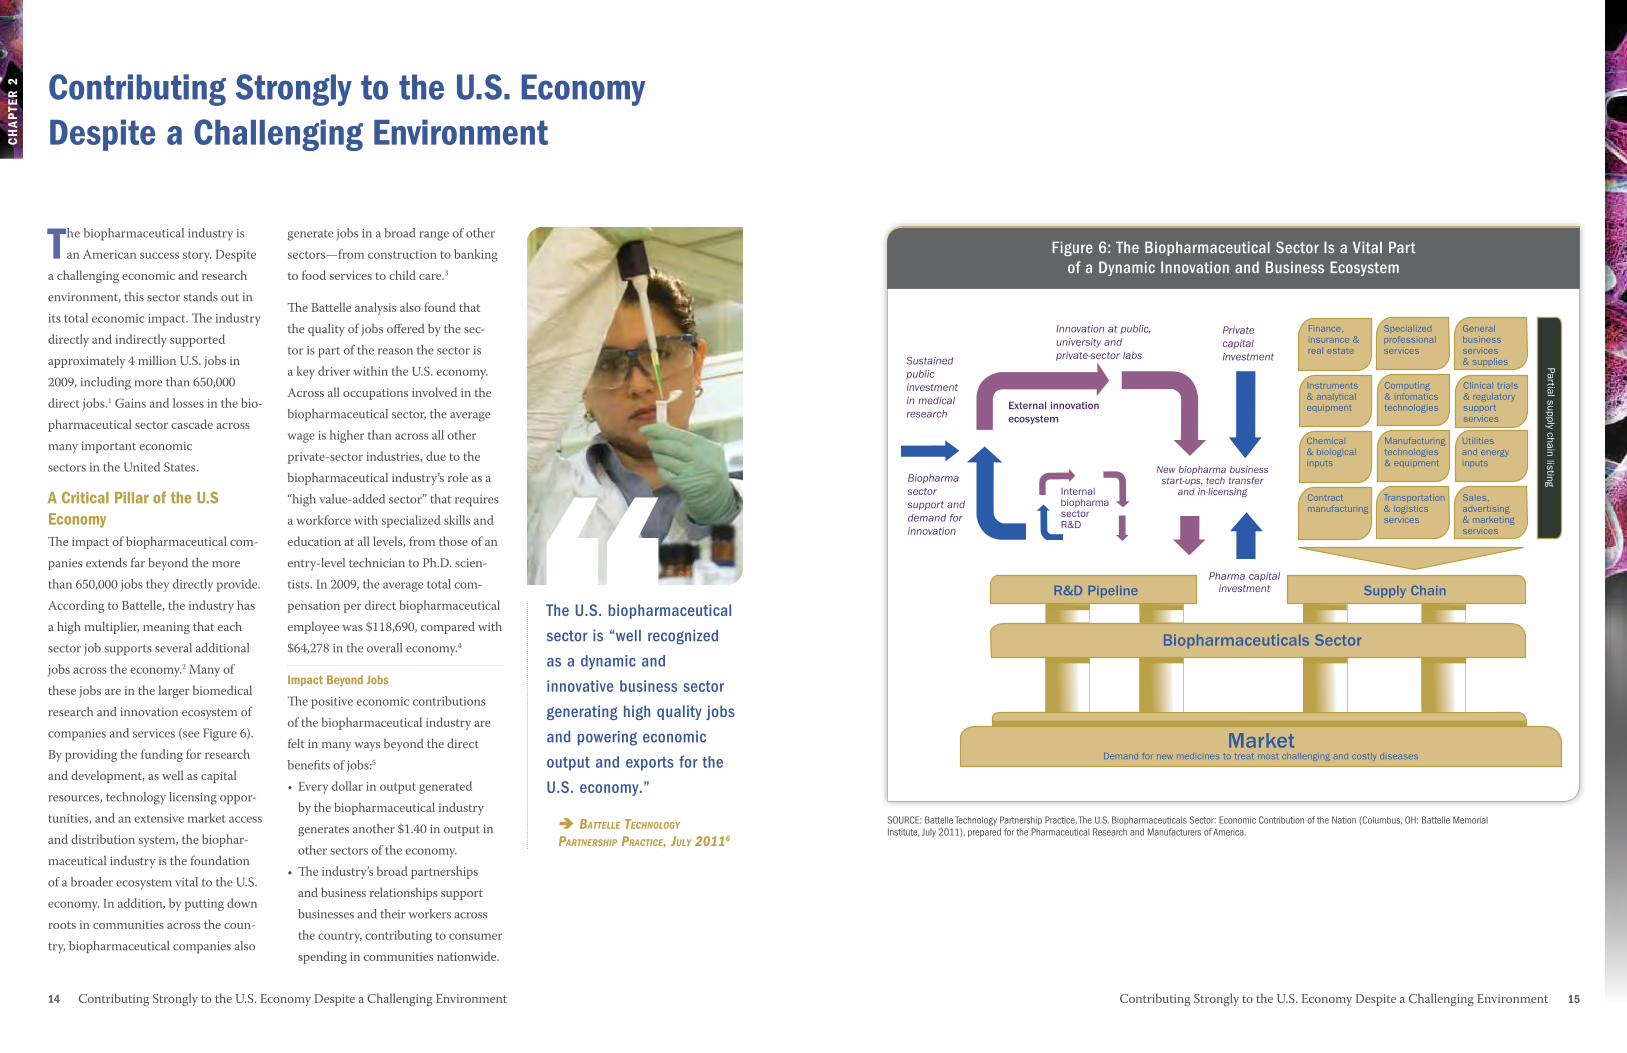
Figure 5: New Treatments Could Ease the Burden of Alzheimer’s Disease The development of a new treatment that delays the onset of Alzheimer’s could save $447 billion
per year by 2050 in costs to Medicare, Medicaid, private payers and patients.
Projected Annual Medicare & Medicaid Spending, With and Without New Treatment Advances (Billions)
2010 2015 2020 2025 2030 2035 2040 2045 2050
$172 $172
$202 $202$240 $307
$408 $547
$717
$906
$1,078
$631
$522
$407
$311$239
$196$190
■ Current Trajectory Project With Delayed Onset Treatment Advance
■
Figure 5: New Treatments Could Ease the Burden of Alzheimer’s Diseaseclinical outcomes, lost productivity, and higher health care costs. The economic impact of nonadherence to treatment recommendations, including costs from nursing home admissions and avoidable hospitalizations, is estimated at between $100 billion and $300 billion per year.33, 34
In contrast, a growing body of litera-ture shows that the appropriate use of medicines can help prevent or slow the progression of many diseases, thereby reducing spending on otherwise avoid-able medical care. One study showed that taking diabetes, cholesterol, and blood pressure medicines as prescribed reduced total health costs by $4 to $7 for every $1 spent on medicines.35
Echoing this finding, a 2011 study in Health Affairs found that for patients with congestive heart failure, high blood pressure, diabetes or dyslip-idemia (including high cholesterol), adherence to medicines resulted in significant reductions in emergency department visits and inpatient hospital days. Total health care savings ranged from $1,200 to $7,800 per patient per year, and every additional dollar spent on medicines generated between $3 and $10 dollars in savings on medical care.36 (See Figure 4.) ■ Congestive Heart Failure ■ Diabetes ■ Hypertension ■ Dyslipidemia
$4,000
$2,000
$0
-$2,000
-$4,000
-$6,000
-$8,000
-$10,000
Diffe
rence
in A
nnual S
pendin
g B
etw
een
Adhere
nt
and N
onadhere
nt
Patients
Figure 4: Adherence to Medicines Lowers Total Health Spending for Chronically Ill Patients
Drug Spending Medical Spending Total Health Spending
Note: Assumes research breakthroughs that delay the average age of onset of Alzheimer’s disease by five years beginning in 2010. SOURCE: Alzheimer’s Association, “Changing the Trajectory of Alzheimer’s Disease: A National Imperative” (Chicago: Alzheimer’s Association, May 2010).
alzheimer’s Disease: the transformative promise of New MedicinesNowhere is the potential of innovative new treatment more evident than in the efforts to combat Alzheimer’s disease. Today 5.1 million Americans are living with this devastating brain disease, which destroys memory and, ultimately, even a person’s sense of self.37 The disease robs years of quality life from patients, and often from their caregivers as well.
A 2010 Alzheimer’s Association report examining trends and projections in Alzheimer’s disease between 2010 and 2050 revealed that without new disease-modifying treatments, 13.5 million Americans will develop Alzheimer’s by 2050.38 By that year, the total costs of the disease will rise to more than $1 trillion; Medicare costs to cover care for people with Alzheimer’s disease will increase by more than 600%, to $627 billion; and Medicaid costs for care will escalate by 400%, to $178 billion.
Delaying the onset of the disease or slowing its progression could have a profound impact. As Figure 5 shows, treatments that could delay the onset of Al-zheimer’s by five years could save $447 billion per year in costs to Medicare, Medicaid, private payers, and patients in 2050. Such a treatment would not only save billions but would dramatically improve the health and wellbeing of people with the disease and their families and caregivers.
Figure 4: Adherence to Medicines Lowers Total Health Spending for Chronically Ill Patients
SOURCE: M.C. Roebuck, et al. “Medication Adherence Leads to Lower Health Care Use and Costs Despite Increased Drug Spending,” Health Affairs 30, no. 1 (2011): 91–99.
Find out more about the growing burden of Alzheimer’s.
< Scan QR code

10 New Medicines: Changing Lives and Managing Health Care Costs New Medicines: Changing Lives and Managing Health Care Costs 11
1U.S. Department of Health and Human Ser-vices, Centers for Disease Control and Preven-tion, “Cancer Survivors—United States, 2007,” Morbidity and Mortality Weekly Report 60, no. 9 (2011): 269–272, http://www.cdc.gov/mmwr/pdf/wk/mm6009.pdf (accessed 6 December 2011).
2National Cancer Institute, Surveillance Epidemi-ology and End Results, http://seer.cancer.gov/faststats/index.php (accessed 16 December 2011).
3A. Jemal, et al., “Cancer Statistics, 2010,” CA: A Cancer Journal for Clinicians 60, no. 5 (2010): 277–300, http://onlinelibrary.wiley.com/doi/10.3322/caac.20073/full (accessed 6 December 2011).
4M.G. Kris, et al., American Society of Clinical Oncology, “Clinical Cancer Advances 2010: Annual Report on Progress Against Cancer from the American Society of Clinical Oncology,” Journal of Clinical Oncology 28, no. 36 (2010): 5327–5347.
5A.S. Fauci, “After 30 Years of HIV/AIDS, Real Progress and Much Left To Do,” The Washington Post, 27 May 2011, http://www.washingtonpost.com/opinions/after-30-years-of-hivaids-real-progress-and-much-left-to-do/2011/05/27/AGbimyCH_print.html (accessed 31 January 2012).
6U.S. Department of Health and Human Services, Centers for Disease Control and Prevention, National Center for Health Statistics, Health, United States, 2003: With Chartbook on Trends in the Health of Americans (Hyatts-ville, MD: HHS, 2003); S.L. Murphy, J. Xu, and K.D. Kochanek, “Deaths: Preliminary Data for 2010,” National Vital Statistics Reports 60, no. 4 (Hyattsville, MD: National Center for Health Statistics, January 2012): 17 (accessed 10 March 2012).
7S.L. Murphy, J. Xu, and K.D. Kochanek, “Deaths: Preliminary Data for 2010,” National Vital Statistics Reports 60, no. 4 (Hyattsville, MD: National Center for Health Statistics, Janu-ary 2012): 17 (accessed 10 March 2012).
8U.S. Department of Health and Human Servic-es, Centers for Disease Control and Prevention, National Center for Health Statistics, Health United States, 2010: With Special Feature on Death and Dying, (Hyattsville, MD: NCHS, 2011) http://www.cdc.gov/nchs/data/hus/hus10.pdf.
9A.S. Fauci, op. cit.
10A.B. Jena and T.J. Philipson, Innovation and Technology: Adoption in Health Care Markets (Washington, DC: AEI Press, 2008).
11D. Donnell, et al., “Heterosexual HIV-1 Trans-mission After Initiation of Antiretroviral Therapy: A Prospective Cohort Analysis,” The Lancet 375, no. 9731 (2010): 2091–2098.
12National Institute of Allergy and Infectious Diseases, Treating HIV-infected People with Antiretrovirals Protects Partners from Infection: Findings Result from NIH-Funded International Study, press release, 12 May 2011, http://www.niaid.nih.gov/news/newsreleases/2011/Pages/HPTN052.aspx.
13V.L. Roger, et al., “Heart Disease and Stroke Statistics—2011 Update: A Report from the American Heart Association,” Circulation 123, no. 4 (2011): e18-e209.
14K.A. Fox, et al., “Decline in Rates of Death and Heart Failure in Acute Coronary Syndromes, 1999–2006,” Journal of the American Medical Association 297, no. 17 (2007): 1892–1900.
15PharMetrics, Examination of Treatment Patterns and Effects of Medication-Taking Behaviors Among Patients with Diabetes, (Watertown, MA: PharMetrics, 2004) (research supported by PhRMA).
16J.M. Kremer, “COMET’s Path, and the New Biologicals in Rheumatoid Arthritis,” The Lancet 372, No. 9636 (2008): 347–348.
17Integrated Benefits Institute, A Broader Reach for Pharmacy Plan Design (San Francisco: IBI, May 2007). 18U.S. Food and Drug Administration, FY2011 Innovative Drug Approvals (Washington, DC: FDA, November 2011), http://www.fda.gov/AboutFDA/ReportsManualsForms/Reports/ucm276385.htm.
19J.J. Caro, et al., “The Impact of Compliance with Osteoporosis Therapy on Fracture Rates in Actual Practice,” Osteoporosis International 15, no. 12 (2004): 1003–1008.
20U.S. Department of Health and Human Ser-vices, Office of the Surgeon General, The 2004 Surgeon General’s Report on Bone Health and Osteoporosis: What It Means To You (Washing-ton, DC: HHS, 2004), http://www. surgeongeneral.gov/library/bonehealth/docs/OsteoBrochure1mar05.pdf (accessed 5 December 2011). 21U.S. Food and Drug Administration, FY2011 Innovative Drug Approvals, op. cit.
22J.K. Jenkins, “CDER New Drug Review: 2011 Update,” presentation at the FDA/CMS Summit (Washington, DC), 8 December 2011, http://www.fda.gov/downloads/AboutFDA/ CentersOffices/OfficeofMedicalProductsand Tobacco/CDER/UCM282984.pdf.
23Food and Drug Administration, “FDA Approves Benlysta to Treat Lupus,” press release, 9 March 2011, http://www.fda.gov/NewsEvents/Newsroom/PressAnnouncements/ucm246489.htm (accessed 29 January 2012).
24U.S. Food and Drug Administration, “Notable FY 2011 Approvals,” 15 November 2011, http://www.fda.gov/AboutFDA/Reports ManualsForms/Reports/ucm276413.htm (accessed 29 January 2012).
25National Institutes of Health, Office of Rare Diseases Research, Office of Rare Diseases Research (ORDR) Brochure, online brochure, 11 March 2009, http://rarediseases.info.nih.gov/Wrapper.aspx?src=asp/resources/ ord_brochure.html (accessed 5 December 2011).
26Ibid.
27M.M. Braun, et al., “Emergence of Orphan Drugs in the United States: a Quantitative As-sessment of the First 25 Years.” Nature Reviews Drug Discovery 9, no. 7 (2010) 519–522.
28Pharmaceutical Research and Manufacturers of America, Orphan Drugs in Development for Rare Diseases 2011 (Washington, DC: PhRMA, 2011), http://www.phrma.org/sites/default/files/878/rarediseases2011.pdf.
29S.Y. Wu and A. Green, Projection of Chronic Illness Prevalence and Cost Inflation (Santa Monica, CA: RAND Health, 2000).
30D.M. Cutler, et al., “The Value of Antihyperten-sive Drugs: A Perspective on Medical Innova-tion,” Health Affairs 26, no. 1 (2007): 97–110.
31M. Cloutier, et al., “Asthma Guideline Use by Pediatricians in Private Practices and Asthma Morbidity,” Pediatrics 118, no. 5 (2006): 1880–1887.
32K. Davis, et al., “Prevalence and Cost of Medi-cation Nonadherence in Parkinson’s Disease: Evidence From Administrative Claims Data,” Movement Disorders 25, no. 4 (2010): 474–480.
33L. Osterberg and T. Blaschke, “Adherence to Medication,” New England Journal of Medicine 353, no. 5 (2005): 487–497.
34M.R. DiMatteo, “Variations in Patients’ Adher-ence to Medical Recommendations: A Quantita-tive Review of 50 Years of Research,” Medical Care 42, no. 3 (2004): 200–209.
35M.C. Sokol, et al., “Impact of Medication Ad-herence on Hospitalization Risk and Healthcare Cost,” Medical Care 43, no. 6 (2005): 521–530.
36M.C. Roebuck, et al., “Medical Adherence Leads to Lower Health Care Use and Costs Despite Increased Drug Spending,” Health Affairs 30, no. 1 (2011): 91–99.
37Alzheimer’s Association, Changing the Trajecto-ry of Alzheimer’s Disease: A National Imperative (Chicago: Alzheimer’s Association, May 2010), http://www.alz.org/documents_custom/ trajectory.pdf (accessed 5 December 2011).
DiabetesPatientsCanAvoidPainful,CostlyAlternatives
Control of diabetes is possible today with proper treatment, often including medicines. Of the 24 million Americans who have diabetes, only 6 million have their diabetes under control.39 We know that uncontrolled diabetes leads to many complications, including blindness, amputations, kidney failure, heart attacks, and stroke. In addition to the terrible human toll associated with these outcomes, the avoidable financial costs are enormous. For example, the average cost of amputation surgery is nearly $40,000.40 A single year of dialysis for kidney failure patients costs $83,000,41 and a hospital stay following a heart attack averages $31,000.42 In contrast, a year’s supply of the medicines that can help a patient avoid these outcomes typically runs about $2,400.43
ControllingAsthmainChildrenSavesCostlyERVisitsandParents’Productivity
Childhood asthma is controllable, but when not controlled often leads to serious asthma attacks that can put children in the hospital. While an asthma-related hospitalization can exceed $7,000,44 the annual cost of providing asthma control medications to children is $1,500.45 In addition to these medical costs, one-third of children’s caregivers miss work because of a child’s asthma.46 This is a particular hardship for low-income families,47 where the prevalence of childhood asthma is 60% greater than in high-income families. Yet medicines can make a huge difference. A recent study found that inner-city children with asthma who received appropriate controller medications were nearly 70% less likely to visit the emergency room, saving approximately $5,000 per child per year.48
Medicines Bring Value to patients—Clinically and economically
Ch
ap
ter
X

12 New Medicines: Changing Lives and Managing Health Care Costs
Ch
ap
ter
1
38Ibid.
39PhRMA analysis of data from National Health and Nutrition Examination Survey for 2003–2004 and 2005–2006, Centers for Disease Control and Prevention, National Diabetes Fact Sheet (Atlanta: CDC, 2007).
40Amputee Coalition, “Fact Sheet: Diabetes Lower Extremity Amputations,” 17 August 2009, http://www.amputee-coalition.org/fact_sheets/diabetes_leamp.html (accessed 2 February 2012).
41Thompson Reuters analysis of U.S. Renal Data System, USRDS 2010 Annual Data Report: Atlas of Chronic Kidney Disease and End-Stage Renal Disease in the United States (Bethesda, MD: National Institute of Diabetes and Digestive and Kidney Diseases, 2010).
42Thompson Reuters analysis of R.H. Chap-man, et al., “Determining initial and follow-up costs of cardiovascular events in a U.S. managed care population,” BMC Cardiovascular Disorders 11 (2011): 11.
43Thompson Reuters analysis of American Diabetes Association, “Economic Costs of Diabetes in the U.S. in 2007,”Diabetes Care 31, no. 3 (2008): 596–615; Erratum in: Diabetes Care 31, no. 6 (2008): 1271.
44Thompson Reuters analysis of R. Grant, et al., “Health Care Savings Attributable to Integrating Guidelines-based Asthma Care in the Pediatric Medical Home,” Journal of Health Care for the Poor and Underserved 21, suppl. 2 (2010): 82–92 and M. Ash and S. Brandt, “Disparities in Asthma Hospitalizations in Mas-sachusetts,” American Journal of Public Health 96 (2006): 358–362.
45Thompson Reuters analysis of R. Grant, et al., op. cit.
46E.W. Gelfand, “The Impact of Asthma on the Patient, the Family and Society,” Advanced Studies in Medicine 8, no. 3 (2008): 57–63.
47Centers for Disease Control and Prevention, “Vital Signs: Asthma Prevalence, Disease Characteristics, and Self-Management Educa-tion—United States, 2001–2009” Morbid-ity and Mortality Weekly Report 60 (2011): 547–552.
48Thompson Reuters analysis of R. Grant, et al., op. cit.

Contributing Strongly to the U.S. Economy Despite a Challenging Environment2
Contributing Strongly to the U.S. Economy Despite a Challenging Environment 1514 Contributing Strongly to the U.S. Economy Despite a Challenging Environment
Ch
ap
tEr
2
generate jobs in a broad range of other sectors—from construction to banking to food services to child care.3
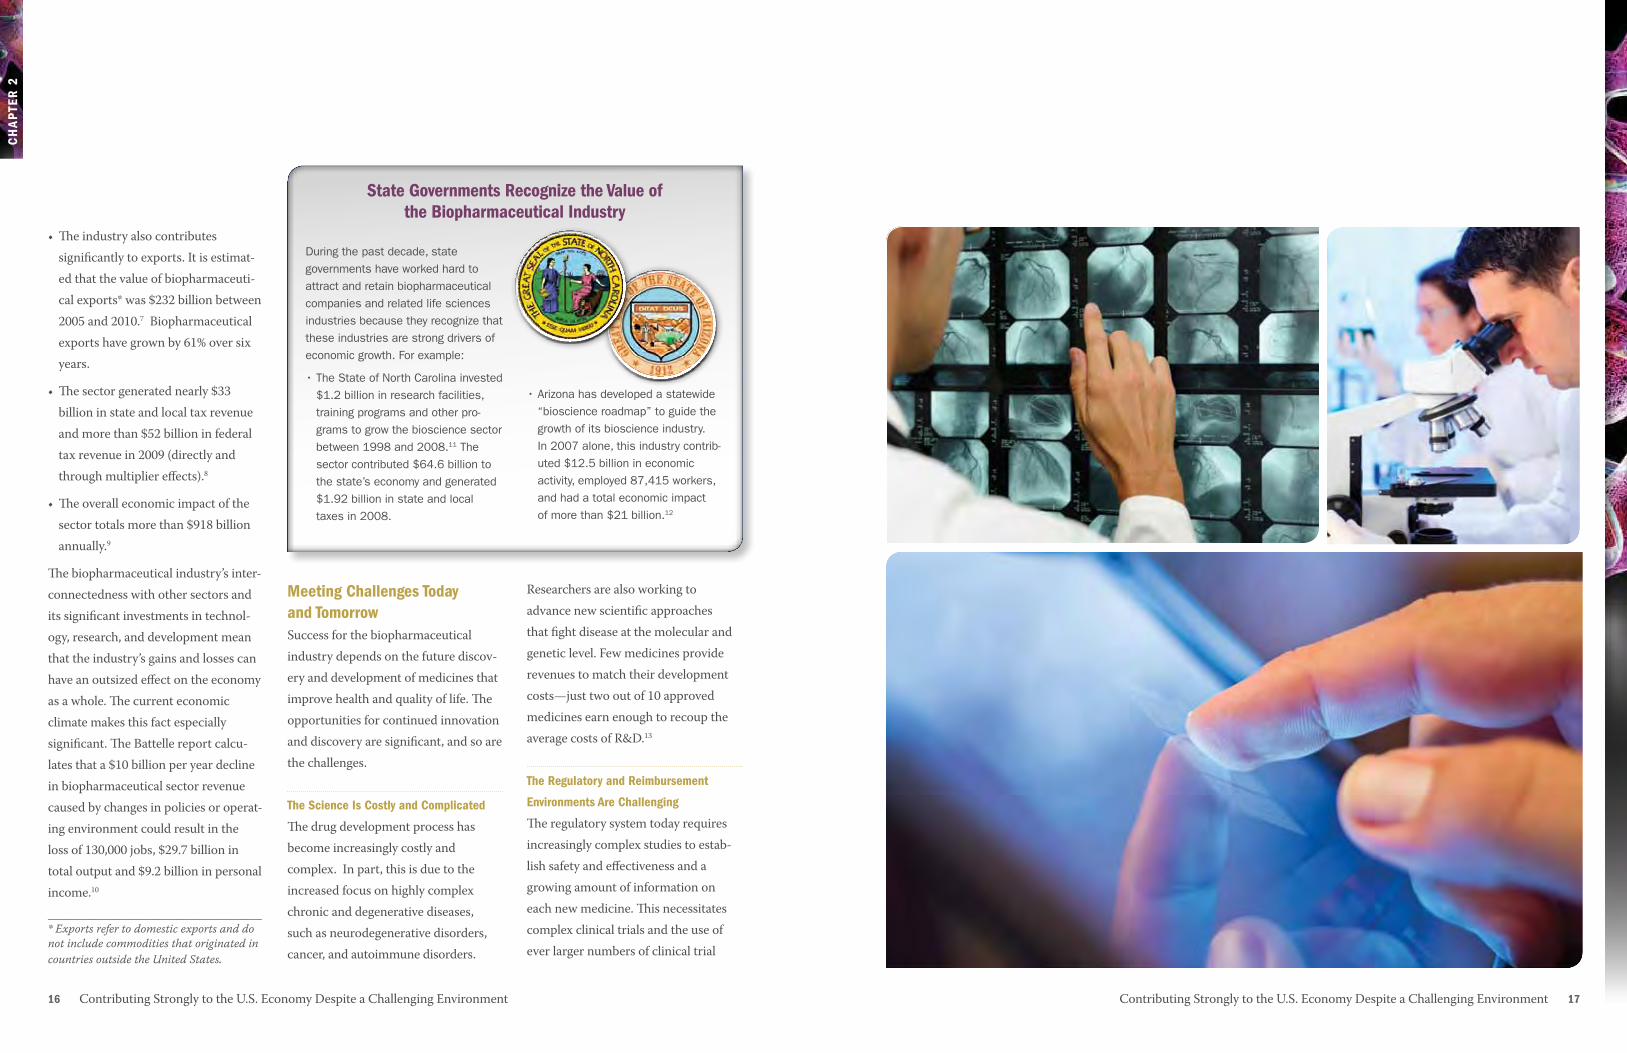
The Battelle analysis also found that the quality of jobs offered by the sec-tor is part of the reason the sector is a key driver within the U.S. economy. Across all occupations involved in the biopharmaceutical sector, the average wage is higher than across all other private-sector industries, due to the biopharmaceutical industry’s role as a “high value-added sector” that requires a workforce with specialized skills and education at all levels, from those of an entry-level technician to Ph.D. scien-tists. In 2009, the average total com-pensation per direct biopharmaceutical employee was $118,690, compared with $64,278 in the overall economy.4
Impact Beyond Jobs
The positive economic contributions of the biopharmaceutical industry are felt in many ways beyond the direct benefits of jobs:5
• Every dollar in output generated by the biopharmaceutical industry generates another $1.40 in output in other sectors of the economy.
•The industry’s broad partnerships and business relationships support businesses and their workers across the country, contributing to consumer spending in communities nationwide.
the biopharmaceutical industry is an American success story. Despite
a challenging economic and research environment, this sector stands out in its total economic impact. The industry directly and indirectly supported approximately 4 million U.S. jobs in 2009, including more than 650,000 direct jobs.1 Gains and losses in the bio-pharmaceutical sector cascade across many important economic sectors in the United States.
a Critical pillar of the U.S EconomyThe impact of biopharmaceutical com-panies extends far beyond the more than 650,000 jobs they directly provide. According to Battelle, the industry has a high multiplier, meaning that each sector job supports several additional jobs across the economy.2 Many of these jobs are in the larger biomedical research and innovation ecosystem of companies and services (see Figure 6). By providing the funding for research and development, as well as capital resources, technology licensing oppor-tunities, and an extensive market access and distribution system, the biophar-maceutical industry is the foundation of a broader ecosystem vital to the U.S. economy. In addition, by putting down roots in communities across the coun-try, biopharmaceutical companies also
Contributing Strongly to the U.S. Economy Despite a Challenging Environment
The U.S. biopharmaceutical
sector is “well recognized
as a dynamic and
innovative business sector
generating high quality jobs
and powering economic
output and exports for the
U.S. economy.”
Battelle technology PartnershiP Practice, July 20116
“Market
R&D Pipeline Supply Chain
Biopharmaceuticals Sector
Sustained public investment in medical research
Biopharma sector support and demand for innovation
Innovation at public, university and private-sector labs
Demand for new medicines to treat most challenging and costly diseases
Specialized professional services
Finance, insurance & real estate
General business services & supplies Partial supply chain listing
Instruments & analytical equipment
Computing & infomatics technologies
Clinical trials & regulatory support services
Chemical & biological inputs
Manufacturing technologies & equipment
Utilities and energy inputs
Contract manufacturing
Transportation & logistics services
Sales, advertising & marketing services
Private capital investment
Internal biopharma sector R&D
New biopharma business start-ups, tech transfer
and in-licensing
Pharma capital investment
External innovation ecosystem
Figure 6: The Biopharmaceutical Sector Is the Foundation of a Dynamic Innovation and Business Ecosystem
Figure 6: The Biopharmaceutical Sector Is a Vital Part of a Dynamic Innovation and Business Ecosystem
SOURCE: Battelle Technology Partnership Practice, The U.S. Biopharmaceuticals Sector: Economic Contribution of the Nation (Columbus, OH: Battelle Memorial Institute, July 2011), prepared for the Pharmaceutical Research and Manufacturers of America.
Ch
ap
tEr
2
16 Contributing Strongly to the U.S. Economy Despite a Challenging Environment Contributing Strongly to the U.S. Economy Despite a Challenging Environment 17
During the past decade, state governments have worked hard to attract and retain biopharmaceutical companies and related life sciences industries because they recognize that these industries are strong drivers of economic growth. For example:
•The State of North Carolina invested $1.2 billion in research facilities, training programs and other pro-grams to grow the bioscience sector between 1998 and 2008.11 The sector contributed $64.6 billion to the state’s economy and generated $1.92 billion in state and local taxes in 2008.
State Governments recognize the Value of the Biopharmaceutical Industry
•The industry also contributes significantly to exports. It is estimat-ed that the value of biopharmaceuti-cal exports* was $232 billion between 2005 and 2010.7 Biopharmaceutical exports have grown by 61% over six years.
•The sector generated nearly $33 billion in state and local tax revenue and more than $52 billion in federal tax revenue in 2009 (directly and through multiplier effects).8
•The overall economic impact of the sector totals more than $918 billion annually.9
The biopharmaceutical industry’s inter-connectedness with other sectors and its significant investments in technol-ogy, research, and development mean that the industry’s gains and losses can have an outsized effect on the economy as a whole. The current economic climate makes this fact especially significant. The Battelle report calcu-lates that a $10 billion per year decline in biopharmaceutical sector revenue caused by changes in policies or operat-ing environment could result in the loss of 130,000 jobs, $29.7 billion in total output and $9.2 billion in personal income.10 __________________________________* Exports refer to domestic exports and do not include commodities that originated in countries outside the United States.
Meeting Challenges today and tomorrowSuccess for the biopharmaceutical industry depends on the future discov-ery and development of medicines that improve health and quality of life. The opportunities for continued innovation and discovery are significant, and so are the challenges.
the Science Is Costly and Complicated
The drug development process has become increasingly costly and complex. In part, this is due to the increased focus on highly complex chronic and degenerative diseases, such as neurodegenerative disorders, cancer, and autoimmune disorders.
Researchers are also working to advance new scientific approaches that fight disease at the molecular and genetic level. Few medicines provide revenues to match their development costs—just two out of 10 approved medicines earn enough to recoup the average costs of R&D.13
the regulatory and reimbursement
Environments are Challenging
The regulatory system today requires increasingly complex studies to estab-lish safety and effectiveness and a growing amount of information on each new medicine. This necessitates complex clinical trials and the use of ever larger numbers of clinical trial
•Arizona has developed a statewide “bioscience roadmap” to guide the growth of its bioscience industry. In 2007 alone, this industry contrib-uted $12.5 billion in economic activity, employed 87,415 workers, and had a total economic impact of more than $21 billion.12

Contributing Strongly to the U.S. Economy Despite a Challenging Environment 1918 Contributing Strongly to the U.S. Economy Despite a Challenging Environment
Ch
ap
tEr
2
the Growth of the Biopharmaceutical Industry around the World
In recent years, a number of countries have made impressive advances in their biomedical research sectors. These advances have been nurtured through multiyear plans, which have led to laws and policies to support the research sector, tax changes to spur R&D investment, scholarship programs to attract top talent, and venture capital investments. A few examples from around the world illustrate this new activity:
Singapore’s significant biopharmaceutical sector contributed almost $3.2 billion to its economy in 2007, an increase of 230% since the beginning of the decade. Singapore’s current focus is on ex-panding its biologics manufacturing capacity, and to that end, the country has concentrated
on workforce development, R&D expansion, engagement of industry leaders, and support for emerging businesses that can commercialize new discoveries.
South Africa aims to move its economy from “farmer to pharma” by creating opportunities to help researchers take advantage of the country’s rich biodiversity. Its strategy is focused on drug dis-covery, especially research to address prevalent diseases, such as HIV/AIDS, tuberculosis, and
malaria. South Africa also has pursued vigorous efforts to de-velop international collaborations with U.S. and European firms.
The United Kingdom accounts for about 20% of European biopharmaceutical R&D spending.14 Only the United States and Japan invest more in biophar-maceutical R&D. In 2010, the UK re-released the Life Sciences Blueprint, a comprehensive strategy to make the country a global leader
in the life sciences.15 The plan includes calls for building translational research excellence and adopting tax policies to encourage research. China has increased its R&D investment by 10% each year for
the last 10 years. It is estimated that China’s R&D will reach $154 billion in 2011, making it second only to the United States in terms of total R&D investment. The most recent five-year plan, released in early 2011,16 defines
biotechnology as one of seven strategic industries for further development, and the latest “Medium- to Long-Term Plan for the Development of Science and Technology,” covering 2006 through 2020, includes biotechnology as one of eight frontier technologies. The country is trying to reverse “brain drain” across scientific disciplines by offering Chinese researchers around the world prestigious positions within the country.
We are confident that we have the human and
infrastructural capacity to reach our goal of
becoming one of the top three emerging economies
in the global pharmaceutical industry.” naledi Pandor, south african Minister of science
and technology (2010)17“
participants. Patient recruitment and retention in trials is a continual chal-lenge. (See sidebar, “Developing New Drugs Is Becoming More Challenging,” on page 33.) At the same time, pay-ers use tools, such as tiered co-pays, formularies, prior authorization, step therapy, reduced coverage, and finan-cial incentives to restrain use of brand-name medicines and encourage the use of generics.
Global Competition Is Intense
Beginning in the 1980s, the U.S. bio-pharmaceutical industry emerged as the leader in biomedical innovation, surpassing European countries, which had previously been the dominant global players.19 The rise of the U.S. industry resulted from public poli-cies that encourage strong intellectual property protections (including patents and data exclusivity), favorable eco-nomic conditions, and top-tier research universities that were able to attract scientific talent from around the world.20 While the United States has been the dominant leader in biophar-maceutical research for the last several decades, countries around the world are vying to become the next world leader in biopharmaceutical R&D, investing heavily in their own biopharmaceutical industries. (See sidebar, page 18.)
the U.S. Biopharmaceutical Industry Is rising to Its ChallengesThe U.S. biopharmaceutical industry is responding and adapting to these challenges in a variety of ways. For example, companies are increasingly focused on targeting the greatest unmet needs in diseases such as Alzheimer’s, cancer, and Parkinson’s, and are making a strong push to advance new frontiers such as personalized medicine.
These responses, combined with posi-tive, forward-looking public policies that sustain a market-based system and incentives for innovators, such as strong intellectual property protec-tions, will do much to ensure America’s continued role as the worldwide leader in biopharmaceutical research. To foster innovation and the medical advances and economic impact that go with it, we must:
•Continue to advance regulatory science and foster the integration of emerging scientific data and innova-tive approaches into the development and review of new medicines more efficiently, promoting public health in areas such as biomarkers, pharmacogenomics and rare and orphan drug development.
The UK life sciences industry
is a high-tech and innovative
industry which is vital to the
economic prosperity and
growth of the UK. Life sciences
businesses will help us to meet
the big societal challenges of
our age from addressing the
needs of an ageing population
through developing advanced
diagnostics and medicines, to
improving our sustainability
and ability to feed a growing
population.” david Willetts, uK Minister of state for universities and science, dePartMent of Business, innovation and sKills, annual uPdate on the Bioscience & health technology dataBase18
“
20 Contributing Strongly to the U.S. Economy Despite a Challenging Environment
11Battelle Technology Partnership Practice, 2010 Evidence and Opportunity: Biotechnol-ogy Impacts in North Carolina (Columbus, OH: Battelle Memorial Institute, September 2010).
12Battelle Technology Partnership Practice, A Report On: The Impact of the Arizona Biosciences Sector (Columbus, OH: Battelle Memorial Institute, July 2011).
13J.A. Vernon, J.H. Golec, and J.A. DiMasi, “Drug Development Costs When Financial Risk is Measured Using the Fama-French Three-Factor Model,” Health Economics Letters 19, no. 8 (2010): 1002–1005.
14 The Pharmaceutical Industry in Figures, 2010 Edition, The European Federation of Pharmaceutical Industries and Associa-tions, http://www.efpia.eu/content/default.asp?PageID=559&DocID=9158 (accessed 15 September 2011).
15HM Government, Office for Life Sciences, Life Sciences 2010: Delivering the Blueprint (January 2010).
1Battelle Technology Partnership Practice, The U.S. Biopharmaceuticals Sector: Eco-nomic Contribution to the Nation (Columbus, OH: Battelle Memorial Institute, July 2011), prepared for the Pharmaceutical Research and Manufacturers of America.
2Ibid.
3Ibid.
4Ibid.
5Ibid.
6Ibid.
7U.S. International Trade Commission Trade Data database, http://dataweb.usitc.gov.
8Battelle Technology Partnership Practice, op. cit.
9Battelle Technology Partnership Practice, op. cit.
10Battelle Technology Partnership Practice, op. cit.
Ch
ap
tEr
2
•Advance medical innovation policies as a solution to health system prob-lems. For example, to help realize the potential of medical innovation as a solution for improving patient out-comes and controlling rising health care costs, it is important to recog-nize across all policy areas that the
full value of medical advances emerges over time, and to support the ability of physicians and patients to choose from the full range of medically appropriate treatment options.
• Support coverage and reimbursement policies that foster the introdution and availability of new medical advances.
• Support the development of workers in the fields of science, technology, engineering, and mathematics as a highly skilled workforce is central to the nation’s ability to develop and manufacture tomorrow’s new treatments.
• Support strong intellectual property rights and enforcement in the United States and abroad.
• Sustain U.S. global leadership in the biosciences through economic, trade, and related policies to promote a level playing field globally.
16KPMG China, China’s 12th Five-Year Plan: Overview (March 2011), http://www.kpmg.com/CN/en/IssuesAndInsights/ ArticlesPublications/Publicationseries/ 5-years-plan/Documents/China-12th-Five-Year-Plan-Overview-201104.pdf (accessed 6 February 2012). 17Department of Science and Technology, Annual Report 2009/2010 (Pretoria: DST, 2010), p. 5–6. 18Strength and Opportunity: The Landscape of the Medical Technology, Medical Biotech-nology and Industrial Biotechnology Sectors in the UK, Annual Update, December 2010, http://www.bis.gov.uk/assets/biscore/business-sectors/docs/s/10-p90-strength-and-opportunity-bioscience-and-health- technology-sectors.pdf (accessed 2 May 2011).
19R.C. DeVol, A. Bedroussian, and B. Yeo, The Global Biomedical Industry: Preserving U.S. Leadership (Santa Monica, CA: Milken Institute, September 2011).
20Ibid.

Bringing Medicines to Patients in Need 3
Bringing Medicines to Patients in Need 2322 Bringing Medicines to Patients in Need
Ch
aP
ter
3
the biopharmaceutical industry is committed to ensuring that medi-
cines are available to all patients who need them to prevent and treat disease. Two primary avenues for ensuring comprehensive access to medicines in the United States are the Medicare prescription drug benefit, or Part D, and the Partnership for Prescription Assistance (PPA). Providing compre-hensive and accurate information about medicines to patients and health care providers also is an important aspect of ensuring that patients get the medicines they need.
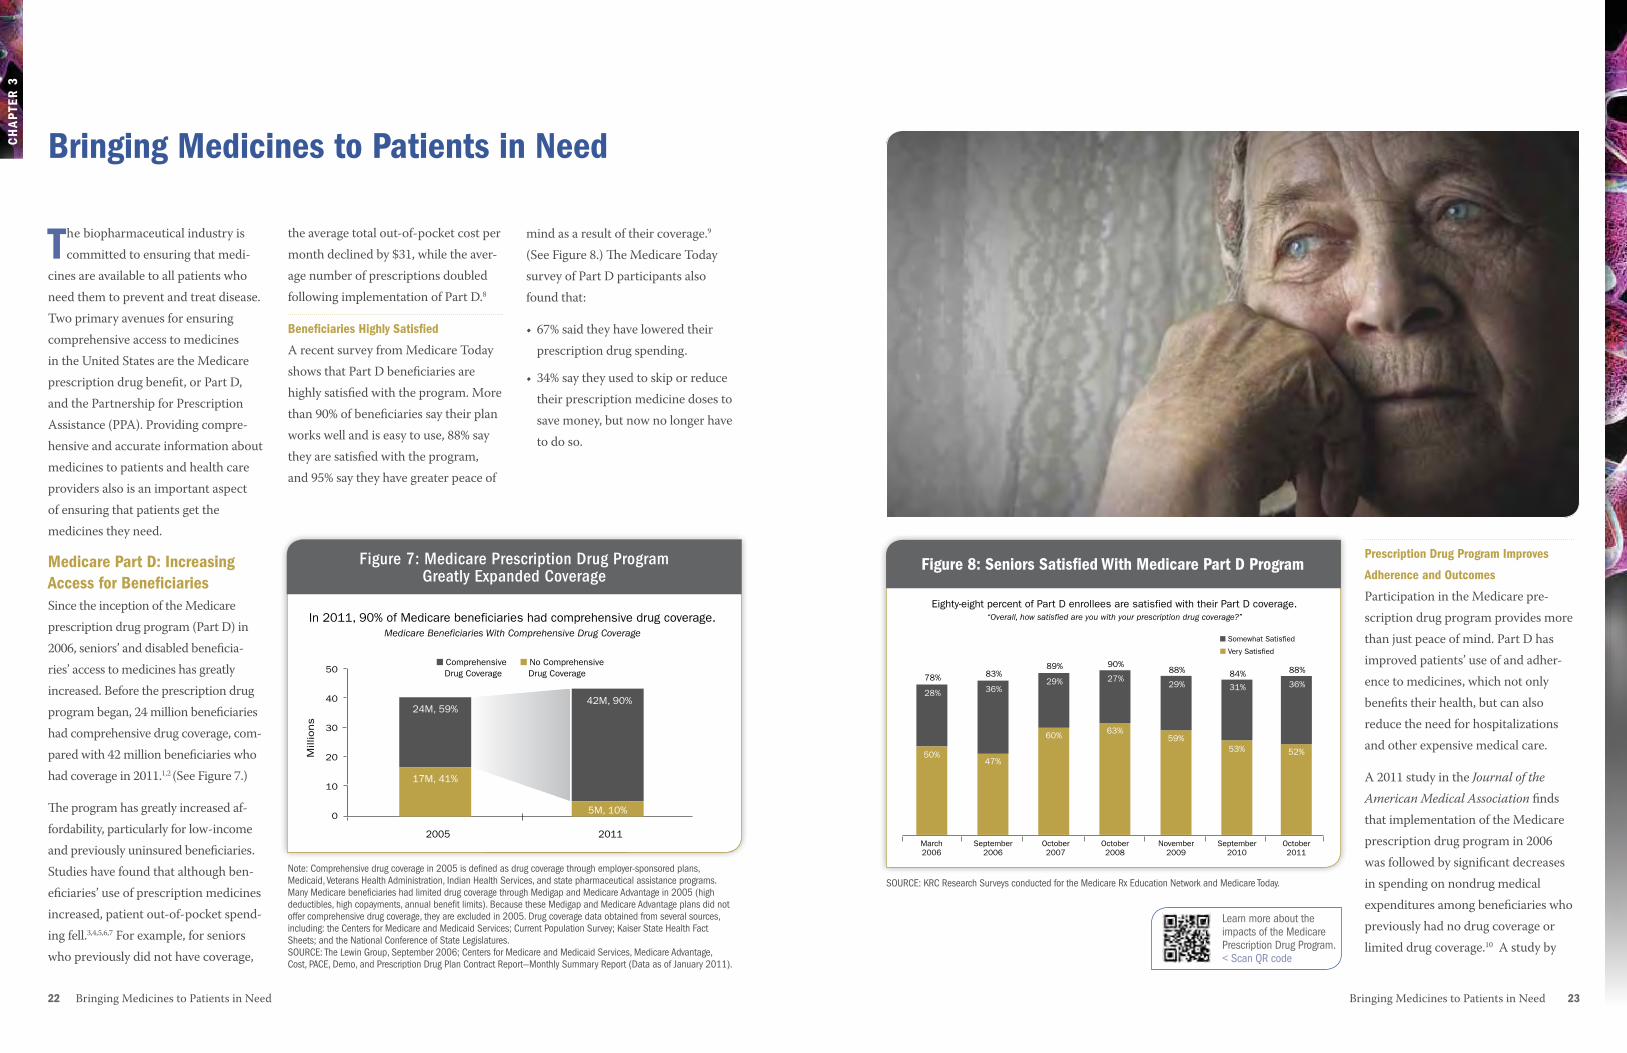
Medicare Part D: Increasing access for BeneficiariesSince the inception of the Medicare prescription drug program (Part D) in 2006, seniors’ and disabled beneficia-ries’ access to medicines has greatly increased. Before the prescription drug program began, 24 million beneficiaries had comprehensive drug coverage, com-pared with 42 million beneficiaries who had coverage in 2011.1,2 (See Figure 7.) The program has greatly increased af-fordability, particularly for low-income and previously uninsured beneficiaries. Studies have found that although ben-eficiaries’ use of prescription medicines increased, patient out-of-pocket spend-ing fell.3,4,5,6,7 For example, for seniors who previously did not have coverage,
the average total out-of-pocket cost per month declined by $31, while the aver-age number of prescriptions doubled following implementation of Part D.8
Beneficiaries highly Satisfied
A recent survey from Medicare Today shows that Part D beneficiaries are highly satisfied with the program. More than 90% of beneficiaries say their plan works well and is easy to use, 88% say they are satisfied with the program, and 95% say they have greater peace of
mind as a result of their coverage.9 (See Figure 8.) The Medicare Today survey of Part D participants also found that:
• 67% said they have lowered their prescription drug spending.
• 34% say they used to skip or reduce their prescription medicine doses to save money, but now no longer have to do so.
Bringing Medicines to Patients in Need
2005 2011
50
40
30
20
10
0
In 2011, 90% of Medicare beneficiaries had comprehensive drug coverage.Medicare Beneficiaries With Comprehensive Drug Coverage
Mill
ions
Figure 7: Medicare Prescription Drug Program Greatly Expanded Coverge
24M, 59%42M, 90%
5M, 10%
17M, 41%
■ Comprehensive Drug Coverage
■ No Comprehensive Drug Coverage
Figure 8: Seniors Satisfied With Medicare Part D Program
Eighty-eight percent of Part D enrollees are satisfied with their Part D coverage.“Overall, how satisfied are you with your prescription drug coverage?”
Figure 8: Seniors Satisfied with Medicare Part D Program
24M, 59%■ Somewhat Satisfied
■ Very Satisfied
March 2006
September 2006
October2007
October2008
November2009
September 2010
October2011
50%
78%
47%
83%
60%
89%
63%
90%
59%
88%
53%
84%
52%
88%
28% 36%29% 27%
29% 31% 36%
Prescription Drug Program Improves
adherence and Outcomes
Participation in the Medicare pre-scription drug program provides more than just peace of mind. Part D has improved patients’ use of and adher-ence to medicines, which not only benefits their health, but can also reduce the need for hospitalizations and other expensive medical care.
A 2011 study in the Journal of the American Medical Association finds that implementation of the Medicare prescription drug program in 2006 was followed by significant decreases in spending on nondrug medical expenditures among beneficiaries who previously had no drug coverage or limited drug coverage.10 A study by
Figure 7: Medicare Prescription Drug Program Greatly Expanded Coverage
Note: Comprehensive drug coverage in 2005 is defined as drug coverage through employer-sponsored plans, Medicaid, Veterans Health Administration, Indian Health Services, and state pharmaceutical assistance programs. Many Medicare beneficiaries had limited drug coverage through Medigap and Medicare Advantage in 2005 (high deductibles, high copayments, annual benefit limits). Because these Medigap and Medicare Advantage plans did not offer comprehensive drug coverage, they are excluded in 2005. Drug coverage data obtained from several sources, including: the Centers for Medicare and Medicaid Services; Current Population Survey; Kaiser State Health Fact Sheets; and the National Conference of State Legislatures. SOURCE: The Lewin Group, September 2006; Centers for Medicare and Medicaid Services, Medicare Advantage, Cost, PACE, Demo, and Prescription Drug Plan Contract Report—Monthly Summary Report (Data as of January 2011).
SOURCE: KRC Research Surveys conducted for the Medicare Rx Education Network and Medicare Today.
2005 2011
50
40
30
20
10
0
In 2011, 90% of Medicare beneficiaries had comprehensive drug coverage.Medicare Beneficiaries With Comprehensive Drug Coverage
Mill
ions
Figure 7: Medicare Prescription Drug Program Greatly Expanded Coverge
24M, 59%42M, 90%
5M, 10%
17M, 41%
■ Comprehensive Drug Coverage
■ No Comprehensive Drug Coverage
Learn more about the impacts of the Medicare Prescription Drug Program.< Scan QR code
Ch
aP
ter
X
afford them. Since 2005, the Partner-ship for Prescription Assistance has provided a central point of access for assistance programs.
PPA offers financially struggling patients a single point of access to information about 475 patient assistance programs, almost 200 of which are sponsored by biopharmaceutical companies.14 More than 2,500 brand-name and generic medicines are available through these programs.
24 Bringing Medicines to Patients in Need Bringing Medicines to Patients in Need 25
Ch
aP
ter
3
A follow-up study by the same authors found that the number of avoidable hospitalizations declined by at least 1,000 in more than half the U.S. states, and seven states had declines of 2,500 or more.13
the Partnership for Prescription assistance
Biopharmaceutical companies have a long history of providing access to medicines to patients who cannot
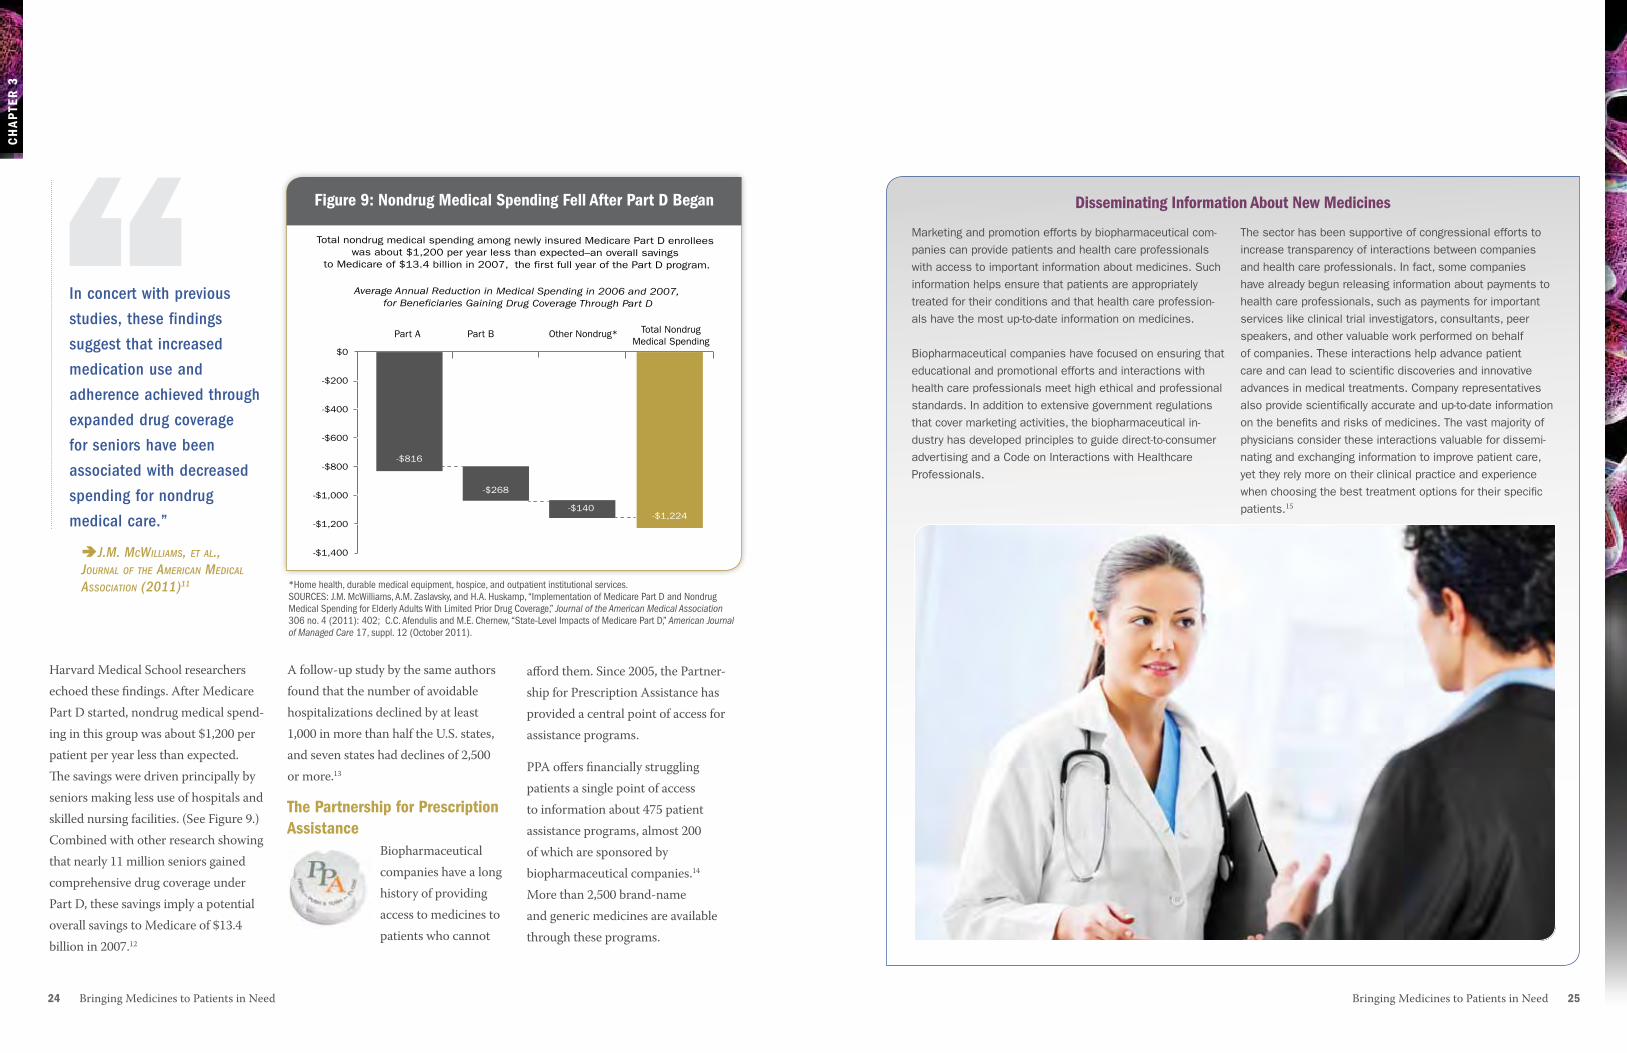
Harvard Medical School researchers echoed these findings. After Medicare Part D started, nondrug medical spend-ing in this group was about $1,200 per patient per year less than expected. The savings were driven principally by seniors making less use of hospitals and skilled nursing facilities. (See Figure 9.) Combined with other research showing that nearly 11 million seniors gained comprehensive drug coverage under Part D, these savings imply a potential overall savings to Medicare of $13.4 billion in 2007.12
Marketing and promotion efforts by biopharmaceutical com-panies can provide patients and health care professionals with access to important information about medicines. Such information helps ensure that patients are appropriately treated for their conditions and that health care profession-als have the most up-to-date information on medicines.
Biopharmaceutical companies have focused on ensuring that educational and promotional efforts and interactions with health care professionals meet high ethical and professional standards. In addition to extensive government regulations that cover marketing activities, the biopharmaceutical in-dustry has developed principles to guide direct-to-consumer advertising and a Code on Interactions with Healthcare Professionals.
The sector has been supportive of congressional efforts to increase transparency of interactions between companies and health care professionals. In fact, some companies have already begun releasing information about payments to health care professionals, such as payments for important services like clinical trial investigators, consultants, peer speakers, and other valuable work performed on behalf of companies. These interactions help advance patient care and can lead to scientific discoveries and innovative advances in medical treatments. Company representatives also provide scientifically accurate and up-to-date information on the benefits and risks of medicines. The vast majority of physicians consider these interactions valuable for dissemi-nating and exchanging information to improve patient care, yet they rely more on their clinical practice and experience when choosing the best treatment options for their specific patients.15
Disseminating Information about New MedicinesFigure 9: Nondrug Medical Spending Fell after Part D Began
*Home health, durable medical equipment, hospice, and outpatient institutional services. SOURCES: J.M. McWilliams, A.M. Zaslavsky, and H.A. Huskamp, “Implementation of Medicare Part D and Nondrug Medical Spending for Elderly Adults With Limited Prior Drug Coverage,” Journal of the American Medical Association 306 no. 4 (2011): 402; C.C. Afendulis and M.E. Chernew, “State-Level Impacts of Medicare Part D,” American Journal of Managed Care 17, suppl. 12 (October 2011).
$0
-$200
-$400
-$600
-$800
-$1,000
-$1,200
-$1,400
Total nondrug medical spending among newly insured Medicare Part D enrollees was about $1,200 per year less than expected–an overall savings
to Medicare of $13.4 billion in 2007, the first full year of the Part D program.
Average Annual Reduction in Medical Spending in 2006 and 2007, for Beneficiaries Gaining Drug Coverage Through Part D
Figure 9: Nondrug Medical Spending Fell After Part D Began
Part A Part B Other Nondrug* Total Nondrug Medical Spending
-$816
-$268
-$140-$1,224
In concert with previous
studies, these findings
suggest that increased
medication use and
adherence achieved through
expanded drug coverage
for seniors have been
associated with decreased
spending for nondrug
medical care.”
J.M. McWilliaMs, et al., Journal of the aMerican Medical association (2011)11
“
26 Bringing Medicines to Patients in Need
Ch
aP
ter
3
6W. Yin, et al., “The Effect of the Medicare Part D Prescription Benefit on Drug Utiliza-tion and Expenditures,” Annals of Internal Medicine 148, no.3 (2008): 1–14.
7F. Lichtenberg and S.X. Sun, “The Impact of Medicare Part D on Prescription Drug Use by the Elderly,” Health Affairs 26, no. 6 (2007): 1735–1744.
8Amundsen Group, Verispan Longitudinal Data, analysis for PhRMA, May 2008.
9Medicare Today, Seniors’ Opinions About Medicare Rx: Sixth Year Update (Washing-ton, DC: KRC Research, October 2011), http://www.medicaretoday.org/Oct%202011%20KRC%20Medicare%20Today%20Survey%20of%20Seniors%20with%20Medicare%20Rx%2010-14-11%20FINAL.pdf (accessed 31 October 2011).
10J.M. McWilliams, A.M. Zaslavsky, and H.A. Huskamp, “Implementation of Medi-care Part D and Nondrug Medical Spend-ing for Elderly Adults With Limited Prior Drug Coverage,” Journal of the American Medical Association 306, no. 4 (2011): 402–409.
11Ibid.
1The Lewin Group, Beneficiary Choices in Medicare Part D and Plan Features in 2006 (Falls Church, VA: The Lewin Group, September 2006).
2Centers for Medicare and Medicaid Services, Medicare Advantage, Cost, PACE, Demo, and Prescription Drug Plan Contract Report—Monthly Summary Report (Data as of January 2011), http://www.cms.gov/MCRAdvPartDEnrolData/EP/ itemdetail.asp?filterType=none&filterByDID =-99&sortByDID=2&sortOrder= descending&itemID=CMS1243102&intNumPerPage=10.
3G.F. Joyce, et al., “Medicare Part D After 2 Years,” American Journal of Managed Care 15, no. 3 (2009): 536–544.
4M.G. Duggan and F.M. Scott Morton, “The Effect of Medicare Part D on Phar-maceutical Prices and Utilization,” NBER Working Paper W13917 (National Bureau of Economic Research, April 2008).
5J.D. Ketcham and K. Simon, “Medicare Part D’s Effects on Elderly Drug Costs and Utilization,” NBER Working Paper 14326 (National Bureau of Economic Research, September 2008).
12C.C. Afendulis and M.E. Chernew, “State-Level Impacts of Medicare Part D,” American Journal of Managed Care 17, suppl. 12 (October 2011).
13C.C. Afendulis, et al., “The Impact of Medicare Part D on Hospitalization Rates,” Health Services Research 46, no. 4 (2011): 1022–1038.
14Partnership for Prescription Assistance, Facts About PPA (web page), http://www.pparx.org/en/about_us/facts_about_ppa (accessed 29 January 2012).
15KRC Research, Survey of Physicians About Pharmaceutical Biotech Research Company Activities and Information: Nationally Representative Survey of 508 Physicians (Washington, DC: KRC, March 2011).
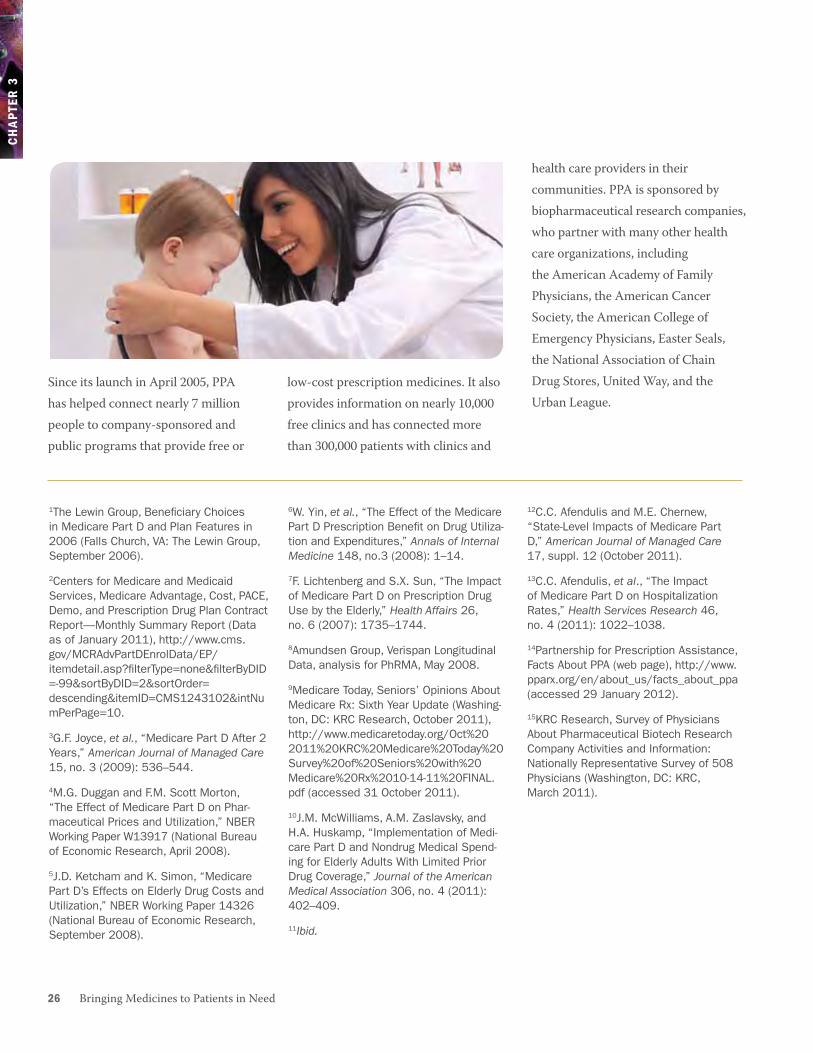
Since its launch in April 2005, PPA has helped connect nearly 7 million people to company-sponsored and public programs that provide free or
health care providers in their communities. PPA is sponsored by biopharmaceutical research companies, who partner with many other health care organizations, including the American Academy of Family Physicians, the American Cancer Society, the American College of Emergency Physicians, Easter Seals, the National Association of Chain Drug Stores, United Way, and the Urban League.
low-cost prescription medicines. It also provides information on nearly 10,000 free clinics and has connected more than 300,000 patients with clinics and
The R&D Process: The Road to New Medicines4
The R&D Process: The Road to New Medicines 2928 The R&D Process: The Road to New Medicines
Ch
aP
TeR
4
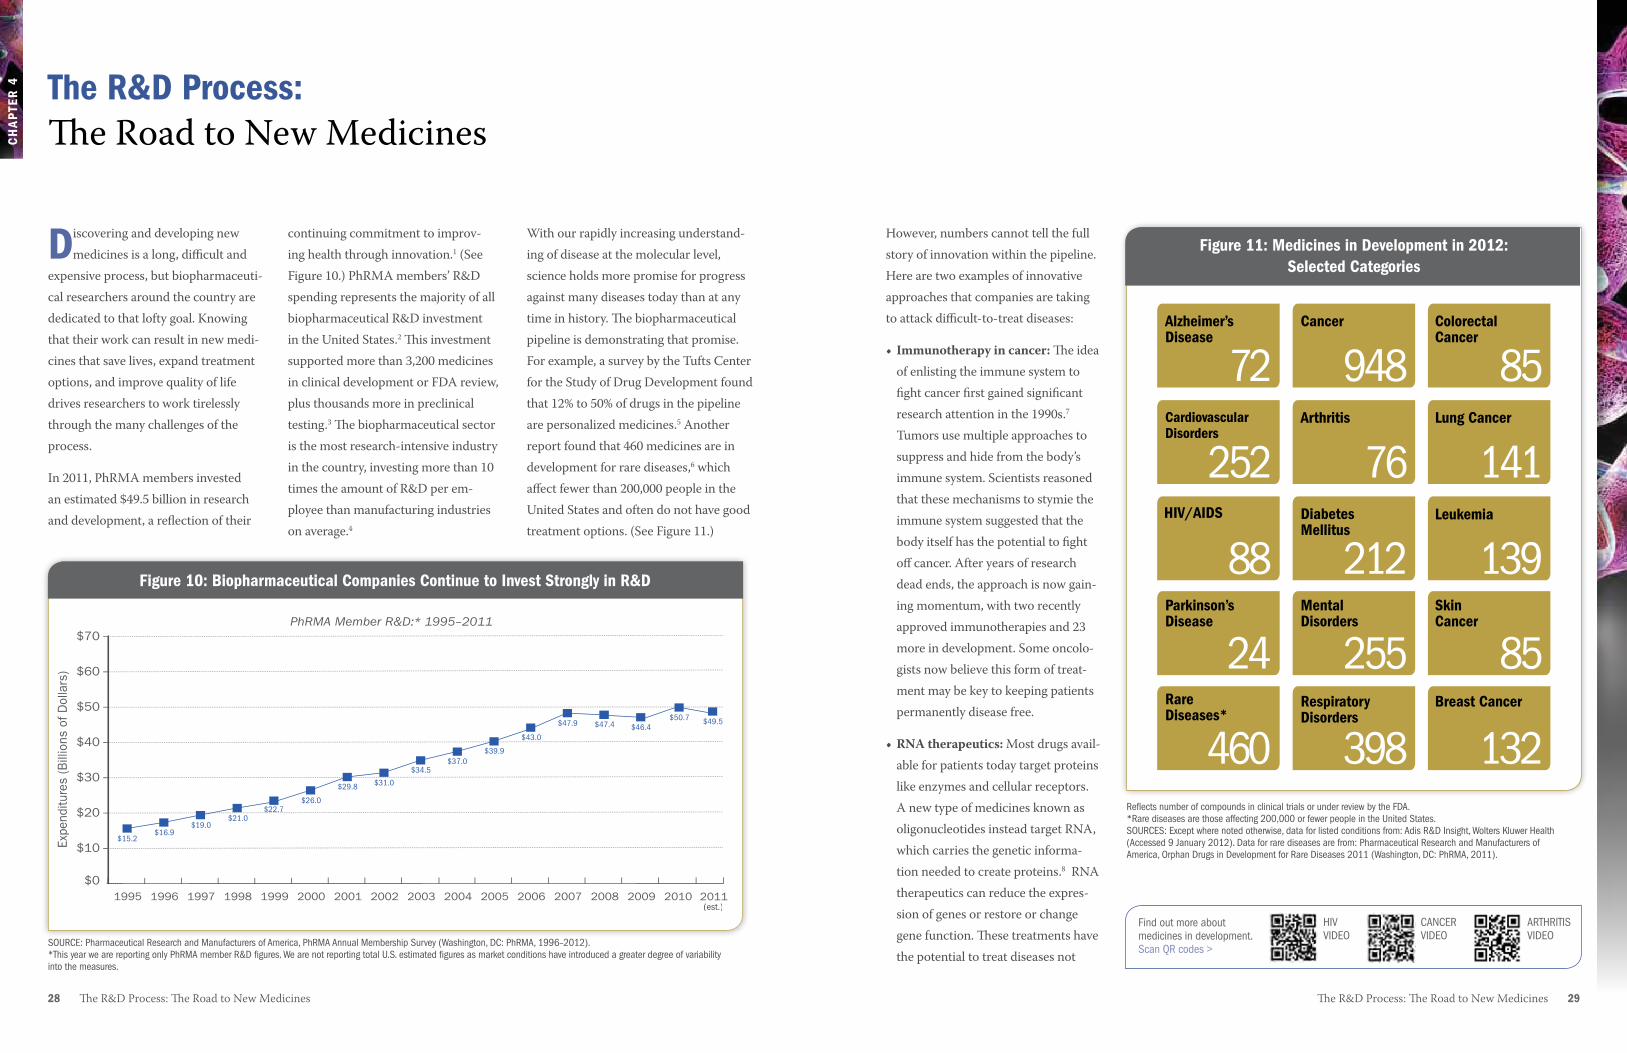
However, numbers cannot tell the full story of innovation within the pipeline. Here are two examples of innovative approaches that companies are taking to attack difficult-to-treat diseases:
• Immunotherapyincancer: The idea of enlisting the immune system to fight cancer first gained significant research attention in the 1990s.7 Tumors use multiple approaches to suppress and hide from the body’s immune system. Scientists reasoned that these mechanisms to stymie the immune system suggested that the body itself has the potential to fight off cancer. After years of research dead ends, the approach is now gain-ing momentum, with two recently approved immunotherapies and 23 more in development. Some oncolo-gists now believe this form of treat-ment may be key to keeping patients permanently disease free.
•RNAtherapeutics: Most drugs avail-able for patients today target proteins like enzymes and cellular receptors. A new type of medicines known as oligonucleotides instead target RNA, which carries the genetic informa-tion needed to create proteins.8 RNA therapeutics can reduce the expres-sion of genes or restore or change gene function. These treatments have the potential to treat diseases not
With our rapidly increasing understand-ing of disease at the molecular level, science holds more promise for progress against many diseases today than at any time in history. The biopharmaceutical pipeline is demonstrating that promise. For example, a survey by the Tufts Center for the Study of Drug Development found that 12% to 50% of drugs in the pipeline are personalized medicines.5 Another report found that 460 medicines are in development for rare diseases,6 which affect fewer than 200,000 people in the United States and often do not have good treatment options. (See Figure 11.)
continuing commitment to improv-ing health through innovation.1 (See Figure 10.) PhRMA members’ R&D spending represents the majority of all biopharmaceutical R&D investment in the United States.2 This investment supported more than 3,200 medicines in clinical development or FDA review, plus thousands more in preclinical testing.3 The biopharmaceutical sector is the most research-intensive industry in the country, investing more than 10 times the amount of R&D per em-ployee than manufacturing industries on average.4
Discovering and developing new medicines is a long, difficult and
expensive process, but biopharmaceuti-cal researchers around the country are dedicated to that lofty goal. Knowing that their work can result in new medi-cines that save lives, expand treatment options, and improve quality of life drives researchers to work tirelessly through the many challenges of the process.
In 2011, PhRMA members invested an estimated $49.5 billion in research and development, a reflection of their
The R&D Process: The Road to New Medicines
Figure 11: Medicines in Development in 2012: Selected CategoriesFigure 11: Medicines in Development in 2012: Selected Categories
Alzheimer’s Disease
72Arthritis
76
Cancer
948
Breast Cancer
132
CardiovascularDisorders
252DiabetesMellitus
212HIV/AIDS
88
Colorectal Cancer
85
MentalDisorders
255Parkinson’sDisease
24RespiratoryDisorders
398
Lung Cancer
141
RareDiseases*
460
Leukemia
139Skin Cancer
85
Reflects number of compounds in clinical trials or under review by the FDA. *Rare diseases are those affecting 200,000 or fewer people in the United States.SOURCES: Except where noted otherwise, data for listed conditions from: Adis R&D Insight, Wolters Kluwer Health (Accessed 9 January 2012). Data for rare diseases are from: Pharmaceutical Research and Manufacturers of America, Orphan Drugs in Development for Rare Diseases 2011 (Washington, DC: PhRMA, 2011).
Figure 10: Biopharmaceutical Companies Continue to Invest Strongly in R&D
$0
$10
$20
$30
$40
$50
$60
$70
2010 2011200920082007200620052004200320022001200019991998199719961995
Expe
nditu
res
(Bill
ions
of D
olla
rs)
$31.0
$34.5$37.0
$39.9
$43.0
$47.9 $47.4 $46.4$50.7 $49.5
$29.8
$26.0$22.7
$21.0$19.0
$16.9$15.2
Figure 10: Biopharmaceutical Companies Continue to Invest Strongly in R&DPhRMA Member R&D:* 1995–2011
(est.)
SOURCE: Pharmaceutical Research and Manufacturers of America, PhRMA Annual Membership Survey (Washington, DC: PhRMA, 1996–2012). *This year we are reporting only PhRMA member R&D figures. We are not reporting total U.S. estimated figures as market conditions have introduced a greater degree of variability into the measures.
Find out more about medicines in development.Scan QR codes >
CANCER VIDEO
HIV VIDEO
ARTHRITIS VIDEO
Ch
aP
TeR
4
ment with changes in the compound’s chemical structure to discover struc-tures that might make the compound more available, safe, and effective in the human body.
Even at this early stage, researchers begin to think about the final product, including its formulation (the recipe for making the medicine) and its delivery mechanism (whether it is taken by mouth, injection, inhaler, etc.).
Preclinical Testing
Having whittled thousands of potential compounds down to a few hundred, researchers begin the preclinical testing phase. They conduct many laboratory studies and tests in animals to deter-mine whether a candidate compound is suitable to be tested in humans.
30 The R&D Process: The Road to New Medicines The R&D Process: The Road to New Medicines 31
SOURCE: Pharmaceutical Research and Manufacturers of America, Drug Discovery and Development: Understanding the R&D Process, www.innovation.org.
treatable with existing medicines and are particularly promising for some genetic diseases. Two RNA thera-peutics have received approval and several more are currently in clinical trials.
Innovative approaches like these are plentiful throughout the development
pipeline, but the road to approval is long and difficult, with many setbacks and challenges. In fact, for every 5,000 to 10,000 compounds that enter the discovery pipeline, only five make it to clinical trials, and only one receives approval from the FDA.
The R&D ProcessThe R&D process for a new medicine is long and complex. Many steps are involved to thoroughly assess the safety and efficacy of each new medicine. In total, it takes about 10 to 15 years to go through the drug discovery and clinical development process and bring a
medicine to the market.9 The process is also costly—the average R&D invest-ment for each new medicine is $1.2 billion, including the cost of failures.10 Figure 12 shows the typical R&D process that potential new medicines must go through.
Drug Discovery
The first step of this stage involves basic studies that allow scientists to understand the disease as thoroughly as possible—its cause or causes, its natural development, and its impacts on the entire human body. This basic research can take many years, and builds on work by scientists all across academia, the government, and the biopharmaceutical industry.
Once scientists have a sufficient
understanding of the disease, they select a target for a potential medicine. A target is usually a molecule or gene that plays an important role in the dis-ease. Researchers then conduct studies in cells, tissues and in animal models to determine whether that target can be acted upon by a drug.
Next, researchers search for a promis-ing molecule—a lead compound—that could become a medicine. They do this in various ways, such as finding com-pounds from nature, creating mole-cules from scratch, using high-through-put screening, or using biotechnology to genetically engineer living systems to produce disease-fighting molecules. Lead compounds go through a series of safety tests. Teams of biologists and chemists also work together to experi-
Figure 12: The Research and Development Process
PR
E-D
ISC
OV
ERY
Drug Discovery Preclinical Clinical Trials FDA ReviewScale-Up to
Manufacturing
3–6 YEARS 6–7 YEARS
100–500 1,000–5,00020–100
PHASE 2 PHASE 3PHASE 1
IND
SU
BM
ITTE
D
ND
A S
UB
MIT
TED
NUMBER OF VOLUNTEERS
0.5–2 YEARS
ONE FDA-APPROVED
DRUG
5,000–10,000COMPOUNDS
250 5
INDEFINITE
Post-MarketingMonitoring and
Research
Developing a new medicine takes an average of 10–15 years.
Learn more about the ins and outs of drug discovery.
< Scan QR code
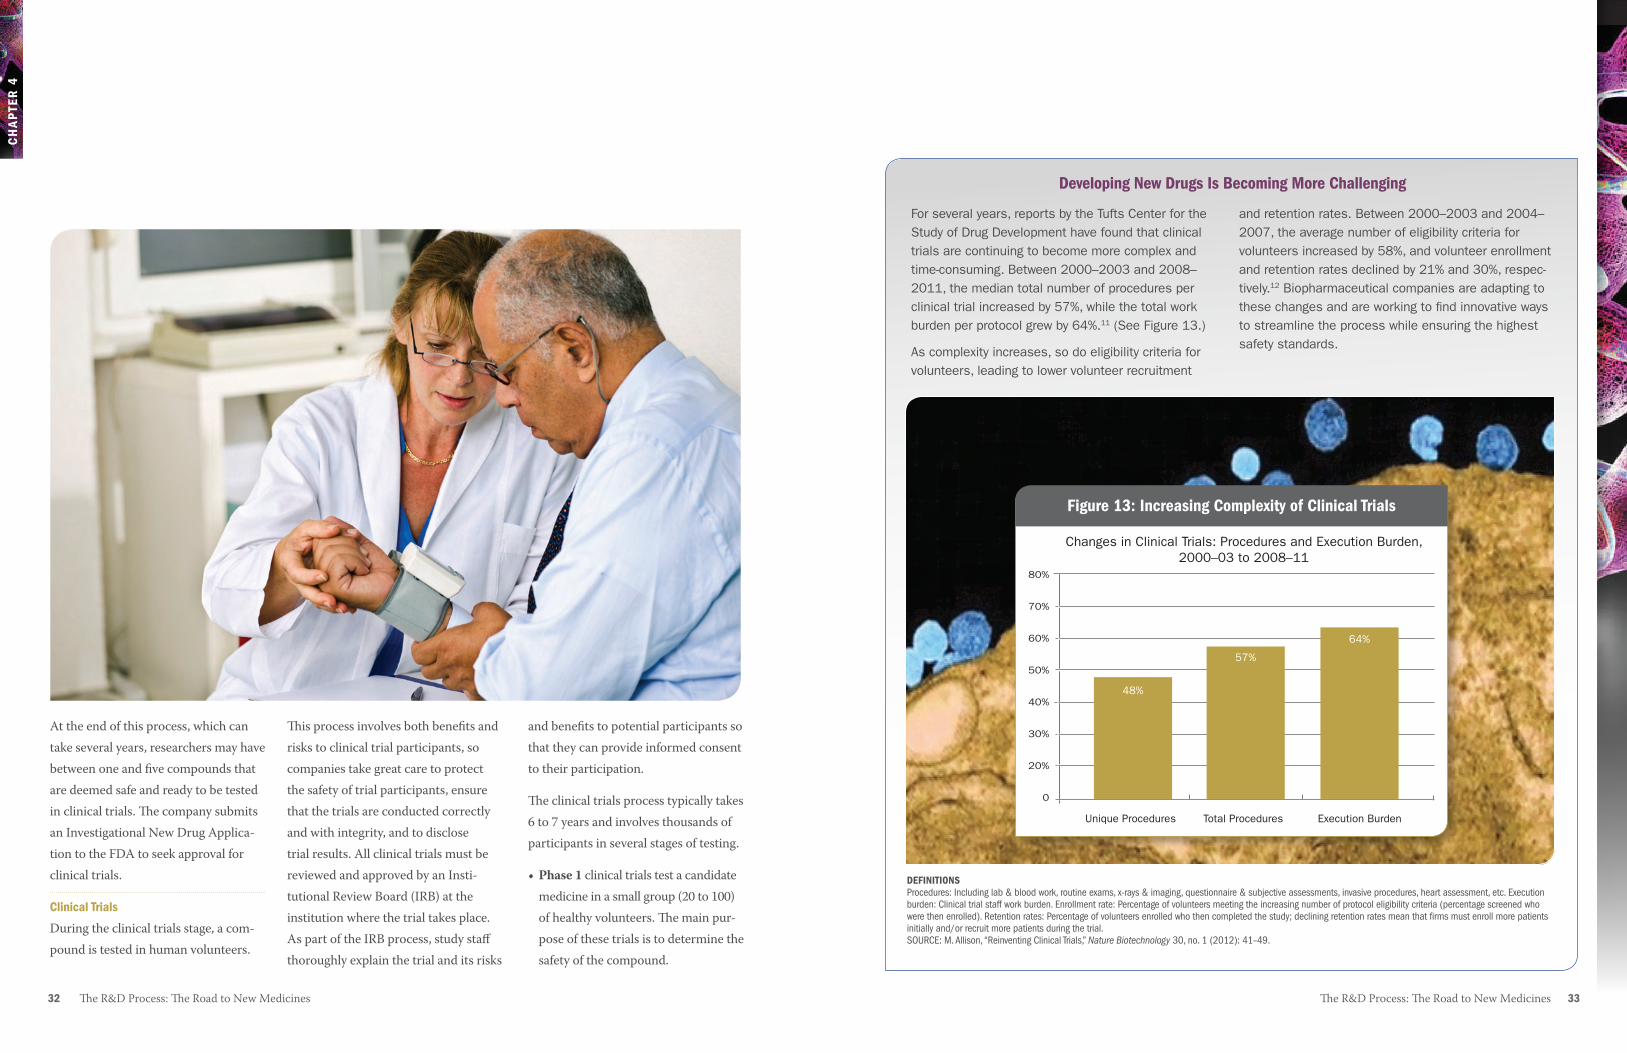
The R&D Process: The Road to New Medicines 3332 The R&D Process: The Road to New Medicines
CH
AP
TER
4
At the end of this process, which can take several years, researchers may have between one and five compounds that are deemed safe and ready to be tested in clinical trials. The company submits an Investigational New Drug Applica-tion to the FDA to seek approval for clinical trials.
Clinical Trials
During the clinical trials stage, a com-pound is tested in human volunteers.
This process involves both benefits and risks to clinical trial participants, so companies take great care to protect the safety of trial participants, ensure that the trials are conducted correctly and with integrity, and to disclose trial results. All clinical trials must be reviewed and approved by an Insti-tutional Review Board (IRB) at the institution where the trial takes place. As part of the IRB process, study staff thoroughly explain the trial and its risks
and benefits to potential participants so that they can provide informed consent to their participation.
The clinical trials process typically takes 6 to 7 years and involves thousands of participants in several stages of testing. • Phase1 clinical trials test a candidate
medicine in a small group (20 to 100) of healthy volunteers. The main pur-pose of these trials is to determine the safety of the compound.
For several years, reports by the Tufts Center for the Study of Drug Development have found that clinical trials are continuing to become more complex and time-consuming. Between 2000–2003 and 2008–2011, the median total number of procedures per clinical trial increased by 57%, while the total work burden per protocol grew by 64%.11 (See Figure 13.)
As complexity increases, so do eligibility criteria for volunteers, leading to lower volunteer recruitment
and retention rates. Between 2000–2003 and 2004–2007, the average number of eligibility criteria for volunteers increased by 58%, and volunteer enrollment and retention rates declined by 21% and 30%, respec-tively.12 Biopharmaceutical companies are adapting to these changes and are working to find innovative ways to streamline the process while ensuring the highest safety standards.
Developing New Drugs Is Becoming More Challenging
Figure 13: Increasing Complexity of Clinical Trials
Unique Procedures Total Procedures Execution Burden
80%
70%
60%
50%
40%
30%
20%
0
Changes in Clinical Trials: Procedures and Execution Burden,2000–03 to 2008–11
Figure 13: Increasing Complexity of Clinical Trials
48%
57%
64%
DEFINITIONSProcedures: Including lab & blood work, routine exams, x-rays & imaging, questionnaire & subjective assessments, invasive procedures, heart assessment, etc. Execution burden: Clinical trial staff work burden. Enrollment rate: Percentage of volunteers meeting the increasing number of protocol eligibility criteria (percentage screened who were then enrolled). Retention rates: Percentage of volunteers enrolled who then completed the study; declining retention rates mean that firms must enroll more patients initially and/or recruit more patients during the trial.SOURCE: M. Allison, “Reinventing Clinical Trials,” Nature Biotechnology 30, no. 1 (2012): 41–49.
34 The R&D Process: The Road to New Medicines The R&D Process: The Road to New Medicines 35
Ch
aP
TeR
4
•Phase2 clinical trials involve a larger group (100 to 500) of participants who have the disease or condition under study. These trials determine the effectiveness of the medicine, ex-amine possible short-term side effects and risks, and determine optimal dose and schedule.
•Phase3 clinical trials test the medi-cine in a much larger group (1,000 to 5,000) of people to generate statisti-cally significant information about safety, effectiveness, and the overall benefit-risk ratio of the medicine. These trials are the longest, and can take place at many sites across the country.
FDa Review
Once all the testing and clinical trials are complete, if results indicate that a new medicine is both safe and effective, a company submits a New Drug Ap-plication or Biologics License Applica-tion to the FDA to request approval to market the medicine. This application includes all the data from the relevant studies and trials, as well as propos-als for manufacturing and labeling the medicine.
The FDA carefully reviews these data and decides whether the medicine should be approved. Sometimes the FDA requires more research before
granting approval. The FDA may ask an independent panel of experts to con-sider data presented by the company and FDA representatives and advise the agency on whether to approve the ap-plication and under what conditions.
Manufacturing
An approved medicine may be used for many years by millions of people. Planning and scaling up facilities for manufacturing is a highly complicated, long-term undertaking. Even as early as the drug discovery phase, researchers must think about how to construct a compound so that it can be consistently and efficiently manufactured.
Manufacturing medicines on a large scale presents many challenges, some related to the nature of the medicine. Many new drugs are extremely com-plex compounds, and manufacturing them in large quantities requires great skill and expertise. To ensure that medicines are manufactured under the
highest quality standards, each facility must adhere to FDA regulations outlin-ing Good Manufacturing Practices (GMPs). GMPs are built on the under-lying premise that quality cannot be inspected or tested into a product, but must be built in every step of the way.13
In many cases, companies must build new facilities or overhaul existing facili-ties, because the manufacturing process for a new medicine can be very differ-ent from those for previous medicines.
Post-approval Research and Monitoring
The research process does not end when the FDA approves a medicine for manufacture. In fact, continued monitoring of a medicine as it is used by health care providers and patients in the marketplace provides criti-cally important information about the medicine’s safety and effectiveness and its long-term side effects. Companies are required to monitor a medicine as long as it is on the market, submitting periodic reports on safety issues and reporting any adverse events.
In some cases, the FDA requires a com-pany to conduct Phase 4 clinical trials. These trials often evaluate a medicine’s long-term safety or efficacy.
The nature of medical progress is that research builds on itself over time.
Personalized medicine has received a lot of attention in recent years, but in the past year new research and advances have shown that the approach is picking up steam:
•In 2011 we saw two new personalized medicines approved: one for patients with late-stage melanoma whose tumors express a gene mutation called BRAF V600E,14 and one for patients with late-stage non-small-cell lung cancer who express an abnormal anaplastic lymphoma kinase (ALK) gene.15 (See sidebar on new approvals in Chapter 1, page 5.)
• According to the Personalized Medicine Coalition, in 2006 there were 13 prominent examples of personal-ized medicine drugs, treatments and diagnostic products available; by 2011, 72 prominent examples were available for patients.16
• A recent study from the Tufts Center for the Study of Drug Development found a 75% increase in personalized medicine investment by biopharmaceutical companies in the past five years.17
The emergence of Personalized Medicine
Ch
aP
TeR
4
The R&D Process: The Road to New Medicines 37 36 The R&D Process: The Road to New Medicines
The Prescription Drug User Fee act
Twenty years ago, a New Drug Ap-plication review could take more than two years. Similar approvals in other countries took only months, and many patients around the world benefited from new medicines long before U.S. patients.
Passage of the 1992 Prescription Drug User Fee Act (PDUFA I) reversed that course. PDUFA authorized the FDA to collect user fees from biopharmaceuti-cal companies to hire additional drug reviewers and safety specialists. These funds are intended to supplement, but do not replace, Congressional appropri-ations. Since its initial passage, PDUFA has been reauthorized in 1997, 2002, and 2007.
PDUFA has had an enormous benefi-cial impact on the availability of needed new medicines by dramatically decreas-ing the time necessary for FDA review without compromising safety. In the 20 years since PDUFA began, the FDA has approved more than 1,500 new medi-cines, and the median approval time for review of new product applications has dropped from 29 months in the early 1990s to an estimated 13 months in fiscal year 2009.19
Pediatric Research Legislation
Historically, medicines prescribed to children were not studied in pediatric populations, resulting in insufficient or no information on dosing, safety, efficacy, and side effects. Significant disincentives existed for pediatric test-ing, including the high costs of trials in pediatric populations.
Growing recognition of the need for pediatric-specific information prompt-ed action. Congress enacted two laws—the Best Pharmaceuticals for Children Act (BPCA) and the Pediatric Research Equity Act (PREA)—to improve testing of medicines intended for the treatment of children.
BPCA, passed in 2002, provides
Companies often conduct continued research on approved medicines to better understand their full benefits and potential to address unmet medical needs. Research into potential uses in other indications, earlier in the disease process, or in combination with other medicines is common and important to medical progress.
PDUFa and Pediatric Research Legislation: Success Stories for PatientsEnsuring timely access to new medicines and the safety of patients who use them is of paramount importance. Two legisla-tive programs that are due for reauthori-zation in 2012 have played an important role in helping the FDA fulfill its core mission—to promote and protect public health and safety.
companies with economic incentives for pediatric research, including an additional six-month period of market exclusivity, known as pediatric exclusiv-ity, for conducting studies of drugs in children. PREA, passed in 2003, allows the FDA to require pediatric studies in certain New Drug Applications and Biologic License Applications that have been approved for existing adult indica-tions. Both laws were reauthorized in 2007, but are set to expire on October 1, 2012 unless reauthorized or made permanent by Congress.
As a result of these laws, a wealth of useful information now exists for administering drugs in children, includ-ing information on dosing, safety, and effectiveness. Prior to the passage of “Personalized medicine offers enormous potential to address
unmet medical needs of patients with cancer, HIV/AIDS, and
many other serious diseases. It also holds potential to help
us meet the challenge of rising health care costs by avoiding
treatment complications and making sure each patient gets
the most effective care possible.”
John J. Castellani, RemaRks to the PeRsonalized mediCine Coalition, 9 June 201118

The R&D Process: The Road to New Medicines 3938 The R&D Process: The Road to New Medicines
Ch
aP
TeR
4
Research conducted in government, universities, nonprofit research institu-tions, government laboratories, and medical schools plays a critical role in establishing the basic research founda-tion for subsequent drug development work. Small and large biopharmaceuti-cal companies then conduct the vast majority of research that leads to the development of new medicines.
To meet the challenges posed by an increasingly complex research environ-ment, biopharmaceutical companies are turning to a variety of new ap-proaches to spur innovation as well as continuing their commitment to in-house research. These approaches include large companies providing venture capital to small startup biotech firms, and companies entering into licensing agreements with other companies. Companies also are engaging in partnerships with academic institutions, which allows them to diversify their portfolios and access new technologies that can lead to a more efficient R&D process.
these two laws, approximately 70% of medicines used in children had been dispensed without adequate pediatric dosing information. However, as of 2008, an estimated 50% to 60% of pre-scription drugs used to treat children have now been studied in some part of the pediatric population.20 According to the FDA, the research conducted as a result of BPCA and PREA has led to 427 pediatric labeling changes since 1998.21 As of January 2012, 186 drugs have received pediatric exclusivity under BPCA.22
Collaboration and Innovation Go hand in handThe vibrant innovation that character-izes the biopharmaceutical sector relies on a collaborative life science ecosys-tem in the United States that is second to none.

40 The R&D Process: The Road to New Medicines
Ch
aP
TeR
4
1Pharmaceutical Research and Manufacturers of America, PhRMA Annual Membership Survey (Washington, DC: PhRMA, 2012). 2Burrill & Company, analysis for PhRMA, 31 January 2012. 3Adis R&D Insight database, accessed 10 February 2012.4PhRMA analysis based on N.D. Pham, The Im-pact of Innovation and the Role of Intellectual Property Rights on U.S. Productivity, Competi-tiveness, Jobs, Wages, and Exports (Washing-ton, DC: NDP Consulting, April 2010). 5Tufts Center for the Study of Drug Develop-ment, “Personalized Medicine Is Playing a Growing Role in Development Pipelines,” Impact Report 12, no.6 (2010). 6Pharmaceutical Research and Manufacturers of America, Orphan Drugs in Development for Rare Diseases 2011 (Washington, DC: PhRMA, 2011), http://www.phrma.org/sites/default/files/878/rarediseases2011.pdf.7T. Gryta, “Enlisting the Body to Fight Cancer,” Wall Street Journal, 14 June 2011, http://online.wsj.com/article/SB10001424052702304778304576377892911572686.html?mod=googlenews_wsj. 8R. Kole, A.R. Krainer, and S. Altman, “RNA Therapeutics: Beyond RNA Interference and Antisense Oligonucleotides,” Nature Reviews Drug Discovery 11, no. 2 (2012): 125–140. 9J.A. DiMasi, “New Drug Development in the United States from 1963 to 1999,” Clini-cal Pharmacology & Therapeutics 69, no. 5 (2001): 286–296; M. Dickson and J.P. Gagnon, “Key Factors in the Rising Cost of New Drug Discovery and Development,” Nature Reviews Drug Discovery 3 (May 2004): 417–429; J.A. DiMasi, R.W. Hansen, and H.G. Grabowski, “The Price of Innovation: New Estimates of Drug Development Costs,” Journal of Health Economics 22 (2003): 151–185. 10J.A. DiMasi and H.G. Grabowski, “The Cost of Biopharmaceutical R&D: Is Biotech Different?” Managerial and Decision Economics 28 (2007): 469–479. 11M. Allison, “Reinventing Clinical Trials,” Na-ture Biotechnology 30, no. 1 (2012): 41–49. 12Tufts Center for the Study of Drug Develop-ment, “Rising Protocol Complexity, Execution Burden Varies Widely by Phase and TA,” Impact Report 12, no. 3 (May/June 2010).
13Food and Drug Administration, Current Good Manufacturing Practice: Amendment of Certain Requirements for Finished Pharmaceuticals; Proposed Rule, 61 Fed. Reg. 20104, 20105 (May 3, 1996).14Food and Drug Administration, “FDA Approves New Treatment for a Type of Late-Stage Skin Cancer,” press release, 25 March 2011, http://www.fda.gov/NewsEvents/Newsroom/PressAnnouncements/ucm1193237.htm (accessed 26 October 2011). 15Food and Drug Administration, “FDA Approves Xalkori With Companion Diagnostic for a Type of Late-Stage Lung Cancer,” press release, 26 August 2011, http://www.fda.gov/ NewsEvents/Newsroom/ PressAnnouncements/ucm269856.htm (accessed 26 October 2011). 16Personalized Medicine Coalition, “Personal-ized Medicine by the Numbers,” (Washington, DC: PMC, November 2011), http://www. personalizedmedicinecoalition.org/sites/ default/files/files/PM_by_the_Numbers.pdf. 17Tufts Center for the Study of Drug Develop-ment, “Personalized Medicine Is Playing a Growing Role in Development Pipelines,” Impact Report 12, no. 6 (2010).18J.J. Castellani, keynote address at the Seventh Annual State of Personalized Medicine Luncheon hosted by the Personalized Medicine Coalition (Washington, DC), 9 June 2011. 19Food and Drug Administration, Third Annual Performance Report: Prescription Drug User Fee Act of 1992, Fiscal Year 1995 Report to Congress (Silver Spring, MD: FDA, December 1995); Food and Drug Administration, FY 2010 Performance Report to the President and the Congress for the Prescription Drug User Fee Act (Silver Spring, MD: FDA). 20Food and Drug Administration, Giving Medica-tion to Children: Q&A With Dianne Murphy, M.D. (Silver Spring, MD: FDA, June 2009). 21Food and Drug Administration, “New Pediatric Labeling Information Database,” http://www.accessdata.fda.gov/scripts/sda/sdNavigation.cfm?sd=labelingdatabase.22Food and Drug Administration, “Pediatric Exclusivity Granted,” January 2012, http://www.fda.gov/downloads/Drugs/ DevelopmentApprovalProcess/ DevelopmentResources/UCM223058.pdf (accessed 27 February 2012).

Conclusion 41
deficiency. These medicines have transformed health care, allowing people to live longer, healthier, and more productive lives.
Despite challenges on many fronts—economic, regulatory, and competi-tive—the biopharmaceutical indus-try continues to lead the world and
the country are developing more than 3,200 new medicines.2
Advances have led to medicines across a broad spectrum, from well-known and chronic diseases such as cancer, heart disease, Alzheimer’s disease, and HIV/AIDS, to rare diseases such as the genetic defect congenital factor XIII
America’s biopharmaceutical companies remain committed
to discovering and developing new medicines that save lives and improve health. In 2011, research and develop-ment spending by PhRMA member companies reached an estimated $49.5 billion,1 and researchers across
Continuing Commitment to World-Class Research and Innovation Leads to Better Health and a Strong Economy
CO
NC
LUS
ION

42 Conclusion
CO
NC
LUS
ION
contribute substantially to the U.S. economy. These contributions include billions in direct investments repre-sented by jobs and taxes and additional billions in indirect beneficial impacts for communities across the country. With sustained support for an environment that fosters innovation, the United States will continue to lead the world in biomedical discovery.
1Pharmaceutical Research and Manufacturers of America, PhRMA Annual Membership Survey (Washington, DC: PhRMA, 2012).
2Adis R&D Insight Database (accessed 10 February 2012).

Appendix
APPENDIX
Appendix 4544 Appendix
Novo Nordisk, Inc.Princeton, NJ
Otsuka America Pharmaceutical (OAP)Princeton, NJ
Otsuka America Pharmaceutical, Inc. (OAPI)
Otsuka Pharmaceutical Development & Commercialization, Inc. (OPDC)
Otsuka Maryland Medicinal Laboratories (OMML)
Pfizer Inc. New York, NY
Purdue Pharma L.P.Stamford, CT
SanofiBridgewater, NJ sanofi pasteur
Sigma-Tau Pharmaceuticals, Inc.Gaithersburg, MD
Takeda Pharmaceuticals North America, Inc.Deerfield, IL
Research Associate Members
Alkermes plcWaltham, MA
Arena Pharmaceuticals, Inc.San Diego, CA
BioMarin Pharmaceuticals, Inc.Novato, CA
CSL Behring, LLCKing of Prussia, PA
Depomed, Inc.Menlo Park, CA
Ferring Pharmaceuticals, Inc.Parsippany, NJ
Grifols USA, LLCLos Angeles, CA
Helsinn Therapeutics (U.S.) Inc.Bridgewater, NJ
Members
AbbottAbbott Park, IL
Amgen Inc.Thousand Oaks, CA
Astellas Pharma US, Inc.Deerfield, IL
AstraZeneca Pharmaceuticals LPWilmington, DE
Bayer HealthCare LLCWayne, NJ
Biogen Idec Inc.Cambridge, MA
Boehringer Ingelheim Pharmaceuticals, Inc.Ridgefield, CT
Bristol-Myers Squibb CompanyNew York, NY
Celgene CorporationSummit, NJ
Cubist Pharmaceuticals, Inc.Lexington, MA
Daiichi Sankyo, Inc. Parsippany, NJ
Dainippon Sumitomo Pharma Co., Ltd. Osaka, Japan Sunovion Pharmaceuticals Inc. Marlborough, MA
Eisai Inc.Woodcliff Lake, NJ
EMD SeronoRockland, MA
Endo Pharmaceuticals, Inc.Chadds Ford, PA
GlaxoSmithKlineResearch Triangle Park, NC
Johnson & JohnsonNew Brunswick, NJ
Eli Lilly and CompanyIndianapolis, IN
Lundbeck Inc.Deerfield, IL
Merck & Co., Inc.Whitehouse Station, NJ
Merck Human Health DivisionMerck Research LaboratoriesMerck Vaccine Division
Novartis Pharmaceuticals CorporationE. Hanover, NJ
phRMA Member Companies
APPENDIX
APPENDIX
Appendix 4746 Appendix
phRMA Annual Membership SurveyDefInItIOn Of teRMS
Research and development expenditure definitions R&D Expenditures: expenditures within PhRMA member companies’ U.S. and/or foreign research laboratories plus research and development (R&D) funds contracted or granted to commercial laboratories, private practitioners, consultants, educational and nonprofit research institutions, manufacturing and other companies, or other researchperforming organizations located inside/outside of the U.S. Includes basic and applied research, as well as developmental activities carried on or supported in the pharmaceutical, biological, chemical, medical, and related sciences, including psychology and psychiatry, if the purpose of such activities is concerned ultimately with the utilization of scientific principles in understanding diseases or in improving health. Includes the total cost incurred for all pharmaceutical R&D activities, including salaries, materials, supplies used, and a fair share of overhead, as well as the cost of developing quality control. However, it does not include the cost of routine quality control activities, capital expenditures, or any costs incurred for drug or medical R&D conducted under a grant or contract for other companies or organizations.
Domestic R&D: expenditures within the United States by all PhRMA member companies.
•Externally Researched: Agreements with other companies/universities/research institutions to develop, license or acquire promising compounds, technologies or capabilities. Includes initial payments and milestones for new and ongoing partnerships, collaborations, alliances and license agreements and acquisitions.
• Self-originated: Products for which the company originates the compound.
R&D Abroad: expenditures outside the United States by U.S.owned PhRMA member companies and R&D conducted abroad by the U.S. divisions of foreignowned PhRMA member companies. R&D performed abroad by the foreign divisions of foreignowned PhRMA member companies is excluded.
Prehuman/Preclinical Testing: from synthesis to first testing in humans.
Phase 1/2/3 Clinical Testing: from first testing in designated phase to first testing in subsequent phase.
Approval Phase: from new Drug Application (nDA)/Biologic License Application (BLA) submission to nDA/BLA decision.
Phase 4 Clinical Testing: Any postmarketing R&D activities performed.
Uncategorized: Represents data for which detailed classifications were unavailable.
Biologics and Biotechnology R&D: R&D expenditures devoted to biologics and biotechnology products made from living material (plant, animal or microorganism). These products may be derived from natural sources or engineered in a laboratory. excluded are R&D expenditures for biotechnology techniques used to produce nonbiotechnology products. Biotechnologyderived therapeutic proteins includes recombinant protein products and monoclonal antibodies.
Sales definitions Sales: Product sales calculated as billed, free on board (fOB) plant or warehouse less cash discounts, Medicaid rebates, returns, and allowances. These include all marketing expenses except transportation costs. Also included is the sales value of products bought and
Horizon Pharma, Inc.Northbrook, IL
Ikaria, Inc. Hampton, NJ
Orexigen Therapeutics, Inc.La Jolla, CA
Shionogi Inc.Florham Park, NJ
Sucampo Pharmaceuticals, Inc.Bethesda, MD
Theravance, Inc.South San Francisco, CA
United Therapeutics CorporationSilver Spring, MD
Vertex Pharmaceuticals IncorporatedCambridge, MA
Vifor PharmaBasking Ridge, NJ
Vivus, Inc.Mountain View, CA
Xoma Ltd.Berkeley, CA
APPENDIX

48 Appendix Appendix 49
R&D, PhRMA Member Companies
1 Domestic R&D and R&D Abroad: 1975–2011..................................................... 50
2 R&D as a Percentage of Sales: 1975–2011 ....................................................... 51
3 Domestic R&D and R&D Abroad: 2010 ................................................................... 52
4 Domestic R&D by Source: 2010 .................................................................................... 53
5 R&D by Function: 2010 ......................................................................................................... 53
6 R&D by Geographic Area: 2010 ..................................................................................... 54
7 Biologics and Biotechnology R&D: 2010 ................................................................ 55
Sales, PhRMA Member Companies
8 Domestic Sales and Sales Abroad: 1975–2011 .............................................. 56
9 Sales by Geographic Area: 2010 .................................................................................. 57
R&D Employment, PhRMA Member Companies
10 Domestic R&D Scientific, Professional
and Technical Personnel by Function: 2010 ...................................................... 58
resold without further processing or repackaging, as well as the dollar value of products made from the firm’s own materials for other manufacturers’ resale. excluded are all royalty payments, interest, and other income.
Domestic Sales: Sales generated within the United States by all PhRMA member companies.
•Private Sector: Sales through regular marketing channels for enduse other than by government agency administration or distribution.
•Public Sector: Sales or shipments made directly to federal, state, or local government agencies, hospitals, and clinics.
Sales Abroad: Sales generated outside the United States by U.S.owned PhRMA member companies, and sales generated abroad by the U.S. divisions of foreignowned PhRMA member companies. Sales generated abroad by the foreign divisions of foreignowned PhRMA member companies are excluded.
•Exports to Other Customers: Sales to third parties only, fOB U.S. port. excludes all intrafirm transactions, such as sales or shipments to subsidiaries or affiliates.
•Foreign Sales: Sales consummated in foreign countries.
R&d employment definitions
Scientific, Professional, and Techni-cal Staff: fulltime employees, as well as fulltime equivalents for parttime employees, whose work requires the application of R&D knowledge, skills, and scientific techniques in the life, physical, engineering, mathematical, or statistical sciences, as well as persons engaged in technical work at a level that requires knowledge in one of the abovementioned fields. Does not include persons who have formal training in the sciences but who are not actively engaged in R&D.
Supported Scientific, Professional, and Technical Nonstaff: Persons whose work requires the application of R&D knowledge, skills, and scientific techniques in the life, physical, engineering, mathematical, or statistical sciences, as well as persons
engaged in technical work at a level that requires knowledge in one of the abovementioned fields who are supported through contracts or grants to commercial laboratories, private practitioners, consultants, educational and nonprofit research institutions, manufacturing and other companies, or other researchperforming organizations located in the United States. Does not include persons who have formal training in the sciences but who are not actively engaged in R&D.
List of Tables DetAILeD ReSULtS fROM tHe PhRMA AnnUAL MeMBeRSHIP SURVey
APPENDIX
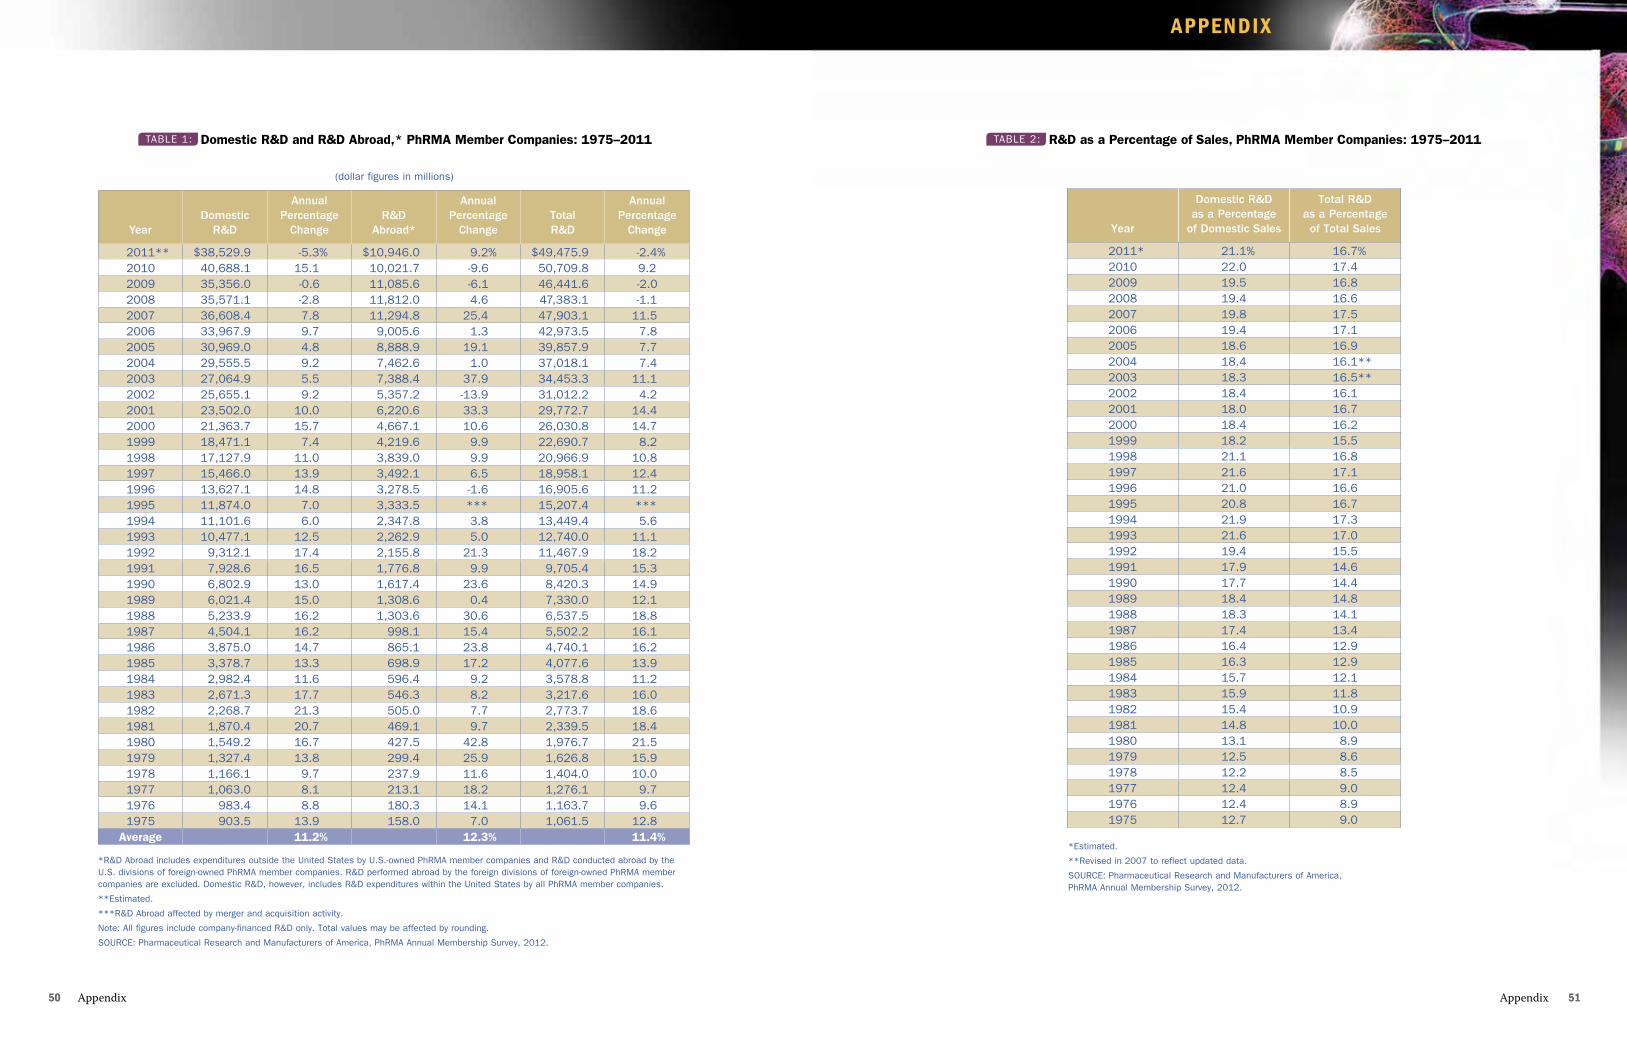
APPENDIX
Appendix 5150 Appendix
*Estimated.
**Revised in 2007 to reflect updated data.
SouRcE: Pharmaceutical Research and Manufacturers of America, PhRMA Annual Membership Survey, 2012.
Year
Domestic R&Das a Percentage
of Domestic Sales
Total R&Das a Percentage of Total Sales
2011* 21.1% 16.7%2010 22.0 17.42009 19.5 16.82008 19.4 16.62007 19.8 17.52006 19.4 17.12005 18.6 16.92004 18.4 16.1**2003 18.3 16.5**2002 18.4 16.12001 18.0 16.72000 18.4 16.21999 18.2 15.51998 21.1 16.81997 21.6 17.11996 21.0 16.61995 20.8 16.71994 21.9 17.31993 21.6 17.01992 19.4 15.51991 17.9 14.61990 17.7 14.41989 18.4 14.81988 18.3 14.11987 17.4 13.41986 16.4 12.91985 16.3 12.91984 15.7 12.11983 15.9 11.81982 15.4 10.91981 14.8 10.01980 13.1 8.91979 12.5 8.61978 12.2 8.51977 12.4 9.01976 12.4 8.91975 12.7 9.0
TABLE 2: R&D as a Percentage of Sales, PhRMA Member Companies: 1975–2011
(dollar figures in millions)
*R&D Abroad includes expenditures outside the united States by u.S.-owned PhRMA member companies and R&D conducted abroad by the u.S. divisions of foreign-owned PhRMA member companies. R&D performed abroad by the foreign divisions of foreign-owned PhRMA member companies are excluded. Domestic R&D, however, includes R&D expenditures within the united States by all PhRMA member companies.
**Estimated.
***R&D Abroad affected by merger and acquisition activity.
Note: All figures include company-financed R&D only. Total values may be affected by rounding.
SouRcE: Pharmaceutical Research and Manufacturers of America, PhRMA Annual Membership Survey, 2012.
Year
Domestic
R&D
Annual Percentage
Change
R&D
Abroad*
Annual Percentage
Change
Total R&D
Annual Percentage
Change
2011** $38,529.9 -5.3% $10,946.0 9.2% $49,475.9 -2.4%2010 40,688.1 15.1 10,021.7 -9.6 50,709.8 9.22009 35,356.0 -0.6 11,085.6 -6.1 46,441.6 -2.02008 35,571.1 -2.8 11,812.0 4.6 47,383.1 -1.12007 36,608.4 7.8 11,294.8 25.4 47,903.1 11.52006 33,967.9 9.7 9,005.6 1.3 42,973.5 7.82005 30,969.0 4.8 8,888.9 19.1 39,857.9 7.72004 29,555.5 9.2 7,462.6 1.0 37,018.1 7.42003 27,064.9 5.5 7,388.4 37.9 34,453.3 11.12002 25,655.1 9.2 5,357.2 -13.9 31,012.2 4.22001 23,502.0 10.0 6,220.6 33.3 29,772.7 14.42000 21,363.7 15.7 4,667.1 10.6 26,030.8 14.71999 18,471.1 7.4 4,219.6 9.9 22,690.7 8.21998 17,127.9 11.0 3,839.0 9.9 20,966.9 10.81997 15,466.0 13.9 3,492.1 6.5 18,958.1 12.41996 13,627.1 14.8 3,278.5 -1.6 16,905.6 11.21995 11,874.0 7.0 3,333.5 *** 15,207.4 ***1994 11,101.6 6.0 2,347.8 3.8 13,449.4 5.61993 10,477.1 12.5 2,262.9 5.0 12,740.0 11.11992 9,312.1 17.4 2,155.8 21.3 11,467.9 18.21991 7,928.6 16.5 1,776.8 9.9 9,705.4 15.31990 6,802.9 13.0 1,617.4 23.6 8,420.3 14.91989 6,021.4 15.0 1,308.6 0.4 7,330.0 12.11988 5,233.9 16.2 1,303.6 30.6 6,537.5 18.81987 4,504.1 16.2 998.1 15.4 5,502.2 16.11986 3,875.0 14.7 865.1 23.8 4,740.1 16.21985 3,378.7 13.3 698.9 17.2 4,077.6 13.91984 2,982.4 11.6 596.4 9.2 3,578.8 11.21983 2,671.3 17.7 546.3 8.2 3,217.6 16.01982 2,268.7 21.3 505.0 7.7 2,773.7 18.61981 1,870.4 20.7 469.1 9.7 2,339.5 18.41980 1,549.2 16.7 427.5 42.8 1,976.7 21.51979 1,327.4 13.8 299.4 25.9 1,626.8 15.91978 1,166.1 9.7 237.9 11.6 1,404.0 10.01977 1,063.0 8.1 213.1 18.2 1,276.1 9.71976 983.4 8.8 180.3 14.1 1,163.7 9.61975 903.5 13.9 158.0 7.0 1,061.5 12.8
Average 11.2% 12.3% 11.4%
TABLE 1: Domestic R&D and R&D Abroad,* PhRMA Member Companies: 1975–2011
APPENDIX
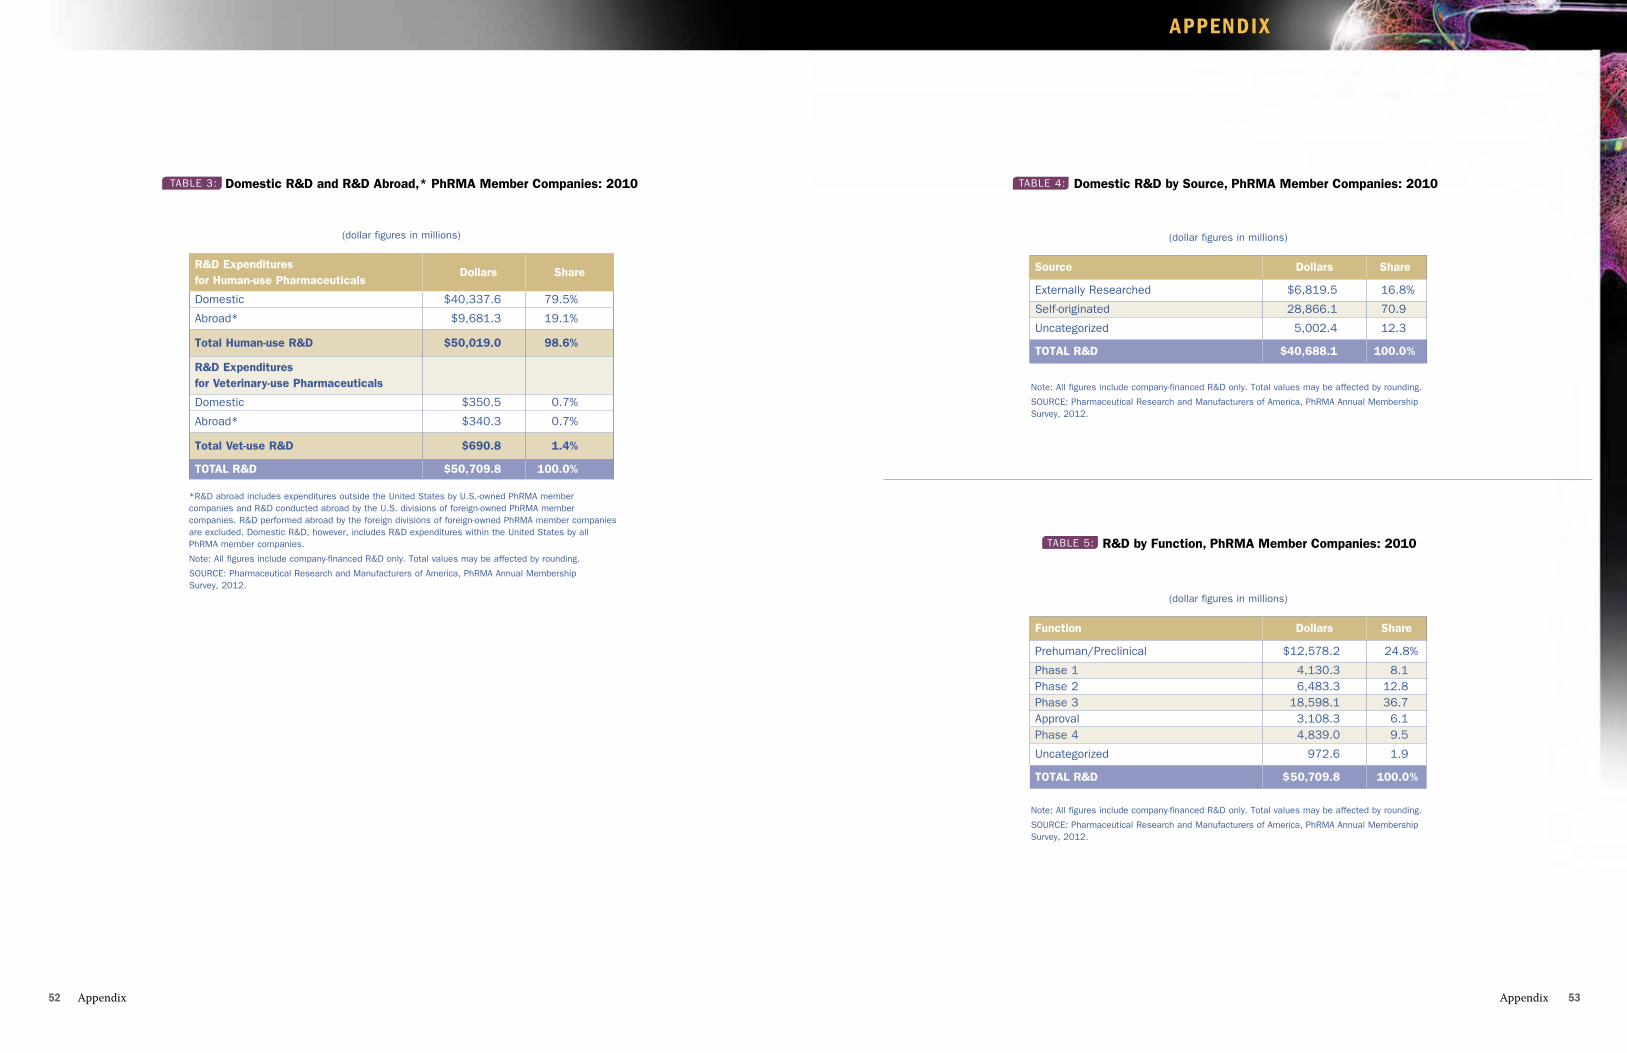
APPENDIX
Appendix 5352 Appendix
Note: All figures include company-financed R&D only. Total values may be affected by rounding.
SouRcE: Pharmaceutical Research and Manufacturers of America, PhRMA Annual Membership Survey, 2012.
Source Dollars Share
Externally Researched $6,819.5 16.8%
Self-originated 28,866.1 70.9
uncategorized 5,002.4 12.3
ToTAl R&D $40,688.1 100.0%
(dollar figures in millions)
TABLE 4: Domestic R&D by Source, PhRMA Member Companies: 2010
Note: All figures include company-financed R&D only. Total values may be affected by rounding.
SouRcE: Pharmaceutical Research and Manufacturers of America, PhRMA Annual Membership Survey, 2012.
Function Dollars Share
Prehuman/Preclinical $12,578.2 24.8%
Phase 1 4,130.3 8.1Phase 2 6,483.3 12.8Phase 3 18,598.1 36.7Approval 3,108.3 6.1Phase 4 4,839.0 9.5
uncategorized 972.6 1.9
ToTAl R&D $50,709.8 100.0%
(dollar figures in millions)
TABLE 5: R&D by Function, PhRMA Member Companies: 2010
R&D Expenditures for Human-use Pharmaceuticals
Dollars Share
Domestic $40,337.6 79.5%
Abroad* $9,681.3 19.1%
Total Human-use R&D $50,019.0 98.6%
R&D Expenditures for Veterinary-use Pharmaceuticals
Domestic $350.5 0.7%
Abroad* $340.3 0.7%
Total Vet-use R&D $690.8 1.4%
ToTAl R&D $50,709.8 100.0%
(dollar figures in millions)
TABLE 3: Domestic R&D and R&D Abroad,* PhRMA Member Companies: 2010
*R&D abroad includes expenditures outside the united States by u.S.-owned PhRMA member companies and R&D conducted abroad by the u.S. divisions of foreign-owned PhRMA member companies. R&D performed abroad by the foreign divisions of foreign-owned PhRMA member companies are excluded. Domestic R&D, however, includes R&D expenditures within the united States by all PhRMA member companies.
Note: All figures include company-financed R&D only. Total values may be affected by rounding.
SouRcE: Pharmaceutical Research and Manufacturers of America, PhRMA Annual Membership Survey, 2012.
APPENDIX
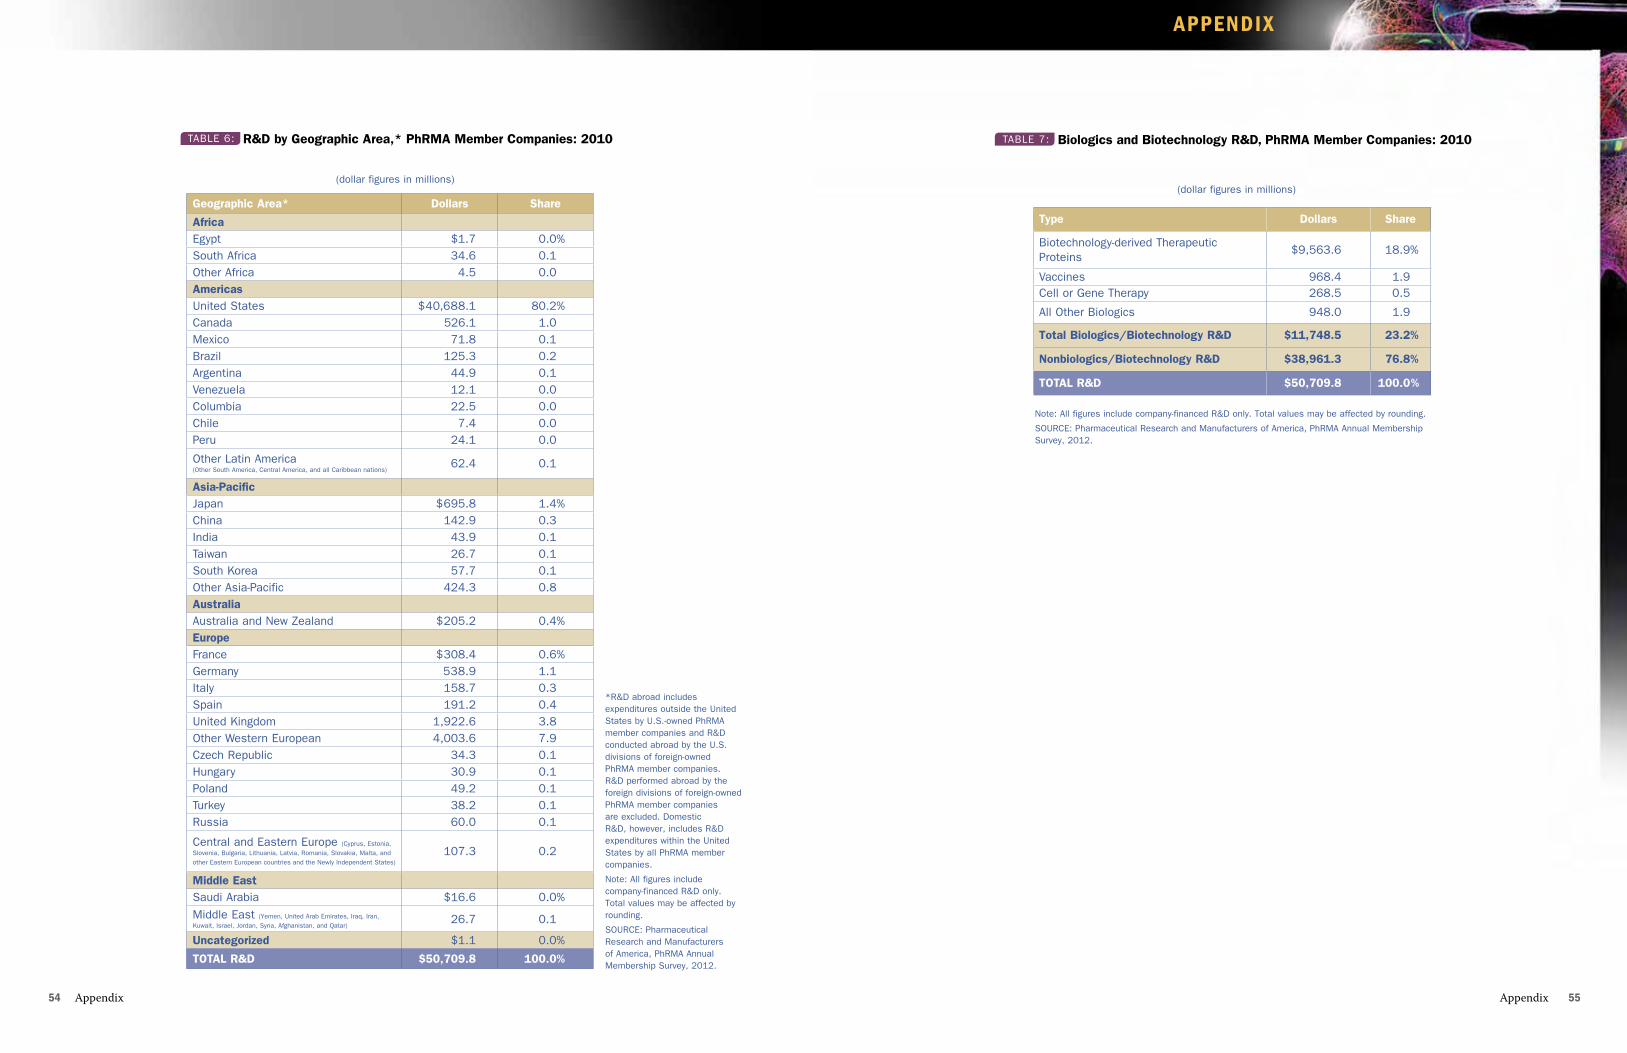
APPENDIX
Appendix 5554 Appendix
Note: All figures include company-financed R&D only. Total values may be affected by rounding.
SouRcE: Pharmaceutical Research and Manufacturers of America, PhRMA Annual Membership Survey, 2012.
Type Dollars Share
Biotechnology-derived Therapeutic Proteins
$9,563.6 18.9%
Vaccines 968.4 1.9cell or Gene Therapy 268.5 0.5
All other Biologics 948.0 1.9
Total Biologics/Biotechnology R&D $11,748.5 23.2%
Nonbiologics/Biotechnology R&D $38,961.3 76.8%
ToTAl R&D $50,709.8 100.0%
(dollar figures in millions)
TABLE 7: Biologics and Biotechnology R&D, PhRMA Member Companies: 2010TABLE 6: R&D by Geographic Area,* PhRMA Member Companies: 2010
(dollar figures in millions)
*R&D abroad includes expenditures outside the united States by u.S.-owned PhRMA member companies and R&D conducted abroad by the u.S. divisions of foreign-owned PhRMA member companies. R&D performed abroad by the foreign divisions of foreign-owned PhRMA member companies are excluded. Domestic R&D, however, includes R&D expenditures within the united States by all PhRMA member companies.
Note: All figures include company-financed R&D only. Total values may be affected by rounding.
SouRcE: Pharmaceutical Research and Manufacturers of America, PhRMA Annual Membership Survey, 2012.
Geographic Area* Dollars Share
AfricaEgypt $1.7 0.0%South Africa 34.6 0.1other Africa 4.5 0.0Americasunited States $40,688.1 80.2%canada 526.1 1.0Mexico 71.8 0.1Brazil 125.3 0.2Argentina 44.9 0.1Venezuela 12.1 0.0columbia 22.5 0.0chile 7.4 0.0Peru 24.1 0.0
other Latin America (other South America, central America, and all caribbean nations)
62.4 0.1
Asia-PacificJapan $695.8 1.4%china 142.9 0.3India 43.9 0.1Taiwan 26.7 0.1South Korea 57.7 0.1other Asia-Pacific 424.3 0.8AustraliaAustralia and New Zealand $205.2 0.4%EuropeFrance $308.4 0.6%Germany 538.9 1.1Italy 158.7 0.3Spain 191.2 0.4united Kingdom 1,922.6 3.8other Western European 4,003.6 7.9czech Republic 34.3 0.1Hungary 30.9 0.1Poland 49.2 0.1Turkey 38.2 0.1Russia 60.0 0.1
central and Eastern Europe (cyprus, Estonia, Slovenia, Bulgaria, Lithuania, Latvia, Romania, Slovakia, Malta, and other Eastern European countries and the Newly Independent States)
107.3 0.2
Middle EastSaudi Arabia $16.6 0.0%Middle East (Yemen, united Arab Emirates, Iraq, Iran, Kuwait, Israel, Jordan, Syria, Afghanistan, and Qatar)
26.7 0.1
Uncategorized $1.1 0.0%
ToTAl R&D $50,709.8 100.0%
APPENDIX
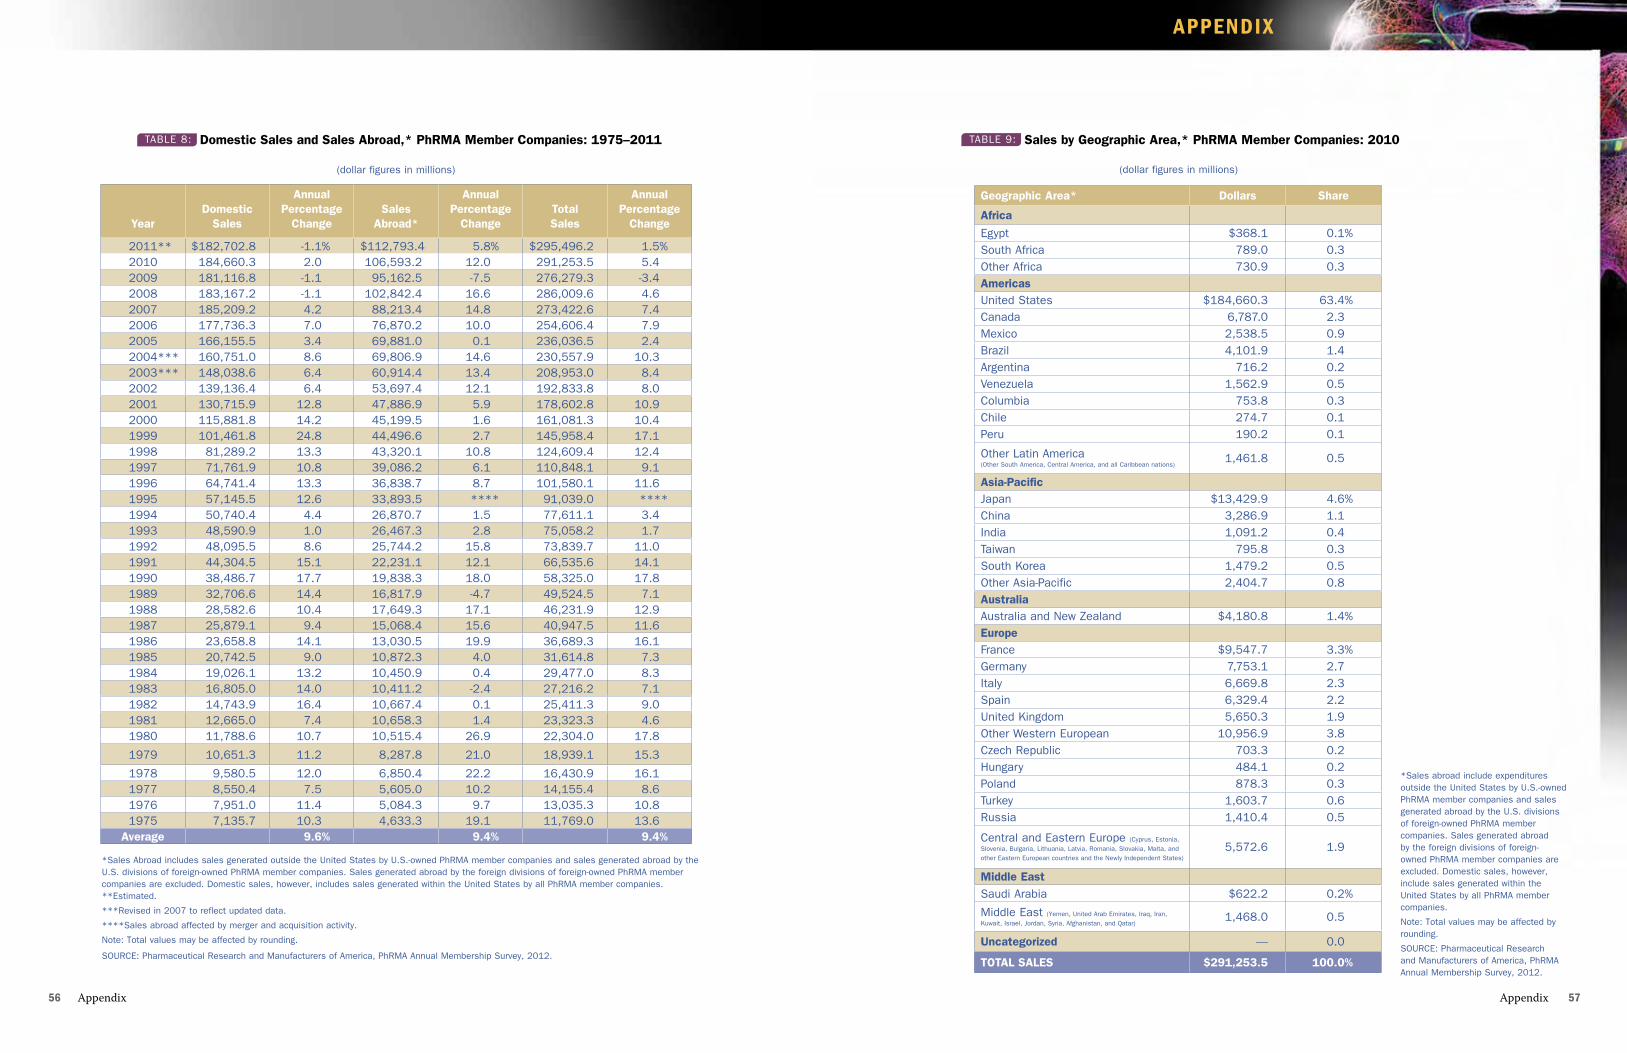
APPENDIX
Appendix 5756 Appendix
(dollar figures in millions)
TABLE 9: Sales by Geographic Area,* PhRMA Member Companies: 2010
*Sales abroad include expenditures outside the united States by u.S.-owned PhRMA member companies and sales generated abroad by the u.S. divisions of foreign-owned PhRMA member companies. Sales generated abroad by the foreign divisions of foreign-owned PhRMA member companies are excluded. Domestic sales, however, include sales generated within the united States by all PhRMA member companies.
Note: Total values may be affected by rounding.
SouRcE: Pharmaceutical Research and Manufacturers of America, PhRMA Annual Membership Survey, 2012.
Geographic Area* Dollars Share
Africa
Egypt $368.1 0.1%South Africa 789.0 0.3other Africa 730.9 0.3Americasunited States $184,660.3 63.4%canada 6,787.0 2.3Mexico 2,538.5 0.9Brazil 4,101.9 1.4Argentina 716.2 0.2Venezuela 1,562.9 0.5columbia 753.8 0.3chile 274.7 0.1Peru 190.2 0.1
other Latin America (other South America, central America, and all caribbean nations)
1,461.8 0.5
Asia-PacificJapan $13,429.9 4.6%china 3,286.9 1.1India 1,091.2 0.4Taiwan 795.8 0.3South Korea 1,479.2 0.5other Asia-Pacific 2,404.7 0.8AustraliaAustralia and New Zealand $4,180.8 1.4%EuropeFrance $9,547.7 3.3%Germany 7,753.1 2.7Italy 6,669.8 2.3Spain 6,329.4 2.2united Kingdom 5,650.3 1.9other Western European 10,956.9 3.8czech Republic 703.3 0.2Hungary 484.1 0.2Poland 878.3 0.3Turkey 1,603.7 0.6Russia 1,410.4 0.5
central and Eastern Europe (cyprus, Estonia, Slovenia, Bulgaria, Lithuania, Latvia, Romania, Slovakia, Malta, and other Eastern European countries and the Newly Independent States)
5,572.6 1.9
Middle EastSaudi Arabia $622.2 0.2%
Middle East (Yemen, united Arab Emirates, Iraq, Iran, Kuwait, Israel, Jordan, Syria, Afghanistan, and Qatar)
1,468.0 0.5
Uncategorized __ 0.0
ToTAl SAlES $291,253.5 100.0%
(dollar figures in millions)
*Sales Abroad includes sales generated outside the united States by u.S.-owned PhRMA member companies and sales generated abroad by the u.S. divisions of foreign-owned PhRMA member companies. Sales generated abroad by the foreign divisions of foreign-owned PhRMA member companies are excluded. Domestic sales, however, includes sales generated within the united States by all PhRMA member companies. **Estimated.
***Revised in 2007 to reflect updated data.
****Sales abroad affected by merger and acquisition activity.
Note: Total values may be affected by rounding.
SouRcE: Pharmaceutical Research and Manufacturers of America, PhRMA Annual Membership Survey, 2012.
Year
Domestic
Sales
Annual Percentage
Change
Sales
Abroad*
Annual Percentage
Change
Total Sales
Annual Percentage
Change
2011** $182,702.8 -1.1% $112,793.4 5.8% $295,496.2 1.5%2010 184,660.3 2.0 106,593.2 12.0 291,253.5 5.42009 181,116.8 -1.1 95,162.5 -7.5 276,279.3 -3.42008 183,167.2 -1.1 102,842.4 16.6 286,009.6 4.62007 185,209.2 4.2 88,213.4 14.8 273,422.6 7.42006 177,736.3 7.0 76,870.2 10.0 254,606.4 7.92005 166,155.5 3.4 69,881.0 0.1 236,036.5 2.42004*** 160,751.0 8.6 69,806.9 14.6 230,557.9 10.32003*** 148,038.6 6.4 60,914.4 13.4 208,953.0 8.42002 139,136.4 6.4 53,697.4 12.1 192,833.8 8.02001 130,715.9 12.8 47,886.9 5.9 178,602.8 10.92000 115,881.8 14.2 45,199.5 1.6 161,081.3 10.41999 101,461.8 24.8 44,496.6 2.7 145,958.4 17.11998 81,289.2 13.3 43,320.1 10.8 124,609.4 12.41997 71,761.9 10.8 39,086.2 6.1 110,848.1 9.11996 64,741.4 13.3 36,838.7 8.7 101,580.1 11.61995 57,145.5 12.6 33,893.5 **** 91,039.0 ****1994 50,740.4 4.4 26,870.7 1.5 77,611.1 3.41993 48,590.9 1.0 26,467.3 2.8 75,058.2 1.71992 48,095.5 8.6 25,744.2 15.8 73,839.7 11.01991 44,304.5 15.1 22,231.1 12.1 66,535.6 14.11990 38,486.7 17.7 19,838.3 18.0 58,325.0 17.81989 32,706.6 14.4 16,817.9 -4.7 49,524.5 7.11988 28,582.6 10.4 17,649.3 17.1 46,231.9 12.91987 25,879.1 9.4 15,068.4 15.6 40,947.5 11.61986 23,658.8 14.1 13,030.5 19.9 36,689.3 16.11985 20,742.5 9.0 10,872.3 4.0 31,614.8 7.31984 19,026.1 13.2 10,450.9 0.4 29,477.0 8.31983 16,805.0 14.0 10,411.2 -2.4 27,216.2 7.11982 14,743.9 16.4 10,667.4 0.1 25,411.3 9.01981 12,665.0 7.4 10,658.3 1.4 23,323.3 4.61980 11,788.6 10.7 10,515.4 26.9 22,304.0 17.8
1979 10,651.3 11.2 8,287.8 21.0 18,939.1 15.3
1978 9,580.5 12.0 6,850.4 22.2 16,430.9 16.11977 8,550.4 7.5 5,605.0 10.2 14,155.4 8.61976 7,951.0 11.4 5,084.3 9.7 13,035.3 10.81975 7,135.7 10.3 4,633.3 19.1 11,769.0 13.6
Average 9.6% 9.4% 9.4%
TABLE 8: Domestic Sales and Sales Abroad,* PhRMA Member Companies: 1975–2011
APPENDIX
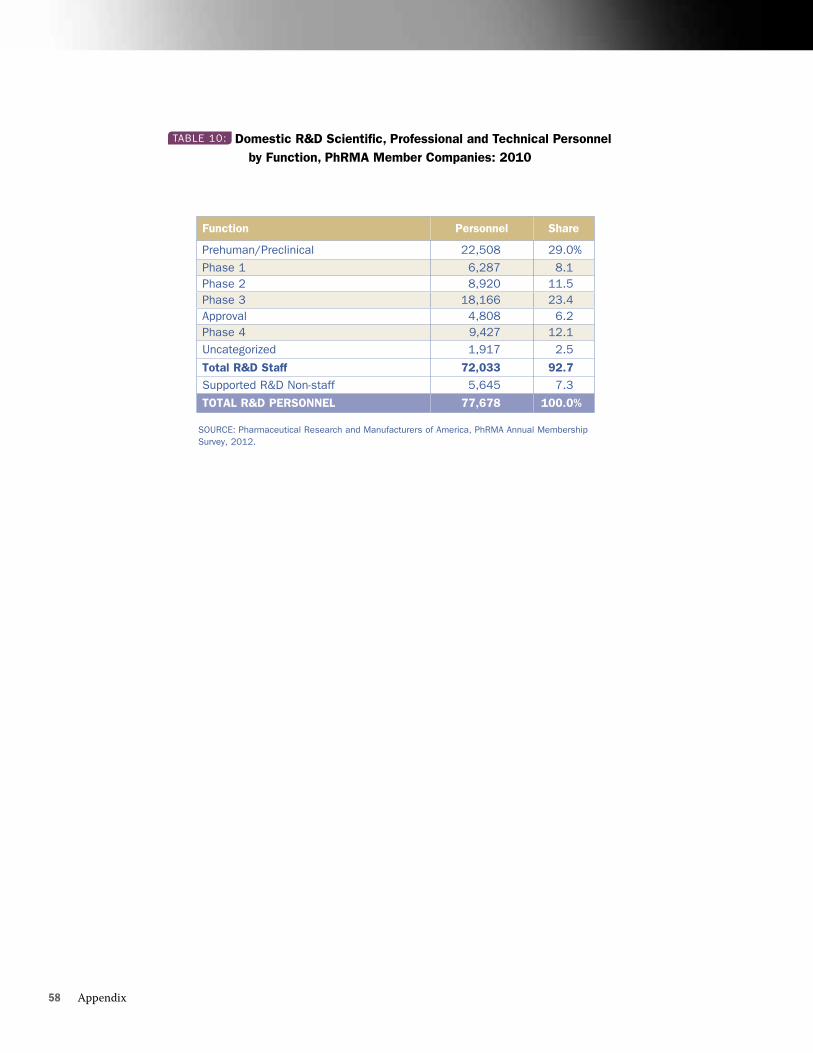
58 Appendix
SoURcE: Pharmaceutical Research and Manufacturers of America, PhRMA Annual Membership Survey, 2012.
Function Personnel Share
Prehuman/Preclinical 22,508 29.0%
Phase 1 6,287 8.1Phase 2 8,920 11.5Phase 3 18,166 23.4Approval 4,808 6.2Phase 4 9,427 12.1Uncategorized 1,917 2.5
Total R&D Staff 72,033 92.7Supported R&D Non-staff 5,645 7.3
ToTAl R&D PERSoNNEl 77,678 100.0%
TABLE 10: Domestic R&D Scientific, Professional and Technical Personnel by Function, PhRMA Member Companies: 2010


