8
Pharmaceutical Market Trends External research and findings 2017 Alex Jung
Pharmaceutical Market Trends
External research and findings
2017
Alex Jung

• Corporate and usiness strategy, asset
repurposing and business model redesign
• Operations and process improvement
• Mergers & acquisitions
• Clinical program development
• Employee benefits strategy, plan design and
funding strategies
Profile Summary Significant Experience
Knowledge & Skills
Alex Jung – Partner/Managing Director
Direct: 312-879-2778
Mobile: 847-722-3482
Email: [email protected]
Office: 155 N Wacker Drive, Chicago
• B.S., Business Management, Northeastern Illinois
University, Northwestern University
• Licensed broker health, accident and life
• Certified project manager (CMP) and trained in
Juran and W. Edward Deming Quality Process
• CEBS, International Foundation of Employee
Benefits
Education
Alex is a partner in Parthenon-EY Strategy where she works primarily
on growth strategy projects. She helps clients define and implement
their strategy and build organizational capabilities to deliver
sustainable business results both through organic and inorganic
approaches. She is a thought leader in the industry and specializes in
asset repurposing and optimizing value propositions.
• Healthcare providers/hospitals/retail clinics
• Managed care/Insurance payers
• Life Sciences/Pharmaceuticals
• Medical Device/Diagnostics
• Clinical Interventions
• Consumer Products/Retail
Industries
Alex Jung is a partner in Parthenon EY. Prior to joining EY, she was the Senior Vice
President of Walgreens Corporate Strategy based in Deerfield, IL.
Mrs. Jung has over 30 years of experience working on strategic growth and risk
mitigation engagements. She began her career with Arthur Andersen and after ten
years moved into consulting with Mercer as the leader of the National Health Care
Analysis Unit, helping to architect one of the first data analytics platforms.
She later became the Managing Director for the General Board of Pension and Health
Benefits of the United Methodist Church. Alex returned to consulting to lead the
health care practice at Aon Consulting and their significant growth into the number
one consulting firm in the space.
She is a regular speaker at events such as the California Governor’s Women’s
Conference, World Healthcare Congress, Midwest Business Group on Health, Crain’s
Annual Health Care Conference, the Benefits Management Expo, the Self Insurance
Association of America, John Marshall Law School, and HRMAC where she serves as
the Chair for the Total Rewards Interest Group. She sits on the advisory board of the
Michael Reese Health Trust and the Healthy Chicago initiative. She is also a member
of the Board of Directors for the Respiratory Health Association and Chair of the
Health and Wellness Council of the City of Chicago’s Chamber of Commerce.
Alex has worked globally with Fortune 500 companies and has developed and
implemented large scale strategy, operations and financial projects. She specializes
in asset repurposing and value proposition development. Her domain expertise in
healthcare spans from hospital operations, clinical intervention programs, benefit
plan designs and funding, commercialization strategy for new products and growth
strategies including M&A.
She has performed work on several large scale transactions, mergers and acquisitions
including the divestiture of Walgreen’s PBM, acquisition of AllianceBoots and other
assets while at Walgreens. She also architected the health and wellness strategy for
the company as part of the pharmacy transformation.
She has developed new business models, redesigned operating models,, labor
models and workflow processes in many environments including real estate footprint
redesign, go to market/commercialization strategies for new products and services
including launch strategies for pharma and medical device companies. She has also
helped redesign countless products, service offerings, medical devices and value
propositions for providers, payers and patients.
She has been quoted in numerous articles in Kennedy Research, Forrester, Forbes
Magazine, The Chicago Tribune, Business Insurance, Workforce Management
Magazine, Crain’s Chicago Business and other industry publications. She is on the
editorial board of Inside Patient Care magazine.

EY | Page 3
Value-chain and key stakeholders There are several stakeholders that exist in the pharmacy value chain, each with different needs
Co
ntract
Co
ntract
FFS Contract
Drugs
e-Prescribe
ReimbursementShared of Rebates
Rei
mb
urs
emen
tR
ebat
es
WAC
Drugs
AWP
Dis
pen
se
Dru
gs
Co
-pay /
Co
-ins
Patient
Pharmacy
PharmaMfg.
PBM
Payer / Health Plan
Wholesaler
Mapping the Pharmacy Value Chain
Physician
Consult
Contract
Plan Sponsor / Employer
Health plan / Coverage C
on
trac
t
Pharmacy
Physician
PBM
Wholesaler
Payer /
Health Plan
Pharma
Mfg.
Plan Sponsor /
Employer
Patient
What are their roles / needs? Stakeholder How do they collaborate / engage?
► Supplier / manufacturer of generic, branded, specialty, and biologics drugs
► Chain and community pharmacy, point of patient distribution
► Consumer of prescription drugs and pharmacy services
► Driver of script volume, drug mix and prescription trends
► Intermediary for drug plan design, adjudication, and formularies
► Health plan / insurer control cost associated with health spend
► Employers provide employee coverage
► Intermediary, group purchaser of drugs, distribution infrastructure

EY | Page 4
Prescription Drug Growth The aging US population and rise of chronic disease are likely to drive steady increase in drug spend / utilization
Over the next three decades, the 65+ population is expected
to increase at a rate of 1.7% per year
► This increase in the 65+ age demographic will likely cause a
corresponding rise in demand for pharmaceutical products
► Many of the regions with the highest growth rate in this
population segment are located in the Midwest and Great
Plains regions, where Nile already has a strong presence
Growth in chronic conditions in the U.S. has been rising in
recent years and is forecasted to continue to rise
► In 2014, chronic disease affected approximately 133m people
in the U.S.; that figure is expected to rise to 157m by 2020
► 81m people are expected to be affected by multiple chronic
conditions by 2020
► Top growing chronic conditions include obesity, diabetes, heart
disease, and depression
Robust pharmaceutical pipeline and new specialty and
biologic therapies will drive continued growth as well
► By 2018, the FDA could approve 200 new drugs
► Most anticipated disease categories for FDA approvals include
liver disease, oncology, HIV, multiple sclerosis, hepatitis C,
psoriasis, rheumatoid arthritis, Parkinson’s Disease, and atopic
dermatitis
Source: 4D Healthware, CBO, CMS, CVS Caremark, National Health Council, National Health Statistics Group, Office of the Actuary; Parthenon-EY Analysis
Total U.S. Population by Age Group2010-2040ECommentary
CAGR of Selected Chronic Conditions in U.S.2015-2020E

EY | Page 5
Collaboration & Consolidation Competitive dynamics in pharma and payer landscapes have changed due to significant recent M&A activity
Source: Bain Global Healthcare Private Equity and Corporate Report, BMI, EY Global Capital Confidence Barometer, April 2016, PwC Top health industry trends and issues 2016; Parthenon-EY Analysis
WBA and CVS
dominate the
market for retail
pharmacy; ESI
and Caremark
dominate the
PBM space
~50% of total US drug
supply is controlled by five
manufacturers
Top Pharmaceutical Manufacturers and Distributors in U.S.
2014 (Drug Supply), 2015 (Drug Distribution)
Commentary
Significant M&A activity has occurred within healthcare in recent years, with this activity expected to continue for the foreseeable future
► 2014 and 2015were both record breaking years for M&A
activity
► If recent proposed mergers between health insurers take
place, three major players will dominate the insurance market
by 2017
Companies across the healthcare value chain utilize
acquisitions to reduce costs and accelerate growth
► As consumer trends continue to evolve across the retail
industry, pharmacies and drug stores are being viewed as an
integral provider between patients and physicians. As a result,
acquisitions will become key to managing costs and
streamlining care
► Executives are increasingly utilizing alliances to accelerate
growth; 40% plan to enter alliances with other companies or
competitors to help create value from underutilized assets
► Drug companies are looking beyond traditional M&A by
acquiring “beyond-the-pill” products and services to bolster
their portfolios and drug pipelines
► Independent hospitals and clinician groups will find it difficult
to compete on their own. Attempting to generate more
touchpoints with existing customer bases, large physician
management companies are acquiring complementary groups

EY | Page 6
Emerging Therapies/Specialty Drugs Strong growth in scientific discovery has resulted in significant new cures and specialty medications
Source: Drug Channels, FDA Center for Drug Evaluation and Research, “Global Outlook for Medicines Through 2018”, IMS Health; Parthenon-EY Analysis
Continuing the wave of innovation in scientific discovery, nearly 200 new drugs are forecasted to be launched in the next five years, with a high number of NMEs expected every year due to a rich specialty drugs pipeline
Number of NME Approvals by the FDA2006-2014
On average, 22 drug approvals occurred per year between 2006 and 2010
This rose to an average of 34 new drugs
approved per year between 2011 and 2014
Pharmacy Benefit Spend (By Drug Type)2007-2016
High growth in specialty pharmaceuticals has been driven in part by significant profitability opportunities
► 600 drugs are currently in Phase II or higher clinical trials, with cancer treatments dominating the pipeline
► Gross margins for non-hospital specialty pharmacies range from 13% to 30%
► Cost to patient for a one-month supply of specialty prescription is 28-times that of traditional prescription
► Specialty drugs are expected to increase from 27% of pharmacy industry revenues in 2015 to 44% in 2020

EY | Page 7
Key Strategic Alliances Along with value chain consolidation, several interesting alliances are forming in the market
Source: Columbus Business First, CVS Health, Forbes, Reuters, WSJ; Parthenon-EY Analysis
Recent Alliances & Partnerships
These narrow networks will increasingly challenge competitors and limit access to customers / patients
Description:
► CVS Caremark and Cardinal Heath entered into a 10-year joint venture. The JV formed the largest entity in the U.S. to negotiate prices with drug manufacturers The JV sources and negotiates generic supply contracts for both CVS and Cardinal Health. CVS receives $25M quarterly payments from Cardinal Health as part of the JV
Objective:
► The JV will assist in generic drug sourcing and pricing for CVS, and allow Cardinal Health to expand its presence
Industry Dynamic Implication:
► CVS may gain a larger share of the generic drug market over the next 10 years due to its ability to negotiate lower generic drug prices as a result of the JV
Commentary
► “We view this agreement positively as it provides an effective way to drive better purchasing through increased scale without a large capital commitment or increased complexity of international markets” – Lisa Gill, Analyst, JP Morgan
CVSHealth and CardinalHealth
Description:
► PBM OptumRx and Walgreens partnered to sell pharmacy and drug management services to clients. As part of the partnership, OptumRx will charge its customers less for certain drugs if patients fill prescriptions at Walgreens locations. The program applies to 90-day prescriptions aimed at maintaining chronic diseases
Objective:
► Through the partnership, Walgreens hopes to capture a larger share of the prescription market
Industry Dynamic Implication:
► The partnership may result in an increased share of the pharmaceutical market for WBA, and increased patient loyalty
Commentary
► “It’s a partnership aimed at improving costs” – CEO, PBM
Walgreens & OptumRx
Description:
► CVS acquired Target’s pharmacy and clinics for ~$1.9B. CVS now owns Target’s 1,672 pharmacies through a store-within-a-store format. All Target pharmacies will be rebranded as CVS, and the clinics will become MinuteClinics. New target locations with pharmacies will also be CVS-branded
Objective:
► Target is able to focus on other business segments and drive additional in-store foot traffic, while CVS expands its brand presence in retail pharmacy
Industry Dynamic Implication:
► The partnership may result in increased share for CVS, as prescription programs attract customers to CVS locations
Commentary
► “Today's milestone in our relationship with CVS Health is an important step in driving Target's strategic priorities forward while giving our guests easy access to industry-leading health care services” – CEO, Mass Merchandiser
Target & CVS/Pharmacy
EY | Page 8
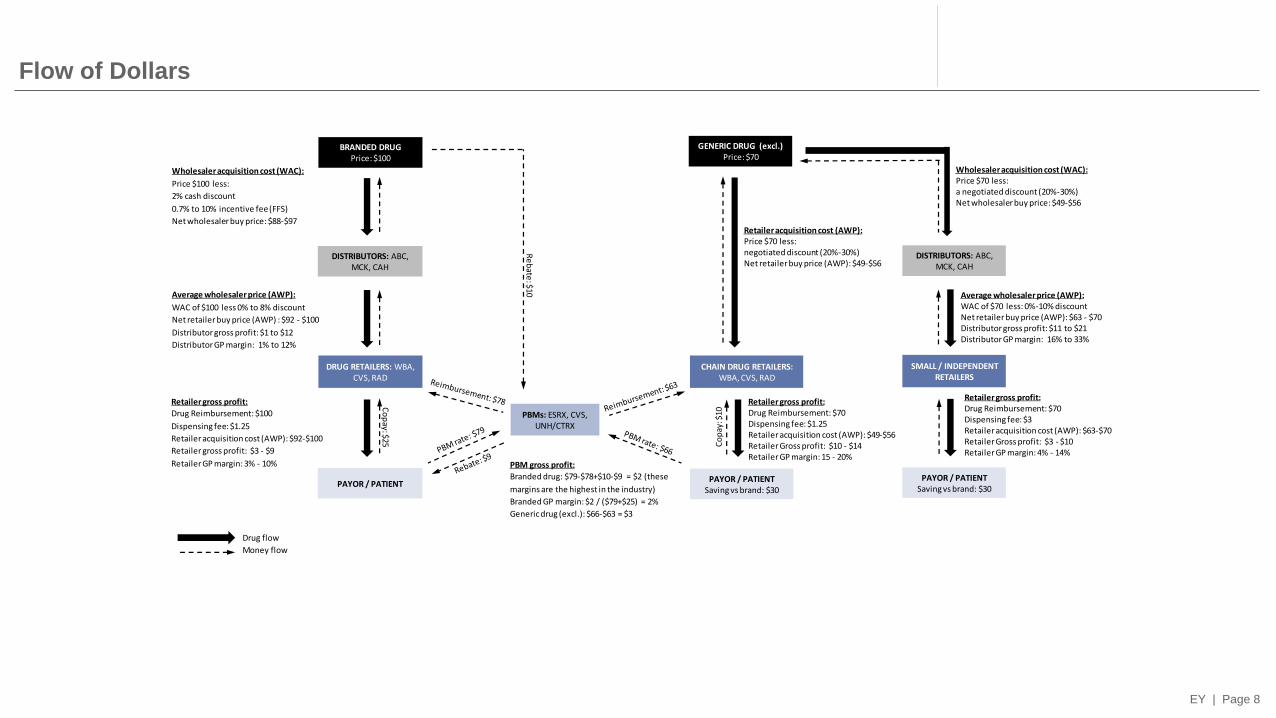
Flow of Dollars
Drug flow
Money flow
Wholesaler acquisition cost (WAC):
Price $100 less:
2% cash discount
0.7% to 10% incentive fee (FFS)
Net wholesaler buy price: $88-$97
Wholesaler acquisition cost (WAC):Price $70 less: a negotiated discount (20%-30%)Net wholesaler buy price: $49-$56
BRANDED DRUGPrice: $100
DISTRIBUTORS: ABC, MCK, CAH
DRUG RETAILERS: WBA, CVS, RAD
PAYOR / PATIENT
Average wholesaler price (AWP):
WAC of $100 less 0% to 8% discount
Net retailer buy price (AWP) : $92 - $100
Distributor gross profit: $1 to $12
Distributor GP margin: 1% to 12%
PBMs: ESRX, CVS, UNH/CTRX
Retailer gross profit:
Drug Reimbursement: $100
Dispensing fee: $1.25
Retailer acquisition cost (AWP): $92-$100
Retailer gross profit: $3 - $9
Retailer GP margin: 3% - 10%
GENERIC DRUG (excl.)Price: $70
DISTRIBUTORS: ABC, MCK, CAH
SMALL / INDEPENDENT RETAILERS
PAYOR / PATIENTSaving vs brand: $30
Average wholesaler price (AWP):WAC of $70 less: 0%-10% discountNet retailer buy price (AWP): $63 - $70Distributor gross profit: $11 to $21Distributor GP margin: 16% to 33%
Retailer gross profit:Drug Reimbursement: $70Dispensing fee: $1.25Retailer acquisition cost (AWP): $49-$56Retailer Gross profit: $10 - $14Retailer GP margin: 15 - 20%
CHAIN DRUG RETAILERS:WBA, CVS, RAD
PAYOR / PATIENTSaving vs brand: $30
Retailer acquisition cost (AWP):Price $70 less:negotiated discount (20%-30%)Net retailer buy price (AWP): $49-$56
Retailer gross profit:Drug Reimbursement: $70Dispensing fee: $3Retailer acquisition cost (AWP): $63-$70Retailer Gross profit: $3 - $10Retailer GP margin: 4% - 14%
Co
pay: $25
Re
bate
: $10
Co
pay
: $10
PBM gross profit:
Branded drug: $79-$78+$10-$9 = $2 (these
margins are the highest in the industry)
Branded GP margin: $2 / ($79+$25) = 2%
Generic drug (excl.): $66-$63 = $3


![Pharmaceutical Compliance Current Trends · Pharmaceutical Compliance Current Trends: ... “According to the most recent report, ... [FDA Form] 1572 and if they do something disgraceful](https://static.documents.pub/doc/80x56/5b52c43f7f8b9a6b118dc02d/pharmaceutical-compliance-current-pharmaceutical-compliance-current-trends.jpg)