68
DELSA/HEA/WD/HWP(2007)5 OECD HEALTH WORKING PAPERS PHARMACEUTICAL PRICING AND REIMBURSEMENT POLICIES IN SWEDEN Pierre Moïse and Elizabeth Docteur 28

DELSA/HEA/WD/HWP(2007)5
OECD HEALTH WORKING PAPERS
PHARMACEUTICAL PRICING AND REIMBURSEMENT POLICIES IN SWEDEN
Pierre Moïse and Elizabeth Docteur
28
Unclassified DELSA/HEA/WD/HWP(2007)5 Organisation de Coopération et de Développement Economiques Organisation for Economic Co-operation and Development 13-Sep-2007 ___________________________________________________________________________________________
English - Or. English DIRECTORATE FOR EMPLOYMENT, LABOUR AND SOCIAL AFFAIRS HEALTH COMMITTEE
Health Working Papers
OCED HEALTH WORKING PAPERS NO. 28 PHARMACEUTICAL PRICING AND REIMBURSEMENT POLICIES IN SWEDEN
Pierre Moïse and Elizabeth Docteur
JEL Classification: I18, I11 This document replaces the initial version of the report that, due to a production error, was missing the Introduction. This has now been corrected.
JT03231887
Document complet disponible sur OLIS dans son format d'origine Complete document available on OLIS in its original format
DE
LSA
/HE
A/W
D/H
WP(2007)5
Unclassified
English - O
r. English
Cancels & replaces the same document of 26 July 2007

DELSA/HEA/WD/HWP(2007)5
DIRECTORATE FOR EMPLOYMENT, LABOUR AND SOCIAL AFFAIRS
OECD HEALTH WORKING PAPERS
This series is designed to make available to a wider readership health studies prepared for use within the OECD. Authorship is usually collective, but principal writers are named. The papers are generally available only in their original language – English or French – with a summary in the other. Comment on the series is welcome, and should be sent to the Directorate for Employment, Labour and Social Affairs, 2, rue André-Pascal, 75775 PARIS CEDEX 16, France.
The opinions expressed and arguments employed here are the responsibility of the author(s) and do not necessarily reflect those of the OECD
Applications for permission to reproduce or translate all or part of this material should be made to:
Head of Publications Service
OECD 2, rue André-Pascal
75775 Paris, CEDEX 16 France
Copyright OECD 2007
2
DELSA/HEA/WD/HWP(2007)5
ACKNOWLEDGEMENTS
The authors wish to thank the Ministry of Health and Social Affairs and the Pharmaceutical Benefits Board (LFN) for helping to arrange the mission during which much of the information used in this report was collected. Special thanks go to Joakim Ramsberg for commenting on a draft version of this report.
Thanks are due also to the experts and stakeholders interviewed in the course of preparing this report, many of whom furnished data or publications referenced in the work: Anders Anell (The Institute for Health Economics ), Stefan Back (The Swedish Association of Local Authorities and Regions), Richard Bergström (Swedish Association of the Pharmaceutical Industry), Helena Dahlgren (SBU), Anders Dahlqvist (The Swedish Medical Association), Ulrica Dyrke (Ministry of Industry, Employment and Communications), Kristina Ekelund (National Board of Health and Welfare), Åsa Elffors (Ministry of Health and Social affairs), Andreas Engström (Pharmaceutical Benefits Board), Elis Envall (National Board of Health and Welfare), Samuel Hägg (Ministry of Justice), Åsa Kumlin (Medical Products Agency), Per Matses (Apoteket ), Sofia Medin (Ministry of Industry, Employment and Communications), Anne Nilsson (Ministry of Health and Social affairs), Kenneth Nyblom (Swedish Generic Manufacturers Association), Lars Rönnbäck (Apoteket ), Sara Rosenmüller (Ministry of Health and Social affairs), Per-Arne Sundbom (The Competition Authority), Ann-Christin Taubermann (Pharmaceutical Benefits Board), Magnus Thyberg (The Swedish Association of Local Authorities and Regions), Cecilia Ulleryd (Medical Products Agency), Bengt Wennerstein (Ministry of Industry, Employment and Communications), Barbro Westerholm (The Swedish Association for Senior Citizens), and Monica Widegren (The Competition Authority).
The authors thank Lihan Wei for assistance in the production of tables and figures included in this report; Valérie Paris, Peter Scherer and Martine Durand, for their comments and suggestions; and Gabrielle Luthy and Marie-Christine Charlemagne for secretarial support.
3

DELSA/HEA/WD/HWP(2007)5
ABSTRACT
This paper examines aspects of the policy environment and market characteristics of the Swedish pharmaceutical sector, assesses the degree to which Sweden has achieved certain policy goals, and puts forth some key findings and conclusions.
Thanks to low mark-ups in the distribution chain and no VAT for prescribed medicines, Sweden’s public prices for pharmaceuticals are relatively low, in contrast to average prices received by manufacturers, which are among the highest in Europe.
Recent reforms have helped to restrain pharmaceutical expenditure growth, following a period of double digit growth in the 1990s. Pharmaceutical expenditure per capita in Sweden is lower than the OECD average. Only five OECD countries devote less of their national income to pharmaceuticals. What limited evidence exists tends to suggest that relatively low pharmaceutical expenditures in Sweden are due to its low public prices, rather than to low levels of consumption.
Sweden introduced a new pricing and reimbursement scheme in 2002. Its main features are the use of cost-effectiveness analysis for determining the reimbursement status of new pharmaceuticals and mandatory substitution of the lowest-cost generic alternative. The use of cost-effectiveness analysis in reimbursement decisions helps to relate the reimbursement price paid to the social value of the product, but does not necessarily result in the lowest possible price.
The generic substitution policy has enabled Sweden to achieve fairly high penetration of generic drugs into the market in terms of volume, with a considerably low share of the total value of the market. However, the requirement to substitute only the lowest-priced listed drug risks undermining the competitiveness of the generic drug industry.
The Swedish pharmacy monopoly, Apoteket, is unique among OECD countries. Retail and wholesale margins are notably low, but pharmacy density is lower than elsewhere and other factors also limit consumer convenience. Consumer welfare would likely increase by opening the retail market for over-the-counter drugs (which are normally not reimbursed) to competition.
JEL Classification: I18, I11
Keywords: Pharmaceutical policy; pricing and reimbursement; pharmaceutical market; Sweden.
4

DELSA/HEA/WD/HWP(2007)5
RESUME
Le présent document passe en revue les différents aspects des politiques et des caractéristiques du marché du secteur pharmaceutique suédois, évalue l’atteinte des objectifs relatifs à la politique pharmaceutique suédoise et formule un certain nombre de constats et de conclusions.
Grâce à la faiblesse des marges de distribution et à l’absence de TVA sur les médicaments prescrits sur ordonnance, les prix publics des produits pharmaceutiques sont relativement bas, alors que les prix moyens perçus par les fabricants se situent parmi les plus élevés d’Europe.
Les récentes réformes ont contribué à freiner la croissance des dépenses pharmaceutiques, qui avait dépassé 10 % par an durant les années 1990. En Suède, les dépenses de médicaments par habitant sont inférieures à la moyenne des pays de l’OCDE. Seuls cinq pays de l’OCDE y consacrent une part plus faible de leur revenu national. Les éléments d’appréciation peu nombreux disponibles tendent à laisser penser que le niveau relativement peu élevé des dépenses de médicaments en Suède s’explique par le niveau peu élevé des prix publics, plutôt que par la faiblesse de la consommation.
La Suède a institué en 2002 un nouveau système de prix et de remboursement qui se caractérise essentiellement par le recours à l’analyse coût-efficacité pour la détermination du niveau de remboursement des nouveautés pharmaceutiques et le remplacement systématique par les génériques les moins onéreux. Le recours à l’analyse coût-efficacité pour l’adoption des décisions en matière de remboursement aide à relier le prix de remboursement à la valeur sociale du produit, mais ne garantit pas que le prix soit le plus bas possible.
La politique de substitution des génériques a permis à la Suède d’assurer un taux relativement élevé de pénétration en volume de ces produits sur le marché, alors qu’en valeur, ils ne représentent qu’une part extrêmement réduite du total. Toutefois, l’obligation de remplacer un médicament prescrit par le produit substituable le moins cher risque de compromettre la compétitivité de l’industrie des génériques.
Apoteket, qui détient le monopole de la distribution de produits pharmaceutiques en Suède, est un cas tout à fait à part dans les pays de l’OCDE. Les marges de gros et de détail sont notoirement peu élevées, mais la densité des officines pharmaceutiques est plus faible qu’ailleurs et d’autres facteurs limitent également le confort des consommateurs suédois. Il est vraisemblable que ces derniers bénéficieraient de l’ouverture à la concurrence pour la vente des médicaments en vente libre (qui ne sont généralement pas remboursés).
Classification JEL : 118, 111
Mots clés : Politique pharmaceutique ; tarification et remboursement ; marché pharmaceutique ; Suède.
5

DELSA/HEA/WD/HWP(2007)5
TABLE OF CONTENTS
ABSTRACT .................................................................................................................................................... 4 RESUME ......................................................................................................................................................... 5 INTRODUCTION ........................................................................................................................................... 8 THE POLICY ENVIRONMENT .................................................................................................................... 9
Pharmaceutical product approval procedures and outcomes ....................................................................... 9 Pricing policies .......................................................................................................................................... 13 Coverage for pharmaceuticals .................................................................................................................... 14
Cost sharing and subsidies for pharmaceuticals ..................................................................................... 14 Reimbursement policies ............................................................................................................................. 15
Pricing .................................................................................................................................................... 16 Impact of reimbursement policies on time to market ............................................................................. 19 Criticisms of the reimbursement decision process ................................................................................. 20
Purchasing .................................................................................................................................................. 21 Policies and other initiatives to influence drug use .................................................................................... 22
Generic substitution................................................................................................................................ 22 County council volume controls ............................................................................................................ 22
Innovation policies ..................................................................................................................................... 24 Intellectual property rights ..................................................................................................................... 25
PHARMACEUTICAL MARKET CHARACTERISTICS ........................................................................... 28 Expenditure ................................................................................................................................................ 28
Pharmaceutical prices and volumes ....................................................................................................... 31 Financing ................................................................................................................................................... 34 Pharmaceutical industry activity ................................................................................................................ 35
R&D ....................................................................................................................................................... 36 Trade ...................................................................................................................................................... 37 Parallel Trade ......................................................................................................................................... 38
Supply of pharmaceuticals ......................................................................................................................... 39 Distribution channels ................................................................................................................................. 42
Wholesalers and distributors .................................................................................................................. 42 Retail ...................................................................................................................................................... 43
ACHIEVEMENT OF POLICY GOALS ...................................................................................................... 46 Containment of pharmaceutical expenditure ............................................................................................. 46 Sustainability and equity of financing for pharmaceuticals ....................................................................... 47 Efficiency of expenditures ......................................................................................................................... 47 Availability of pharmaceuticals ................................................................................................................. 48 Accessibility of pharmaceuticals ............................................................................................................... 48 Quality of care and health outcomes .......................................................................................................... 49 Satisfaction with the public monopoly ...................................................................................................... 49 Industrial policy goals ................................................................................................................................ 50
KEY FINDINGS AND CONCLUSIONS ..................................................................................................... 51 LIST OF ACRONYMS ................................................................................................................................. 53 STUDIES OF CROSS-COUNTRY COMPARISONS OF PHARMACEUTICAL PRICES ....................... 54
6

DELSA/HEA/WD/HWP(2007)5
REFERENCES .............................................................................................................................................. 61 Tables
Table 1. Patient co-payments ............................................................................................................... 15 Table 2. Drug expenditures in Sweden at pharmacy retail prices, 1993 - 2004 .................................. 35 Table 3. Price formula for retail sales of pharmaceuticals .................................................................. 44 Table 4. Summary of findings from selected studies comparing Swedish pharmaceutical price levels with those of other countries .............................................................................. 54 Table 5. Difference in the average price of pharmaceuticals in Sweden compared to other countries ....................................................................................................................... 60
Figures
Figure 1. Average time from application for market authorisation to approval, 1999 - 2003 .............. 11 Figure 2. Average time from first world application for marketing authorisation to application in
market .................................................................................................................................... 12 Figure 3. Average time from pricing and reimbursement application to reimbursement ..................... 20 Figure 4. Drug expenditure per capita, public and private spending, 2004 .......................................... 28 Figure 5. Share of pharmaceutical expenditure in total health spending and in GDP, 2004 ................ 29 Figure 6. Real annual growth in pharmaceutical spending and total health expenditure (net of
pharmaceutical expenditure), 1997-2004 .............................................................................. 30 Figure 7. Annual growth of pharmaceutical expenditures in Sweden 1997-2004 ................................ 31 Figure 8. Pharmaceutical production in OECD countries, latest available year ................................... 36 Figure 9. Business expenditures for R&D (BERD) performed in the pharmaceutical industry (Share in
GDP and in total BERD) ....................................................................................................... 37 Figure 10. Trends in exports and imports of pharmaceuticals in Sweden, 1980 - 2003 ......................... 38 Figure 11. Average time from approval in market to launch, 1999 - 2003 ............................................. 40 Figure 12. Average time between first world application for marketing authorisation and launch in
country, 1999 - 2003 .............................................................................................................. 41 Figure 13. Generic market share, 2004 ................................................................................................... 42 Figure 14. Swedish prices for individual pharmaceuticals compared to the corresponding European
average ................................................................................................................................... 56 Figure 15. Average price of pharmaceuticals in 18 European countries (Sweden = 100) ...................... 57
Boxes
Box 1. Marketing authorisation in the European Economic Area .................................................... 10 Box 2. Pharmaceutical reimbursement review .................................................................................. 16 Box 3. Pharmaceuticals and intellectual property rights in the European Union .............................. 26 Box 4. European Court of Justice Ruling on Apoteket's monopoly .................................................. 45
7

DELSA/HEA/WD/HWP(2007)5
INTRODUCTION
1. This report is the fourth in a series of case studies aimed at describing and analysing pharmaceutical policies used in selected OECD countries. These case studies are part of a broader OECD project on the impact of pharmaceutical pricing and reimbursement policies.
2. Sweden is a small country of nine million inhabitants, about 12% of whom were not born in Sweden (OECD, 2006b). With a per capita income of 31 000 USD PPP, Sweden is 13th among OECD countries.
3. The political system in Sweden is a constitutional monarchy, with a hereditary monarch as Head of State. It is divided into three independent levels of government: the national government, 18 county councils, and 290 municipalities. The county councils’ main responsibilities are for health and medical care and public transport. Decentralisation of the healthcare system has given the county councils even greater responsibility in the delivery of healthcare services. The main responsibilities of the municipalities are in the areas of education, elderly care, child care, road, water and sewage.
4. The Swedish health system provides universal coverage for a range of healthcare services similar to most other OECD countries. Financing, a shared responsibility between the central government and the county councils, is mostly tax-based. Although individuals share in the cost of healthcare services, the public sector is by far the most significant financial contributor.
5. The main objective of this paper is to describe and analyse Sweden’s pharmaceutical reimbursement and pricing policies and, as far as possible, to assess their effects at the national level. However, since these policies cannot be considered in isolation from other policies and contextual elements, this paper first presents the main policies pertaining to the pharmaceutical sector in Sweden, next reviews the characteristics of the Swedish pharmaceutical market and concludes with an assessment as to how well policy goals are being achieved and what role pharmaceutical policies have played in this respect. Key findings and conclusions are set forth at the end of the report.
8

DELSA/HEA/WD/HWP(2007)5
THE POLICY ENVIRONMENT
6. The first part of this report examines the policy environment within which the pharmaceutical sector in Sweden exists. It examines the regulations that pharmaceutical manufacturers face when brining a product to the market in Sweden: marketing authorisation, pricing and reimbursement, and intellectual property rights. Coverage for pharmaceuticals provided to Swedish citizens is also reviewed. Finally, the various policies used to influence pharmaceutical use are analysed.
Pharmaceutical product approval procedures and outcomes
7. The Medical Products Agency (MPA) is responsible for granting national authorisation for pharmaceuticals to be sold in Sweden. National marketing authorisation is only available for drugs that do not require community marketing authorisation (centralised approval is available for marketing a drug throughout Europe).
8. Fees derived from marketing authorisation applications – together with annual fees – for approved drugs provide the MPA with 95% of its financing; government funding related to medical devices provides the remaining 5%.
9. When seeking national marketing authorisation, a pharmaceutical manufacturer submits an application with the Medical Products Agency. MPA staff members assess the information provided by the manufacturer, compiling an overall assessment and draft recommendation for approval which is presented to the Medical Products Agency’s scientific quality assurance group for acceptance or rejection of the application. Most recent figures on national approval delays, which include evaluations for parallel imports and approvals intended for Sweden only, give an average approval time for national marketing authorisation of 13 months (median 10 months) in 2006.
10. A national marketing authorisation granted to a manufacturer by the MPA may also be used to market a product in other European Economic Area (EEA) countries, through the decentralised or mutual recognition procedures (see Box 1). The MPA is one of the preferred agencies to act as a reference member state (RMS) in the mutual recognition procedure, having been chosen more often than any other agency between 2003 and 2005 (PICTF, 2006). The average approval time in 2006 when Sweden was the RMS in the mutual recognition procedure was 6 months (median 8 months).
9

DELSA/HEA/WD/HWP(2007)5
Box 1. Marketing authorisation in the European Economic Area
Authorisation for marketing a medicine within the European Economic Area (EEA)1 is granted through the competent authority of any EEA country – valid within the particular country – or through one of the recognised procedures for obtaining authorisation in more than one EEA country. The holder of a marketing authorisation valid within the EEA must have an established presence within the EEA.
The London based European Medicines Agency (EMEA) was established in 1995 to coordinate the evaluation and European market authorisation for both human and animal medicinal products. The EMEA operates under the aegis of the European Commission’s DG Enterprise, to which it forwards its opinions for approval for final marketing authorisation in all member states.
There exist three procedures for obtaining marketing authorisation in more than one EEA country: the centralised procedure, the mutual recognition procedure, and the decentralised procedure.
The Centralised Procedure (CP) is used to obtain a marketing authorisation valid in all EEA countries. The procedure is mandatory for, but not limited to, biotechnology, AIDS, cancer, diabetes, neurodegenerative disorder medicines as well as orphan drugs. Applications submitted to the EMEA by manufacturers are evaluated by the Committee for Proprietary Medical Products (CPMP) – comprised of 2 experts nominated by each member state. The CPMP subcontracts the assessment to two rapporteurs selected from a pool of 3 500 drug evaluation specialists in national regulatory agencies. The CPMP has 210 days from receipt of the dossier to provide a recommendation to the European Commission for final approval; however the clock can be stopped when rapporteurs request additional information from the applicant. Total accumulated time during which the clock is stopped generally should not exceed 6 months.
The Decentralised and Mutual Recognition procedures are based on the principle of recognition by other member states of a first approval granted by the authorities of one member state.
Through the Mutual Recognition Procedure (MRP), manufacturers can apply for marketing authorisations in designated “Concerned Member States” (CMS) by validating the marketing authorisation previously granted in another member state – the “Reference Member State” (RMS). The competent authority in each CMS has 90 days in which to decide whether it agrees with the RMS’ marketing approval decision. In case of disagreement, the RMS sends the concerns to the CPMP; if a consensus is not reached after a further 60 days, the procedure moves into arbitration by the CPMP.
The Decentralised Procedure (DP), introduced in 2005, increases the EMEA’s co-ordinating role to facilitate the harmonisation of marketing approvals. Manufacturers of new products not yet marketed in one of the EEA member states (and not obliged to use the CP), as well as generic versions of original products authorised through the CP, designate a Reference Member State to undertake the assessment. Identical dossiers are submitted to Concerned Member States where approval is also sought. The RMS steers the approval process, seeking agreement on elements that must be harmonised in CMSs and provides a decision. A maximum of 210 days is granted (including a maximum of three months for clock stops to allow for applicants to respond to objections raised during evaluation) to the RMS and the CMSs to come to an agreement on the full dossier. If agreement is not forthcoming then an additional 90 days are granted for arbitration, with a final decision by the CPMP. The recommendation is then forwarded to the European Commission for final decision on granting or refusing a marketing authorization valid in all Concerned Member States.
The main difference between the MRP and the DP is that the latter is sought in cases where no marketing authorisation has been granted in an EEA country. Under the MRP and DP, manufacturers have greater control over the choice of RMS than with the centralised procedure.
A manufacturer can apply for a national marketing authorisation for products not obliged to go through the centralised procedure, if it intends to market a pharmaceutical in only one EEA country, or as a first step in the Mutual Recognition Procedure. Recent legislation to increase transparency requires that national regulatory bodies make marketing authorisations available ‘without delay’ and publicly release clinical documentation, assessment reports and reports on the reasons that underlie the decision. Generic manufacturers often seek approval through national procedures for two reasons: (1) expiry dates of patents and supplementary protection certificates differ from one country to another, and (2) original products may have different forms, strengths, and labelling across countries, necessitating different studies to prove bio-equivalence. However, since 2005 generic manufacturers have the option of going through the centralised procedure for originals approved through the centralised procedure.
Notes
1. The EEA is composed of the 27 European Union member countries plus Norway, Iceland and Liechtenstein.
10

DELSA/HEA/WD/HWP(2007)5
11. In 2006, 651 products (54 new chemical entities) were approved in Sweden, of which: 72 were approved through the centralised procedure, 194 through the mutual recognition procedure and 385 were approved nationally (251 of which were parallel imports). In a comparison with 15 other European countries (EU countries plus Norway and Switzerland), the distribution of procedures used for approving 78 newly introduced medicines – those granted marketing authorisation between 1 January 1997 and 30 June 2001 – was similar in Sweden to other countries. Of the 52 granted marketing authorisation in Sweden during this period: 30 were approved through the centralised procedure, 21 through the mutual recognition procedure and one through the national procedure (CPC, 2002).
Figure 1. Average time from application for market authorisation to approval, 1999 - 2003
0
5
10
15
20
25
30
German
y
Sweden UK
USA
Netherl
ands
France
Italy
Switzerl
and
Spain
Austra
lia
Canad
aJa
pan
Mon
ths
Source: Adapted from Pharmaceutical Industry Competitiveness Task Force, Competitiveness and Performance Indicators 2005, indicator 26, from Association of the British Pharmaceutical Industry calculations
12. Drug approval times in Sweden are relatively quick, broadly in line with the MPA’s target approval times. Data compiled by the United Kingdom’s Pharmaceutical Industry Competitiveness Task Force (PICTF) show the average time from application by the manufacturer for national marketing authorisation to approval of said application by the MPA was 13.7 months during the period 1999 – 2003; similar to the United Kingdom, with only Germany (13.3 months) having quicker approval times in Europe (Figure 1), although this is generally in line with the other European countries, for which marketing authorisation approval times were no longer than 15 months.1Manufacturers are also fairly quick in applying for marketing authorisation in Sweden, relative to the first application in the world. Figure 2 shows the time lag between the first application for marketing authorisation in the world and the application in the respective country, for the period 1999 – 2003. Sweden, at 7.3 months, is grouped in a cluster of six countries for which the application for marketing approval is generally filed within 7 – 8 1 . See also Rawson (2003), who found that the average time from application to approval for 186 new drugs
between 1999 and 2001 was faster in Sweden than in the United Kingdom, Canada and Australia, although not as fast as the United States.
11

DELSA/HEA/WD/HWP(2007)5
months following the first application in the world. The United States stands alone at just under 3 months, followed by Canada, the United Kingdom and Switzerland, where application is usually within 6 months.
Figure 2. Average time from first world application for marketing authorisation to application in market, 1999 – 2003
0
2
4
6
8
10
12
14
16
18
USA
Canad
a UK
Switzerl
and
Sweden
Austra
lia
Netherl
ands
France
German
ySpa
inIta
lyJa
pan
Mon
ths
Source: Adapted from Pharmaceutical Industry Competitiveness Task Force Competitiveness and Performance Indicators 2005, indicator 25, from Association of the British Pharmaceutical Industry calculations
13. An increased risk of compromised drug safety is a potential trade-off of quicker approval times. Several studies using US data have examined the relationship between approval times and safety, with mixed results. Friedman et al. (1999) and Berndt et al. (2006) did not find any association between reduced approval times for Food and Drug Administration (FDA) approved drugs and subsequent withdrawals from market due to safety concerns. Contrary to these findings, a comparison of approval times and drug withdrawals between the United States and Canada found that shorter approval times in the United States were offset by more drugs being withdrawn from market for safety reasons (Rawson and Kaitin, 2003). Furthermore, Olson (2002), using the number of reported adverse events for drugs on the market as an indicator of drug safety problems,2 showed that shorter FDA approval times were associated with increases in adverse drug reactions leading to death or hospitalisation. Rudholm (2004) employed the same methods as Olson (2002) for Swedish data to show that shorter approval times for the Medical Products Agency were associated with more adverse drug reactions, although the effects were considered to be small; a one year decrease in approval time was associated with an average of between 2.56 and 3.86 additional adverse events.
2 . Using adverse drug reactions (ADRs), as opposed to drug withdrawals, lowers significantly the statistical
variation because there are significantly more reported adverse events – 16 148 ADRs requiring hospitalisation and 5 243 leading to death in the Olson study – then there are drug withdrawals – 22 in the Berndt et al. study.
12

DELSA/HEA/WD/HWP(2007)5
14. Generic drug manufacturers must also apply for national or community marketing authorisation through one of the three procedures recognised within the European Union. The main difference between generic drug and new drug applications for marketing authorisation is that, for the former, regulatory agencies assess data on bio-equivalency tests rather than clinical trial data. Upon proof of bio-equivalency the MPA will issue authorisation for the manufacturer to market the drug in Sweden.
15. Once a generic drug has received approval for marketing in Sweden it is eligible for inclusion in the List of Substitutable Products – the list of generic drugs that can be substituted for the original product under Sweden’s generic substitution law.3 The Medical Products Agency decides whether or not a generic drug will be included in the list. However, the MPA can only initiate the process of determining if the generic is substitutable after the Pharmaceutical Benefits Board – the agency responsible for determining whether or not a drug will be reimbursed under Sweden’s pharmaceutical reimbursement system – has made a reimbursement decision; a process which can take between 2 and 6 months. In addition, the manufacturer of the original product can appeal a substitution decision, which automatically removes the generic from the List of Substitutable Products until the courts have resolved the issue. These processes effectively add to the period of the original product’s market exclusivity.
16. Needless to say, the generic manufacturers do not like the current process for determining substitutability. This is also of concern at the MPA, the Pharmaceutical Benefits Board and the Swedish Competition Authority, who together drafted proposed changes which they presented to the Ministry of Health and Social Affairs in early 2006. Their proposal has been drafted as a government bill which is now before parliament, which, if adopted, is scheduled to become law on 1 July 2007.
17. With respect to post-market surveillance, the MPA has in place a de-centralised reporting system for adverse events. Health sector employees are required by law to report adverse drug reactions to the MPA, at one of 6 regional centres (MPA, 2006). These data are used by the MPA to monitor adverse drug reactions. They are also compiled into a register that is available to researchers (Rudholm, 2004).
Pricing policies
18. There is no explicit pharmaceutical pricing regulation in Sweden. A manufacturer is, in theory, able to set whatever price it deems the market will bear for its product, provided it has received approval to market the drug in Sweden. In practice, if the manufacturer wishes for its product to be reimbursed under Sweden’s pharmaceutical reimbursement system, it must propose a price at which the Pharmaceutical Benefits Board (known by its Swedish acronym, LFN) will find the drug cost-effective. This type of de facto price regulation exists for prescription drugs for out-patient care and a few OTC products, i.e. products eligible for reimbursement (LFN, 2007). The markets for in-hospital drugs and most over-the-counter (OTC) products are said to be characterised by free or market-based pricing since prices for these products are not subject to scrutiny by the LFN for inclusion in Sweden’s Pharmaceutical Benefits Scheme (PBS).
19. A prescription medicine being sold in a health-care system with a single payer will, almost inevitably, need to be included among the reimbursed products if it is to attain a significant market share. In Sweden, this means a manufacturer must propose a price at which the LFN will allow the product to be included on the positive list for reimbursement. If the LFN determines that the product is not cost-effective at the manufacturer’s proposed price, it will not be included on the positive list. The manufacturer is free to resubmit its application for reimbursement at a lower price. Alternatively, the manufacturer may appeal the LFN’s decision to an administrative court.
3 . The generic substitution law stipulates that a pharmacy is obliged to substitute the cheapest generic drug
available for the prescribed product. See Policies and other initiatives to influence drug use.
13

DELSA/HEA/WD/HWP(2007)5
20. Of course, if a manufacturer has reason to believe its product will be denied reimbursement at its suggested price, it has the option of not seeking reimbursement. The manufacturer could choose not to market its product in Sweden; this has indeed happened on a couple of occasions according to an official within the LFN, but these “marginal” products were not expected to generate particularly high sales. Alternatively, it could sell the product in Sweden without being on the positive list, at a price higher than what the LFN would consider cost-effective. If it chooses this route then it must report its price to Apoteket AB – the monopoly retail pharmacy, referred to hereinafter as Apoteket – in order to be included in Apoteket’s monthly price list.
21. Manufacturers are free to set any price they deem the market will bear for the majority of OTC products, which are not reimbursed. In the case of in-hospital drugs, manufacturers are not wholly free to set prices for these are negotiated between them and the county councils, who have responsibility for hospitals in Sweden. These negotiations apply equally to in-hospital drugs that are also available through the PBS and those that are used exclusively in-hospital.
Coverage for pharmaceuticals
22. All Swedes are covered for prescription drugs dispensed outside of hospital, provided they are included in the Pharmaceutical Benefit Scheme’s positive list of reimbursed drugs, and are prescribed by an authorised prescriber with a labelled workplace code.4 Patients must pay full price for products not covered under the PBS. County councils are responsible for subsidising their residents’ retail drug purchasers which they are supposed to finance through block grants received from the central government. Apoteket is reimbursed by the county councils for all drugs dispensed that are partially or wholly subsidised. Private health insurance is very limited. In 2003, about 2.3% of the population had private insurance, although the market for it is said to be growing (Glenngård, 2005). Private health insurance is used primarily for gaining quick access to specialists, and sometimes for jumping ahead of the queue for elective surgical procedures.
Cost sharing and subsidies for pharmaceuticals
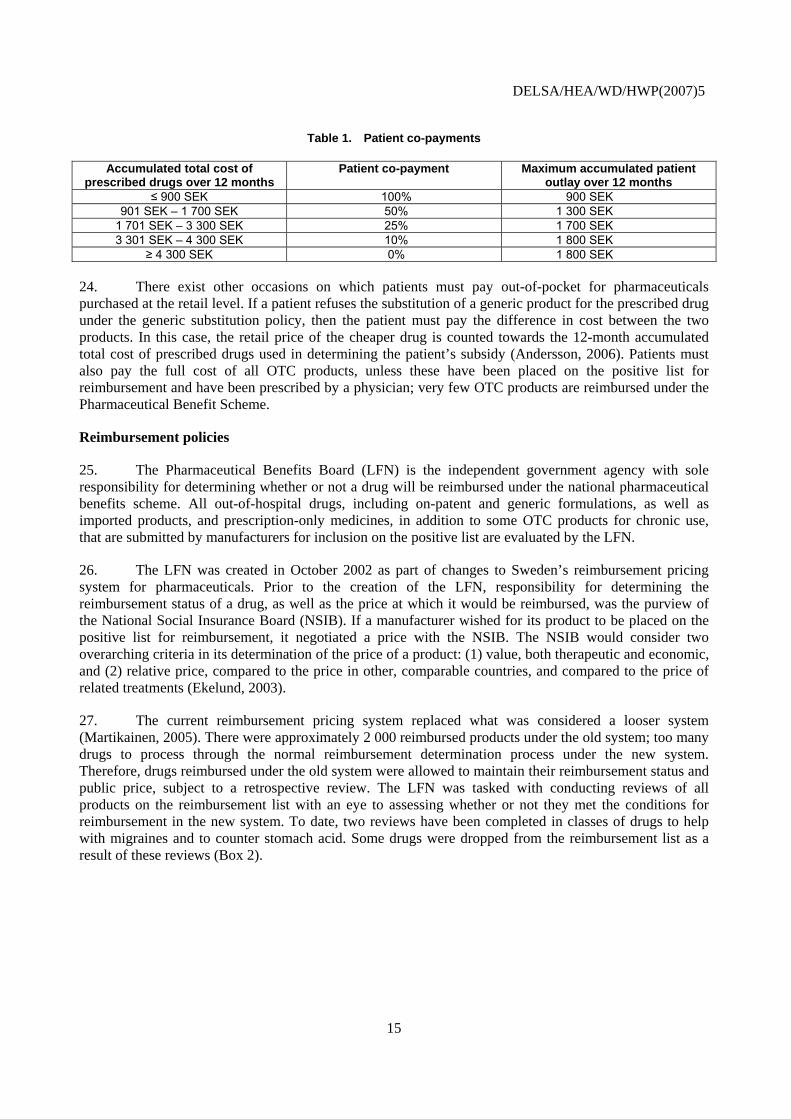
23. Since 1997, patients have shared the cost of prescribed drugs in Sweden through a graduated cost-sharing scheme; there is no cost sharing for inpatient drugs. Over the course of one year patients pay the full cost of reimbursable drugs until they have spent the threshold level of 900 SEK.5 Once the threshold level has been reached, patients pay a fraction of the total cost of any reimbursable drugs they purchase. The level of the patient co-payment diminishes with the cumulative amount spent until a maximum of 4 300 SEK is reached, above which all pharmaceuticals are provided free of charge to the patient (Table 1). The maximum amount in any given year a patient will spend on pharmaceuticals under this system is 1 800 SEK.6 Families with children under 18 years may combine the total cost of all pharmaceuticals prescribed for their children. There are no co-payments for insulin.
4 . Authorised prescribers include doctors, dentists, nurses, midwives, or licensed dental hygienists. The
workplace code identifies the prescribing provider’s place of work. It is used to link the prescribing provider with the costs of pharmaceuticals.
5 . The exchange rate as of 19 April 2007 was 10 SEK = 1.48 USD = 1.09 EUR
6 . Apoteket, the state-owned pharmacy monopoly, is obliged to offer customers a partial-payment system. This system cost Apoteket 21 million SEK in 2005, although improved debt recovery has seen the costs of bad debts decrease substantially since 2002 (Apoteket, 2006).
14
DELSA/HEA/WD/HWP(2007)5
Table 1. Patient co-payments
Accumulated total cost of prescribed drugs over 12 months
Patient co-payment Maximum accumulated patient outlay over 12 months
≤ 900 SEK 100% 900 SEK 901 SEK – 1 700 SEK 50% 1 300 SEK
1 701 SEK – 3 300 SEK 25% 1 700 SEK 3 301 SEK – 4 300 SEK 10% 1 800 SEK
≥ 4 300 SEK 0% 1 800 SEK
24. There exist other occasions on which patients must pay out-of-pocket for pharmaceuticals purchased at the retail level. If a patient refuses the substitution of a generic product for the prescribed drug under the generic substitution policy, then the patient must pay the difference in cost between the two products. In this case, the retail price of the cheaper drug is counted towards the 12-month accumulated total cost of prescribed drugs used in determining the patient’s subsidy (Andersson, 2006). Patients must also pay the full cost of all OTC products, unless these have been placed on the positive list for reimbursement and have been prescribed by a physician; very few OTC products are reimbursed under the Pharmaceutical Benefit Scheme.
Reimbursement policies
25. The Pharmaceutical Benefits Board (LFN) is the independent government agency with sole responsibility for determining whether or not a drug will be reimbursed under the national pharmaceutical benefits scheme. All out-of-hospital drugs, including on-patent and generic formulations, as well as imported products, and prescription-only medicines, in addition to some OTC products for chronic use, that are submitted by manufacturers for inclusion on the positive list are evaluated by the LFN.
26. The LFN was created in October 2002 as part of changes to Sweden’s reimbursement pricing system for pharmaceuticals. Prior to the creation of the LFN, responsibility for determining the reimbursement status of a drug, as well as the price at which it would be reimbursed, was the purview of the National Social Insurance Board (NSIB). If a manufacturer wished for its product to be placed on the positive list for reimbursement, it negotiated a price with the NSIB. The NSIB would consider two overarching criteria in its determination of the price of a product: (1) value, both therapeutic and economic, and (2) relative price, compared to the price in other, comparable countries, and compared to the price of related treatments (Ekelund, 2003).
27. The current reimbursement pricing system replaced what was considered a looser system (Martikainen, 2005). There were approximately 2 000 reimbursed products under the old system; too many drugs to process through the normal reimbursement determination process under the new system. Therefore, drugs reimbursed under the old system were allowed to maintain their reimbursement status and public price, subject to a retrospective review. The LFN was tasked with conducting reviews of all products on the reimbursement list with an eye to assessing whether or not they met the conditions for reimbursement in the new system. To date, two reviews have been completed in classes of drugs to help with migraines and to counter stomach acid. Some drugs were dropped from the reimbursement list as a result of these reviews (Box 2).
15

DELSA/HEA/WD/HWP(2007)5
Box 2. Pharmaceutical reimbursement review
When the LFN was created in October 2002, there were already 2 000 pharmaceutical products that were being reimbursed by the state. As a practical measure, it was decided their reimbursement status would be grandfathered into the new reimbursement scheme, pending a retrospective review of their cost-effectiveness. The review commenced at the end of 2003 and is scheduled to finish by end of 2011 (LFN, 2006a).
The LFN will apply the same criteria – cost-effectiveness principle, human value principle, and the need and solidarity principle – in the reimbursement reviews as it does for any new drug. The reviews are to be conducted for 49 therapeutic groups. Size of sales volumes determine the order by which the drugs are reviewed; therapeutic categories with the largest sales are being reviewed first.1 However, the first two categories to be reviewed, drugs for treating migraines and drugs for treating stomach acid, were chosen based on other criteria. For each therapeutic category, a review of the relevant medical and health economics literature is undertaken to inform a decision as to whether or not a more in-depth review is warranted. If an initial review shows there to be uncertainty regarding the suitability of continued reimbursement, either for the whole therapeutic category or for a subset of drugs within the category, a full pharmacoeconomic assessment for the therapeutic category or specific products will proceed; otherwise, the LFN will conclude that the drugs within the category should continue to be reimbursed.
Following the review of drugs to treat migraine headaches, the LFN decided that it would no longer reimburse the tablet form of Imigran (100 mg), but reimburse at a price 42% lower the substitutable product Imigran Novum (100 mg) (LFN, 2005a). The review also recommended that the price of Naramig (2.5 mg) be decreased by 14%. The remaining migraine medicines were allowed to retain their reimbursement status. The LFN estimates that these decisions will have saved “society” 42 million SEK in 2005.
The review of drugs – proton pump inhibitors (PPIs), H2 antagonists and other drugs – used for treating disease caused by stomach acid led the LFN to recommend continued reimbursement for three PPIs, including a generic PPI and limited reimbursement for another PPI.2 The LFN also recommended that five PPIs lose their reimbursement status, along with all H2 antagonists, and the drugs Andapsin, Gaviscon and Novaluzid. These decisions, the LFN estimates, will save Swedish “society” 175 million SEK (LFN, 2005b).
The LFN’s reimbursement decision on stomach acid drugs was not without controversy. Several manufacturers decided to appeal the LFN’s de-listing decision. During the appeal process these drugs will retain their reimbursement status until the courts have ruled on the matter (LFN, 2005b).
Notes
1. There are six ongoing reviews under way in 2007. These are drugs for: high blood pressure, asthma and coughing, depression, high cholesterol, pain and diabetes.
2. Nexium. Reimbursement limited to a diagnosis of ulcers in the oesophagus or in cases where another PPI, or generic PPI, does not provide satisfactory results. Another drug, Cytotec, was also granted limited reimbursement.
Pricing
28. A manufacturer may apply to have a drug included in the positive list under the reimbursement pricing system provided it has received approval for marketing the drug in Sweden. When applying for reimbursed status, the manufacturer proposes a price for the drug.7 The drug is accepted or rejected at the price proposed by the manufacturer; in practice, there is no negotiation on price. If a product is rejected for inclusion on the positive list the manufacturer may reapply by either proposing a lower price or presenting new evidence that could affect the LFN’s reimbursement decision. By all accounts, the LFN rejecting a pharmaceutical for reimbursement because the price is too high is a rare occurrence. Manufacturers also retain the option to withdraw their applications before the LFN renders its final decision. When the LFN decides not to list a drug on the positive list, the decision is not made public. The same confidentiality rule applies when a manufacturer withdraws its application before the LFN renders its final decision.
7 . The manufacturer must submit with each application for reimbursement for a new drug documentation that
illustrates the drug’s clinical effects, the cost/benefit ratio and the total expected costs to society. Comparisons are to be made with the generally accepted treatment at the time of application (LFN, 2003a).
16

DELSA/HEA/WD/HWP(2007)5
29. When deciding a prescription drug’s reimbursement status, the LFN evaluates the extent to which the drug fulfils each of three criteria: the cost-effectiveness principle, the human value principle, and the need and solidarity principle.
30. Cost-effectiveness is the main criterion considered.8 The LFN analyses both direct and indirect costs and benefits when reviewing the health economics analysis submitted by the manufacturer. With regard to direct costs, all costs related to the use of the drug are evaluated; these include those related to physician visits, the cost of the drug itself (at the proposed price) for a typical course of treatment, any costs related to subsequent healthcare interventions, and costs incurred due to any side-effects the drug induces. The direct benefits include: any improvements in health status – measured as quality-adjusted life years (QALYs), including gained life years for treatments that mostly affect survival – brought about through utilisation of the drug and any cost savings, in terms of foregone medical treatments.
31. An important methodological principle of the cost-effectiveness criterion is that cost-effectiveness be assessed from a “societal perspective,” i.e. both direct and indirect costs and benefits should be taken into consideration, irrespective of who benefits or who bears the costs (patients, payers). On the costs side of the ledger this would include, for example, costs due to side-effects of the drug. On the other side, the LFN considers benefits such as gains in worker productivity due to less sick days taken.9 The adoption of the “societal viewpoint” in cost-effectiveness analysis is atypical and may be unique to Sweden’s system; more often costs are considered from the payers perspective (e.g. NICE considers cost-effectiveness analysis from the UK-NHS perspective).
32. The other two criteria act as guiding principles in the reimbursement decision process. According to the “human value” principle, the LFN must respect the equality of all persons, i.e. it cannot discriminate against people because of their sex, race, age and so on, when considering a drug for reimbursement status. The “need and solidarity” principle brings to the reimbursement decision process a system of triage; drugs that treat those with the greatest health needs take precedence.
33. An internal project team analyses the health economic analyses submitted by the applicant to determine whether a drug is cost-effective at the price proposed by the manufacturer. All relevant information, including the team’s recommendation for reimbursement, is then submitted to the LFN’s board – a chairperson plus ten members drawn from various backgrounds, including representatives of patients’ interests, but no industry representation – which meets once per month and takes the final decision on a drug’s reimbursement status. Reimbursement decisions are taken on the product’s entire approved area of use; only rarely has reimbursement been granted to a limited area of use or for specific patient sub-groups (LFN, 2007).
34. While the board must weigh all three criteria when rendering a decision on reimbursement, it is clear that the cost-effectiveness principle is the crucial criterion. The results of the cost-effectiveness analysis act as a go/no-go decision point; if the drug is deemed not to be cost-effective at the proposed price then it will normally not be placed on the positive list. However, there have been cases where the need and solidarity principle has trumped the cost-effectiveness principle.10
8 . The LFN has released a set of general guidelines on its preferred approach for the economic evaluation of
pharmaceuticals for reimbursement (LFN 2003b).
9 . This is not a trivial consideration in Sweden, which has the highest rate of absenteeism due to ill health in the OECD (OECD, 2005).
10 . Orphan drugs are probably the most obvious example. According to Anell and Persson (2005), several orphan drugs were approved for reimbursement despite their weak cost-effectiveness. Oncology drugs are another example of pharmaceuticals that are usually reimbursed, despite the fact many of them are not
17

DELSA/HEA/WD/HWP(2007)5
35. There is no explicit consideration of the budgetary impact,11 or financing implications, of the drug (overall or in terms of the drug budgets of the county councils)12 when deciding on the reimbursement status of a pharmaceutical. Nor is the level of the price proposed by the manufacturer compared with the price at which the drug is available in other countries, as it was under the previous system.
36. The board has 180 days following receipt of a fully completed application form to announce its decision on reimbursement.13 In the case where a product has been rejected, the manufacturer has the right to appeal the decision to a public administrative court.14 During the first 30 months of the LFN’s existence (October 2002 – March 2005), there were 107 cases of “principal importance” (Anell, 2005a). In 82 cases, the drug was reimbursed unconditionally and for all indications. Limited and/or conditional reimbursement was granted in twelve cases. Thirteen drugs were denied reimbursement outright.15
37. There is no process for making regular/periodic price increases; thus the price that is set by the manufacturer at the time of application will be the basis upon which the maximum reimbursement price for that drug is determined. The manufacturer is free to submit another application with a higher price, but according to LFN general guidelines,16 it must first request the product be “removed from the pharmaceutical benefits system in order to apply for reimbursement again” (LFN, 2006b).17 In this case the LFN processes the application as though it were an ordinary application for reimbursement, not as a request for a higher price of a product already included in the reimbursement list. The decision to reimburse at the higher price is based on analysis of new supporting documentation. Therefore, there is no guarantee that the LFN will find the drug cost-effective at the higher price. Essentially, a manufacturer requesting a price increase for a pharmaceutical on the positive list incurs the risk of having the drug taken off the list.
considered cost-effective. Finally, there is the example of H2 antagonists, which are used for treating milder symptoms of stomach acid such as heartburn. As a result of the reimbursement review, H2 antagonists were dropped from the positive list because the conditions they treated were minor, despite the fact they are considered cost-effective treatments.
11 . Manufacturers seeking reimbursement for a pharmaceutical should submit information regarding relevant costs for treatment and ill health, regardless of the payer (LFN, 2003c). The total budgetary impact may be considered in the case of a drug targeted at a small population, e.g. orphan drugs, which usually have low expected sales, but high cost per patient. These may be granted reimbursement, even when not judged cost-effective, because the total budgetary impact would not be large.
12 . The county councils are represented by a group (Pharmaceutical Benefits Group for County Councils – Landstingens läkemedelsförmånsgrupp) that has the right to evaluate the application for reimbursement sent in by the manufacturer and argue before the LFN board.
13 . Ordinance (2002:687) on Pharmaceutical Benefits, etc., Section 9. This falls within the prescribed limit of 180 days as set out in Article 6 of EU Directive 89/105/EEC. Since a firm that is confident a product will receive marketing approval is able to submit an application for reimbursement prior to such approval, it is possible that a drug is placed on the positive list at the same time as it has received marketing approval.
14 . There have been about 25 cases where a firm has appealed a decision of the LFN’s board, according to an official of the agency interviewed for this paper.
15 . For two drugs, Robinul (bradycardia) and Aunativ (hepatitis B), reimbursement was denied because the indications stated in the application were not approved (Anell, 2005).
16 . Valid as of 9 November 2006.
17 . The de-listing can be requested to take effect 180 days from the date of application for an increase in price, i.e. the maximum permissible time for the LFN to render a decision, to enable the simultaneous removal of the drug from the system at the lower price and its reintroduction at a higher price (assuming it is granted reimbursement).
18

DELSA/HEA/WD/HWP(2007)5
38. There are two conditions under which a request for a price increase can be accepted as such by the LFN, without obliging the manufacturer to resubmit the drug for reimbursement. A price increase for any product which is included under the Medical Product Agency’s list of substitutable products will be approved so long as it is not greater than the price of the most expensive product in the substitutable group. The LFN may also approve a request for a price increase if the following two criteria are fulfilled: (1) If the medicine is an urgent therapeutic alternative which is used to treat a serious condition which endangers a patient’s life and health, and there are patients who risk being without similar treatment if the product disappears from the Swedish market, and (2) there is a genuine risk that the product will disappear from the Swedish market if the price increase is not approved. Under these two circumstances, a decision must be given within 90 days from the time the application is received by the LFN;18 otherwise the requested price is accepted. Unlike general reimbursement decisions, price increases are decided by the Director-General of the LFN, rather than the Board.
39. Manufacturers must also apply to the LFN if they wish to lower the price of a pharmaceutical. Decisions on price decreases are made as soon as possible. The LFN makes decisions on price changes once a month (LFN, 2007). As of June 2006, the LFN decided on approximately 20 000 price change applications, 80% of which were for price decreases (LFN, 2006c); almost all the price increases were for increases that were below the price ceiling for generic products.
Impact of reimbursement policies on time to market
40. Cost-effectiveness is often described as the ‘fourth hurdle’ in the regulatory process of getting a new drug to market – the other three being safety, efficacy and quality. A new drug has to clear the first three hurdles during the marketing approval process. In Sweden, as in other countries with cost-effectiveness requirements for reimbursable products, cost-effectiveness adds another hurdle that a new drug must clear if it is be subsidised by public purchases and maximise sales potential, increasing the time it takes to make a prescription drug available on the market following marketing authorisation.
41. Compared to other European countries, including those whose pricing and reimbursement decisions are based on factors other than cost-effectiveness, Sweden’s cost-effectiveness requirement does not result in notable delays in getting a drug to market. Figure 3 shows the average delay from application for pricing and/or reimbursement to approval for reimbursement. The average delay from application for reimbursement to approval was shorter in Sweden (about 135 days)19 than for all but four (of 22) European countries (May 2004), according to the PICTF (2006); Austria and Denmark had shorter delays, whereas there were no delays in Germany and the United Kingdom, where drugs eligible for reimbursement are covered after market authorisation at the price set by the manufacturer. However, when compared to similar data for reimbursement decisions prior to the establishment of the LFN, a different picture emerges. The delay from application for pricing and reimbursement to approval in Sweden – for 78 new drugs approved for marketing authorisation in Europe between 1 January 1997 and 30 June 2001 – was about 100 days (CPC, 2002).20Although these data may not be strictly comparable, they do suggest that the stricter reimbursement consideration process may have added an extra 30 days to the length of time it takes to get a new drug approved for reimbursement. This finding is supported by a study which demonstrated that the introduction of formal cost-effectiveness requirements in Sweden and Finland was associated with an increase in time lags between drug authorisation and reimbursement – the mean lag time in Sweden was
18 . The 90 day delay is in line with Article 3 of the EU Transparency Directive 89/105/EEC.
19 . In 2006 the average reimbursement decision took 91days (PPRI, 2007).
20 . The time from application to approval includes: about 90 days from the date of application, plus about 10 days from the time company was notified by the authorities of approval to the time the decision was recorded in the official reimbursement list, a prerequisite for reimbursement.
19

DELSA/HEA/WD/HWP(2007)5
114 days prior to the introduction of the cost-effectiveness requirement, 157 days following (Lundkvist, 2006).21
42. Recognising that formal cost-effectiveness requirements can delay market access, the LFN allows a manufacturer to make an application for reimbursement as much as 180 days in advance of expected receipt of market authorisation, if it is certain that such authorisation will be granted. If a manufacturer chooses to take advantage of this allowance, and is able to, then it is feasible for its product to be placed on the positive list for reimbursement at the same time as the granting of marketing authorisation.
Figure 3. Average time from pricing and reimbursement application to reimbursement
0
100
200
300
400
500
600
700
800
German
yUK
Denmark
Austria
Sweden
Switzerl
and
Irelan
d
Finlan
d
Netherl
ands
Norway
Spain
Italy
Portug
al
Greece
France
Belgium
Num
ber o
f day
s
1997 - 2001 2004
Source: Cambridge Pharma Consulting (2002), Delays to Market Access In Europe for data from 1997 – 2004; PICTF (2006), Competitiveness and Performance Indicators 2005, for 2004 based on data from the European Federation of Pharmaceutical Industries and Associations (EFPIA). Note: The data for 1997 – 2001 were derived from a questionnaire sent to the holders of marketing authorisations for each of the 78 pharmaceutical products that received marketing authorisation in these countries between 1 January 1997 and 30 June 2001. The data for 2004 were taken from figures calculated by the EFPIA.
Criticisms of the reimbursement decision process
43. The LFN, like reimbursement authorities in some other countries, has been criticised for the lack of transparency in its process. Applications for reimbursement are made known to the public only if reimbursement is granted; but not if the manufacturer withdraws the application before a decision is made or if the LFN decides not to reimburse the product. Lack of transparency in the case of a negative decision
21 . There is a bias in the estimate of mean time lag since the study did not include drugs with time lags greater
than 550 days. The inclusion of these drugs would have increased somewhat the mean time lag, especially considering that the study covered the period between January 1995 and April 2003, meaning the cost-effectiveness requirement had been in place for only 6 months in Sweden.
20

DELSA/HEA/WD/HWP(2007)5
is largely to the benefit of the manufacturer who may wish to resubmit the application for reimbursement at a lower price, and equally, may not wish to have authorities in other countries aware that the drug has been rejected for reimbursement in Sweden at a certain proposed price. A manufacturer whose product is reimbursed in other countries may opt to make a negative decision known to the public so as to create political pressure for obtaining reimbursement by trying to gain public support for a product that is “available in other countries, why is it not available in Sweden?”
44. The way in which LFN makes economic assessments has also come under criticism (Anell, 2005a). Reimbursement is normally granted to a product as a whole, rather than for specific indications (LFN, 2007). Nevertheless, the LFN guidelines for economic evaluations note that medications may be cost-effective for certain indications or with certain patient groups, but the medications themselves can never be cost-effective. LFN has on occasion granted reimbursement on a limited basis; as noted earlier, there were 12 cases where reimbursement was limited or conditional during the LFN’s first 2 ½ years of existence (Anell, 2005a). Granting reimbursement for a product as a whole gives physicians considerable leeway for off-label prescribing, even if the particular indications have not been proven to be cost-effective.
45. The lack of a defined threshold for what constitutes a cost-effective product is an issue that is subject of an ongoing debate among those familiar with Sweden’s pricing reimbursement system. Products are to be compared with the most often-used treatment in Sweden, implying that drugs with a cost-effectiveness ratio comparable to existing treatments will be found cost-effective. For products that lack comparators, the situation is less clear. No guidance has been given as to acceptable cost-effectiveness ratios, defined in terms of cost per QALY or otherwise. Rather than apply a single threshold, there may be different (implicit) thresholds depending on the severity of the disease or an assessment of patient need. This provides LFN with flexibility in assessing cost effectiveness and in applying the other principles that go into determining a product’s reimbursement status. It is likely to make it more difficult for manufacturers to “game the system” by proposing a price just at the threshold where the product’s use could be shown to be cost-effective. However, this probably also contributes to perceived lack of transparency in the decision process.
Purchasing
46. The main responsibility for purchasing pharmaceuticals for in-hospital use rests with the County Councils. They have the right, since 1997, to purchase drugs directly from manufacturers (Glenngård, 2005), which are regulated by the Public Procurement Act. Smaller county councils often come together to purchase pharmaceuticals through a tendering system. Although pharmaceuticals used in hospitals are normally purchased at the county council level (PPRI, 2007), under certain circumstances hospitals can obtain discounts directly from manufacturers when purchasing pharmaceuticals for their own use (Glenngård, et al., 2005). Although hospitals have the option of running their own pharmacies, they have not chosen to do so. As a consequence, all drugs are delivered to hospitals through Apoteket.
47. The county councils have considerable leverage, being able to extract lower prices from manufacturers for in-hospital drugs than the reimbursement price for the same drugs that are available through the Pharmaceutical Benefits Scheme. The lower prices come in the form of volume rebates they negotiate with manufacturers, which are usually about 8-10% of the original purchase price. It normally takes about six months for the county councils to receive the rebates; although it delivers pharmaceuticals to hospitals, Apoteket does not receive rebates.
21

DELSA/HEA/WD/HWP(2007)5
Policies and other initiatives to influence drug use
Generic substitution
48. Although district nurses and midwives have limited rights for prescribing pharmaceuticals, their prescribing practices are supervised by physicians (Glenngård, et al., 2005). Policies designed to influence prescribing behaviour are therefore directed mainly at physicians. Moreover, since physicians do not dispense medications, initiatives aimed at influencing drug use at the point of dispensing are aimed at pharmacists.
49. An important element of the change to Sweden’s reimbursement pricing system in 2002 was the introduction of mandatory generic substitution. Since October 2002, in a bid to curtail public spending on pharmaceuticals, pharmacies are obliged to substitute the drug a physician prescribes with the lowest priced generic substitute or parallel-import – provided a product certified by the Medical Products Agency as substitutable is in stock at the customer’s pharmacy (LFN, 2007).22 If a physician determines that the specific drug prescribed should be the one dispensed – physicians are currently not obliged to prescribe using the International Non-proprietary Name – this must be indicated on the prescription as “substitution not allowed.” In this case, the drug is fully reimbursed (less the regular cost-sharing amount). As described previously, a patient may choose to stay with the originally prescribed drug provided he pays the difference.
50. Once a generic producer has received substitutability certification from the MPA, it then applies for inclusion on the positive list proposing an entry price for its product. If the price is the lowest in its category then that product will be the drug that pharmacists are obliged to substitute, garnering for it almost all sales of that drug until such a time as a competitor proposes a lower price for its product.
51. The generic substitution policy was designed to achieve cost savings by encouraging price competition among generics. Data from the FGL (Swedish Generics Manufacturer’s association) suggest that the policy has been very effective in promoting greater generic market penetration for off-patent medicines. Prior to 2003 generics never held more than a 35% market share in Sweden in terms of number of units (12% in terms of value); by 2005, generics had increased their share of the market to 41% (13% in terms of value), a 17% increase (LFN, 2006c; Andersson, 2006). Furthermore, an analysis by the LFN of the change in pharmaceutical prices between October 2002 and December 2005, suggests the policy has been successful in reducing generic prices by approximately 40% (LFN, 2006c). The policy also appears to have reduced the average yearly co-payment for prescribed medicines (Andersson, 2006).
52. However, the competition engendered by the substitution policy has produced the “all or nothing” phenomenon – whereby a generic drug captures almost all sales if it is the lowest price drug in its category, or no sales if there is a lower-priced product. The possibility is real that some companies (notably importers of generics) may not be able to afford the large inventories they must keep if their product is not the lowest price of the month. Thus, there is a risk that competition will reduce the field to a few players, and as the number of firms competing diminishes, prices of generic products will begin to edge back up.
County council volume controls
53. The county councils, with a shared responsibility for financing pharmaceuticals and full responsibility for reimbursing pharmacies for covered drugs, have the greatest incentive to influence drug use and the means by which to do so. However, they have no influence on which drugs are reimbursed, nor
22 . The dispensing pharmacy is required to inform the prescriber in writing (Act (2002:160) on
Pharmaceuticals, etc.)
22

DELSA/HEA/WD/HWP(2007)5
on the prices of these drugs, and are not allowed to negotiate rebates for out-of-hospital pharmaceuticals. Thus, the county councils only recourse in controlling drug expenditures is through means of influencing the quantity and the type of drugs consumed. To this end, the county councils have created formulary committees called Drug and Therapeutic Committees (DTCs), by which they can try to influence physicians’ prescribing patterns, and hence, the quantity of drugs consumed.
54. DTCs have been regulated by a separate act since 1997 (Anell, 2005a). Each county council is required to set up at least one Drug and Therapeutic Committee. The purpose of the DTCs is to promote the “safe and cost-effective use of pharmaceuticals” (Anell, 2005a), primarily for outpatient care (HIT, 2005). The committees have three main responsibilities:
• produce lists of drugs recommended as the first choice treatment for a range of common diseases;
• produce treatment guidelines;
• send doctors and pharmacists as educators to present information on drugs to healthcare centres, in a manner similar to industry sales representatives.
55. The work of the DTCs is not without controversy. Their guidelines are often considered more restrictive than the LFN’s decisions on reimbursement (Anell, 2005a). Both the industry and the LFN contend that the committees perform their own cost-effectiveness studies (which the committees deny), which sometimes conflict with the LFN’s recommendations.23 A survey of DTCs in 2000 found only three examples where cost-effectiveness was used in guiding decisions (Anell, 2005a). Nevertheless, in a bid to ease tensions between the two levels of government, the latest funding agreement between the central government – which provides grants for drugs purchased through the Pharmaceutical Benefits Scheme – and the county councils calls for the committees to use the LFN’s decisions as a base when producing lists of drugs recommended as first-line treatments.
56. DTCs are also known to use health technology assessments (HTA) as a means of influencing prescriber behaviour. The main producer of HTAs in Sweden is the Swedish Council on Technology Assessment in Health Care (known by its Swedish acronym, SBU); there is also the National Board of Health and Welfare, which uses HTAs in producing medical guidelines. DTCs use reports from both agencies, as well as from the Cochrane Collaboration, when putting together treatment guidelines.
57. The Drug and Therapeutic Committees have focused on promoting substitution of “lower priced and well documented” drugs within therapeutic areas with large sales volumes, and issuing guidelines on prescription volumes for specific – usually new and expensive – drugs within selected therapeutic areas 24 (Anell, 2005a). DTCs have not been very successful in changing the prescription behaviours of physicians, at least not during the first few years of their existence.25 They have had some success in getting physicians
23. A controversial case involved conflicting recommendations related to the use of Crestor, an anti-
cholesterol drug produced by AstraZeneca. Some pharmaceutical committees recommended against its use, although the LFN recommended reimbursement if a patient was unsuccessfully treated with simvastatin.
24 . For example, the Stockholm County DTC has set a target whereby 80% of statin prescriptions should be for the generic simvastatin (PPRI, 2007).
25 . Melander A and L-G Nilsson (2001), Läkares relationer till läkemedelskommittéer. Attityder och faktisk förskrivning (Physicians attitudes towards formulary committees and actual prescribing patterns), Apotekarsocieteten: Stockholm – referenced in Anell (2005a).
23

DELSA/HEA/WD/HWP(2007)5
to comply with recommendations when these were linked to financial incentives,26 although compliance has been better when promoting substitution of lower-priced products than for influencing prescription volumes (Anell, 2005a). Furthermore, the introduction of mandatory generic substitution has reduced the impact of DTC substitution policies, which hitherto had largely concentrated on substituting lower priced pharmaceuticals for higher priced drugs in therapeutic areas with large sales volumes (Anell, 2005a).
58. Another means by which the county councils are trying to control pharmaceutical expenditures is through placing restrictions on contacts between pharmaceutical industry representatives and physicians. The Swedish Federation of County Councils and the pharmaceutical industry signed an agreement that came into effect on 1 January 2005, covering various types of co-operation between pharmaceutical companies and medical professionals. Restrictions include: a cap on reimbursement of travel expenses, accommodation and food (50%); invitations to scientific conferences are to be sent to hospital management, who decide which healthcare professionals are allowed to attend; a ban on social activities connected to these conferences; and a ban on sponsoring events organised by healthcare professionals themselves (Horton, 2005). The agreement extends to all professionals working in the public healthcare sector, manufacturers and their marketing companies. It is legally binding, with fines of up to 250 000 SEK.
59. Each county council must agree separately to the terms of the agreement; not all county councils have signed on. While some county councils that have yet to endorse the terms of the agreement may eventually sign-on, there are county councils who feel the agreement does not go far enough and have forbidden contact between public-sector physicians within their jurisdiction and the pharmaceutical industry (Horton, 2005).
60. Visits by sales representatives to physicians are known to be an effective tool used by manufacturers in influencing physicians’ prescribing habits, thus the county councils’ efforts at curtailing these contacts can be effective tools in exerting controls on the volume and type of drugs prescribed. However, sales representatives do impart useful information to healthcare professionals about their products, albeit not unbiased. County councils reportedly have not yet taken steps to replace the sales representatives in this function by establishing or strengthening other sources of up-to-date information on pharmaceuticals.
Innovation policies
61. In June 2004, the Swedish government presented its strategy aimed at making Sweden Europe’s most competitive and dynamic knowledge-based economy, in part by initiating a dialogue between government and key business sectors. Following on this initiative, the Ministry for Industry and Trade began developing a strategic programme for dialogue between the government and the pharmaceutical, biotechnology and medical devices industries. The publication Pharmaceuticals, Biotechnology and Medical Devices – an Integral Part of Innovative Sweden lays out the government’s strategy programme for making these sectors Europe’s most competitive.
62. The dialogue between industry and government resulted in a strategy programme that identified several areas where efforts can be made to improve and reinforce the Swedish pharmaceutical (and biotechnology and medical devices) industry. One of the main areas identified was research and development (R&D) in the life sciences. The central government, for its part, is expected to gradually increase funding for medical research between 2005 and 2008 by 400 million SEK. Co-operation between
26 . Nordling S, A Anell and S Jansson (2003), Kostnadsansvar och belöningssystem för förbättrad
läkemedelsanvändning (Budget responsibility and incentive schemes for a rational use of drugs), IHE: Lund – referenced in Anell (2005a).
24
DELSA/HEA/WD/HWP(2007)5
government and business was another area deemed important. Within the life sciences field, the Swedish Agency for Innovative Systems (Vinnova) will help promote more co-operative R&D projects between industry and academia, as well as facilitate the movement of researchers between the two domains of R&D.
63. The strategy programme also recognises the need to go beyond the “R” in R&D – the type of basic life sciences research that academic researchers concentrate on – and promote the “D” side as well. The programme identified promoting the commercialisation of research findings as integral to increasing the competitiveness of Sweden’s pharmaceutical sector. A competitive industrial framework was cited as a “precondition for continued investments in research, development and production” (Ministry of Industry, Employment and Communications, 2005). The government allocated 100 million SEK for support for new R&D in small and medium-sized firms (not specifically targeted to pharmaceutical R&D), and beginning in 2007, 200 SEK will be allocated for a tax credit for the same purpose. Finally, recognising the global nature of the pharmaceutical industry, the programme calls for efforts to increase the internationalisation of Sweden’s industry through such measures as: initiatives to increase foreign direct investment in Sweden, continued co-operation within the EU Framework Programme for research and development, and co-operation on projects in developing countries.
64. The reimbursement pricing system is another component of Sweden’s innovation policy. One of the stated goals is to stimulate innovation by signalling that the Swedish government is willing to allow high ex-manufacturer prices for new pharmaceuticals that are cost-effective from a societal perspective (LFN, 2007). The LFN also has the discretion to give a manufacturer the benefit of the doubt if there is some question regarding the assumptions underlying the cost-effectiveness of its product. In some cases, the product will be granted reimbursement with the understanding that the cost-effectiveness of the product, and hence its reimbursement status, will be revisited when more data are available.27 However, there is no provision for recuperating overpayments that may have occurred in the meantime.
Intellectual property rights
65. Effective and enforceable intellectual property rights (IPR) are a crucial component for developing innovative pharmaceuticals. By all accounts, the Swedish legal system provides adequate IPR protection. It is a signatory to the Patent Cooperation Treaty and a member of the World Intellectual Property Organisation, in addition to its obligations to adhere to European Union IPR regulations (Box 3).
66. In 2002, 250 pharmaceutical-related patents were granted in Sweden, sixth among European countries. The pharmaceutical industry in Sweden was the fourth most productive in terms of generating patents per 100 persons employed, producing 1.16 patents per 100 employees (EUROSTAT, 2005).
27 . In other cases, a decision on reimbursement may be postponed until the company has presented new data, or reimbursement may be temporarily granted under the condition that cost-effectiveness will be revisited when more data are available.
25

DELSA/HEA/WD/HWP(2007)5
Box 3. Pharmaceuticals and intellectual property rights in the European Union
Patents
There is no single, centrally enforceable EU-wide patent. A European patent refers to patents granted by the European Patent Office (EPO). Under the European Patent Convention (EPC) treaty – signed by Sweden in 1977, ratified in 1980 – the EPO provides a single, harmonised procedure for granting patents in the European Union. Applications can be made in one of the official languages of an EPC contracting state to the EPO’s offices in Munich, but processing of the patent is done in one of the three official languages of the EPO (English, French and German).The applicant designates which countries of the EPC it wishes to file for patent protection. A favourable decision by the EPO grants a patent in each of the designated states. However, the determination of ownership, validity and infringement are subject to respective national laws. Furthermore, while a national court may invalidate a patent in one country, the European patent remains valid in the other designated countries. A European patent is, in effect, non-unitary across all EU countries and independent in each.
The EPC does impose some limits on its signatories. The basis for determination of validity of a patent by national law is limited to a few reasons, but the standard on which the determination is made is that of national law. The convention also requires all jurisdictions to give a European patent a term of 20 years from the filing date, either the date of filing with the EPO for a European patent or for an international application under the Patent Cooperation Treaty,1
Intellectual property rights exhaustion
Beyond the issue of patent protection, the principle of IPR (patent and trademark) exhaustion rights – the concept by which an intellectual property rights owner loses the rights to control distribution and resale of its product once the first sale has been achieved – is another IPR issue that is relevant to the pharmaceutical industry. From a legal standpoint, the definition of exhaustion regime depends on whether exhaustion is recognised as “national” or “international” exhaustion. Taking trademark rights as an example, in a country which adheres to a national exhaustion regime, once a brand-name medicine is placed for sale on the market in that country by the owner, or by a reseller such as a pharmacy, the trademark owner loses the right to control the sale of that product in that country. The owner can, however, forbid importation of the product. Under international exhaustion, once the owner of the brand-name medicine, or a reseller, places the product for sale in any country in which it enjoys trademark protection, it forfeits the right to control sale of that product in all countries for which the product enjoys trademark protection. Thus, the trademark owner cannot prevent trade in its product in countries that adhere to an international exhaustion regime (Calboli, 2002).
The member states of the European Union have developed a hybrid of the national and international exhaustion regimes – Community-wide exhaustion. Under this doctrine:
“once a product has been put on the market in a particular Member State, by or with the consent of the legitimate trademark owner, the owner can no longer rely on his national rights to prevent the importation of the product from that State into another Member State.”
Community-wide exhaustion was adopted in the spirit of harmonizing trade within the EU; it is the IPR issue underlying the parallel trade of pharmaceuticals within the European Union. However, European Court of Justice rulings have made it clear that the principle of community-wide exhaustion supersedes national exhaustion regimes (Carboli, 2002), restricting parallel trade to within the member states of the European Union.
Supplementary Protection Certificate
A holder of a pharmaceutical patent still in force in the European Economic Area can apply for a supplementary protection certificate (SPC), an extension of intellectual property rights for said patent. An SPC is a unique, patent-like IPR that comes into force after the patent expires, for a maximum period of 5 years. There is no single European SPC; applications are made on a country-by-country basis. The term of the SPC depends on the time between patent application and granting of marketing authorisation.4 An SPC is a tool governments use to compensate manufacturers for the lengthy period of time it sometimes takes for granting marketing authorisation, however it does delay the entry of generic drugs onto the market.
Bolar provision5
In response to the Roche -v- Bolar judgement, the United States Congress passed the Hatch-Waxman Act, in 1984, which granted drug manufacturers the right to “make, use, offer to sell, or sell … a patented invention” for uses
26
DELSA/HEA/WD/HWP(2007)5
related to submission of information under Federal law regulating drugs.2 The use by generic manufacturers of pharmaceuticals still under patent protection for the purpose of submitting information to regulatory agencies for obtaining marketing authorization has, until recently, been governed in Europe by each member state’s national law.
The European Commission concluded that a provision for generic manufacturers similar to the Hatch-Waxman Act should be permitted for all member states. In 2004, the EC revised Directive 2001/83/EC on the Community code relating to medicinal products for human use, to include the following amendment:
“Conducting the necessary studies and trials … and the consequential practical requirements shall not be regarded as contrary to patent rights or to supplementary protection certificates for medicinal products.”3
Member states had 18 months from April 2004 to implement the Directive into their national laws.
The amendment clearly allows the use of on-patent medicines by users other than the holder of the patent for “conducting the necessary studies and trials” for “consequential practical requirements”, but left uncertain the legality of other actions, such as supplying or exporting on-patent medicines to generic manufacturers. By using the ambiguous wording “consequential practical requirements”, the EC has apparently left the interpretation to national courts (Ashurst, 2005).
Data exclusivity
Complementary to Bolar Clause type provisions are legislation that protect the clinical trial data that original product manufacturers are required to submit in their applications to regulatory agencies for marketing authorisation. The original product manufacturers argue that such protection is necessary; otherwise they are at an unfair disadvantage since generic producers can use these rather expensive data at no cost. The generic producers reply that not having access to these data act as a restriction on producing generic products, thereby limiting the availability of cheaper alternative pharmaceuticals.
One of the European Commission’s amendments to Directive 2001/83/EC revised EU aspects of data protection. It provided that test data supplied by the manufacturer of an original product, as required by marketing authorisation legislations, are protected for a period of eight years following the first marketing approval in a member state. This period of exclusivity is followed by a two-year period during which generic versions of the original product may not be launched on the market of any member state, although marketing authorisation can be granted during this period. Finally, the original producer can obtain an additional one-year period of market exclusivity beyond the two-year period if, during the eight-year data exclusivity period, the producer obtains marketing authorisation for additional indications which bring a substantial clinical benefit compared with existing therapies. In effect, this new regulation creates the so-called “8+2+1” formula which guarantees the original producer a period of market exclusivity equivalent to ten years, with the possibility of extending that exclusivity to 11 years (Sanjuan, 2006).
Member states had until 30 October 2005 to implement the new Directive. In the face of opposition to the new law from prospective member states who were not able to vote on it, these states can request derogation. The law came into full effect in November 2005, meaning that the first generic drugs to be affected by this law will not come on to the market in the European Union until 2015.
Notes
1. The Patent Cooperation Treaty provides a unified procedure for filing patent applications.
2. Drug Price Competition and Patent Term Restoration Act (Public Law 89-417, 35 U.S.C. paragraph 271(e)(1))
3. Directive 2004/27/EC, Article 10(6), 31 March 2004.
4. For the purpose of granting an SPC, marketing authorisations granted in Switzerland are also considered since Liechtenstein automatically accepts authorisations granted in Switzerland.
5. In 1984, Roche Products Inc. sued Bolar Pharmaceuticals Corp. Inc. for violating its patent for flurazepam-HCI. Bolar had obtained some of the active ingredient from a foreign manufacturer and had started the bio-equivalency studies necessary for obtaining marketing approval for a generic version of Roche’s patented product, prior to the patent’s expiration. A court of appeal overturned a lower court’s decision, saying that Bolar had violated Roche’s patent. This judgment meant that generic manufacturers could not conduct bio-equivalency studies for obtaining marketing authorisation until the patent of the original product expired.
27

DELSA/HEA/WD/HWP(2007)5
PHARMACEUTICAL MARKET CHARACTERISTICS
67. This section reviews various components of the pharmaceutical market in Sweden, including expenditure trends and components of spending, pharmaceutical production, supply and trade.
Expenditure
68. Sweden spent 348 USD PPP per capita on pharmaceuticals in 2004, less than the OECD average of 393 USD PPP (Figure 4). Compared to the other Nordic countries,28 only Denmark spent less (270 USD PPP). This makes Sweden different from most other countries with a strong pharmaceutical manufacturing presence; other countries so characterised – the United States, France, Germany, Italy, Japan and Switzerland – all spent significantly more per capita on pharmaceuticals than did Sweden.
Figure 4. Drug expenditure per capita, public and private spending, 2004
752
599559
520494 477
434 429 425 424 421 407377 375 364
344321 318 315 308
270238
138
348
299
393400
261
0
100
200
300
400
500
600
700
800
United
States
France
Canad
aIta
ly
Icelan
dSpa
in
Luxe
mbourg
German
y
Japa
n (1)
Switzerl
and
Portug
al
Austria
Austra
liaOECD
Greece
Norway
Finlan
d
Sweden
Belgium (1
)
Irelan
d
Netherl
ands
(1)Kore
a
Hunga
ry (2)
Slovak R
epub
lic (2)
Denmark
Czech
Rep
ublic (
2)
Poland
Mexico
USD PPP
Public Private
(1) 2003; (2) 2002
Source: OECD Health Data October 2006
28 . Nordic countries are the countries of the Nordic Council (Denmark, Finland, Iceland, Norway and
Sweden), the forum for Nordic parliamentary co-operation.
28
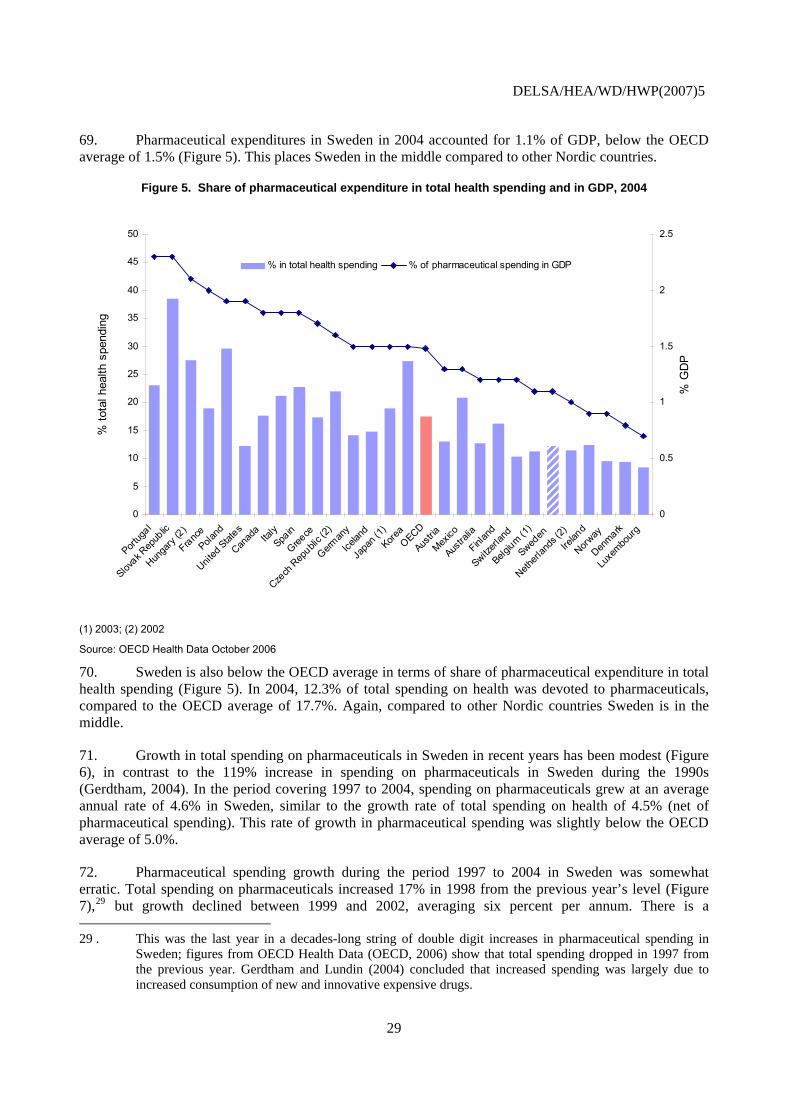
DELSA/HEA/WD/HWP(2007)5
69. Pharmaceutical expenditures in Sweden in 2004 accounted for 1.1% of GDP, below the OECD average of 1.5% (Figure 5). This places Sweden in the middle compared to other Nordic countries.
Figure 5. Share of pharmaceutical expenditure in total health spending and in GDP, 2004
0
5
Portug
al
Slovak R
epub
lic
Hunga
ry (2)
FrancePola
nd
United
States
Canad
aIta
lySpa
in
Greece
Czech
Rep
ublic (
2)
German
y
Icelan
d
Japa
n (1)
KoreaOECD
Austria
Mexico
Austra
lia
Finlan
d
Switzerl
and
Belgium (1
)
Sweden
Netherl
ands
(2)
Irelan
d
Norway
Denmark
Luxe
mbourg
0
10
15
20
25
30
35
40
45
50
% to
tal h
ealth
spe
ndin
g
0.5
1
1.5
2
2.5
% G
DP
% in total health spending % of pharmaceutical spending in GDP
(1) 2003; (2) 2002
Source: OECD Health Data October 2006
70. Sweden is also below the OECD average in terms of share of pharmaceutical expenditure in total health spending (Figure 5). In 2004, 12.3% of total spending on health was devoted to pharmaceuticals, compared to the OECD average of 17.7%. Again, compared to other Nordic countries Sweden is in the middle.
71. Growth in total spending on pharmaceuticals in Sweden in recent years has been modest (Figure 6), in contrast to the 119% increase in spending on pharmaceuticals in Sweden during the 1990s (Gerdtham, 2004). In the period covering 1997 to 2004, spending on pharmaceuticals grew at an average annual rate of 4.6% in Sweden, similar to the growth rate of total spending on health of 4.5% (net of pharmaceutical spending). This rate of growth in pharmaceutical spending was slightly below the OECD average of 5.0%.
72. Pharmaceutical spending growth during the period 1997 to 2004 in Sweden was somewhat erratic. Total spending on pharmaceuticals increased 17% in 1998 from the previous year’s level (Figure 7),29 but growth declined between 1999 and 2002, averaging six percent per annum. There is a
29 . This was the last year in a decades-long string of double digit increases in pharmaceutical spending in
Sweden; figures from OECD Health Data (OECD, 2006) show that total spending dropped in 1997 from the previous year. Gerdtham and Lundin (2004) concluded that increased spending was largely due to increased consumption of new and innovative expensive drugs.
29

DELSA/HEA/WD/HWP(2007)5
considerable deceleration in yearly growth in 2003 (1.8%) and 2004 (0.1%), the first two full years of existence of the Pharmaceutical Benefits Board (LFN) and Sweden’s generic substitution policy. The trend in public spending growth for pharmaceuticals is similar to total spending, although for most years public spending grew at a higher rate.
Figure 6. Real annual growth in pharmaceutical spending and total health expenditure (net of pharmaceutical expenditure), 1997-2004
11.9
9.0
8.1 8.0 7.97.5
7.16.7 6.7
6.2 6.1
5.2 5.2 5.0 5.0
3.63.3
3.0
0.3
-0.8
8.5
6.3
4.94.7
5.5
7.0
4.95.2
4.8
3.5
4.3
2.3
11.4
4.6
3.0
3.7
1.7
3.3
7.7
6.7
4.5
7.4
5.4
3.6
1.4
4.6
4.0
2.4
5.0 4.6
7.7
3.5
5.0
4.2
0.0
2.0
4.0
6.0
8.0
10.0
12.0
14.0
Irelan
d
d Stat
es
ary (2
)
xico (
3)
Canad
aKore
a
ublic
(4)
ustra
lia
Icelan
dSpa
in
ands
(2)
Greece
OECD
Finlan
d
France
Austria
Norway
mbourg
Sweden
Portug
al
Denmark
zerla
nd Italy
German
y
apan
(1)
ublic (
2)
gium (1
)
Annu
al G
row
th R
ate
(199
7-20
04)
-2.0Unit
eHun
gMe
Slovak R
ep A
Netherl Lu
xeSwit J
Czech
Rep Bel
Pharmaceutical expenditure THE (net pharmaceutical)
(1) 1997-2003; (2) 1997-2002; (3) 1999-2004; (4) 1999-2003
Source: OECD Health Data October 2006
30

DELSA/HEA/WD/HWP(2007)5
Figure 7. Annual growth of pharmaceutical expenditures in Sweden, 1997-2004
20.8
16.515.0
20.0
25.0at
e (%
)
11.0
4.61.6
8.8
0.11.8
7.03.15.4
8.3
-0.52.3
-5.0
0.0
5.0
10.0
1997-98 1998-99 1999-00 2000-01 2001-02 2002-03 2003-04
Annu
al g
row
th r
Total expenditure Public expenditure
Source: OECD Health Data, October 2006
Pharmaceutical prices and volumes
Prices
73. Cross-country comparisons of pharmaceutical prices are technically difficult and heavily reliant on underlying assumptions. In order to draw general conclusions regarding a country’s relative price levels, it is important to look at a number of studies that use different approaches to assess price levels. In the case of Sweden, several studies using different methodologies have been conducted in the recent past. These studies are described and their findings are reviewed in detail, together with an original analysis by the authors drawing on information on price structure and data from other studies, in an annex to this report. The main findings are summarised below.
74. On the basis of recent studies, one can conclude that Sweden has an interesting situation with respect to its price levels. While ex-manufacturer prices in Sweden are fairly high, the country’s wholesale pharmaceutical prices appear to be in line with other European countries, and final retail price levels are moderate by European standards.
75. Results from two studies suggest that manufacturers’ prices in Sweden are roughly comparable with those of the relatively high-priced countries of Canada and Switzerland.30 In the 2005 annual report by the Canadian Patented Medicine Prices Review Board, Sweden’s ex-manufacturer prices were found to be three per cent lower than those paid in Canada for the mix of pharmaceutical products purchased in Canada in 2005 (PMPRB, 2006). In a study comparing ex-manufacturer prices in eleven countries during the second quarter of 2003 (IMS, 2003),31 prices in Sweden were shown to be an average of 10% lower than in Switzerland. Original analysis undertaken for this study shows ex-manufacturer prices for new products in Sweden to be slightly higher than those found in Switzerland, but a basket of top-selling pharmaceuticals in Sweden were priced ten per cent lower in Sweden than Switzerland. 30 . For a review of the evidence of relative price levels in these countries, see Paris and Docteur (2006) and
(2007).
31 . Top 100 selling pharmaceuticals in Switzerland in the second quarter 2003.
31

DELSA/HEA/WD/HWP(2007)5
76. Studies by LFN (2005c, 2006d) have found that Sweden’s wholesale prices are in line with the wholesale prices paid elsewhere in Europe. A study of the wholesale prices for eight pharmaceuticals that received marketing approval in Europe through the centralised procedure showed a similar pattern (Martikainen, 2005). It found that the average wholesale price in Sweden of eight products was 19% lower than in Ireland and 9% lower than in Denmark, 20% higher than in Belgium and 18% higher than in Spain, and similar to Finland and France.
77. Sweden’s low pharmacy retail and wholesale32 margins and its lack of a value-added-tax (VAT)33 for prescription medicines place it in the lower half of the European OECD member countries, at the retail level. The study by Martikianen et al. (2005) found the average retail price (excluding VAT) in Sweden was the fifth lowest of nine countries studied. When VAT is included in those countries where it is added to the pharmacy retail price, Sweden’s average retail price is lower than all but two of the nine countries. According to a recent Eurostat survey, Sweden’s retail prices for pharmaceuticals places it in the lower half of European OECD member countries (Eurostat, 2007).34
78. The fact that Sweden is able to offer high prices to manufacturers while maintaining average prices at wholesale and low prices at retail level reflects the Swedish situation in which both wholesale and retail margins are low, relative to other countries, and in which there is no VAT on prescribed pharmaceuticals (included in the retail price in many other countries). Given this, it is possible for manufacturers to benefit from relatively high ex-factory prices without payers having to bear an atypically large burden.
79. There is also some evidence suggesting that Sweden has been more successful in achieving price competition for products that have gone off-patent in comparison with countries with higher average prices. Studies by LFN (2005c, 2006d) revealed that wholesale price differentials between Sweden and several countries (Ireland, Switzerland, the United Kingdom and Germany) are more pronounced in the case of the top-selling drugs in Sweden than they are for new drugs.
80. Beyond this, there is evidence to suggest that average pharmaceutical prices have dropped since the introduction of mandatory generic substitution. According to a study by LFN (2006c), the average price of the top-selling active ingredients between October 2002 and December 2005 fell by 15%. However, this was a period during which five blockbuster drugs (Cipramil™, Plendil™, Losec/Prilosec™, Zoloft™ and Zocor™) lost patent protection. During the 10 month-period of October 2002 to July 2003 – when three blockbusters lost their patents (patent protection for Cipramil™ expired in June 2002) – the average price for pharmaceuticals decreased by 6%.35 The subsequent 2 years saw a more gradual decrease in the average price of about 5% from the price of October 2002, until the expiration of the patent for Zoloft™, which precipitated a further decrease of about 5% in the last three months of 2005. The authors of the 32 . Sweden’s average wholesale margin is one of Europe’s lowest (VFA, 2006).
33 . Sweden is the only OECD Europe country that does not levy a VAT on prescribed pharmaceuticals – Ireland and the United Kingdom have no VAT for specific categories of pharmaceuticals. Most countries have a VAT for pharmaceuticals that is lower than their standard VAT; there are four countries for which the VAT for pharmaceuticals is the same as the standard VAT (Vogler, et al., 2006).
34 . The survey of price levels for pharmaceutical products was carried out by national statistical institutes in 37 countries as part of the joint Eurostat-OECD Purchasing Power Parity Programme. Comparative price levels are calculated as the ratios of PPPs to exchange rates. Strict ranking of the countries is not advisable because minor differences in the calculation of price level indices may be unduly affected by uncertainty regarding prices and the method for calculating PPPs.
35 . The loss of patent protection had an enormous impact on the prices of these products. By December 2005, the average price of Zocor™ had fallen by 71%; that of Cirpamil™ and Zoloft™ by 66%. Although not as significant, the average prices of Losec/Prilosec™ and Plendil™ fell 41% and 35% respectively.
32
DELSA/HEA/WD/HWP(2007)5
study estimate that had these five drugs not lost their patents, the average price of pharmaceuticals would have decreased by only 4%.
Volume
81. There were about 63 million prescriptions written in Sweden in 2005, up from 57 million in 2000 (PPRI, 2007). In 2005 there were 6.9 prescriptions for each inhabitant, more than Norway (5.6 per inhabitant), but less than Finland and Slovakia (8.0), and Austria (12.6).36
82. Measured in terms of defined daily doses (DDD) per thousand inhabitants per day, pharmaceutical consumption in Sweden increased at an average annual growth rate of 2.5% between 2000 and 2005 (OECD, 2006a).37 This trend continued into 2006 which saw consumption increase by 2.7% from 2005 levels. However, growth has not been steady. In 2001, consumption increased 4.5% from the previous year, while it grew by only 1.2% between 2003 and 2004.
83. Four ATC categories largely dominate drug consumption in Sweden, accounting for 65.9% of total drug consumption: Cardiovascular system (ATC-C) 297 DDDs/1000 inhabitants/day (referred to henceforth as DDDs), alimentary tract and metabolism (ATC-A) 297.2 DDDs, blood and blood forming organs (ATC-B) 296.3 DDDs and nervous system (ATC-N) 242.9 DDDs. The growth in overall consumption was driven mainly by increased consumption of drugs for ATC-B – which grew by 5.13% – and ATC-C – which grew by 6.74%. For the latter, the increase can be largely explained by the expanded use of statins, which accounted for 11.9% of total DDDs for ATC-C in 2000 and 21.8% in 2006. Statins were responsible for over 40% of the growth in consumption of cardiovascular drugs between 2000 and 2006.
84. Swedish consumption of pharmaceuticals is somewhat high, at least when compared to the few countries for which data were available. In 2004, pharmaceutical consumption was 1 584 DDDs/1000 inhabitants/day in Sweden, compared to 1 500 in Finland, the next highest country; the other countries are Slovak Republic (1 278), Iceland (1 205), Denmark (1 160) and Germany (973).38
85. Data provided by the Swedish Association of Pharmaceutical Companies (LIF) show a breakdown of the increases in retail pharmaceutical sales (human and animal medicines) in Sweden from 1990 – 2003. According to the LIF’s figures, pharmaceutical prices decreased from the previous year in 2001, 2002 and again in 2003, a period during which yearly increases in retail sales were 6.6%, 8.0% and 3.0% respectively. According to the analyses reported by LIF, yearly increases in retail sales were caused by changes in consumption volumes and “structural changes” – prescriptions for newer, more expensive pharmaceuticals. The annual increase in the volume of pharmaceutical consumption fell from 4.0% in 2001 to 1.0% in 2003, while at the same time increases in the structural changes component rose from 2.8% in 2001 to 4.8% in 2003.
36 . Authors’ calculations based on data provided by the Pharmaceutical Pricing and Reimbursement
Information project, funded by the European Commission and the Austrian Ministry of Health, Family and Youth.
37 . Data are categorised according to Anatomic Therapeutic Chemical Classification system (ATC) codes and presented as DDDs/1000 inhabitants/day. To improve comparability, data for ATC categories D (dermatologicals), S (sensory organs) and V (various) have been excluded due to the difficulties in calculating DDDs for drugs in these categories.
38 . ATC categories D (dermatologicals), S (sensory organs) and V (various) were excluded due to a lack of comparability across countries.
33

DELSA/HEA/WD/HWP(2007)5
Financing
86. The Swedish health care system is funded primarily through taxes, providing universal coverage for most health care services. The share of public sector financing of total health care spending in Sweden is one of the highest in the OECD – 85% in 2004 (OECD Health Data, October 2006). Financing is a shared responsibility between the central government, the county councils and municipalities. In 2005, 72.4% of county councils’ revenues were generated through tax revenues; 80% of county councils’ revenues were self-generated with the remaining 20% coming from various government grants. Health care is by far the largest expenditure item of county councils’ activities; 85% of county councils’ expenditures in 2005 were for health-care related activities (SALAR, 2006).
87. Seventy percent of pharmaceutical expenditures in Sweden comes from the public sector, a lower proportion than that for overall health expenditure (OECD, 2006a). Sweden’s public sector accounted for more of total pharmaceutical expenditures than the average OECD country (61%). In fact, the proportion of pharmaceutical expenditures emanating from public funding sources was higher in Sweden then other Nordic countries, who were at or below the OECD average, although public sector expenditures on pharmaceuticals in Iceland were greater – 292 USD PPP vs. 244 USD PPP.
88. Household out-of-pocket expenditures on prescription drugs account for about 70% of total private spending on pharmaceuticals. Most of the remaining 30% is accounted for by expenditures on over-the-counter drugs (PPRI, 2007).
89. Since 1998, the county councils receive block grants from the central government to subsidise the prescription drugs purchases of resident patients. The decision to transfer budget responsibility to the county councils was done with the view to better integrate pharmaceuticals with other health care interventions (Andersson, 2006). The block grants are governed through periodic agreements between the county councils and the central government. In the latest agreement, which was signed in September 2004, the central government will provide the county councils with 62 billion SEK in funding over three years to finance out-of-hospital drug expenditures (19.8B SEK in 2005, 20.7B SEK in 2006, and 21.5B SEK in 2007). The amount is to be allocated according to need, age, sex and socioeconomic factors, rather than pharmaceutical use (Rae, 2005). Unlike previous agreements, the latest one does not include a risk-sharing provision. The latest agreement calls for discussions to be held between the two levels of government if costs come considerably over budget.
90. Most county councils have passed on budgetary responsibility for out-patient prescription pharmaceuticals to the various health centres – the main source of pharmaceutical prescriptions – that operate within their respective counties. The health centres receive budgets from the county councils to cover their prescription drugs costs. In reality, these are “soft” budget constraints since any surpluses or deficits are carried over to the following year, limiting any economic incentives for reducing pharmaceutical costs (Granlund, 2006).
91. Table 2 shows a breakdown of drug expenditures in Sweden by provider area: prescription out-of-hospital, in-hospital and over-the-counter. The retail prescription drug market accounts for the largest proportion of pharmaceutical expenditures – roughly 80%. If OTC drugs are included then retail sales of pharmaceuticals are about 90% of total expenditures on drugs, with in-hospital expenditures accounting for the remaining 10%.
34
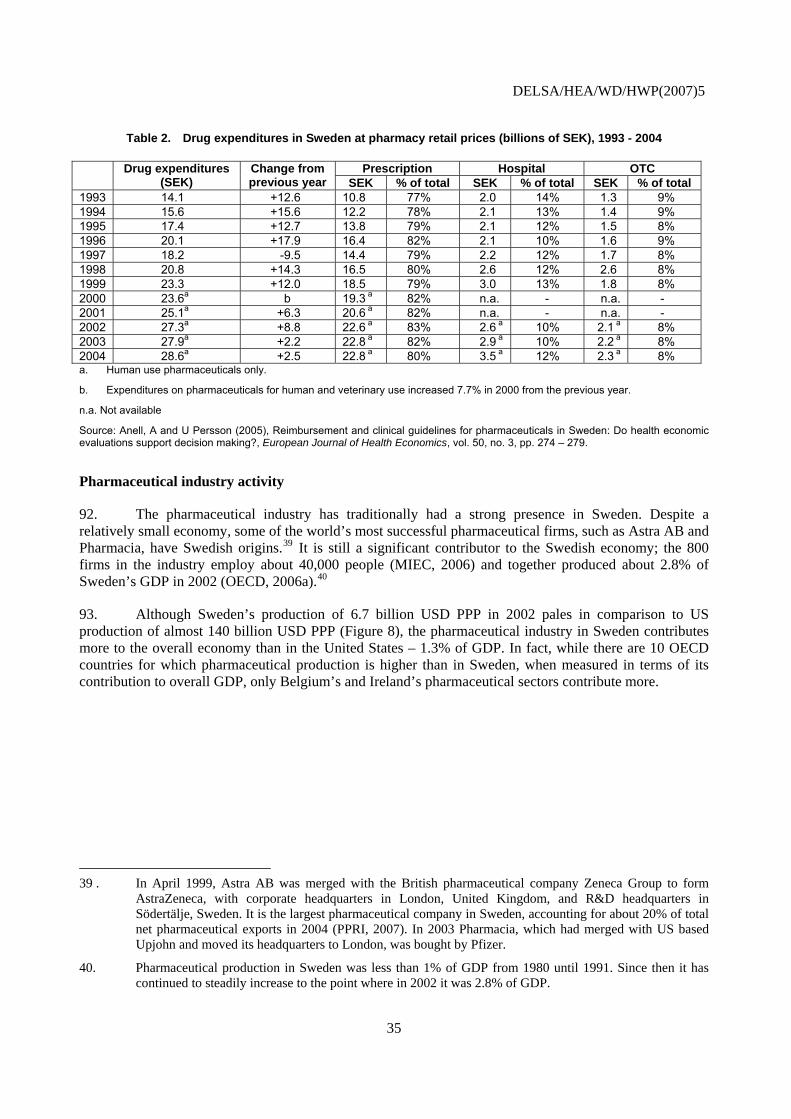
DELSA/HEA/WD/HWP(2007)5
Table 2. Drug expenditures in Sweden at pharmacy retail prices (billions of SEK), 1993 - 2004
Drug expenditures (SEK)
Change from previous year
Prescription Hospital OTCSEK % of total SEK % of total SEK % of total
1993 14.1 +12.6 10.8 77% 2.0 14% 1.3 9% 1994 15.6 +15.6 12.2 78% 2.1 13% 1.4 9% 1995 17.4 +12.7 13.8 79% 2.1 12% 1.5 8% 1996 20.1 +17.9 16.4 82% 2.1 10% 1.6 9% 1997 18.2 -9.5 14.4 79% 2.2 12% 1.7 8% 1998 20.8 +14.3 16.5 80% 2.6 12% 2.6 8% 1999 23.3 +12.0 18.5 79% 3.0 13% 1.8 8% 2000 23.6a
b 19.3 a 82% n.a. - n.a. - 2001 25.1a +6.3 20.6 a 82% n.a. - n.a. - 2002 27.3a +8.8 22.6 a 83% 2.6 a 10% 2.1 a 8% 2003 27.9a +2.2 22.8 a 82% 2.9 a 10% 2.2 a 8% 2004 28.6a +2.5 22.8 a 80% 3.5 a 12% 2.3 a 8% a. Human use pharmaceuticals only.
b. Expenditures on pharmaceuticals for human and veterinary use increased 7.7% in 2000 from the previous year.
n.a. Not available
Source: Anell, A and U Persson (2005), Reimbursement and clinical guidelines for pharmaceuticals in Sweden: Do health economic evaluations support decision making?, European Journal of Health Economics, vol. 50, no. 3, pp. 274 – 279.
Pharmaceutical industry activity
92. The pharmaceutical industry has traditionally had a strong presence in Sweden. Despite a relatively small economy, some of the world’s most successful pharmaceutical firms, such as Astra AB and Pharmacia, have Swedish origins.39 It is still a significant contributor to the Swedish economy; the 800 firms in the industry employ about 40,000 people (MIEC, 2006) and together produced about 2.8% of Sweden’s GDP in 2002 (OECD, 2006a).40
93. Although Sweden’s production of 6.7 billion USD PPP in 2002 pales in comparison to US production of almost 140 billion USD PPP (Figure 8), the pharmaceutical industry in Sweden contributes more to the overall economy than in the United States – 1.3% of GDP. In fact, while there are 10 OECD countries for which pharmaceutical production is higher than in Sweden, when measured in terms of its contribution to overall GDP, only Belgium’s and Ireland’s pharmaceutical sectors contribute more.
39 . In April 1999, Astra AB was merged with the British pharmaceutical company Zeneca Group to form
AstraZeneca, with corporate headquarters in London, United Kingdom, and R&D headquarters in Södertälje, Sweden. It is the largest pharmaceutical company in Sweden, accounting for about 20% of total net pharmaceutical exports in 2004 (PPRI, 2007). In 2003 Pharmacia, which had merged with US based Upjohn and moved its headquarters to London, was bought by Pfizer.
40. Pharmaceutical production in Sweden was less than 1% of GDP from 1980 until 1991. Since then it has continued to steadily increase to the point where in 2002 it was 2.8% of GDP.
35

DELSA/HEA/WD/HWP(2007)5
Figure 8. Pharmaceutical production in OECD countries, latest available year
138339
35289
25819 24901 22585
121128231 8188 7999 6741 5103 3537 3039 2775 2470 1516 901 727 677 109
12411
0
20000
40000
60000
80000
100000
120000
140000
United
States (
2003
)
France (
2002
)
Italy
(2002
)
German
y (20
01)
United
Kingdo
m (200
3)
Spain
(2002
)
Mexico
(200
3)
Belgium (2
001)
Canad
a (2002
)
Netherl
ands
(200
2)
Sweden
(200
2)
Irelan
d (200
1)
Denmark
(2003)
Poland
(200
1)
Hunga
ry (200
2)
Austria
(200
2)
Portug
al (200
1)
Norway
(200
2)
Finlan
d (20
01)
Greece
(200
0)
Icelan
d (2002
)
USD PPP
Source: OECD Health Data (October 2006)
94. The market share for generic drugs in 2005 was 13% of the total value of sales; 41% of total units sold (FGL, 2006). Within the generic drug sector, branded-generics account for 20% of sales of generics (FGL, 2006). According to data from a survey conducted for the European Generics Association, the volume share of Sweden’s generic drug is similar to that found in Germany and Slovakia – approximately 40%; much less than the share in Denmark (slightly greater than 60%) or Poland (approximately 85%). The generic market’s 13% share of the total value of sales in Sweden is less than either Germany (approximately 20%) or Slovakia (approximately 30%) (Perry, 2006).
R&D
95. The reported long-term trend since the 1980s has been a significant decline in the number of clinical trials of pharmaceutical products conducted in Sweden, although this has picked up again in the most recent years, perhaps partly reflecting efforts by the Swedish government to promote Sweden as a desirable location for such research.41. The pharmaceutical industry is also a significant contributor to private sector life sciences research in Sweden, employing 30 per cent of all qualified researchers employed by private sector enterprises (MIEC, 2005).
96. Pharmaceutical industry expenditures on R&D in Sweden in absolute terms are small compared to the rest of the world. In 2004, the pharmaceutical industry in Sweden spent 804 million euros on R&D –
41 400 clinical trials were performed in Sweden in 2005, which is more than the 270 clinical trials started in 2003 and
225 in 2002 (LIF, 2004).
36
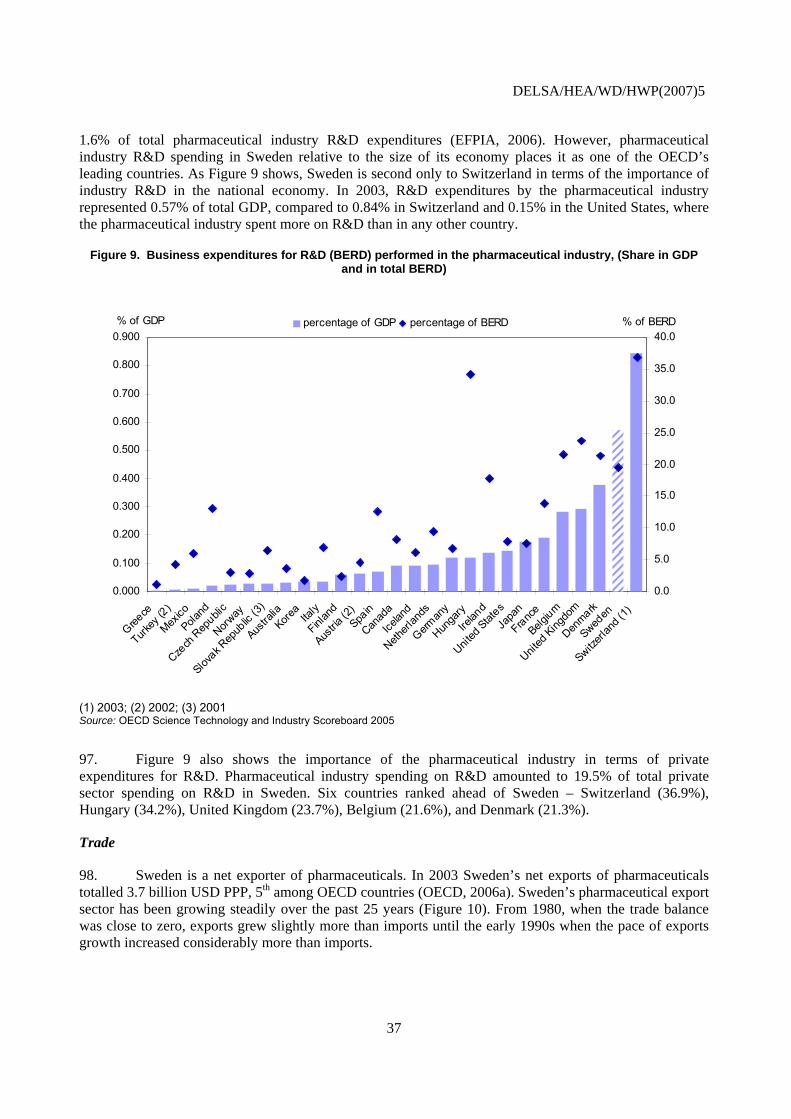
DELSA/HEA/WD/HWP(2007)5
1.6% of total pharmaceutical industry R&D expenditures (EFPIA, 2006). However, pharmaceutical industry R&D spending in Sweden relative to the size of its economy places it as one of the OECD’s leading countries. As Figure 9 shows, Sweden is second only to Switzerland in terms of the importance of industry R&D in the national economy. In 2003, R&D expenditures by the pharmaceutical industry represented 0.57% of total GDP, compared to 0.84% in Switzerland and 0.15% in the United States, where the pharmaceutical industry spent more on R&D than in any other country.
Figure 9. Business expenditures for R&D (BERD) performed in the pharmaceutical industry, (Share in GDP and in total BERD)
0.000
Greece
Turkey
(2)
Mexico
Poland
Czech
Rep
ublic
Norway
Slovak R
epub
lic (3)
Austra
liaKore
aIta
ly
Finlan
d
Austria
(2)Spa
in
Canad
a
Icelan
d
Netherl
ands
German
y
Hunga
ry
Irelan
d
United
StatesJa
pan
France
Belgium
United
Kingdo
m
Denmark
Sweden
Switzerl
and (
1)
0.0
0.100
0.200
0.300
0.400
0.500
0.600
0.700
0.800
0.900% of GDP
5.0
10.0
15.0
20.0
25.0
30.0
35.0
40.0% of BERDpercentage of GDP percentage of BERD
(1) 2003; (2) 2002; (3) 2001 Source: OECD Science Technology and Industry Scoreboard 2005
97. Figure 9 also shows the importance of the pharmaceutical industry in terms of private expenditures for R&D. Pharmaceutical industry spending on R&D amounted to 19.5% of total private sector spending on R&D in Sweden. Six countries ranked ahead of Sweden – Switzerland (36.9%), Hungary (34.2%), United Kingdom (23.7%), Belgium (21.6%), and Denmark (21.3%).
Trade
98. Sweden is a net exporter of pharmaceuticals. In 2003 Sweden’s net exports of pharmaceuticals totalled 3.7 billion USD PPP, 5th among OECD countries (OECD, 2006a). Sweden’s pharmaceutical export sector has been growing steadily over the past 25 years (Figure 10). From 1980, when the trade balance was close to zero, exports grew slightly more than imports until the early 1990s when the pace of exports growth increased considerably more than imports.
37

DELSA/HEA/WD/HWP(2007)5
99. The United States is Sweden’s largest export market, accounting for 25% of all pharmaceutical exports in 2003 (LIF, 2004); France (12.7%) and Germany (10.4%) are Sweden’s two largest European export markets. Sweden imports over 70% of pharmaceuticals from other European countries, with five countries accounting for almost 60%. Denmark is the country of origin for most of the pharmaceuticals imported into Sweden, accounting for 16.6% of all imports, followed by Germany (11.3%), Belgium (10.4%), Switzerland (10.3%) and United Kingdom (9.5%).
Figure 10. Trends in exports and imports of pharmaceuticals in Sweden, 1980 - 2003
0
1000
2000
3000
4000
5000
6000
7000
1980
1981
1982
1983
1984
1985
1986
1987
1988
1989
1990
1991
1992
1993
1994
1995
1996
1997
1998
1999
2000
2001
2002
2003
PPP million US$
imports exports
Source: OECD Health Data (October 2006)
Parallel Trade
100. Parallel trade was forbidden in Sweden prior to its entry into the European Union in 1995; however, it had to allow parallel trade in pharmaceuticals in order to comply with EU regulations. Since that time the government has recognised the potential parallel trade has in helping to reduce pharmaceutical expenditures, allowing parallel imports to be included as substitutable products under the generic substitution policy initiated in 2002. It is the Medical Products Agency that certifies parallel imports as substitutable; in 2006 the MPA approved 251 parallel imports which could be substituted by pharmacists for more expensive drugs. As of 1 January 2006 there were 1 635 approved parallel drugs in Sweden (PPRI, 2007).42
101. In the decade following the introduction of parallel imports into Sweden, it has become one of Europe’s largest markets for parallel trade. As a share of total pharmacy market sales, parallel trade in Sweden (10.2%) is the 4th largest after the United Kingdom (17.2%), Denmark (12.2%) and the 42 . Includes different pharmaceutical forms and dosages, but excludes different pack sizes.
38
DELSA/HEA/WD/HWP(2007)5
Netherlands (10.5%) (Enemark, 2007). In 2004 there were 10 parallel trading companies operating in Sweden, who source products mainly from Southern Europe. Roughly half of all re-imported products are manufactured by AstraZeneca. For some original products, the manufacturer has lost almost all domestic sales due to parallel imports (Arfwedson, 2004).
102. A study was commissioned by the European Association of Euro-Pharmaceutical Companies (EAEPC) to analyse the empirical evidence of parallel imports in four European countries, including Sweden, based on a standard methodology. The results of the study show that parallel imports resulted in net savings of 45.3 million euros in 2004, about 1.4% of total pharmaceuticals for human consumption (Enemark, 2006). Of the 45.3 million euros saved, 64% were as a result of savings from competition among the top 10 selling products; 48% by the top five sellers and 40% from the top three. In a study on the impact of parallel imports on prices, Granslandt and Maskus (2004) showed that the prices of drugs subjected to competition from parallel imports fell during the period 1994 – 1999. Competition from parallel importers caused original manufacturers to drop their prices by 12% to 19% relative to the prices of products that were not subject to competition from parallel imports.
Supply of pharmaceuticals
103. As of 1 January 2006 there were 8 504 approved drugs on the market in Sweden.43 Over 90% of approved drugs were prescription only; about 60% were reimbursed by the government; and approximately 20% were parallel-traded pharmaceuticals (PPRI, 2007).44
104. New and innovative drugs appear to be readily available in Sweden. Over a two decade span (1982 – 2002), Sweden was the country of first launch for 26 new chemical entities (out of 836), placing it 8th in the world (Lanjouw, 2005), although Sweden has not been a first-launch country in either 2005 or 2006 (IMS Health, 2006; IMS Health, 2007). Even when Sweden is not the first-launch country, products have been launched relatively quickly in Sweden: For 85 new chemical entities launched globally between 1994 and 1998, the average launch delay in Sweden was 7.8 months, the third shortest after the United States (4.2 months) and the United Kingdom (7.2 months) (Danzon, Wang and Wang, 2005).
105. Numerous factors may contribute to Sweden’s status as an early-launch site, including the relatively quick market authorisations and historically quick reimbursement decisions. Manufacturers may also favour Sweden as an early launch site because ex-manufacturer prices tend to be high. Although the market is not particularly large, Sweden serves as a reference for several countries that use external referencing to define or limit prices at market entry, meaning that early market launch in Sweden can help a manufacturer to achieve relatively higher prices elsewhere.
106. As Figure 11 demonstrates, the time lag between marketing approval and launch in Sweden compares favourably to other countries. In between 1999 and 2003, the average time to launch once a product was approved for marketing in Sweden was 4.5 months. This places Sweden in a cluster of countries – Switzerland, Australia, United Kingdom and the Netherlands – with launch lags of between four and five months. Four countries – Canada, the United States, Germany and Japan – had time lags of less than four months.
43 . As of 1 January 2007 there were 8 982 approved drugs on the market in Sweden.
44 . Includes different pharmaceutical forms and dosages, but excludes different pack sizes. Reimbursed pharmaceuticals include only those sold in 2006.
39
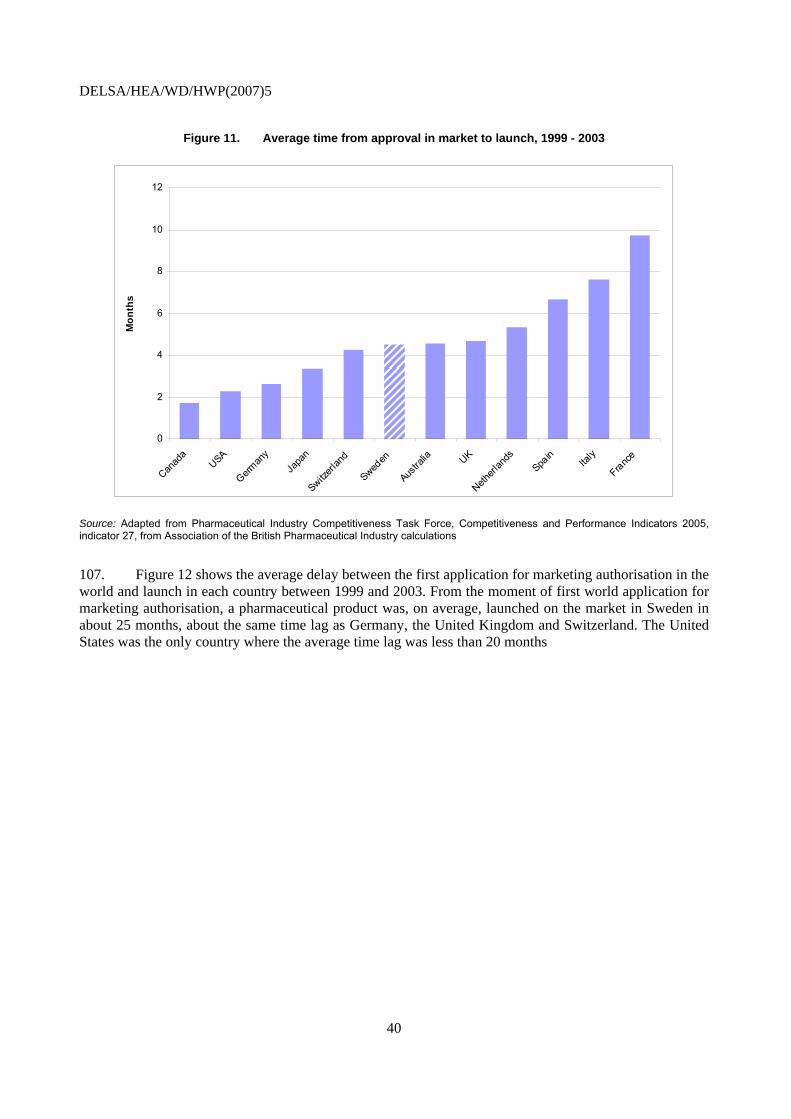
DELSA/HEA/WD/HWP(2007)5
Figure 11. Average time from approval in market to launch, 1999 - 2003
0
2
4
6
8
10
12
Canad
aUSA
German
yJa
pan
Switzerl
and
Sweden
Austra
lia UK
Netherl
ands
Spain
Italy
France
Mon
ths
Source: Adapted from Pharmaceutical Industry Competitiveness Task Force, Competitiveness and Performance Indicators 2005, indicator 27, from Association of the British Pharmaceutical Industry calculations
107. Figure 12 shows the average delay between the first application for marketing authorisation in the world and launch in each country between 1999 and 2003. From the moment of first world application for marketing authorisation, a pharmaceutical product was, on average, launched on the market in Sweden in about 25 months, about the same time lag as Germany, the United Kingdom and Switzerland. The United States was the only country where the average time lag was less than 20 months
40
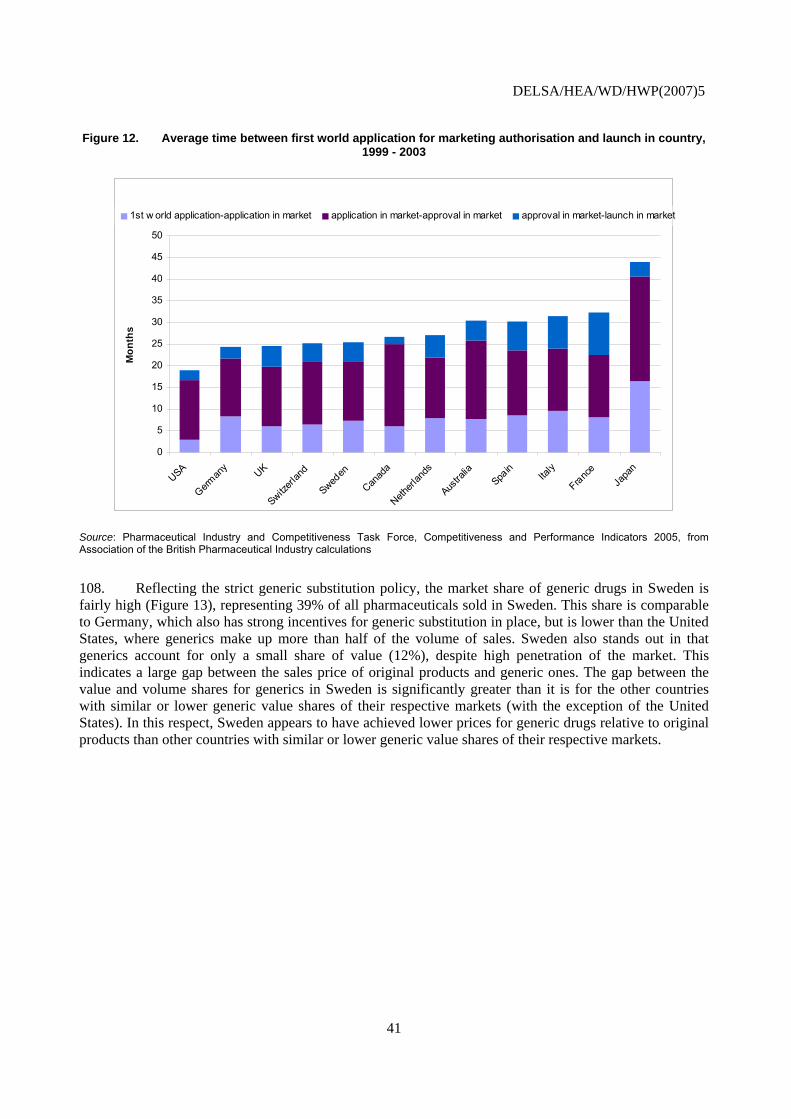
DELSA/HEA/WD/HWP(2007)5
Figure 12. Average time between first world application for marketing authorisation and launch in country, 1999 - 2003
0
5
10
15
20
25
30
35
40
45
50
USA
German
y UK
Switzerl
and
Sweden
Canad
a
Netherl
ands
Austra
liaSpa
inIta
ly
France
Japa
n
Mon
ths
1st w orld application-application in market application in market-approval in market approval in market-launch in market
Source: Pharmaceutical Industry and Competitiveness Task Force, Competitiveness and Performance Indicators 2005, from Association of the British Pharmaceutical Industry calculations
108. Reflecting the strict generic substitution policy, the market share of generic drugs in Sweden is fairly high (Figure 13), representing 39% of all pharmaceuticals sold in Sweden. This share is comparable to Germany, which also has strong incentives for generic substitution in place, but is lower than the United States, where generics make up more than half of the volume of sales. Sweden also stands out in that generics account for only a small share of value (12%), despite high penetration of the market. This indicates a large gap between the sales price of original products and generic ones. The gap between the value and volume shares for generics in Sweden is significantly greater than it is for the other countries with similar or lower generic value shares of their respective markets (with the exception of the United States). In this respect, Sweden appears to have achieved lower prices for generic drugs relative to original products than other countries with similar or lower generic value shares of their respective markets.
41
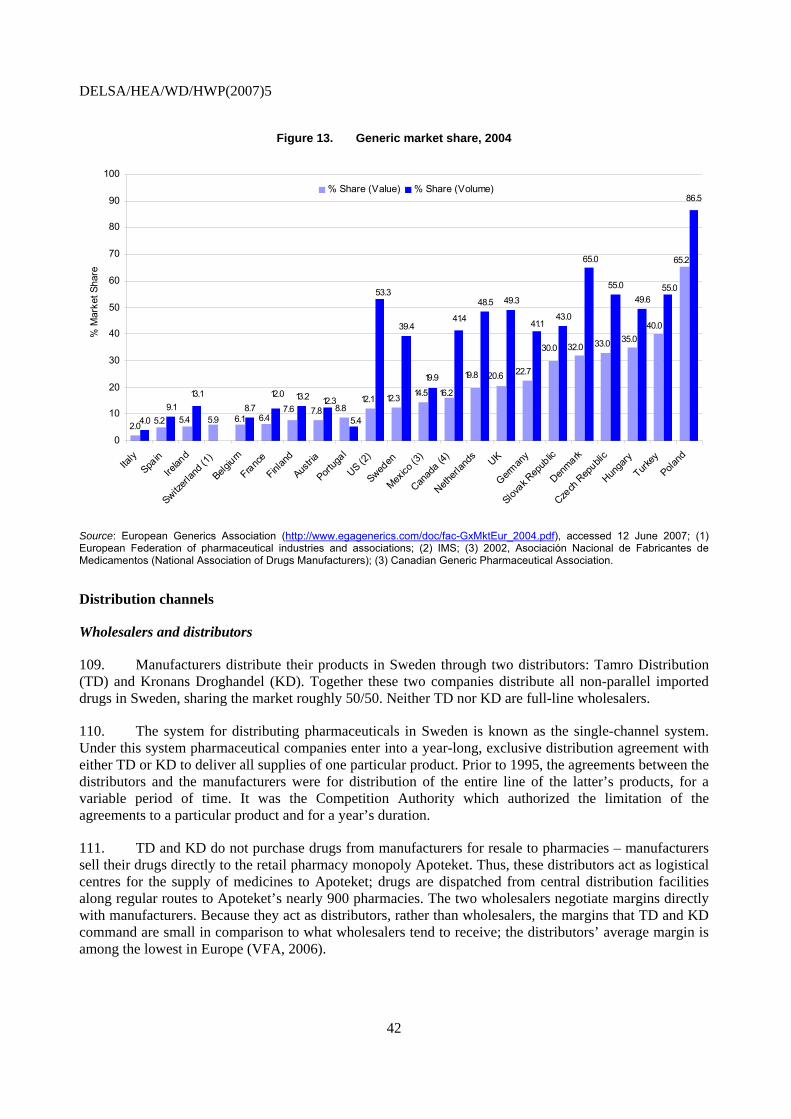
DELSA/HEA/WD/HWP(2007)5
Figure 13. Generic market share, 2004
2.04.09.1 8.7
13.2
39.4
48.5 49.3
43.0
55.049.6
6.47.6 7.8
33.0 35.0
65.
40.0
16.2
5.2 5.4 5.9 6.18.8
12.1 12.3 14.5
32.030.0
22.720.619.8
5.4
41.4
53.3
12.013.1
19.9
55.0
12.3
65.0
41.1
0
10
20
30
40
50
60
70
80
90
100
Italy
Spain
Irelan
d
Switzerl
and (
1)
Belgium
France
Finlan
d
Austria
Portug
al
US (2)
Sweden
Mexico
(3)
Canad
a (4)
Netherl
ands UK
German
y
Slovak R
epub
lic
Denmark
Czech
Rep
ublic
Hunga
ry
Turkey
Poland
2
86.5
% M
arke
t Sha
re
% Share (Value) % Share (Volume)
Source: European Generics Association (http://www.egagenerics.com/doc/fac-GxMktEur_2004.pdf), accessed 12 June 2007; (1) European Federation of pharmaceutical industries and associations; (2) IMS; (3) 2002, Asociación Nacional de Fabricantes de Medicamentos (National Association of Drugs Manufacturers); (3) Canadian Generic Pharmaceutical Association.
Distribution channels
Wholesalers and distributors
109. Manufacturers distribute their products in Sweden through two distributors: Tamro Distribution (TD) and Kronans Droghandel (KD). Together these two companies distribute all non-parallel imported drugs in Sweden, sharing the market roughly 50/50. Neither TD nor KD are full-line wholesalers.
110. The system for distributing pharmaceuticals in Sweden is known as the single-channel system. Under this system pharmaceutical companies enter into a year-long, exclusive distribution agreement with either TD or KD to deliver all supplies of one particular product. Prior to 1995, the agreements between the distributors and the manufacturers were for distribution of the entire line of the latter’s products, for a variable period of time. It was the Competition Authority which authorized the limitation of the agreements to a particular product and for a year’s duration.
111. TD and KD do not purchase drugs from manufacturers for resale to pharmacies – manufacturers sell their drugs directly to the retail pharmacy monopoly Apoteket. Thus, these distributors act as logistical centres for the supply of medicines to Apoteket; drugs are dispatched from central distribution facilities along regular routes to Apoteket’s nearly 900 pharmacies. The two wholesalers negotiate margins directly with manufacturers. Because they act as distributors, rather than wholesalers, the margins that TD and KD command are small in comparison to what wholesalers tend to receive; the distributors’ average margin is among the lowest in Europe (VFA, 2006).
42

DELSA/HEA/WD/HWP(2007)5
112. The other wholesaler operating in the Swedish market is Paranova Läkemedel AB, a distributor of parallel-import drugs.
Retail
113. Apoteket is the 100% state-owned pharmacy with a monopoly on retail pharmacy sales. Apoteket’s monopoly goes back to 1970 when the Riksdag enacted legislation giving Apoteket exclusive right to make retail pharmaceutical sales. Its objective is to provide nationwide access to pharmaceuticals at uniform prices.
114. Apoteket is obliged by law to provide all drugs approved for marketing in Sweden. If a prescribed drug is not available, or as is more likely, not available at the particular strength prescribed, then it can be manufactured by Apoteket Production and Laboratories (APL),45 a drug manufacturer set-up by the state at the same time as Apoteket and wholly owned by Apoteket. In 2005 APL’s production amounted to 1.2% (424 m SEK) of Apoteket’s net sales.
115. Retail consumers of pharmaceutical products are obliged to buy their drugs through Apoteket. Hospitals purchase drugs directly through Apoteket – which runs all hospital pharmacies (77 according to the Apoteket’s Annual Report for 2005) – but they negotiate discounts directly with manufacturers.
116. Manufacturers sell their drugs directly to Apoteket. These distributors act as logistical centres for the supply of medicines to Apoteket. Drugs are dispatched from central distribution facilities along regular routes to the nation’s pharmacies.
117. According to the business agreement, Apoteket determines the general availability of pharmacies. The decision is taken on the basis of an overall assessment of the adequacy of drug supplies and commercial considerations. Healthcare providers, municipalities and disabled persons’ organisations must be consulted on Apoteket’s location decisions.
118. Apoteket operates approximately 900 retail pharmacies,46 a relatively small number compared to other European countries, when population is taken into account. In 2006, there were 10 700 inhabitants per pharmacy in Sweden, a figure exceeded only by Denmark, which had 16 800; the median number of inhabitants per pharmacy for 25 European countries reporting data was 3 900 (Vogler, 2006).
119. Most Apoteket pharmacies are open on weekdays between 10am and 6pm; few are open on Saturdays, and those that are only open until 2pm. All pharmacies are closed on Sundays and about 10% of pharmacies are closed during the summer holiday season (Bengtsson, 2006).
120. In rural areas, Apoteket also makes use of over 800 sales agents (Apoteksombuds) – mainly operating out of grocery stores – to issue prescription and non-prescription drugs to customers. The so-called Apoteksombuds act as distributors between customers and Apoteket, taking their customers’ prescriptions to an Apoteket pharmacy to be filled and delivering these drugs to the customer directly – either at the store where the Apoteksombud is located or in person. Apoteksombuds are not allowed to provide any advice and, unlike pharmacists, do not require any formal training. They are remunerated by
45 . APL forms part of what Apoteket calls it “Contracts business unit.” These are individual customers such as
hospitals, municipalities and other companies for which Apoteket provides drugs. APL’s specially manufactured drugs include, for example, medicines whose strength has been adjusted to make them suitable for children.
46 . Apoteket also runs 29 Apoteket Shops that dispense over-the-counter medicines only and, since 2006, there is an Apoteket internet pharmacy (PPRI, 2007).
43

DELSA/HEA/WD/HWP(2007)5
the state. Apoteket determines the selling price and the selection of products supplied by the agents. In 2002, approximately 3-4% of prescribed medicines in Sweden were delivered through Apoteksombuds (Andersson, 2002). According to a study that looked at the use of Apoteksombuds, customers of Apoteksombud were more likely to be elderly, and only 5% had called the pharmacy to inquire about how their medicines should be taken (Andersson, 2002). Customers can also purchase non-prescription drugs by phone or via the internet.
121. The purchase price for Apoteket’ is ex-manufacturer price plus a non-statutory mark-up of about 2.7% for distribution costs. Apoteket’s revenues for its prescription drug operations are derived from the margin above the purchase price.
122. The retail margins for prescription drugs included in the benefit scheme are set by the Pharmaceutical Benefits Board (LFN). Either the LFN or Apoteket can initiate a process to negotiate the setting of margins. Margins are calculated using a formula that varies depending on the price of the drug. The formula includes a fixed component and a variable, percentage-based component of the drug’s price (Table 4). The margin on OTC drugs is determined by Apoteket.
123. There has been at least one change to the margin every year since 1999. For the most part these have been increases. The latest change to the margin was in November 2005 when the LFN granted Apoteket’s petition to have the margin increased by SEK 150 million on an annual basis to cover a deficit of 130 million SEK in its prescription drugs operations and a further 20 million SEK to offset lower revenues due to the generic substitution law. Apoteket’s original request was for an increase in the retail margin for drugs covered under the pharmaceutical benefits scheme of 195 million SEK.
Table 3. Price formula for retail sales of pharmaceuticals
Apoteket’s drug cost (AIP)
Margin components Retail sales price Percentage-based Fixed75 SEK or less 1.20% 31.25 SEK AIP x 1.20 + 31.25 SEK 75 – 300 SEK 1.03% 44.00 SEK AIP x 1.03 + 44.00 SEK
300 – 6,000 SEK 1.02% 47.00 SEK AIP x 1.02 + 47.00 SEK Greater than 6,000 SEK --- 167.00 SEK AIP + 167.00 SEK
Note: Apoteket’s drug cost price includes the cost of distribution.
Source: LFN - Decision letter, 17-11-2005
44

DELSA/HEA/WD/HWP(2007)5
Box 4. European Court of Justice Ruling on Apoteket's monopoly
Apoteket’s monopoly of sales of pharmaceutical products was challenged by the maker of a product to counteract nicotine addiction, who contested that the monopoly contravened European law on sales monopolies. The Stockholm District Court decided to stay its decision, referring the matter to the European Court of Justice (ECJ) for an interpretation. The ECJ ruled that Apoteket’s monopoly did indeed conflict with European law on sales monopolies because it did not preclude discrimination against trade in pharmaceuticals from other Member States.
The immediate implications of the ECJ ruling on Apoteket’s monopoly are unclear. On the one hand, the Federation of Trade, Sweden’s retail business association, has stated that the ruling “banned Sweden from pursuing the Apoteket monopoly.”3 On the other hand, the Swedish health minister at the time, Ylva Johansson, declared that “the ruling means that the monopoly can continue.”1 Indeed, subsequent to the ECJ ruling, Apoteket and the government amended their business agreement by changing Apoteket’s procurement policy in such a way as to eliminate the risk of bias in Apoteket’s purchases (Bengtsson, 2006).
The Swedish government initiated a commission of inquiry into Apoteket’s exclusive right to sell pharmaceutical products in response to the ECJ ruling. The investigation is not complete, but one of its recommendations has been to revoke Apoteket’s exclusive right to sell nicotine substitutes, such as the nicotine patch and gum. Officials interviewed for this report expect that the investigation will result in recommendations that Apoteket’s monopoly be broken in two stages. The first stage will see the opening up of retail sales of over-the-counter drugs. The second stage, which officials are less certain will come about, is the loss of Apoteket’s monopoly in the retail sales of prescription drugs. However, given the previously expressed views of the head of the new government, the probability that the second stage will occur has increased substantially.
3. “EU court rules Swedish state monopoly on medicines is illegal,” http://www.eubusiness.com/archive/Competition/050531084529.ughgb3ga (accessed 6 December 2006).
124. Other Nordic countries have deregulated pharmacies in recent years, with experience that may be relevant for Sweden’s case. In 2001, Denmark ended the prohibition of selling OTC products in pharmacies only. Deregulation in both Iceland and Norway went further, liberalising ownership restrictions where prior to the reforms, pharmacists were only allowed to own one pharmacy. In Iceland, deregulation was quickly followed by an increase in the number of pharmacies. However, this increase was mainly limited to urban areas. A similar phenomenon happened in Norway following the deregulation of its pharmacy market, although the density of pharmacies is still low by European standards. Longer pharmacy opening hours in both countries also resulted from deregulation. Norway’s reform went one step further; it allowed for vertical as well as horizontal integration. This led to a more concentrated pharmacy market a group of pharmacies created an alliance with a major wholesaler, Tamro (which also happens to be one of two pharmaceutical distributors in Sweden).
45
DELSA/HEA/WD/HWP(2007)5
ACHIEVEMENT OF POLICY GOALS
125. This section provides an assessment of the impact of the Swedish pharmaceutical reimbursement and pricing policies on a range of health-system performance goals.
Containment of pharmaceutical expenditure
126. According to several measures of pharmaceutical expenditure considered in this report (e.g. pharmaceutical spending per capita, as a share of GDP, etc.), Sweden has managed to spend slightly less than the OECD average. The limited evidence available suggests that this reflects moderately low public (or final) prices for drugs in Sweden, rather than a relatively low consumption of pharmaceutical products. No evidence is available by which to assess whether Swedes tend to use a less expensive mix of pharmaceutical products (e.g., older or less-expensive therapeutic alternatives).
127. What is noteworthy in the Swedish case is that it appears that Sweden’s mix of pharmaceutical policies have resulted in moderately low public prices (important in terms of cost containment), while furnishing relatively high prices to manufacturers. This only partly reflects the fact that Sweden is one of several OECD countries that has no value-added tax for reimbursed medicines. It also reflects the counterintuitive finding that distribution costs in Sweden are relatively low, despite lack of competition at the retail level, both for prescription and OTC drugs. As a rule, economists would expect that such a monopoly would result in higher prices for drugs than would emerge from a competitive retail market. It does not necessarily follow that deregulation would result in cost savings to retail purchasers, however. On the contrary, in a system in which reimbursement prices paid by the universal insurer are set in law, any prescription-drug price discounts achieved from manufacturers or wholesalers through competition would be expected to be captured by retailers. On the other hand, consumer savings would be possible by allowing retail competition for OTC drugs that are not reimbursed by insurance.
128. Sweden has succeeded since 2002 in slowing down the rate of growth in pharmaceutical expenditures, following a period of rapid growth in the 1990s. This decline may be partly explained by factors that are not unique to Sweden. For example, the declining frequency in launch of new so-called blockbuster drugs and the fact that a number of big-sellers have gone off-patent in recent years has been cited as a reason for declining expenditure growth in Sweden and other countries.
129. However, other plausible explanations are specific to Swedish pharmaceutical policies. A first is the introduction in 2002 of a policy requiring substitution of the lowest-price product in cases where original and generic or parallel-import versions are available on the market. The Swedish policy provides strong controls to ensure delivery of the lowest-priced substitutable product and can only be countered to the extent that physicians choose to indicate an explicit preference for an original product, something which they may face financial incentives not to do at the county council level. A second possible factor is the decentralisation of financing responsibility to county councils in 1998. While coverage and price decisions do not take into account cost or budget considerations and are made at the national level, the county councils have a great incentive to contain costs and employ tools such as mandatory prescribing guidelines and prescription profiling to influence prescribing. These incentives are passed along to the healthcare centres that furnish outpatient care for local residents, but are weaker in that prescription drug budgets are normally “soft”, with surpluses and deficits carried over to the next year. Restrictions on pharmaceutical industry marketing may also play a role in containing cost growth, to the extent that these
46

DELSA/HEA/WD/HWP(2007)5
minimise pressures on physicians to prescribe the latest product, irrespective of its demonstrated superiority to existing therapies.
Sustainability and equity of financing for pharmaceuticals
130. Sweden is fairly unusual in that the authority responsible for making decisions regarding coverage of pharmaceuticals and establishing reimbursement prices is fully separate from the authorities responsible for financing pharmaceutical expenditures. This creates some tension in the system as county councils, unable to choose the pharmaceuticals they are obliged to cover and the price they pay for them, try to control their drug expenditures by finding ways to influence the volume of drugs consumed and physicians’ prescribing patterns.
131. A progressive co-payment system – in which the state subsidy increases as the amount a consumer spends on prescription drugs increases over the course of a year – and an annual cap of about 200 euros on patient co-payments ensure that patients with chronic conditions do not risk financial hardship.
Efficiency of expenditures
132. In terms of getting the best value for the money it expends on pharmaceuticals, Sweden’s reimbursement price-setting approach has a number of notable strengths as well as some weaknesses. A clear strength is in the use of cost-effectiveness analysis (CEA) to relate the reimbursement price paid to the social value of the product. Such a policy distinguishes Sweden from other public and private payers that link prices to those paid in other countries or to prices paid for products considered comparable. The weaknesses of Sweden’s approach lie in the details of how CEA is used. The Pharmaceutical Benefits Board (LFN) does not attempt to ensure that manufacturers offer products at the lowest cost-effective price; rather, it accepts any price that it believes has been shown to be cost-effective. Accepting the price proposed by the manufacturer, so long as it is cost-effective, means losing potential savings if the drug was cost-effective at a lower price. Adding to the incentive that manufacturers face to over-bid when submitting a price proposal is the fact that Sweden allows applications and decisions to remain confidential unless the manufacturer authorises release of the information. The LFN could further strengthen the efficiency of the reimbursement price-setting approach by allowing more cost-effectiveness analyses to be based on the specific indications of a drug, thereby reducing expenditures on the uses of a drug that are not proven to be cost-effective.
133. Sweden’s system has achieved relatively low distribution costs, despite the fact that economic theory suggests a monopoly distribution scheme will be less efficient than competition. This allows Sweden to have modest public prices for pharmaceuticals (including reimbursement prices) but to satisfy the pharmaceutical industry by furnishing ex-manufacturer prices that are high in comparison with the standard in European countries.
134. Beyond this, it is particularly noteworthy that Sweden’s ex-manufacturer prices for “new” drugs are only exceeded in the EU by Germany, which allows free ex-manufacturing pricing at market entry. This suggests that Sweden is among those countries that furnishes a premium to new drugs. Sweden has introduced a retrospective reconsideration of product listing, organised by therapeutic class, which is likely to have enhanced efficiency by eliminating coverage of those products found not to be cost-effective, while retaining reimbursement for highly effective drugs – as demonstrated through health technology assessments – within therapeutic classes. Further strengthening this review process could likely result in further efficiencies. For example, a policy like that used in Switzerland, in which periodic retrospective reviews of a newly introduced drug are considered at defined intervals, in light of new evidence, might
47

DELSA/HEA/WD/HWP(2007)5
help Sweden to ensure that such premia were warranted; a system for recouping over-payments in light of evidence that the price exceeded a cost-effective level, could help to enhance efficiency further.
135. Sweden’s pharmaceutical policies can be considered as promoting efficient drug expenditures in that they provide strong administrative incentives for cost-effective dispensing of pharmaceuticals: pharmacists are required to dispense the lowest-cost product certified as substitutable. Generic products represent a relatively high and quickly growing share of the market in terms of units, and a relatively small and slow-growing share of the market in terms of value. Ironically, competition among generic drug providers runs the risk of decreasing competition if only providers able to maintain large inventories are able to remain on the market during periods when their products do not sell (when their products are not the lowest-priced). The government would do well to monitor the generic drug market lest a decrease in competitiveness undermine the efficiency of generic substitution. Nevertheless, there are evident possibilities to increase efficiency, notably by streamlining the process by which generic products and parallel imports are eligible to be certified as substitutable for originals.
136. A final aspect of Sweden’s policies to highlight in terms of prospective impact on efficiency is in the role of the county councils. The authors were unable to uncover evidence of the impact of the county councils on drug prescribing patterns, but it does appear that the incentives are in place for the councils to promote the most cost-effective prescribing behaviour in that they have responsibility for financing drug expenditures and ensuring good outcomes; they also have strong administrative levers by which to influence the physicians employed by the hospitals and health centres administered by the councils. Of course, the extent to which county councils focus on cost containment versus cost-effective delivery may vary and is viewed differently by different stakeholders.
Availability of pharmaceuticals
137. Thanks to timely marketing approval decisions, followed (in the case of prescription drugs) by prompt pricing and reimbursement decisions – and reflecting manufacturers’ strategic decisions that favour the Swedish market as a site for first or early launch – new pharmaceutical products are readily available in Sweden within a relatively short average period from first world launch. We also found no hard evidence of problems in availability of drugs in retail pharmacies, although anecdotal evidence suggests that Apoteket’s official policy of having drugs available within 24 hours is sometimes breeched.
138. There are concerns that the Medical Products Agency’s relatively fast market authorisation decisions may compromise post-approval safety. This is a legitimate concern if shorter approval times are the result of a less vigilant review process. However, the fact that the European Medicines Agency often chooses the MPA as a rapporteur is a sign of the high regard for the MPA’s scientific reputation.
139. The use of cost-effectiveness analysis for achieving efficient spending on pharmaceuticals risks decision-making that favours cost containment over availability. By including needs-based criteria alongside cost-effectiveness for determining reimbursement Sweden appears to have found a counter-balance that allows pharmaceuticals that are not cost-effective, but important for patients with serious illnesses, to be included in the positive list.
Accessibility of pharmaceuticals
140. Universal coverage for prescription pharmaceuticals guarantees each citizen adequate access to needed drugs. By all accounts the positive list appears to be comprehensive, although accessibility to some drugs may be relatively more limited if these are proven not to be cost-effective, as was the case for certain proton pump inhibitors and drugs used for treating migraines.
48
DELSA/HEA/WD/HWP(2007)5
141. Apart from patients with diabetes, there are no explicit exemptions from co-payments for patients suffering from chronic diseases, raising the possibility that low-income people suffering from other types of chronic conditions may experience financial barriers to access. However, the cap on cost-sharing limits this risk.
142. The pharmacy retail monopoly does raise accessibility concerns. The Swedish population is serviced by a relatively small number of pharmacies given its population and hours of operation are limited. Recent overtures by the new government to break-up Apoteket’s monopoly are, therefore, a step in the direction of greater convenience.47 Consumers could benefit from greater access to OTC drugs by opening up competition for the retail sales of OTC drugs, for which safety concerns are minimal. As for prescription medicines, the positive experiences of both Iceland and Norway in reforming their pharmacy sectors – where reform led to an increase in the number of pharmacies and longer opening hours – may serve as examples for Sweden to consider. While there is some concern that access to medicines for people in rural areas might be compromised, the government could step in to ensure access by, for example, subsidising the use of sales agents (Apoteketsombuds) for delivering pharmaceuticals to those with limited access to pharmacies.
Quality of care and health outcomes
143. There is limited data to assess the quality of care overall, and particularly to relate this to pharmaceutical policy. A few issues may be noted.
144. Shorter marketing approval times for pharmaceuticals have been criticised by some as making it easier for lesser quality pharmaceuticals to enter the market. Rudholm (2004) has produced evidence to show that shorter approval times by the Medical Products Agency were associated with more adverse drug reactions, albeit the effects were quite small.
145. The Apoteketombuds to deliver drugs directly to customers can potentially lead to poorer health outcomes through inappropriate use, and improper, or non-compliance of prescriptions. Andersson (2002) showed that customers of Apoteketombuds were likely to be elderly – an age group more susceptible to non-compliance – with only 5% having called the pharmacy to inquire about the proper use of their medications. The quality concern needs to be weighed against the advantages of what may amount to improved access to medicines for those with impaired mobility.
146. Influenza vaccination rates for persons aged 65 and older are an important indicator of health care quality (Mattke et al., 2006). Initial evidence from the OECD Health Care Quality Indicators project shows Sweden to be in the middle range of 20 OECD countries that were able to provide this information (Mattke et al., 2006). Excessive use of antibiotics can be viewed as an indicator of inferior health care quality. In so far as excessive use can be approximated by greater use relative to other countries, Sweden fares quite well; it is among the bottom third of 21 OECD countries for which data on the per-capita consumption of antibiotics were available (OECD, 2006a).
Satisfaction with the public monopoly
147. The general public seems to be generally satisfied with the monopoly, although it would be interesting to see if a divergence of viewpoints exists between people with chronic conditions who rely on Apoteket on a regular basis, and the rest of the population who use Apoteket’s services on a less frequent basis. The public may be more receptive to dismantling the monopoly if competition in the retail sales of
47 In a study conducted for the OECD economic survey of Sweden, Rae (2005) concluded here is no reason to believe
that such an action would compromise Apoteket’s objective of nationwide access at equal prices.
49

DELSA/HEA/WD/HWP(2007)5
pharmaceuticals would increase the number of local pharmacies and/or pharmacies’ opening hours, but not if this meant losing some of Apoteket’s services, such as counselling and a strong electronic prescribing and record-keeping system.
148. Pharmaceutical manufacturers also appear to be happy with the status quo. Perhaps this is due in part to the fact that the law states that Apoteket has to make available every drug on the market in Sweden – although we heard that this does not always occur on a timely basis – thus avoiding competition among retailers who are under no obligation to make available all drugs. The low distribution costs of the current system, which allows manufacturers to receive a significant share of each krona of pharmaceutical sold, may be another reason why they support the monopoly.
Industrial policy goals
149. The pharmaceutical industry is an important contributor to Sweden’s overall economy, much more so than in many OECD countries. The government’s policies focused on making the pharmaceutical industry one of the pillars in its objective of making Sweden one of the world’s most competitive knowledge-based economies is beyond the scope of this report.
150. There are aspects of Sweden’s pharmaceutical policy that are attractive to the industry. The pricing and reimbursement system’s flexibility in allowing high-price pharmaceuticals for high-value innovation has clear benefits for research-based pharmaceutical firms; an industry representative interviewed for this study described it as providing “headroom for innovation.” The ability of Sweden’s unique distribution system to allow for moderate public prices, while offering manufacturers relatively high prices for their products is another factor that benefits the pharmaceutical industry. However, there is no reason to believe that these aspects of the pricing and reimbursement policy influence manufacturers’ decisions regarding the location of pharmaceutical production and research, as globally operating manufacturers benefit from this market irrespective of their location decisions.
50
DELSA/HEA/WD/HWP(2007)5
KEY FINDINGS AND CONCLUSIONS
151. This paper has undertaken a comprehensive review and assessment of Sweden’s pharmaceutical pricing and reimbursement policies and the market and policy environment in which those policies operate. Key findings are the following:
Sweden’s pharmaceutical prices are notable in that the average price received by manufacturers is among the highest in Europe, whereas the average public price is lower than the European average. These outcomes have aided Sweden in containing public expenditure for pharmaceuticals while ensuring that a wide range of drugs are promptly available on the market and affordable to consumers.
Sweden has achieved moderately low public prices through a system that has a very low distribution cost relative to other countries, as well as no VAT. The distribution chain, involving a monopoly state-owned pharmacy chain, appears to achieve a high degree of efficiency. To the extent there are inefficiencies in the distribution system, they appear to be manifest in shortfalls in customer service and poorer accessibility. The latter could be addressed through competition, though this is likely to come at a financial cost given limited consumer price sensitivity for reimbursed products.
The Swedish reimbursement system’s reliance on cost-effectiveness provides a strong basis for decisions on pharmaceutical coverage and pricing of reimbursed medicines. Its limitation lies in the lack of incentives in the system for the manufacturer to propose the lowest cost-effective price, and in the lack of ability to recoup overpayments when later information shows that initial decisions on market-entry price were incorrect.
Sweden has established very strong incentives for competition by generic alternatives once a product has gone off-patent. The incentives faced by physicians, pharmacies and patients are aligned, and this has allowed Sweden to achieve high penetration of the market with a relatively low share of the value. The potential negative impact on competition of the “all or nothing” phenomenon could be limited by, for example, allowing pharmacists to substitute products that fall within a specified range of the lowest- priced product, rather than only substituting the lowest priced product.
New products are available on the Swedish market promptly. Thanks to an extensive positive list and reasonable cost-sharing requirements, pharmaceuticals are also affordable for patients. Neither hospitals nor patient associations report problems with access to new and costly medicines.
The retail monopoly for prescription drugs operates at relatively low margins, facilitating cost containment, but has shortfalls in terms of consumer convenience. Opening up the over-the-counter market to competition could improve accessibility without risk to control of public expenditures.
152. These findings regarding Swedish pricing and reimbursement policies have been drawn on the basis of an assessment of the direct impact of the policies in Sweden. However, an important consideration of ongoing work in the area of pharmaceutical pricing policy is the so-called global and cross-national impact of policies. Impacts of interest include the hypothetical effect of pricing and reimbursement policies in one country on prices and availability of medicines elsewhere, and the impact of pricing and reimbursement policies on investment in pharmaceutical R&D and the resulting impact on pharmaceutical innovation. These issues have been alluded to in this report without being directly assessed. This case
51

DELSA/HEA/WD/HWP(2007)5
study of Sweden will provide input into OECD work to assess the hypothetical global and cross-national impact of different pricing and reimbursement schemes and policies.
52
DELSA/HEA/WD/HWP(2007)5
LIST OF ACRONYMS
AB Apoteket Monopoly retail pharmacy ADR Adverse Drug Reactions APL Apoteket Production and Laboratories Apoteketombuds Sales agents ATC Anatomic Therapeutic Chemical Classification CEA Cost-effectiveness analysis CP Centralised Procedure DP Decentralised Procedure DTC Drug and Therapeutic Committees EAEPC European Association of Euro-Pharmaceutical
Companies EEA European Economic Area EFPIA European Federation of Pharmaceutical Industries and
Associations EMEA European Medicines Agency EPO European Patent Office EPC European Patent Convention FDA Food and Drug Administration FGL Swedish Generics Manufacturers Association HTA Health Technology Assessments IPR Intellectual Property Rights KD Kronans Droghandel LIF Läkemedelsindustriföreningen Swedish Association of Pharmaceutical Companies LFN Läkemedelsförmånsnämnden Pharmaceutical Benefits Board MPA Läkemedelsverket Medical Products Agency MRP Mutual Recognition Procedure NSIB National Social Insurance Board OTC Over the Counter PBS Pharmaceutical Benefits Scheme PICTF Pharmaceutical Industry Competitiveness Task Force PMPRB Patented Medicine Prices Review Board SPC Supplementary Protection Certificate SBU Statens beredning för medicinsk utvärdering Swedish Council on Technology Assessment in Health
Care TD Tamro Distribution VINNOVA Swedish Agency for Innovative Systems
53

DELSA/HEA/WD/HWP(2007)5
STUDIES OF CROSS-COUNTRY COMPARISONS OF PHARMACEUTICAL PRICES
153. The best studies by which to assess Sweden’s relative price level use Sweden as a reference for the purpose of defining drugs included in the price comparison and weighting components of the calculated price index. However, apart from a few studies conducted by the Pharmaceutical Benefits Board (LFN), no other recent studies that compare pharmaceutical prices across a number of countries and that use Sweden as the reference country were found in the course of this review. There are, however, a few comparative studies that include Sweden among a number of countries that are compared to another reference country. Price comparisons in studies in which Sweden is not the reference country are necessarily limited to bilateral comparisons between Sweden and the reference country. The studies reviewed in this annex include the LFN studies, where Sweden is the reference country, and other studies where Sweden is one of several countries whose pharmaceutical prices are compared to those of the reference country. A summary table of these studies is presented in Table 4.
Table 4. Summary of findings from selected studies comparing Swedish pharmaceutical price levels with those of other countries
Study Price comparison Methodology Findings LFN (2005c)
Wholesale prices during the first half of 2004 of the 180 most sold drugs in Sweden, compared to 17 European countries. Discounts were not taken into account. Twelve were approved by the LFN (five of the twelve were generics).
1. Differentials in price per tablet, capsule or equivalent between Sweden and the European average for each of 143 medicines (those sold in at least four countries). 2. Bilateral comparisons – between Sweden and each country – of the average price of matched medicines (range: 73 to 147). No weighting by sales volume.
The Swedish prices of about 45% of the medicines were +/- 5% of the European average. The average price in seven countries was at least 10% higher than in Sweden, when prices are adjusted using exchange rates; 13 countries when adjusted using PPPs.
LFN (2006d)
Wholesale prices of 80 new products granted reimbursement by the LFN between October 2002 and November 2005 were compared to 17 European countries. Discounts were not taken into account.
1. Differentials in price per tablet, capsule or equivalent between Sweden and the European average for each of 55 medicines (those sold in at least four countries). 2. Bilateral comparisons – between Sweden and each country – of the average price of matched medicines (range: 14 to 46). No weighting by sales volume.
The Swedish prices for 20 of the medicines were +/- 5% of the European average. The average price in five countries was at least 10% higher than in Sweden, when prices are adjusted using exchange rates; 14 countries when adjusted using PPPs.
NSIB (2001) Wholesale prices of 59 new products granted reimbursement in Sweden in 1998 and 1999 were compared to 14 European countries. Discounts were not taken into account.
1. Differentials in price per tablet, capsule or equivalent between Sweden and the European average for each of 59 medicines (those sold in at least four countries). 2. Bilateral comparisons – between Sweden and each country – of the average price of matched medicines (range: 26 to 55). No weighting by sales volume.
The Swedish prices for 32 of the medicines were +/-5% of the European average. The average price in United Kingdom and Switzerland was at 20% higher than in Sweden, while average price levels in Spain and Greece were at least 10% lower.
54

DELSA/HEA/WD/HWP(2007)5
Martikainen (2005)
Wholesale and retail (with and without VAT) prices – Dec. 2002 or Jan. 2003 – for eight pharmaceuticals granted marketing authorisation in 2000 through the EMEA’s centralised procedure and reimbursable in 9 EU countries. Dispensing fees were not included.
Questionnaire sent to pricing and reimbursement authorities. Wholesale (except the Netherlands and the United Kingdom) and retail price indexes for eight products (17 different strengths and package sizes) were calculated using Sweden as the reference country. A mean index was also calculated for each country.
Based on average wholesale prices, Sweden lies in the middle of seven countries. Based on average retail prices, only two of nine countries had lower prices than Sweden. Only one product in Sweden had a higher price (wholesale) than in the other countries. Sweden did not have any products that were the lowest priced.
EUROSTAT (2007)
Retail prices of 181 top-selling pharmaceutical products – based on detailed sales information from a large number of countries. Data collected in November 2005.
The data were collected as part of a joint OECD-EUROSTAT project on PPPs. Depending on the country, information was collected from one of 4 different sources: ministries of health, associations representing the pharmaceutical industry or pharmacists, or visits to pharmacists. About 75% of the products were original drugs with the remaining 25% generics.
Sweden is included in a group of 5 countries whose prices are near to, but lower than, the EU25 average.
IMS (2003) Manufacturers’ and retail prices of the top 100 branded reimbursed products in Switzerland (with sales in at least one comparator country) in the second quarter of 2003. Eighty-one products were available in Sweden.
For each product, the price per standard unit (tablet, capsule, etc.) in each country was indexed to the Swiss price. Indices for each country were then added up to provide an un-weighted average index price.
The average retail price in Sweden was 22% lower than in Switzerland. The average ex-manufacturer price in Sweden was 10% lower than in Switzerland.
PMPRB (2005)
2005 manufacturers’ prices in Canada and seven designated comparator countries for patented medicines available in both Canada and the comparator country.
Average ratio-to-Canadian price computed for each product, weighted by sales in Canada. Prices converted by current exchange rates.
Swedish prices were 13% lower than Canadian prices in 1987 and roughly equivalent in 1997 and 2005.
Wholesale price comparisons of the 180 top-selling products in Sweden
154. One LFN study compared wholesale prices of the 180 top-selling drugs48 (including generics) in Sweden during the first half of 2004 to prices in 17 European countries (LFN, 2005c). Only pharmaceuticals sold in at least four countries were included in the analysis. There were two limitations of the study: (1) pharmaceuticals were not weighted to take account of sales volumes; thus, each drug carried the same relative importance (i.e. was considered as having an equal share of total sales for the basket of pharmaceuticals), even though the relative importance of each drug differs within a country, and weighted averages differ across countries; (2) the wholesale prices were not adjusted to reflect discounts that may have been offered by manufacturers to purchasers of their products.
48 In the end, only 143 drugs were included in the comparison, as these 143 drugs were available in comparable form
in at least four of the countries that were used in comparison.
55
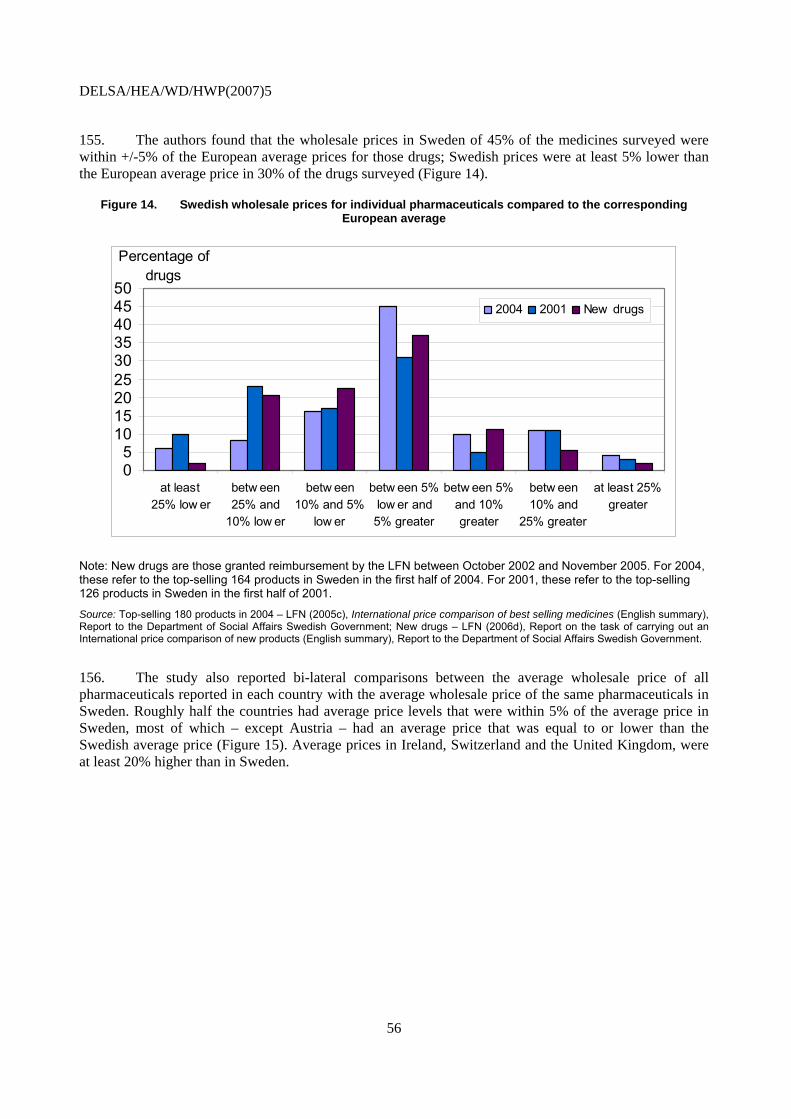
DELSA/HEA/WD/HWP(2007)5
155. The authors found that the wholesale prices in Sweden of 45% of the medicines surveyed were within +/-5% of the European average prices for those drugs; Swedish prices were at least 5% lower than the European average price in 30% of the drugs surveyed (Figure 14).
Figure 14. Swedish wholesale prices for individual pharmaceuticals compared to the corresponding European average
05
101520253035404550
at least 25% low er
betw een25% and
10% low er
betw een10% and 5%
low er
betw een 5%low er and5% greater
betw een 5%and 10%greater
betw een10% and
25% greater
at least 25%greater
2004 2001 New drugs
Percentage of drugs
Note: New drugs are those granted reimbursement by the LFN between October 2002 and November 2005. For 2004, these refer to the top-selling 164 products in Sweden in the first half of 2004. For 2001, these refer to the top-selling 126 products in Sweden in the first half of 2001.
Source: Top-selling 180 products in 2004 – LFN (2005c), International price comparison of best selling medicines (English summary), Report to the Department of Social Affairs Swedish Government; New drugs – LFN (2006d), Report on the task of carrying out an International price comparison of new products (English summary), Report to the Department of Social Affairs Swedish Government.
156. The study also reported bi-lateral comparisons between the average wholesale price of all pharmaceuticals reported in each country with the average wholesale price of the same pharmaceuticals in Sweden. Roughly half the countries had average price levels that were within 5% of the average price in Sweden, most of which – except Austria – had an average price that was equal to or lower than the Swedish average price (Figure 15). Average prices in Ireland, Switzerland and the United Kingdom, were at least 20% higher than in Sweden.
56
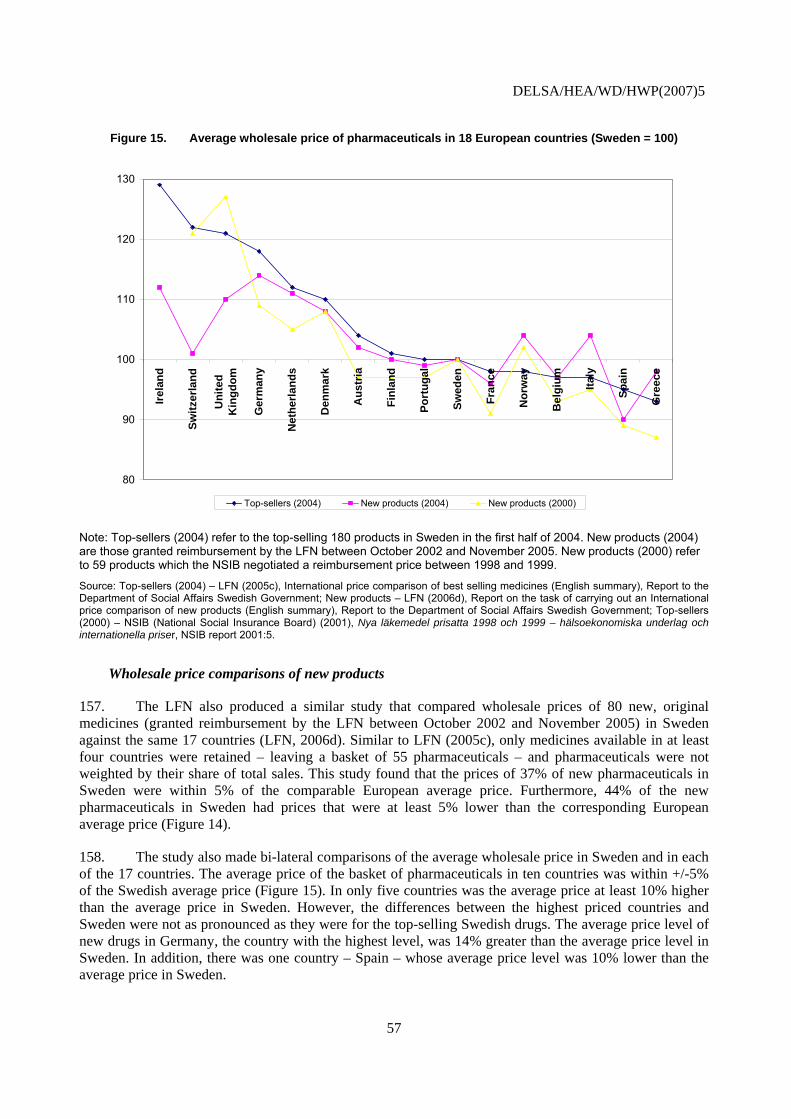
DELSA/HEA/WD/HWP(2007)5
Figure 15. Average wholesale price of pharmaceuticals in 18 European countries (Sweden = 100)
80
90
100
110
120
Irela
nd
Switz
erla
nd
Uni
ted
Kin
gdom
Ger
man
y
Net
herla
nds
Den
mar
k
Aus
tria
Finl
and
Port
ugal
Swed
en
Fran
ce
Nor
way
Bel
gium Ita
ly
Spai
n
Gre
ece
130
Top-sellers (2004) New products (2004) New products (2000)
Note: Top-sellers (2004) refer to the top-selling 180 products in Sweden in the first half of 2004. New products (2004) are those granted reimbursement by the LFN between October 2002 and November 2005. New products (2000) refer to 59 products which the NSIB negotiated a reimbursement price between 1998 and 1999.
Source: Top-sellers (2004) – LFN (2005c), International price comparison of best selling medicines (English summary), Report to the Department of Social Affairs Swedish Government; New products – LFN (2006d), Report on the task of carrying out an International price comparison of new products (English summary), Report to the Department of Social Affairs Swedish Government; Top-sellers (2000) – NSIB (National Social Insurance Board) (2001), Nya läkemedel prisatta 1998 och 1999 – hälsoekonomiska underlag och internationella priser, NSIB report 2001:5.
Wholesale price comparisons of new products
157. The LFN also produced a similar study that compared wholesale prices of 80 new, original medicines (granted reimbursement by the LFN between October 2002 and November 2005) in Sweden against the same 17 countries (LFN, 2006d). Similar to LFN (2005c), only medicines available in at least four countries were retained – leaving a basket of 55 pharmaceuticals – and pharmaceuticals were not weighted by their share of total sales. This study found that the prices of 37% of new pharmaceuticals in Sweden were within 5% of the comparable European average price. Furthermore, 44% of the new pharmaceuticals in Sweden had prices that were at least 5% lower than the corresponding European average price (Figure 14).
158. The study also made bi-lateral comparisons of the average wholesale price in Sweden and in each of the 17 countries. The average price of the basket of pharmaceuticals in ten countries was within +/-5% of the Swedish average price (Figure 15). In only five countries was the average price at least 10% higher than the average price in Sweden. However, the differences between the highest priced countries and Sweden were not as pronounced as they were for the top-selling Swedish drugs. The average price level of new drugs in Germany, the country with the highest level, was 14% greater than the average price level in Sweden. In addition, there was one country – Spain – whose average price level was 10% lower than the average price in Sweden.
57
DELSA/HEA/WD/HWP(2007)5
Purchasing power parity vs. exchange rates for pharmaceutical price comparisons
159. One of the issues the authors of these studies examined was the effect of adjusting for differences in purchasing power when converting Swedish crowns into euros, to take into account the overall (economy-wide) price level. The resulting conversions show that Swedish pharmaceutical prices at the wholesale level are relatively lower than they are when prices are compared using exchange rates. In the study on the 180 top selling drugs in Sweden, the average prices of pharmaceuticals in Denmark was the same as in Sweden; only Norway had lower prices. Similarly, the average price of pharmaceuticals approved by the LFN was lower in Sweden than in all countries except Denmark, Norway and Switzerland. Thus, pharmaceutical prices in Sweden are lower than expected, given that the prices of goods in general in Sweden are high compared to other European countries. However, converting using PPPs instead of exchange rates for a single product – pharmaceuticals – is only valid the extent to which the representative basket of goods has similar characteristics to pharmaceutical products. One obvious measure by which pharmaceuticals will differ from most goods included in the basket is that most consumers do not pay the full price of pharmaceuticals.
Price comparisons of pharmaceuticals in Sweden prior to creation of the LFN
160. Based on the results of a report on the wholesale prices of the top-selling products in 200149 – prior to the creation of the LFN – Swedish prices appear to have increased slightly in 2004 relative to other European countries. In 2001, the wholesale price of 19% of the top-selling products in Sweden were priced at least 5% higher than the corresponding average European wholesale price; the corresponding figure for 2004 was 25% (Figure 14).
161. The apparent increase in Swedish wholesale prices relative to other European countries for top-selling products is not evident in bilateral comparisons of new products. Based on the results of a report on prices in 2000 of 59 new drugs for which the government negotiated a reimbursement price in 1998 and 1999 (NSIB, 2001), the average price of these drugs in two countries – Switzerland and the United Kingdom – was at least 10% greater than the average price in Sweden (Figure 15).50 In 2004, there were four countries for which the average price of new pharmaceuticals was greater than the average price in Sweden. Moreover, the average price in Sweden of new products in 2000 was roughly equal to or higher than the average price in nine countries – compared to eight countries in 2004.
Comparisons of wholesale and retail pharmaceutical prices
162. Martikainen et al. (2005) analysed the wholesale and retail (with and without VAT) prices of eight pharmaceuticals that received marketing approval in Europe through the centralised procedure. The study compared prices in seven countries for wholesale prices and nine countries for retail prices, with Sweden as the reference country. The study found that the average wholesale price in Sweden of eight products was 19% lower than in Ireland and 9% lower than in Denmark, 20% higher than in Belgium and 18% higher than in Spain, and similar to Finland and France. The comparison of retail prices showed average prices in Sweden to be even lower when compared to the other countries than was the case for wholesale prices. The authors attributed this to Sweden, and Belgium and France which had lower retail prices, having low pharmacy margins and VAT (retail prices in the Netherlands were the lowest but information on wholesale margins were unavailable).
49 . As reported in LFN (2005c).
50 . Ireland, which had an average price higher than Sweden in the study on new products in 2004 (LFN, 2006d), was not included in the earlier study conducted by the NSIB (2001).
58

DELSA/HEA/WD/HWP(2007)5
163. A recent survey by Eurostat compared retail price levels for 181 different pharmaceutical products in 33 European countries (EUROSTAT, 2007). Retail prices in Sweden place it in a group of six countries whose prices are slightly lower than the EU25 average. Similarly, if only the European OECD countries are included, then Sweden’s retail prices are slightly below the average of these countries, similar to retail prices in Portugal, the United Kingdom and France.
Original analysis of manufacturer’s prices
164. The average manufacturers’ share of the public retail price of pharmaceuticals in Sweden is 80%, by far the largest of the countries surveyed; Portugal is the next highest country with a 68% share for manufacturers (VFA, 2006). The percentage share devolving to wholesalers ranges from 3% in Sweden, France and Finland, to 11% in Ireland. Variation in pharmacies’ share of retail prices is even greater, ranging from 15% in Norway – 16% in Denmark and 17% in Sweden – to 29% in Belgium; similar variation exists for taxes on the retail sales of drugs. These estimates do not take into account the fixed fee for pharmacists’ services which is added to the retail price of a drug in some, but not all, countries.
165. Using information on the price structure of pharmaceuticals in Europe from VFA (2006), average manufacturer’s prices can be estimated from the average wholesale prices calculated in the LFN studies (LFN, 2005c; LFN, 2006d).51 The results are displayed in Table 5.52 Whereas the average wholesale price of the top 180 best-selling products in Sweden was equal to or lower than the average prices for these products in nine of 16 countries, when adjusted to manufacturer’s prices, the average price in Sweden was lower than those in only 6 of 16 countries. The difference between the average manufacturer’s price in Sweden and that of Switzerland (16%), the country with the highest average manufacturer’s price, is less than the comparable difference for wholesale prices (22%). The average wholesale price in the highest-priced country, Ireland, is 29% greater than the price in Sweden, but the difference is only 14% at the level of manufacturer’s price. For new products, only Germany had average manufacturer’s prices that were greater than the average price in Sweden; compared to ten countries when wholesale prices are compared.
51 . Information on price structure is derived from (VFA, 2006) and is valid as of 2004. Data is provided as the
share of average retail price going to manufacturers, wholesalers, pharmacies and taxes. Data for Austria, Greece and the United Kingdom were obtained from Eurostat and are valid as of 2000. Information for Sweden, France, the Netherlands and Ireland are only for prescribed and/or reimbursed pharmaceuticals.
52 . Iceland and Luxemburg were excluded because information on the price structure in these countries was unavailable.
59

DELSA/HEA/WD/HWP(2007)5
Table 5. Difference in the average price of pharmaceuticals in 16 European countries (Sweden = 100)
Top-selling 180 products New products Wholesale price Manufacturer’s price Wholesale price Manufacturer’s priceAustria 104 94 102 92 Belgium 97 89 97 89 Denmark 110 93 108 95 Finland 101 100 100 99 France 98 97 96 95 Germany 118 114 114 110 Greece 93 89 98 93 Ireland 129 114 112 99 Italy 97 91 104 98 the Netherlands 112 100 111 100 Norway 98 94 104 100 Portugal 100 93 99 92 Spain 95 89 90 85 Switzerland 122 116 101 96 United Kingdom 121 109 110 99 Source: Authors’ analysis based on data from the following studies – LFN (2005c), International price comparison of best selling medicines (English summary), Report to the Department of Social Affairs Swedish Government; LFN (2006d), Report on the task of carrying out an International price comparison of new products (English summary), Report to the Department of Social Affairs Swedish Government; VFA (Verband Forschender Arzneimittelhersteller e.V.) (2006), The pharmaceutical industry in Germany – Statistics 2006, Berlin
Price comparison studies where Sweden is not the reference country
166. In a study comparing ex-manufacturer level prices in nine European countries, plus Canada and the USA during the second quarter of 2003 (IMS, 2003),53 prices in Sweden were found to be 10% lower than in Switzerland. The same study showed retail prices in Sweden to be 22% lower than in Switzerland. The Canadian Patented Medicine Prices Review Board (PMPRB) produces an annual report, part of which compares ex-manufacturer prices in seven countries. The price index uses Canadian consumption to weight the input prices. In the 2005 annual report (PMPRB, 2006), average ex-manufacturer prices in Sweden were shown to be 3% lower than in Canada in 2005, but 6% higher in 1997. Finally, a study by Australia’s Productivity Commission (APC) (2001) of the top 150 selling pharmaceuticals in Australia as at June 2000 showed that average ex-manufacturer prices in Sweden were considerably higher than in Australia, although the differential for the average price of new, innovative drugs was smaller.
53 . Top 100 selling pharmaceuticals in Switzerland in the second quarter 2003.
60
DELSA/HEA/WD/HWP(2007)5
REFERENCES
Andersson, A., J. Brodin and J.L.G. Nilsson (2002), “Pharmacy representatives: a non-pharmacy outlet of prescribed medicines in Sweden,” Pharmacy World and Science, vol. 24, no. 4, pp. 139 – 143.
Andersson, K. et al. (2006), “Impact of a generic substitution reform on patients’ and society’s expenditure for pharmaceuticals”, Health Policy, doi:10.1016/j.healthpol.2006.07.005.
Anell, A. and U. Persson (2005a), “Reimbursement and clinical guidelines for pharmaceuticals in Sweden”, European Journal of Health Economics, Vol. 50, pp. 274-279.
Anell A (2005b), “Deregulating the pharmacy market: the case of Iceland and Norway,” Health Policy, vol. 25, pp. 9 – 17.
Apoteket (2006), Annual Report 2005.
Arfwedson, J. (2004), Re-importation (Parallel Trade) in Pharmaceuticals, Policy Report 182, Institute for Policy Innovation, Lewisville, TX.
Ashurst (2005), “The Bolar Clause: Bringing the European generic pharmaceuticals industry into line with the US?” Ashurst, London, http://www.ashurst.com/doc.aspx?id_Content=1659 (accessed 4 April 2007).
Bengtsson, A.-C. (2006), The Swedish retail monopoly on pharmaceuticals. Is it compatible with EC-Law?, Masters Thesis, Faculty of Law, University of Lund.
Berndt, et al. (2005), “Industry funding of the FDA: Effects of PDUFA on approval times and withdrawal rates”, Nature Reviews: Drug Discovery, vol. 4, pp. 545-554.
Calboli, I. (2002), “Trademark exhaustion in the European Union: Community-wide or international? The Saga Continues,” Marquette Intellectual Property Law Review, Vol. 6, pp. 47-90.
CBO (Congressional Budget Office) (1998), How increased competition from generic drugs has affected prices and returns in the pharmaceutical industry, Washington DC.
CPC (Cambridge Pharma Consultancy) (2002), Delays to Market Access in Europe, http://www.efpia.org/Objects/2/Files/CambridgePharmaConsultancy1102.pdf - accessed 14-03-2007.
Danzon, P.M., Y.R. Wang and L. Wang (2005), “The impact of price regulation on the launch delay of new drugs – evidence from twenty-five major markets in the 1990s”, Health Economics, vol. 14, pp. 262 – 292.
EFPIA (European Federation of Pharmaceutical Industries and Associations) (2006), the Pharmaceutical Industry in Figures – 2006 Edition, Brussels.
61

DELSA/HEA/WD/HWP(2007)5
Ekelund, M. and B. Persson (2003), “Pharmaceutical Pricing in a Regulated Market”, the Review of Economics and Statistics, Vol. 85, No. 2, pp. 298-306.
EUROSTAT (2005), “The pharmaceutical industry in the European Union,” Statistics in focus – Industry, trade and services, 44/2005, EUROSTAT, Luxembourg.
EUROSTAT (2007), “Pharmaceutical products – comparative price levels in 33 European countries in 2005”, Statistics in Focus – Economy and Finance, 45/2007, Luxembourg.
FGL (Föreningen för Generiska Läkemedel) (2006), PowerPoint presentation – Swedish generic drug manufacturers association, September 2006.
Frank, R.G. and D.S. Salkever (1997), “Generic entry and the pricing of pharmaceuticals”, Journal of Economics and Management Strategy, Vol. 6, pp. 75-90.
Friedman, et al. (1999), “The Safety of Newly Approved Medicines: Do Recent Market Removals Mean There Is a Problem?” Journal of the American Medical Association, Vol. 281, No. 18, pp. 1728-1734.
Glenngård A.H., et al. (2005), Health Systems in Transition: Sweden, Copenhagen, WHO Regional Office for Europe on behalf of the European Observatory on Health Systems and Policies.
Grabowski, H. and J. Vernon (1992), “Brand loyalty entry and price competition in pharmaceuticals after the 1984 drug act”, Journal of Law and Economics, Vol. 35, pp. 331-350.
Granlund D., N. Rudholm and M. Wikström (2006), “Fixed budgets as a cost containment measure for pharmaceuticals,” European Journal of Health Economics, vol. 7, pp. 37 – 45.
Horton, L.R. and S.J. Immelt (2005), “Building a Shield: Compliance Plans” in The International Comparative Legal Guide to: Pharmaceutical Advertising 2005, (chapter 5), L.R. Horton and S.J. Immelt (authors), Hogan & Hartson LLP, Global Legal Group, London.
IMS Consulting (2003), a comparison of pharmaceutical pricing in Switzerland with selected reference countries, 18 pages.
IMS Health (2006), Intelligence.360: Global pharmaceutical perspectives 2005.
IMS Health (2007), Intelligence.360: Global pharmaceutical perspectives 2006.
Jackman and Woods (2006), “An Overview of the European Union’s New Medicines Legislation: Implications for the Pharmaceutical Industry,” International Journal of Pharmacy and Medicine, vol. 20, no. 4, pp. 251-261.
Mattke, S., E. Kelley, P. Scherer, J. Hurst, M. Gil Lapetra and the Health Care Quality Indicators Experts, (2006), “Health Care Quality Indicators Project Initial Indicators Report,” OECD Health Working Papers, no. 22, Paris.
Lanjouw, J. (2005). Patents, Price Controls and Access to New Drugs: How Policy Affects Global Market Entry, paper prepared for the Commission on Intellectual Property Rights, Innovation, and Public Health of the World Health Organization.
62

DELSA/HEA/WD/HWP(2007)5
LIF (Läkemedelsindustriförenengen) (2004), FAKTA 2004 Pharmaceutical market and healthcare, The Swedish Association of the Pharmaceutical Industry.
LFN (2003a), Pharmaceutical Benefits Board Regulation (LFNFS 2003:1)
LFN (2003b), Pharmaceutical Benefits Board Regulation (LFNFS 2003:2)
LFN (2003c), General guidelines for economic evaluations from the Pharmaceutical Benefits Board , (LFNAR 2003:2).
LFN (2005a), The review of medicines used for treating migraine – a summary, N. Hedberg and J. Ramsberg (authors), Solna, Sweden.
LFN (2005b), The review of drugs against disease caused by stomach acid – a summary, A. Wessling and D. Lundin (authors), Solna, Sweden.
LFN (2005c), International price comparison of best selling medicines (English summary), Report to the Department of Social Affairs Swedish Government.
LFN (2006a), Working guidelines for the pharmaceutical reimbursement review, LFN reference 1023/2003, Solna, Sweden.
LFN (2006b) General guidelines concerning price increases of pharmaceuticals from the Pharmaceutical Benefits Board (LFNAR 2006:1).
LFN (2006c), Sharp drop in prices after the introduction of generic substitution, Engström, A., J. Jacob and, D. Lundin (authors), Solna, Sweden.
LFN (2006d), Report on the task of carrying out an International price comparison of new products (English summary), Report to the Department of Social Affairs Swedish Government.
LFN (Pharmaceutical Benefits Board) (2007), The Swedish Pharmaceutical Reimbursement system, Solna, Sweden.
Lundkvist, J., B. Jonsson and C. Rehnberg (2006), “The costs and benefits of regulations for reimbursement of drugs”, Health Policy, No. 79, pp. 337-344.
Martikainen, J., I. Kivi and I. Linnosmaa (2005), “European prices of newly launched reimbursable pharmaceuticals – a pilot study”, Health Policy, Vol. 74, pp. 235-246.
MHRA (Medicines and Healthcare products Regulatory Agency) (2006), MHRA annual statistics 2005/06, London.
MIEC (Ministry of Industry, Employment and Communications) (2005), Pharmaceuticals, Biotechnology and Medical Technology – an Integral Part of Innovative Sweden, Stockholm.
MPA (Medical Products Agency) (2006), Swedish Medical Products Agency – a centre of excellence.
NSIB (National Social Insurance Board) (2001), Nya läkemedel prisatta 1998 och 1999 – hälsoekonomiska underlag och internationella priser, NSIB report 2001:5.
63

DELSA/HEA/WD/HWP(2007)5
OFT (Office of Fair Trading) (2007), The Pharmaceutical Price Regulation Scheme: An OFT market study, London.
OECD (2005), OECD Economic Surveys: Sweden, Volume 2005, Issue 9, OECD, Paris.
OECD (2006a), OECD Health Data, October, OECD, Paris.
OECD (2006b), International Migration Outlook – Annual Report 2006 Edition, OECD, Paris.
Olson, M.K. (2002), Journal of Law and Economics.
Paris, V. and E. Docteur (2006), Pharmaceutical prices and reimbursement policies in Canada, OECD Health Working Papers, no. 24, Paris.
Paris, V. and E. Docteur (2007), Pharmaceutical prices and reimbursement policies in Germany, OECD Health Working Papers, forthcoming, Paris.
Perry (2006), “The European generic pharmaceutical market in review: 2006 and beyond”, Journal of Generic Medicine, vol. 4, pp. 4 – 14.
PICTF (Pharmaceutical Industry Competitiveness Task Force) (2006), Competitiveness and Performance Indicators 2005.
PMPRB (Patented Medicine Prices Review Board) (2006), PMPRB Annual Report 2005, Ottawa.
PPRI (Pharmaceutical Pricing and Reimbursement Information) (2007), Sweden Pharma Profile, document submitted for the Pharmaceutical Pricing and Reimbursement Information Project, Austrian Health Institute, Vienna.
Productivity Commission (2001), International Price Differences, Research Report, AusInfo, Canberra.
Rae, D. (2005), “Getting better value for money from Sweden’s healthcare system,” OECD Economic Department Working Papers, no. 443, Paris.
Ramsberg, J., et al. (2004), “Examining the quality of health economic analyses submitted to the Pharmaceutical Benefits Board in Sweden – The first year,” European Journal of Health Economics, vol. 49, pp. 351 – 356.
Rawson, N.S.B. (2003), “Timeliness of review and approval of new drugs in Canada from 1999 through 2001: is progress being made?” Clinical Therapeutics, Vol. 25, No. 4, pp. 1230-1247.
Rawson N.S.B. and K.I. Kaitin (2003), “Canadian and US Drug Approval Times and Safety Considerations,” Annals of Pharmacotherapy, vol. 37, pp. 1403-1408.
Rudholm, N. (2004), “Approval times and the safety of new pharmaceuticals”, European Journal of Health Economics, Vol. 49, No. 4, pp. 345-350.
Sanjuan, J.R. (2006), “U.S and E.U Protection of Pharmaceutical Test Data,” CPTech Discussion Paper - No. 1, revised version 12 April.
VFA (Verband Forschender Arzneimittelhersteller e.V.) (2006), The pharmaceutical industry in Germany – Statistics 2006, Berlin.
64

DELSA/HEA/WD/HWP(2007)5
Vogler S., et al. (2006), Pharmaceutical systems in the European Union 2006. Comparative analysis, Gesundheit Österreich GmbH / Geschäftsbereich ÖBIG, Vienna.
65

DELSA/HEA/WD/HWP(2007)5
OECD HEALTH WORKING PAPERS
Papers in this series can be found on the OECD website: www.oecd.org/els/health/workingpapers
No. 27 PHARMACEUTICAL PRICING AND REIMBURSEMENT POLICIES IN SWITZERLAND (2007) Valérie Paris and Elizabeth Docteur
No. 26 TRENDS IN SEVERE DISABILITY AMONG ELDERLY PEOPLE: ASSESSING THE EVIDENCE IN 12 OECD COUNTRIES AND THE FUTURE IMPLICATIONS (2007) Gaétan Lafortune, Gaëlle Balestat and the Disability Study Expert Group Members
No. 25 PHARMACEUTICAL PRICING AND REIMBURSEMENT POLICIES IN MEXICO (2007) Pierre Moïse and Elizabeth Docteur
No. 24 PHARMACEUTICAL PRICING AND REIMBURSEMENT POLICIES IN CANADA (2006) Valérie Paris and Elizabeth Docteur
No. 23 HEALTH CARE QUALITY INDICATORS PROJECT, CONCEPTUAL FRAMEWORK PAPER (2006) Edward Kelley and Jeremy Hurst
No. 22 HEALTH CARE QUALITY INDICATORS PROJECT, INITIAL INDICATORS REPORT (2006) Soeren Mattke, Edward Kelley, Peter Scherer, Jeremy Hurst, Maria Luisa Gil Lapetra and the HCQI Expert Group Members
No. 21 THE SUPPLY OF PHYSICIANS IN OECD COUNTRIES (2006) Steven Simeons and Jeremy Hurst
No. 20 CONSUMER DIRECTION AND CHOICE IN LONG-TERM CARE FOR OLDER PERSONS, INCLUDING PAYMENTS FOR INFORMAL CARE: HOW CAN IT HELP IMPROVE CARE OUTCOMES, EMPLOYMENT AND FISCAL SUSTAINABILITY? (2005) Jens Lundsgaard
No. 19 TACKLING NURSE SHORTAGES IN OECD COUNTRIES (2004) Steven Simoens, Mike Villeneuve and Jeremy Hurst
No. 18 PRIVATE HEALTH INSURANCE IN THE NETHERLANDS. A CASE STUDY (2004) Nicole Tapay and Francesca Colombo
No. 17 SKILL-MIX AND POLICY CHANGE IN THE HEALTH WORKFORCE: NURSES IN ADVANCED ROLES (2004) James Buchan and Lynn Calman
No. 16 SHA-BASED NATIONAL HEALTH ACCOUNTS IN THIRTEEN OECD COUNTRIES: A COMPARATIVE ANALYSIS (2004) Eva Orosz and David Morgan
No. 15 PRIVATE HEALTH INSURANCE IN OECD COUNTRIES: THE BENEFITS AND COSTS FOR INDIVIDUALS AND HEALTH SYSTEMS (2004) Francesca Colombo and Nicole Tapay
No. 14 INCOME-RELATED INEQUALITY IN THE USE OF MEDICAL CARE IN 21 OECD COUNTRIES (2004) Eddy van Doorslaer, Cristina Masseria and the OECD Health Equity Research Group
No. 13 DEMENTIA CARE IN 9 OECD COUNTRIES: A COMPARATIVE ANALYSIS (2004) Pierre Moise, Michael Schwarzinger, Myung-Yong Um and the Dementia Experts’ Group
No. 12 PRIVATE HEALTH INSURANCE IN FRANCE (2004) Thomas C. Buchmueller and Agnes Couffinhal
No. 11 THE SLOVAK HEALTH INSURANCE SYSTEM AND THE POTENTIAL ROLE FOR PRIVATE HEALTH INSURANCE: POLICY CHALLENGES (2004) Francesca Colombo and Nicole Tapay
No. 10 PRIVATE HEALTH INSURANCE IN IRELAND. A CASE STUDY (2004) Francesca Colombo and Nicole Tapay
No. 9 HEALTH CARE SYSTEMS: LESSONS FROM THE REFORM EXPERIENCE (2003) Elizabeth Docteur and Howard Oxley
66
DELSA/HEA/WD/HWP(2007)5
67
No. 8 PRIVATE HEALTH INSURANCE IN AUSTRALIA. A CASE STUDY (2003) Francesca Colombo and Nicole Tapay
No. 7 EXPLAINING WAITING-TIMES VARIATIONS FOR ELECTIVE SURGERY ACROSS OECD COUNTRIES (2003) Luigi Siciliani and Jeremy Hurst
No. 6 TACKLING EXCESSIVE WAITING TIMES FOR ELECTIVE SURGERY: A COMPARISON OF POLICIES IN 12 OECD COUNTRIES (2003) Jeremy Hurst and Luigi Siciliani
No. 5 STROKE CARE IN OECD COUNTRIES: A COMPARISON OF TREATMENT, COSTS AND OUTCOMES IN 17 COUNTRIES (2003) Lynelle Moon, Pierre Moïse, Stéphane Jacobzone and the ARD-Stroke Experts Group
No. 4 SURVEY OF PHARMACOECONOMIC ASSESSMENT ACTIVITY IN ELEVEN COUNTRIES (2003) Michael Dickson, Jeremy Hurst and Stéphane Jacobzone
No. 3 OECD STUDY OF CROSS-NATIONAL DIFFERENCES IN THE TREATMENT, COSTS AND OUTCOMES OF ISCHAEMIC HEART DISEASE (2003) Pierre Moise, Stéphane Jacobzone and the ARD-IHD Experts Group
No. 2 INVESTMENT IN POPULATION HEALTH IN FIVE OECD COUNTRIES (2003) Jan Bennett No. 1 PHARMACEUTICAL USE AND EXPENDITURE FOR CARDIOVASCULAR DISEASE AND
STROKE: A STUDY OF 12 OECD COUNTRIES (2003) Michael Dickson and Stéphane Jacobzone
RECENT RELATED OECD PUBLICATIONS:
OECD HEALTH DATA 2007 (2007), available online and on CD-ROM, in English, French, German, Italian, Japanese (online version only), Spanish and Russian (online version only). OECD REVIEWS OF HEALTH SYSTEMS – SWITZERLAND (2006) OECD REVIEWS OF HEALTH SYSTEMS – FINLAND (2005) HEALTH AT A GLANCE – OECD INDICATORS 2005 (2005), published biennially LONG-TERM CARE FOR OLDER PEOPLE (2005), OECD Health Project series HEALTH TECHNOLOGIES AND DECISION MAKING (2005), OECD Health Project series OECD REVIEWS OF HEALTH SYSTEMS – MEXICO (2005) TOWARDS HIGH-PERFORMING HEALTH SYSTEMS (2004), OECD Health Project series TOWARDS HIGH-PERFORMING HEALTH SYSTEMS: POLICY STUDIES (2004), OECD Health Project series PRIVATE HEALTH INSURANCE IN OECD COUNTRIES (2004), OECD Health Project series A DISEASE-BASED COMPARISON OF HEALTH SYSTEMS: What is Best and at What Cost? (2003) OECD REVIEWS OF HEALTH CARE SYSTEMS – KOREA (2003) POVERTY AND HEALTH (2003) For a full list, consult the OECD On-Line Bookstore at www.oecd.org, or write for a free written catalogue
to the following address:
OECD Publications Service 2, rue André-Pascal, 75775 PARIS CEDEX 16
or to the OECD Distributor in your country


