Accepted Manuscript Title: Pharmacogenetic Aspects of Tramadol Pharmacokinetics and Pharmacodynamics After a Single Oral Dose Author: Salumeh Bastami Pernilla Haage Robert Kronstrand Fredrik C. Kugelberg Anna-Lena Zackrisson Srinivas Uppugunduri PII: S0379-0738(14)00096-6 DOI: http://dx.doi.org/doi:10.1016/j.forsciint.2014.03.003 Reference: FSI 7534 To appear in: FSI Received date: 31-10-2013 Revised date: 20-2-2014 Accepted date: 2-3-2014 Please cite this article as: S. Bastami, P. Haage, R. Kronstrand, F.C. Kugelberg, A.-L. Zackrisson, S. Uppugunduri, Pharmacogenetic Aspects of Tramadol Pharmacokinetics and Pharmacodynamics After a Single Oral Dose, Forensic Science International (2014), http://dx.doi.org/10.1016/j.forsciint.2014.03.003 This is a PDF file of an unedited manuscript that has been accepted for publication. As a service to our customers we are providing this early version of the manuscript. The manuscript will undergo copyediting, typesetting, and review of the resulting proof before it is published in its final form. Please note that during the production process errors may be discovered which could affect the content, and all legal disclaimers that apply to the journal pertain.
Transcript
Accepted Manuscript
Title: Pharmacogenetic Aspects of TramadolPharmacokinetics and Pharmacodynamics After a Single OralDose
Author: Salumeh Bastami Pernilla Haage Robert KronstrandFredrik C. Kugelberg Anna-Lena Zackrisson SrinivasUppugunduri
Received date: 31-10-2013Revised date: 20-2-2014Accepted date: 2-3-2014
Please cite this article as: S. Bastami, P. Haage, R. Kronstrand, F.C. Kugelberg, A.-L.Zackrisson, S. Uppugunduri, Pharmacogenetic Aspects of Tramadol Pharmacokineticsand Pharmacodynamics After a Single Oral Dose, Forensic Science International(2014), http://dx.doi.org/10.1016/j.forsciint.2014.03.003
This is a PDF file of an unedited manuscript that has been accepted for publication.As a service to our customers we are providing this early version of the manuscript.The manuscript will undergo copyediting, typesetting, and review of the resulting proofbefore it is published in its final form. Please note that during the production processerrors may be discovered which could affect the content, and all legal disclaimers thatapply to the journal pertain.
Pharmacogenetic Aspects of Tramadol Pharmacokinetics and Pharmacodynamics After a
Single Oral Dose
Salumeh Bastami*1, Pernilla Haage*1,2, Robert Kronstrand1,2, Fredrik C. Kugelberg1,2, Anna-Lena Zackrisson2, Srinivas Uppugunduri3
* Both authors contributed equally to this work
Affiliations
1 Department of Medical and Health Sciences, Division of Drug Research, Linköping University, Linköping, Sweden
2 National Board of Forensic Medicine, Department of Forensic Genetics and Forensic Toxicology, Linköping, Sweden
3 Department of Clinical and Experimental Medicine, Linköping University, Department of Clinical Chemistry, County Council of Östergötland, Linköping, Sweden.
Corresponding author
Anna-Lena Zackrisson
National Board of Forensic Medicine Department of Forensic Genetics and Forensic Toxicology
EDTA, 0.1% Tween 20, pH 7.6) and 28 µl water was added. The samples were shaken on a thermomixer
(Eppendorf, Hamburg, Germany) at 1400 rpm for 5 min. Biotinylated single-stranded DNA (ssDNA) was prepared
on a Vacuum Prep Workstation according to the manufacturer’s instructions (Qiagen, Hilden, Germany). The
ssDNA was hybridised to 15 pmol sequencing primer in 12 µl 1x annealing buffer (200 mM Tris-acetate and 50
mM MgAc2, pH 7.6) at 80 ºC for 2 min using a block thermostat (Grant Instrument, Cambridge, UK). A SNP
Reagent containing substrate, enzyme and dNTP mixtures (Qiagen, Hilden, Germany) were added to a reagent
cartridge, and the pyrosequencing reaction was carried out according to the dispensation orders shown in
Supplement 1.
2.4 Data analysis
The area under the concentration-time curve (AUC0-10) was calculated using the linear trapezoidal method. For
AUC0-∞ the area was extrapolated to infinity using the logarithmic trapezoidal method. Since the extrapolated area
exceeded 20% of the total AUC0-∞ we opted to always use AUC0-10 for subsequent group comparisons. AUC
therefore refers to the AUC0-10 values throughout this article. Peak blood concentrations (Cmax) and corresponding
times (tmax) of TRA and ODT were read directly from the data. Metabolic ratios of ODT/TRA are in the present
study abbreviated MR according to the following: MR = CODT/CTRA, AUC MR = AUCODT/AUCTRA, Cmax MR =
Cmax ODT/Cmax TRA.
Statistical analysis was performed by using the SPSS statistical program (Version 19.0 for Windows; IBM SPSS).
Non-parametric analysis method was used to compare the pharmacokinetics parameters in subjects taking 50 and
100 mg TRA. Mann-Whitney test was also used to compare allelic variation in genes between groups. The
Page 9 of 23
Accep
ted
Man
uscr
ipt
hypothetical effect of allelic variation on AUC MR and Cmax MR was estimated by regression analysis.
Significance level was set at P<0.05.
3. Results and Discussion
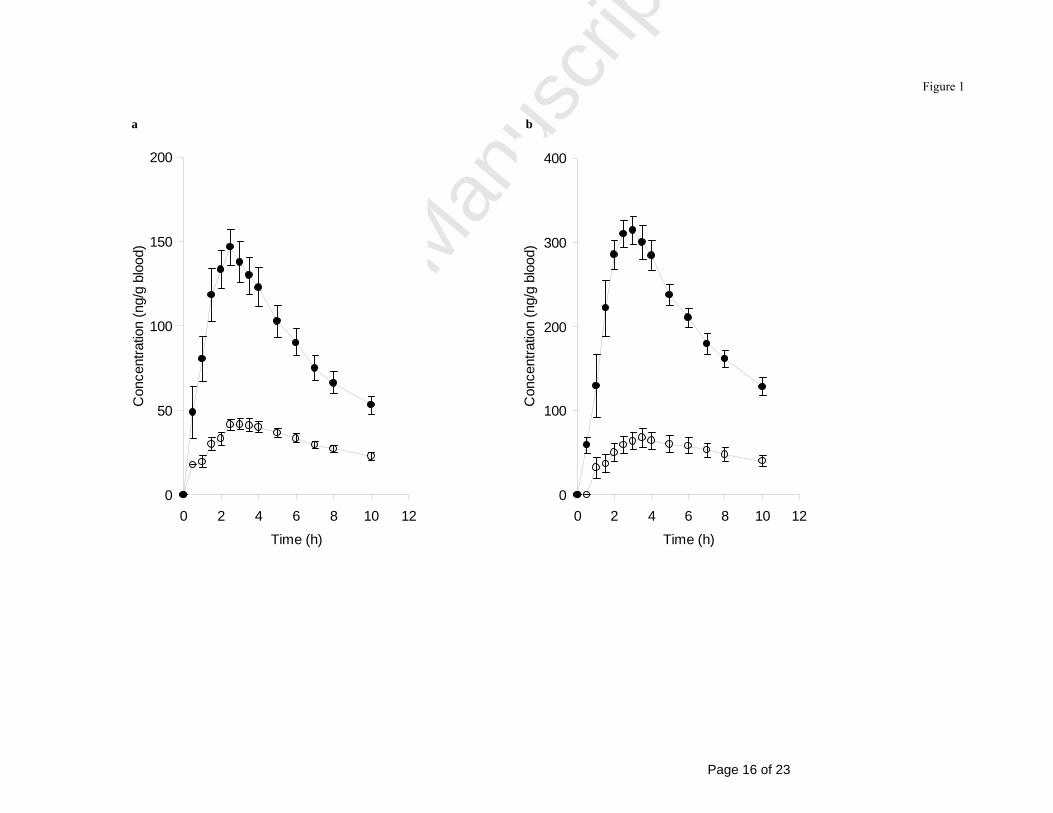
The pharmacokinetic parameters, i.e. mean values of Cmax, tmax and AUC0-∞, observed for TRA and ODT (Table 1)
in this study were in agreement with earlier published data [23]. Concentration-time profiles of TRA and ODT in
whole blood are shown for both dosage groups in Fig. 1. As expected, Cmax and AUC0-10 for TRA was almost two
times higher in the subjects given 100 mg compared to those given 50 mg (P<0.001; Fig. 1 and Table 1). A similar
trend was observed for ODT but the differences were not statistically significant, possibly due to the high
interindividual variation between the subjects in each group. Similar median values were obtained for tmax for both
TRA and ODT in respective dosage group (Table 1).
3.1 Estimation of the time of drug intake using the metabolic ratio of O-desmethyltramadol to tramadol
The subjects were grouped on the basis of the CYP2D6 genotyping analysis as follows: eight subjects were
classified as EMs, nine subjects as IMs and two subjects as PMs, lacking all CYP2D6 activity. A significant
association was found for the AUC MR and CYP2D6 genotype, (P< 0.01). The EMs and IMs showed a mean
AUC MR of 0.41±0.1 and 0.24±0.1, respectively, while the only PM individual with detectable levels of ODT
showed a ratio of 0.09. A similar level of significance (P=0.005) was observed for Cmax MR, with the highest mean
value for EMs (0.33±0.1) followed by IMs (0.20 ± 0.1) and the PM individual (0.07). Our results are in accordance
with those of Levo et al [24], who demonstrated that the ratio of TRA to ODT, in a forensic autopsy material, is
well correlated to the different genotypes of CYP2D6, the more functional alleles the lower ratio. To our
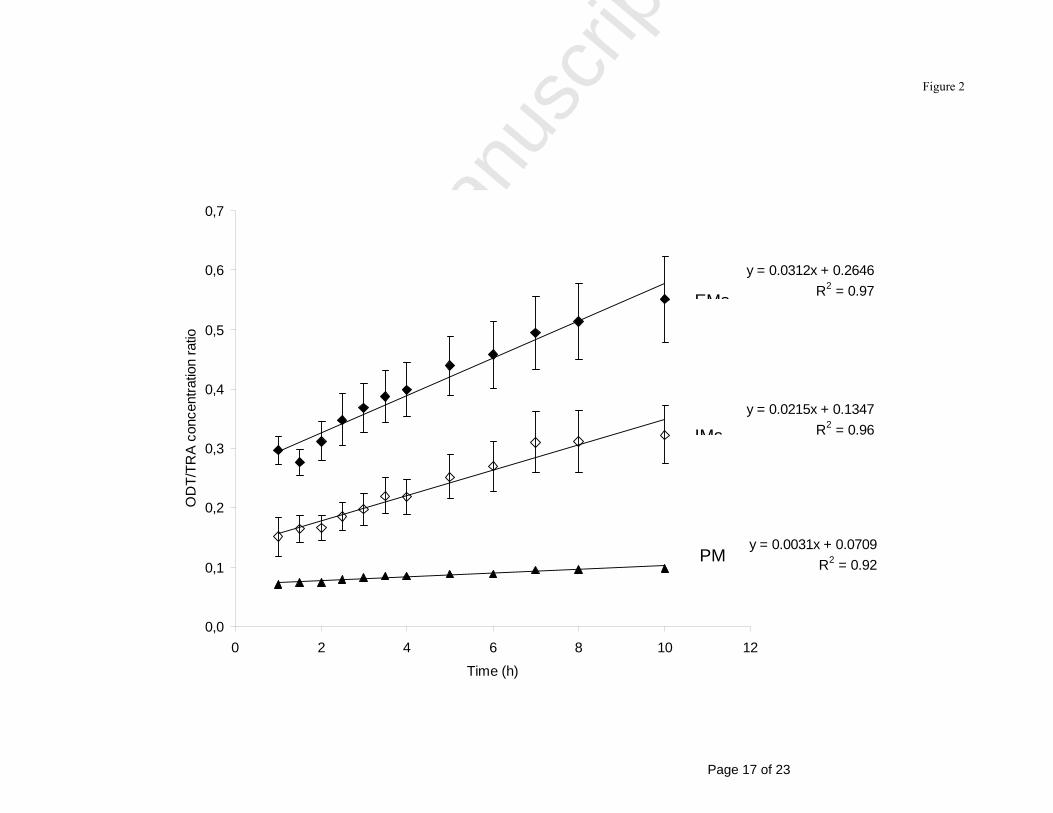
knowledge, MR in relation to time after TRA intake has not been documented earlier. We found a positive
correlation between the mean MRs and the time after drug intake for both IMs (R2 = 0.96) and EMs (R2 = 0.97).
For the only PM individual with detectable ODT levels the MR was almost constant during the 10 studied hours
(Fig. 2). The linear increase in ratio for both EMs and IMs may be used to estimate the time of intake when the
genotype is known. For example, a ratio of 0.3 may represent an intake about 1 hour prior to sampling in an EM
whereas it may represent a time of intake 10 hours earlier in an IM. In the present study, the PM always showed a
low ratio indicating a recent intake. In these interpretations it is however important to consider interindividual
variation within the genotype groups, as well as concomitant medication. Drugs capable of inhibiting the CYP2D6
enzyme [25] will change the MR but not the genotype. On the basis of our data it is possible to conclude that an
estimation of the time of drug intake is not valid without genotyping.
Page 10 of 23
Accep
ted
Man
uscr
ipt
No significant associations were found between CYP2D6 genotype and the pharmacokinetic parameters Cmax, tmax
or AUC, neither for TRA or ODT (Table 2a and b).
3.2 A putative association between ABCB1 polymorphisms and tramadol pharmacokinetics
In the 50 mg dosage group (Table 2a), there were significant associations between AUC and the three ABCB1
SNPs C1236T, G2677T/A and C3435T (P≤0.05), with the highest AUC value for homozygous of the variant
allele. The correlation held true for the AUC of TRA but not for ODT. There were no statistically significant
associations between the same SNPs and Cmax for TRA or ODT. All individuals in the 50 mg dosage group were
homozygous for the wild-type allele of the SNP G1199A.
In the 100 mg dosage group (Table 2b), there were no significant associations between the four SNPs G1199A,
C1236T, G2677T/A and C3435T in the ABCB1 gene and the pharmacokinetic parameters Cmax and AUC, neither
for TRA nor ODT. Only one subject was heterozygous for the SNP G1199A.
Although not statistically significant, Slanar et al [13] showed that both the average Cmax and AUC0-24 of TRA
alone increased with the number of 3435T alleles in healthy volunteers. The same trend was however not shown
for G2677T/A. These contradictions and also the fact that associations in our study were found only in the 50 mg
dosage group and not in the 100 mg dosage group suggests that further studies are needed to elucidate the potential
importance of ABCB1 for the pharmacokinetics of TRA.
3.3 Self reported score of drug related symptoms unrelated to polymorphisms in CYP2D6, OPRM1 or
ABCB1
Subjects given 100 mg TRA reported higher scores in the DRS form compared to subjects given 50 mg, a mean
score of 7.3±8.7 and 3.1±2.6, respectively (Table 3). Fatigue was the most common symptom in both groups while
nausea and dizziness occurred more frequently and severely in the 100 mg dosage group. Great interindividual
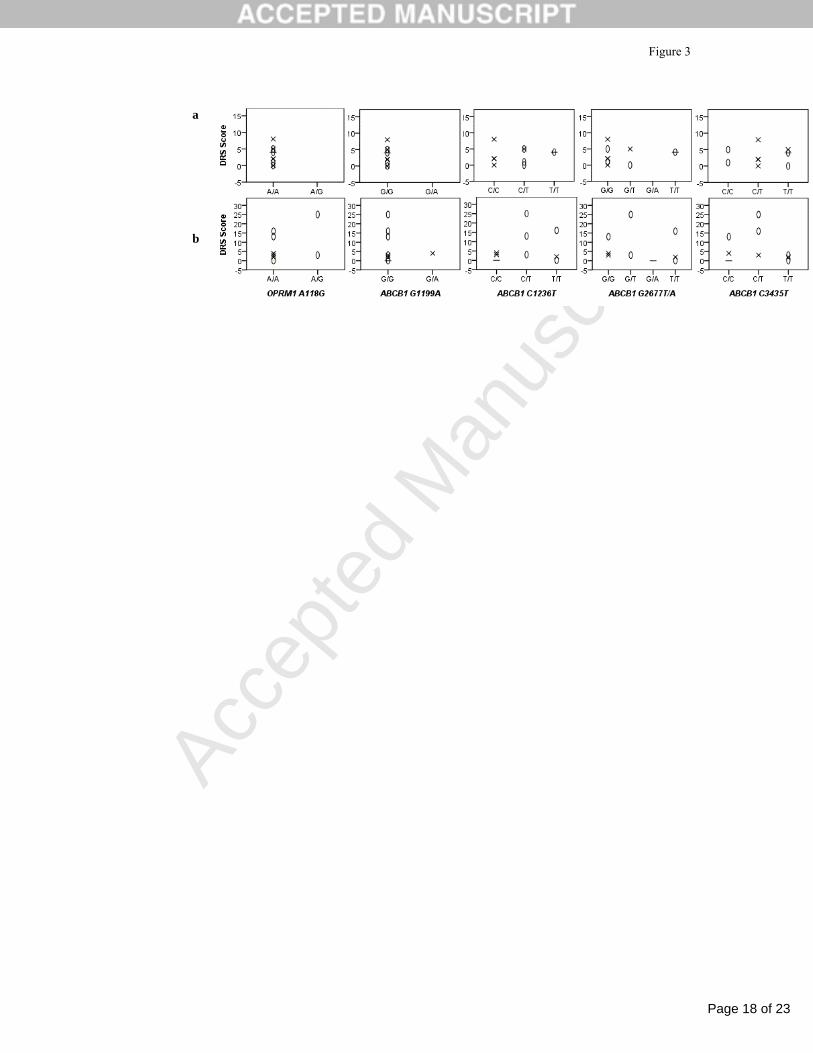
variation was found in DRS score, especially in the group administered 100 mg. The correlations between
polymorphisms in CYP2D6, ABCB1 and OPRM1 and DRS score are shown in Fig. 3a and b. CYP2D6 UMs have
been associated with a higher risk for adverse effects when administered TRA [8] and CYP2D6 IMs have been
reported to have a lower risk compared to EM individuals [26]. One could therefore hypothesize that the more
functional CYP2D6 alleles, the higher risk for DRS. As a corollary, one could also hypothesize that PMs would
have less DRS compared to EMs. This could not be shown in the present study (Fig 3). There were two subjects
who were CYP2D6 PMs in our study, one in each dosage group. The one with non-detectable levels of ODT,
Page 11 of 23
Accep
ted
Man
uscr
ipt
being in the 50 mg dosage group, reported a score of four while the other one reported a score of zero. The
subjects with the highest DRS scores (13, 16, 25) were all in the 100 mg dosage group and having the IM
genotype. Not much is known about the potential association between the genes OPRM1 and ABCB1 and DRS
following TRA intake. Kim et al [26] found that homozygous for OPRM1 118G had considerably lower risk of
side effects like nausea and vomiting, following treatment with paracetamol and TRA, than wild-types. There were
no subjects with the GG variant in our study, and only two with the AG variant, both in the 100 mg dosage group.
There were major interindividual differences between these two heterozygous subjects with one reporting a score
of three (subject 13) and the other a score of 25 (subject 16). Subject 16 become unconscious for about 15 seconds
at 1 h and 15 minutes after drug intake, and vomited around 4 h after TRA intake and also later in the evening. The
subject had already passed the tmax for both TRA and ODT (2 h and 30 minutes) by the time of vomiting and was
therefore not excluded from the study. Subject 13, on the other hand, was generally in good condition throughout
the study. Another interesting contradiction between these individuals is the fact that in spite of being administered
the same dose and both being CYP2D6 IMs, subject 13 had an AUCODT value about three times higher than
subject 16, 656 ng h/g compared to 214 ng h/g. Both individuals had the same genotypes for the other genes
studied, with the exception of ABCB1 C3435T. Subject 16 was heterozygous for this SNP while subject 13 had
allele variant TT. The CYP2D6 PM alleles included in our routine genotype analysis are by far the most common
in a Caucasian population, covering 93-97% of the poor metabolisers [27], [28]. It is however possible that the
CYP2D6*1 allele of subject 16 is not a wild-type allele but instead a rare PM allele and that could possibly explain
the much lower AUCODT value for this individual. Demographics is also a possible contributing factor to the
variation in concentration of ODT, but in this particular case we do not find it very likely. Both subjects were
females, 22 and 24 years of age. Their heights were 162 and 164 cm and their weights 60 kg and 55 kg,
respectively. No association was found between DRS score and the ABCB1 SNPs G1199A, C1236T, G2677T/A
and C3435T (Fig 3). It is however difficult to draw general conclusions regarding the relationship between
investigated SNPs and DRS of TRA in this study. Ideally, a larger study population should have been used, one
also representing all SNPs variants. Further, the self reported questionnaire used an arbitrary scale, which is an
additional limitation. We find it reasonable to conclude that a single therapeutic dose of TRA can certainly affect a
subject´s well-being and that genetics could be an underlying cause. It could be speculated that other factors, not
included in this study, could contribute to the variability in DRS. As the (+)-enantiomer of ODT exerts most of the
opioid effects [4] it could be postulated that the ratios between (+)- and (-)-ODT could potentially explain some of
the observed differences between subject 13 and 16. TRA is also metabolized to NDT, which though lacking any
Page 12 of 23
Accep
ted
Man
uscr
ipt
opioid effects [4] could possibly also shed some light over the differences in AUCODT. As mentioned earlier TRA
exerts its effects also through the serotonin and norepinephrine system and it has been speculated that the
neurotoxicity of TRA in cases of abuse and/or overdose is related to those systems rather than the opioid effects
[29]. These factors will be taken into consideration for future studies.
3.4 Sensitivity of the quantitative method for detection of tramadol and O-desmethyltramadol
TRA could be detected up to 24 h in seven of nine subjects given 100 mg TRA and in three of ten subjects given
50 mg. ODT was detectable in five of nine subjects 24 h after intake of 100 mg. In all subjects both TRA and ODT
could be detected up to 10 h after drug intake, however with one exception since one individual never presented
with a positive ODT sample. A higher sensitivity of the quantitative method, yielding a longer detection time,
would have made the estimation of the time of drug intake possible also beyond 10 h. This is however dependent
on a linear association between the MR and the time of drug intake. Many forensic cases involving TRA where the
estimation of time of drug intake is absolutely critical concern cases of suspicion of driving under the influence of
the drug, especially when the suspect claims an intake a certain time period before the driving. A longer detection
time would obviously also be beneficial in forensic cases where there is a delay between perpetration of crime and
specimen collection contributing to potentially false negative values.
4. Conclusions
Estimation of the time of drug intake using the MR of ODT/TRA is not valid without CYP2D6 genotyping. A
putative association was found between ABCB1 polymorphisms (C1236T, G2677T/A, C3435T) and TRA
pharmacokinetics. There were large interindividual variations in the self reported score of DRS, which seemed to
be unrelated to polymorphisms in CYP2D6, OPRM1 and ABCB1.
Conflict of interest
The authors declare that they have no conflict of interest.
Page 13 of 23
Accep
ted
Man
uscr
ipt
Figure 1
References [1] M. Tjaderborn, A.K. Jonsson, J. Ahlner, S. Hagg, Tramadol dependence: a survey of spontaneously reported cases in Sweden, Pharmacoepidemiol Drug Saf. 18 (2009) 1192-8. [2] S. Shadnia, K. Soltaninejad, K. Heydari, G. Sasanian, M. Abdollahi, Tramadol intoxication: a review of 114 cases, Hum Exp Toxicol. 27 (2008) 201-5. [3] K. De Decker, J. Cordonnier, W. Jacobs, V. Coucke, P. Schepens, P.G. Jorens, Fatal intoxication due to tramadol alone: case report and review of the literature, Forensic Sci Int. 175 (2008) 79-82. [4] C. Gillen, M. Haurand, D.J. Kobelt, S. Wnendt, Affinity, potency and efficacy of tramadol and its metabolites at the cloned human mu-opioid receptor, Naunyn Schmiedebergs Arch Pharmacol. 362 (2000) 116-21. [5] M.A. Huestis, A. Barnes, M.L. Smith, Estimating the time of last cannabis use from plasma delta9-tetrahydrocannabinol and 11-nor-9-carboxy-delta9-tetrahydrocannabinol concentrations, Clin Chem. 51 (2005) 2289-95. [6] R. Kronstrand, I. Nystrom, M. Andersson, L. Gunnarsson, S. Hagg, M. Josefsson, et al., Urinary detection times and metabolite/parent compound ratios after a single dose of buprenorphine, J Anal Toxicol. 32 (2008) 586-93. [7] U.M. Stamer, K. Lehnen, F. Hothker, B. Bayerer, S. Wolf, A. Hoeft, et al., Impact of CYP2D6 genotype on postoperative tramadol analgesia, Pain. 105 (2003) 231-8. [8] J. Kirchheiner, J.T. Keulen, S. Bauer, I. Roots, J. Brockmoller, Effects of the CYP2D6 gene duplication on the pharmacokinetics and pharmacodynamics of tramadol, J Clin Psychopharmacol. 28 (2008) 78-83. [9] K. Linnet, T.B. Ejsing, A review on the impact of P-glycoprotein on the penetration of drugs into the brain. Focus on psychotropic drugs, Eur Neuropsychopharmacol. 18 (2008) 157-69. [10] O. Levran, K. O'Hara, E. Peles, D. Li, S. Barral, B. Ray, et al., ABCB1 (MDR1) genetic variants are associated with methadone doses required for effective treatment of heroin dependence, Hum Mol Genet. 17 (2008) 2219-27. [11] D. Campa, A. Gioia, A. Tomei, P. Poli, R. Barale, Association of ABCB1/MDR1 and OPRM1 gene polymorphisms with morphine pain relief, Clin Pharmacol Ther. 83 (2008) 559-66. [12] L. Karlsson, U. Schmitt, M. Josefsson, B. Carlsson, J. Ahlner, F. Bengtsson, et al., Blood-brain barrier penetration of the enantiomers of venlafaxine and its metabolites in mice lacking P-glycoprotein, Eur Neuropsychopharmacol. 20 (2010) 632-40. [13] O. Slanar, M. Nobilis, J. Kvetina, O. Matouskova, J.R. Idle, F. Perlik, Pharmacokinetics of tramadol is affected by MDR1 polymorphism C3435T, Eur J Clin Pharmacol. 63 (2007) 419-21. [14] M. Kanaan, Y. Daali, P. Dayer, J. Desmeules, Uptake/efflux transport of tramadol enantiomers and O-desmethyl-tramadol: focus on P-glycoprotein, Basic Clin Pharmacol Toxicol. 105 (2009) 199-206. [15] B. Sheikholeslami, M. Hamidi, B. Sheikholeslami, H. Lavasani, M. Sharifzadeh, M.R. Rouini, Lack of evidence for involvement of P-glycoprotein in brain uptake of the centrally acting analgesic, tramadol in the rat, J Pharm Pharm Sci. 15 (2012) 606-15. [16] O. Slanar, P. Dupal, O. Matouskova, H. Vondrackova, P. Pafko, F. Perlik, Tramadol efficacy in patients with postoperative pain in relation to CYP2D6 and MDR1 polymorphisms, Bratisl Lek Listy. 113 (2012) 152-5. [17] W.Y. Chou, L.C. Yang, H.F. Lu, J.Y. Ko, C.H. Wang, S.H. Lin, et al., Association of mu-opioid receptor gene polymorphism (A118G) with variations in morphine consumption for analgesia after total knee arthroplasty, Acta Anaesthesiol Scand. 50 (2006) 787-92. [18] P. Klepstad, T.T. Rakvag, S. Kaasa, M. Holthe, O. Dale, P.C. Borchgrevink, et al., The 118 A > G polymorphism in the human mu-opioid receptor gene may increase morphine requirements in patients with pain caused by malignant disease, Acta Anaesthesiol Scand. 48 (2004) 1232-9. [19] A.F. Manini, M.M. Jacobs, D. Vlahov, Y.L. Hurd, Opioid receptor polymorphism A118G associated with clinical severity in a drug overdose population, J Med Toxicol. 9 (2013) 148-54.
Page 14 of 23
Accep
ted
Man
uscr
ipt
Figure 1
[20] Y.C. Liu, W.S. Wang, Human mu-opioid receptor gene A118G polymorphism predicts the efficacy of tramadol/acetaminophen combination tablets (ultracet) in oxaliplatin-induced painful neuropathy, Cancer. 118 (2012) 1718-25. [21] A.L. Zackrisson, P. Holmgren, A.B. Gladh, J. Ahlner, B. Lindblom, Fatal intoxication cases: cytochrome P450 2D6 and 2C19 genotype distributions, Eur J Clin Pharmacol. 60 (2004) 547-52. [22] E. Soderback, A.L. Zackrisson, B. Lindblom, A. Alderborn, Determination of CYP2D6 gene copy number by pyrosequencing, Clin Chem. 51 (2005) 522-31. [23] S. Grond, A. Sablotzki, Clinical pharmacology of tramadol, Clin Pharmacokinet. 43 (2004) 879-923. [24] A. Levo, A. Koski, I. Ojanpera, E. Vuori, A. Sajantila, Post-mortem SNP analysis of CYP2D6 gene reveals correlation between genotype and opioid drug (tramadol) metabolite ratios in blood, Forensic Sci Int. 135 (2003) 9-15. [25] S. Rendic, Summary of information on human CYP enzymes: human P450 metabolism data, Drug Metab Rev. 34 (2002) 83-448. [26] E. Kim, C.B. Choi, C. Kang, S.C. Bae, G. Ultracet Study, Adverse events in analgesic treatment with tramadol associated with CYP2D6 extensive-metaboliser and OPRM1 high-expression variants, Ann Rheum Dis. 69 (2010) 1889-90. [27] D. Marez, M. Legrand, N. Sabbagh, J.M. Lo Guidice, C. Spire, J.J. Lafitte, et al., Polymorphism of the cytochrome P450 CYP2D6 gene in a European population: characterization of 48 mutations and 53 alleles, their frequencies and evolution, Pharmacogenetics. 7 (1997) 193-202. [28] C. Sachse, J. Brockmoller, S. Bauer, I. Roots, Cytochrome P450 2D6 variants in a Caucasian population: allele frequencies and phenotypic consequences, Am J Hum Genet. 60 (1997) 284-95. [29] R.A. Sansone, L.A. Sansone, Tramadol: seizures, serotonin syndrome, and coadministered antidepressants, Psychiatry (Edgmont). 6 (2009) 17-21.
Page 15 of 23
Accep
ted
Man
uscr
ipt
Figure 1
Figure 1. Mean blood concentrations ± SEM for tramadol (filled circles) and O-desmethyltramadol (open circles) versus time curves after a single oral administration of 50
mg tramadol (n=10) in (a) and 100 mg (n=9) in (b).
Figure 2. Correlation between the mean blood concentration ± SEM for ODT/TRA and time after drug intake for extensive metabolisers, EMs (n=8, filled diamonds),
intermediate metabolisers, IMs (n=9, open diamonds) and a poor metaboliser, PM (n=1, filled triangles).
Figure 3. The self-reported score of drug related symptoms (DRS) in correlation to different single nucleotide polymorphisms in the OPRM1 and ABCB1 gene. The subjects
are grouped by CYP2D6 genotype: extensive metabolisers, EMs (cross), intermediate metabolisers, IMs (open ovals) and poor metabolisers, PMs (line). Subjects receiving 50
mg tramadol (n=10) is shown in (a) and 100 mg (n=9) in (b).
Page 16 of 23
Accep
ted
Man
uscr
ipt
Figure 1
0
50
100
150
200
0 2 4 6 8 10 12
Time (h)
Con
cent
ratio
n (n
g/g
bloo
d)
0
100
200
300
400
0 2 4 6 8 10 12
Time (h)C
once
ntra
tion
(ng/
g bl
ood)
a b
Page 17 of 23
Accep
ted
Man
uscr
ipt
Figure 2
y = 0.0312x + 0.2646R2 = 0.97
y = 0.0215x + 0.1347R2 = 0.96
y = 0.0031x + 0.0709R2 = 0.92
0,0
0,1
0,2
0,3
0,4
0,5
0,6
0,7
0 2 4 6 8 10 12
Time (h)
OD
T/TR
A co
ncen
tratio
n ra
tio
EMs
IMs
PM
Page 18 of 23
Accep
ted
Man
uscr
ipt
Figure 3
a
b
Page 19 of 23
Accep
ted
Man
uscr
ipt
Figure 3
Table 1 Pharmacokinetic parameters of tramadol (TRA) and its metabolite O-desmethyltramadol (ODT) after a
single oral administration of 50 and 100 mg tramadol, respectively.
50 mg TRA (n=10) 100 mg TRA (n=9) Pharmacokinetic variables Median Mean Range Median Mean Range
Last detectable time point (min) 602 855 597-1504 1455 1267 596-1485
ODT
Cmax (ng/g) 47 44 0-62 69 68 27-126
tmax (min) 180 170 90-240 182 190 93-300
AUC0-10 (ng h/g) 318 301 0-426 503 479 199-896
AUC0-∞ (ng h/g) 411 410 0-620 834 819 266-1451
Last detectable time point (min) 599 600 597-606 1425 1129 600-1480
Cmax maximum blood concentration; tmax time to reach Cmax; AUC0-10, AUC0-∞ area under the blood concentration-time curve (AUC) from 0 to 10 h, and from 0 to infinity, respectively.
Page 20 of 23
Accep
ted
Man
uscr
ipt
Figure 3
Table 3 Self-reported scores on drug related symptoms during the experimental day. A scale between zero to
five, where zero was no symptoms at all and five was worst imaginable symptoms was used. The subjects were
grouped after dose received; (a) 50 mg tramadol (n=10) and (b) 100 mg tramadol (n=9).