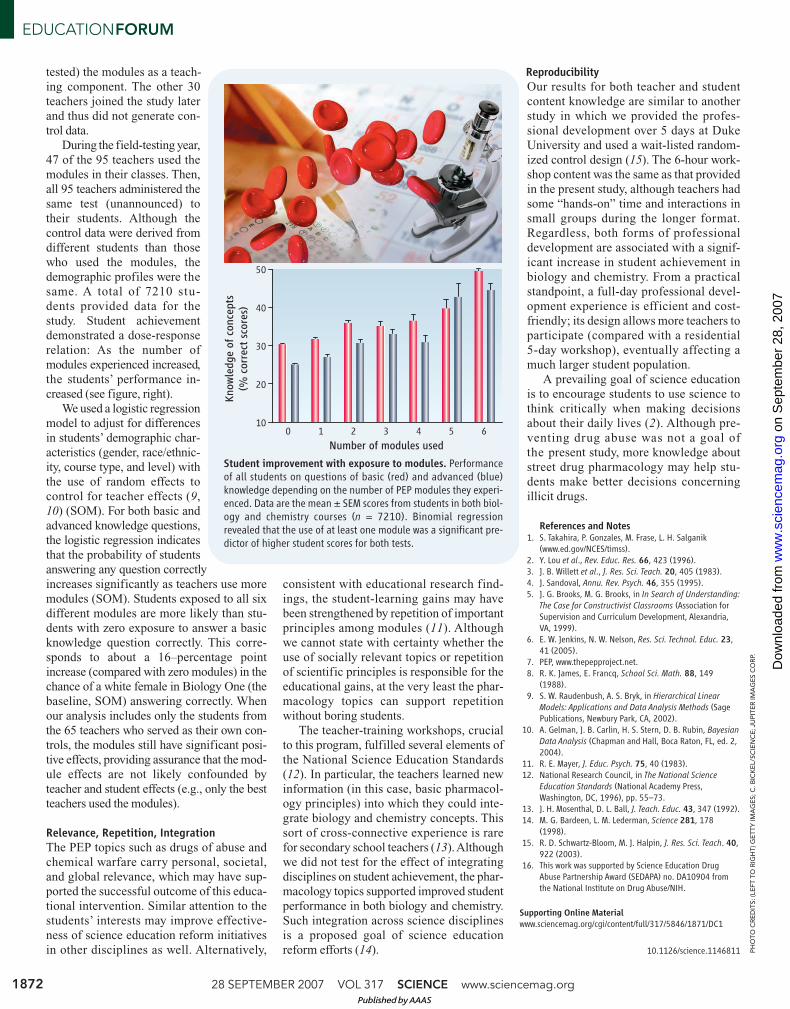
www.sciencemag.org SCIENCE VOL 317 28 SEPTEMBER 2007 1871 PHOTO CREDIT: JUPITER IMAGES CORP. EDUCATION FORUM M any teachers say that their most dif- ficult task is getting students’ atten- tion. What does get students’ atten- tion? Sex, drugs, and rock-n-roll, of course. U.S. high-school students rank relatively low in science achievement compared with their international peers (1). Factors that may contribute to poor science achievement include (but are not limited to) inadequate teacher training, lack of inquiry-based teach- ing, insufficient hands-on student activities, and students’ views of science as boring or too hard (2, 3). A positive relation exists between student interest and student learning: Topics and approaches that arouse student interest can help motivate students to learn and increase achievement (4). Theories of constructivism (that learners formulate new understandings by building on their own prior ideas) from cognitive psychology also indi- cate that learning improves when information is embedded within meaningful contexts (5). When high-school students are asked to indicate their interest in learning about various topics in their science classes, they choose topics such as disease (cancer and HIV/AIDS), drugs (therapeutic and recre- ational), biological and chemical weapons, the ozone layer, and greenhouse gases (6). Yet, the usual high-school science curriculum does not address these topics. Pharmacology Education Partnership Given the interest of students in drugs and their bodies, we hypothesized that science instruction in the context of drug-related top- ics (i.e., pharmacology) could improve stu- dent learning of standard high-school biology and chemistry concepts. To study this issue, we developed the Pharmacology Education Partnership (PEP), a partnership between Duke University faculty and high-school teachers across the United States. The PEP project comprised three major components: (i) development of pharmacology content modules, (ii) professional development for teachers of high-school biology and chem- istry, and (iii) assessment of students’ knowl- edge of basic biology and chemistry concepts. Each pharmacology module was designed in an inquiry-based format. Details of the contents of the module and the teachers’ guide are found in the supporting online material (SOM) and on the PEP Web site (7). The modules focused on a pharmacological topic that integrated basic science principles in biology and chemistry with issues from other relevant disciplines such as mathemat- ics, public policy, psychology, and social sci- ences. Topics (see figure, right) were chosen with an expectation that students would iden- tify with the subject matter on the basis of personal experience or interest generated from popular culture and the media. High-school biology and chemistry teach- ers were recruited nationally to take part in the PEP study (see demographics in SOM). The process began when 116 teachers attended day-long professional development workshops at one of three conferences, including the Conference on Science Edu- cation for the National Science Teachers Association (NSTA) and the North Carolina Science Teachers Association (NCSTA) in 2003 (SOM). The workshops showed how biology and chemistry concepts support the pharmacology topics in the modules. Teachers discussed how to bring these topics into their already crowded curriculum. After the workshop, teachers collaborated to de- velop classroom and laboratory activities to support each module (activities are avail- able on the PEP Web site). Assessment of teacher knowledge one year after the work- shops indicated gains in knowledge of biol- ogy and chemistry (SOM). The following year after the workshops, 95 of those teachers field-tested the program in their classes (21 teachers dropped out dur- ing the year for unknown reasons). Because teachers often modify use of instructional materials according to their own style (8), we invited that flexibility; we requested only that teachers use as many modules as possible and report what they did. Of the teachers who used modules in their classes, the most com- monly reported method was to incorporate the content in their normal lesson plans, with- out “piling on additional material” (SOM). The most commonly reported reason for not using the modules was lack of time (SOM), suggesting that priority was given to preexist- ing curricula. Student Assessment With input from an advisory group of five high-school teachers (independent of our testing group), we developed a testing instru- ment to determine students’ knowledge of standards-based biology and chemistry con- cepts. The test consisted of two parts (see SOM for sample questions). The “basic knowledge” questions were similar to those found in standard high-school biology and chemistry textbooks. The “advanced knowl- edge” questions tested specifically for knowl- edge about drugs, assessing concepts not nor- mally taught in the standard curriculum. To obtain control data, 65 of the 95 teachers had the workshop soon enough that they were able to administer the tests to a separate group of students in the year before they used (field- Making learning relevant improves students’ knowledge of biology and chemistry. Pharmacology in the High-School Classroom Nicole C. Kwiek, 1 * Myra J. Halpin, 2 Jerome P. Reiter, 3 Leanne A. Hoeffler, 1 Rochelle D. Schwartz-Bloom 1 † RELEVANCE 1 Department of Pharmacology and Cancer Biology, Duke University Medical Center, Durham, NC 27710, USA. 2 North Carolina School of Science and Mathematics, Durham, NC 27705, USA. 3 Institute for Statistics and Decision Sciences, Duke University, Durham, NC 27708, USA. *Present address: Ohio State University, College of Pharmacy, Columbus, OH 43210, USA. †Author for correspondence. E-mail: [email protected]• Acids, Bases, and Cocaine Addicts • Drug Testing: A Hair-Brained Idea • How Drugs Kill Neurons: It’s Radical! • Military Pharmacology: It Takes Nerves • Why Do Plants Make Drugs for Humans? • Steroids and Athletes: Genes Work Overtime MODULE TOPICS Published by AAAS on September 28, 2007 www.sciencemag.org Downloaded from
Transcript
www.sciencemag.org SCIENCE VOL 317 28 SEPTEMBER 2007 1871
PH
OT
O C
RE
DIT
: JU
PIT
ER
IM
AG
ES
CO
RP.
EDUCATIONFORUM
Many teachers say that their most dif-
ficult task is getting students’atten-
tion. What does get students’ atten-
tion? Sex, drugs, and rock-n-roll, of course.
U.S. high-school students rank relatively
low in science achievement compared with
their international peers (1). Factors that may
contribute to poor science achievement
include (but are not limited to) inadequate
teacher training, lack of inquiry-based teach-
ing, insufficient hands-on student activities,
and students’ views of science as boring or
too hard (2, 3). A positive relation exists
between student interest and student learning:
Topics and approaches that arouse student
interest can help motivate students to learn
and increase achievement (4). Theories of
constructivism (that learners formulate new
understandings by building on their own prior
ideas) from cognitive psychology also indi-
cate that learning improves when information
is embedded within meaningful contexts (5).
When high-school students are asked
to indicate their interest in learning about
various topics in their science classes, they
choose topics such as disease (cancer and
HIV/AIDS), drugs (therapeutic and recre-
ational), biological and chemical weapons,
the ozone layer, and greenhouse gases (6).
Yet, the usual high-school science curriculum
does not address these topics.
Pharmacology Education Partnership
Given the interest of students in drugs and
their bodies, we hypothesized that science
instruction in the context of drug-related top-
ics (i.e., pharmacology) could improve stu-
dent learning of standard high-school biology
and chemistry concepts. To study this issue,
we developed the Pharmacology Education
Partnership (PEP), a partnership between
Duke University faculty and high-school
teachers across the United States. The PEP
project comprised three major components:
(i) development of pharmacology content
modules, (ii) professional development for
teachers of high-school biology and chem-
istry, and (iii) assessment of students’ knowl-
edge of basic biology and chemistry concepts.
Each pharmacology module was designed
in an inquiry-based format. Details of the
contents of the module and the teachers’
guide are found in the supporting online
material (SOM) and on the PEP Web site (7).
The modules focused on a pharmacological
topic that integrated basic science principles
in biology and chemistry with issues from
other relevant disciplines such as mathemat-
ics, public policy, psychology, and social sci-
ences. Topics (see figure, right) were chosen
with an expectation that students would iden-
tify with the subject matter on the basis of
personal experience or interest generated
from popular culture and the media.
High-school biology and chemistry teach-
ers were recruited nationally to take part
in the PEP study (see demographics in
SOM). The process began when 116 teachers
attended day-long professional development
workshops at one of three conferences,
including the Conference on Science Edu-
cation for the National Science Teachers
Association (NSTA) and the North Carolina
Science Teachers Association (NCSTA) in
2003 (SOM). The workshops showed how
biology and chemistry concepts support
the pharmacology topics in the modules.
Teachers discussed how to bring these topics
into their already crowded curriculum. After
the workshop, teachers collaborated to de-
velop classroom and laboratory activities to
support each module (activities are avail-
able on the PEP Web site). Assessment of
teacher knowledge one year after the work-
shops indicated gains in knowledge of biol-
ogy and chemistry (SOM).
The following year after the workshops,
95 of those teachers field-tested the program
in their classes (21 teachers dropped out dur-
ing the year for unknown reasons). Because
teachers often modify use of instructional
materials according to their own style (8), we
invited that flexibility; we requested only that
teachers use as many modules as possible and
report what they did. Of the teachers who
used modules in their classes, the most com-
monly reported method was to incorporate
the content in their normal lesson plans, with-
out “piling on additional material” (SOM).
The most commonly reported reason for not
using the modules was lack of time (SOM),
suggesting that priority was given to preexist-
ing curricula.
Student Assessment
With input from an advisory group of five
high-school teachers (independent of our
testing group), we developed a testing instru-
ment to determine students’ knowledge of
standards-based biology and chemistry con-
cepts. The test consisted of two parts (see
SOM for sample questions). The “basic
knowledge” questions were similar to those
found in standard high-school biology and
chemistry textbooks. The “advanced knowl-
edge” questions tested specifically for knowl-
edge about drugs, assessing concepts not nor-
mally taught in the standard curriculum. To
obtain control data, 65 of the 95 teachers had
the workshop soon enough that they were able
to administer the tests to a separate group of
students in the year before they used (field-
Making learning relevant improves students’knowledge of biology and chemistry.
Pharmacology in the High-SchoolClassroomNicole C. Kwiek,1* Myra J. Halpin,2 Jerome P. Reiter,3 Leanne A. Hoeffler,1
Rochelle D. Schwartz-Bloom1†
RELEVANCE
1Department of Pharmacology and Cancer Biology, DukeUniversity Medical Center, Durham, NC 27710, USA.2North Carolina School of Science and Mathematics,Durham, NC 27705, USA. 3Institute for Statistics andDecision Sciences, Duke University, Durham, NC 27708,USA.
*Present address: Ohio State University, College ofPharmacy, Columbus, OH 43210, USA.
• Acids, Bases, and Cocaine Addicts • Drug Testing: A Hair-Brained Idea • How Drugs Kill Neurons: It’s Radical! • Military Pharmacology: It Takes Nerves • Why Do Plants Make Drugs for Humans? • Steroids and Athletes: Genes Work Overtime
28 SEPTEMBER 2007 VOL 317 SCIENCE www.sciencemag.org1872
PH
OT
O C
RE
DIT
S: (L
EF
T T
O R
IGH
T) G
ET
TY
IM
AG
ES
; C
. B
ICK
EL/S
CIE
NC
E; JU
PIT
ER
IM
AG
ES
CO
RP.
EDUCATIONFORUM
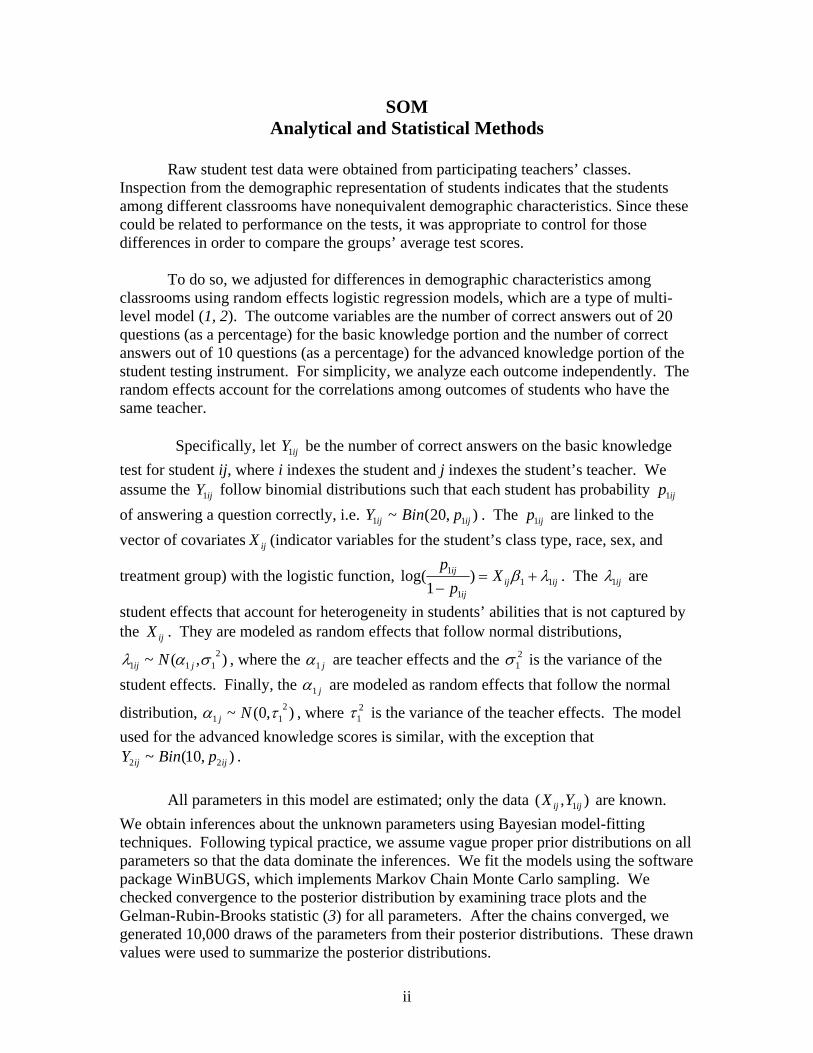
Student improvement with exposure to modules. Performanceof all students on questions of basic (red) and advanced (blue)knowledge depending on the number of PEP modules they experi-enced. Data are the mean ± SEM scores from students in both biol-ogy and chemistry courses (n = 7210). Binomial regressionrevealed that the use of at least one module was a significant pre-dictor of higher student scores for both tests.
Raw student test data were obtained from participating teachers’ classes.
Inspection from the demographic representation of students indicates that the students among different classrooms have nonequivalent demographic characteristics. Since these could be related to performance on the tests, it was appropriate to control for those differences in order to compare the groups’ average test scores.
To do so, we adjusted for differences in demographic characteristics among
classrooms using random effects logistic regression models, which are a type of multi-level model (1, 2). The outcome variables are the number of correct answers out of 20 questions (as a percentage) for the basic knowledge portion and the number of correct answers out of 10 questions (as a percentage) for the advanced knowledge portion of the student testing instrument. For simplicity, we analyze each outcome independently. The random effects account for the correlations among outcomes of students who have the same teacher.
Specifically, let be the number of correct answers on the basic knowledge
test for student ij, where i indexes the student and j indexes the student’s teacher. We assume the follow binomial distributions such that each student has probability of answering a question correctly, i.e. . The are linked to the vector of covariates (indicator variables for the student’s class type, race, sex, and
treatment group) with the logistic function,
ijY1
ijY1 ijp1
),20(~ 11 ijij pBinY ijp1
ijX
ijijij
ij Xp
p11
1
1 )1
log( λβ +=−
. The ij1λ are
student effects that account for heterogeneity in students’ abilities that is not captured by the . They are modeled as random effects that follow normal distributions,
, where the ijX
),(~ 2111 σαλ jij N j1α are teacher effects and the is the variance of the
student effects. Finally, the
21σ
j1α are modeled as random effects that follow the normal
distribution, , where is the variance of the teacher effects. The model used for the advanced knowledge scores is similar, with the exception that
.
),0(~ 211 τα Nj
21τ
),10(~ 22 ijij pBinY All parameters in this model are estimated; only the data are known.
We obtain inferences about the unknown parameters using Bayesian model-fitting techniques. Following typical practice, we assume vague proper prior distributions on all parameters so that the data dominate the inferences. We fit the models using the software package WinBUGS, which implements Markov Chain Monte Carlo sampling. We checked convergence to the posterior distribution by examining trace plots and the Gelman-Rubin-Brooks statistic (3) for all parameters. After the chains converged, we generated 10,000 draws of the parameters from their posterior distributions. These drawn values were used to summarize the posterior distributions.
),( 1ijij YX
ii
We checked the models using posterior predictive checks and sensitivity analyses (1), which are typical diagnostics in Bayesian modeling. The posterior predictive checks involve (i) simulating new outcomes for the students in the dataset based on the fitted model, and (ii) comparing the simulated outcomes to the . Discrepancies in the simulated and actual outcomes indicate inadequate model fit. The sensitivity analyses involve fitting the model with other reasonable prior distributions and comparing the resulting inferences. Substantial differences indicate the model is sensitive to the prior assumptions. The posterior predictive checks did not reveal any lack of fit, suggesting that the models are reasonable. In contrast, when we excluded the
ijY1
ij1λ or the j1α , the models under-predicted small and large outcomes and over-predicted typical outcomes. We also found that assuming the or follow normal distributions led to inferior model-fit, with many negative predicted scores. The sensitivity analyses confirmed that our prior distribution did not substantially impact inferences.
ijY1 ijY2
We compared the test scores of all students whose teachers chose to use zero
modules and all students whose teachers were not yet allowed to use the modules (i.e., when the teachers were controls). There were no significant differences among these students’ average test scores (means 30.5% and 30.5% correct on the basic knowledge test or 25.5% and 24.3% correct on the advanced knowledge test, respectively). Thus, we combined all student data with zero modules in one group for the analyses.
We repeated the analyses using only the 65 teachers who served as their own controls. The results are very similar; increased module use by teachers resulted in strongly significant positive and increasing gains in student knowledge. This is expected since roughly 70% of the students were taught by teachers who served as their own controls. Assuming teacher and student quality does not change radically from class to class, this similarity provides some assurance that the significant positive effects associated with the modules do not result primarily for selection bias (e.g., only the best teachers use the modules).
The logistic regression results are valid under the assumptions that, for any given
student, (i) the probability of answering correctly is the same for all basic or all advanced knowledge questions, and (ii) each question is independent of others. The second assumption is reasonable, since the questions are designed to test different concepts (e.g., specific concepts in both biology and chemistry). We made the first assumption out of convenience; the dataset comprised total scores rather than individual item scores. Prior to the study an advisory panel of 5 teachers rated each question for relevance and appropriate level of difficulty. Four of the 5 teachers rated 19 of the 20 basic knowledge questions as relevant and of appropriate difficulty. One of the 20 questions was rated by 3 of the 5 teachers as relevant and of appropriate difficulty. Although the dataset used for analysis only had total scores, we subsequently reviewed performance on individual questions for students in the zero module group. Most questions were answered correctly by 15% to 45% of the students (basic knowledge mean = 30% with SD = 15%, and advanced knowledge mean = 25% with SD = 13%). One question in each test was answered by more than 50% of the students (62% and 53%, respectively). Thus, although there are no "easy" questions on either test, the assumption of equal item difficulty may not be precisely true. We tried normal and Poisson distributions in place of
iii
binomial distributions, since these do not assume constant probability; however, these models did not fit the data as well as the binomial model.
Given the strong effects of the modules, and since all students took the same test, we are optimistic that the general conclusions would not change substantially if we controlled for item difficulty. In our model checks, we did not see any evidence of over-dispersion or lack of fit, which suggests that the binomial model yields reasonable inferences for the overall effects of the modules. Nevertheless, building an item-level dataset allows one to account explicitly for variation in item difficulty with a more complex statistical model, as is done in item response models. Thus, one can evaluate the properties of the individual questions and ascertain if the effects of the modules differ by question. Future studies can be performed to explore these relationships.
iv
Module Content (Complete content is available online at www.thepepproject.net)
• Each PEP module comprised:
o A set of learning objectives o An inquiry-directed student handout (problem-based learning approach) o A teacher’s guide with background science content (containing answers to
student questions) and illustrative graphics o A glossary of terms o A resource list o Student hands-on or minds-on activities o Assessment strategies
• The biology and chemistry principles highlighted in the modules include:
o Acids, Bases and Cocaine Addicts Acid-base chemistry, molecular structure, circulatory system,
Covalent bonding, enzyme action, autonomic nervous system, physiology, behavior of gases, chemical warfare, Middle East & Japan current events/history
o Why Do Plants Make Drugs for Humans?
Plant cell structure and classification, acid-base chemistry, molecular structure, polarity, membrane transport, tobacco industry chemical “tricks
o Steroids and Athletes: Genes Work Overtime
Steroid biology, molecular structure, muscle cell anatomy and physiology, lipophilicity, diffusion, DNA structure, gene transcription, protein synthesis, drug testing
Sample Page from Module 3 at www.thepeproject.netHow do Drugs Kill Neurons? It’s Radical!
During the PEP study, there were 556 teacher visits and 4,659 student visits to the website online (this does not include offline usage; all teachers had a CD Rom version of the website that did not require internet access). Since opening the PEP website to the public in 2004, there have been 14,411 teacher visits and 31,779 student visits to the website online (as of August, 2007). The online usage underestimates the curriculum usage, as the entire content is downloadable in pdf format.
Teachers attended either the workshop at the National Science Teachers Association Conference in Science Education in 2003 (Philadelphia, PA) or the North Carolina Science Teachers Association Conference in Science Education in 2002 and 2003 (Greensboro, NC). Of the 116 teachers attending the workshops, 95 teachers participated in field-testing. Of these, 30 teachers matriculated too late to provide control data from their students. Thus, 65 teachers served as their own controls.
vii
Teacher Knowledge, Pre- and Post-Workshop Training
To assess the effect of the workshops on teacher knowledge, teachers were administered pre- and posttests without prior warning. The tests consisted of 20 true/false questions of basic biology, chemistry, and pharmacology principles. The post-test given at the workshop indicated a significant gain in knowledge (65 % vs 81% correct, pre- and post-test respectively). To assess the impact of the workshop long-term, teachers were tested again 1 year later. Teachers maintained their knowledge gain for at least 1 year after they completed the workshop.
Data are the mean +/- SEM percent correct scores from a 20-item test of biology, chemistry, and pharmacology principles taken prior to the workshop (pre-test), immediately after the workshop (post-test), and 1 year after the workshop (1-yr post-test). Significant knowledge gains were achieved as assessed by both post-tests (*p<0.001, ANOVA and Neuman Keul’s Multiple Comparisons Test (n = 45 paired comparisons)).
viii
Teacher Feedback Concerning Module Implementation
We collected teacher feedback concerning module implementation and lack of
implementation. Of the teachers who provided us with this information, they used modules in 85 classes. Teachers did not use modules in 50 classes. The methods or reasons for using or not using the modules in these classes are summarized below:
Method for implementation of the PEP modules
Percentage of classes (n = 85)
Incorporated module content into lesson plans throughout semester 47 Presented module material in a single class period 33 Presented module material over 2 or more class periods 13 Modules used as supplementary exercise(s) out of class (e.g., homework, student projects) 5 Other 2
Reasons for not using the PEP modules
Percentage of classes (n = 50)
No time due to course requirements 22 No time (no reason given) 30 Material too advanced 14 Other 34
ix
Sample questions from the PEP testing instruments *Correct answers are indicated in bold.
Basic knowledge assessment A drug injected into a vein travels throughout the circulation in the following order to reach the brain:
A. Left side of the heart, lungs, right side of the heart, arteries, brain B. Right side of the heart, lungs, left side of the heart, arteries, brain C. Left side of the heart, lungs, right side of the heart, veins, brain D. Right side of the heart, lungs, left side of the heart, veins, brain E. don’t know
Wh o lowing types of compounds is most volatile?
ids compounds
lant cells store compounds within the cytoplasm in watery sacs called:
ria
rotein synthesis proceeds in the following order:
s out transcription to a protein ein
spirin, HASA, ionizes in solution, indicated by
HASA ⇔ H + ASA
When adding the following to the aspirin solution, which will produce the greatest
cular liquid such as cyclohexane or benzene nes
ich ne of the folA. molecular compounds B. ionic salts C. network solD. macromolecularE. don’t know
PA. lysosomes B. ribosomes C. vacuoles D. mitochondE. don’t know
PA. DNA is translated to mRNA, mRNA carrieB. DNA is transcribed to mRNA, mRNA carries out translation to a protC. RNA is transcribed to DNA, DNA carries out translation to a protein D. RNA is translated to DNA, DNA carries out transcription to a protein E. Don’t know
A
+ -
concentration of ASA-? A. water B. a moleC. sodium bicarbonate of the same pH as the intestiD. hydrochloric acid of the same pH as the stomach E. don’t know
x
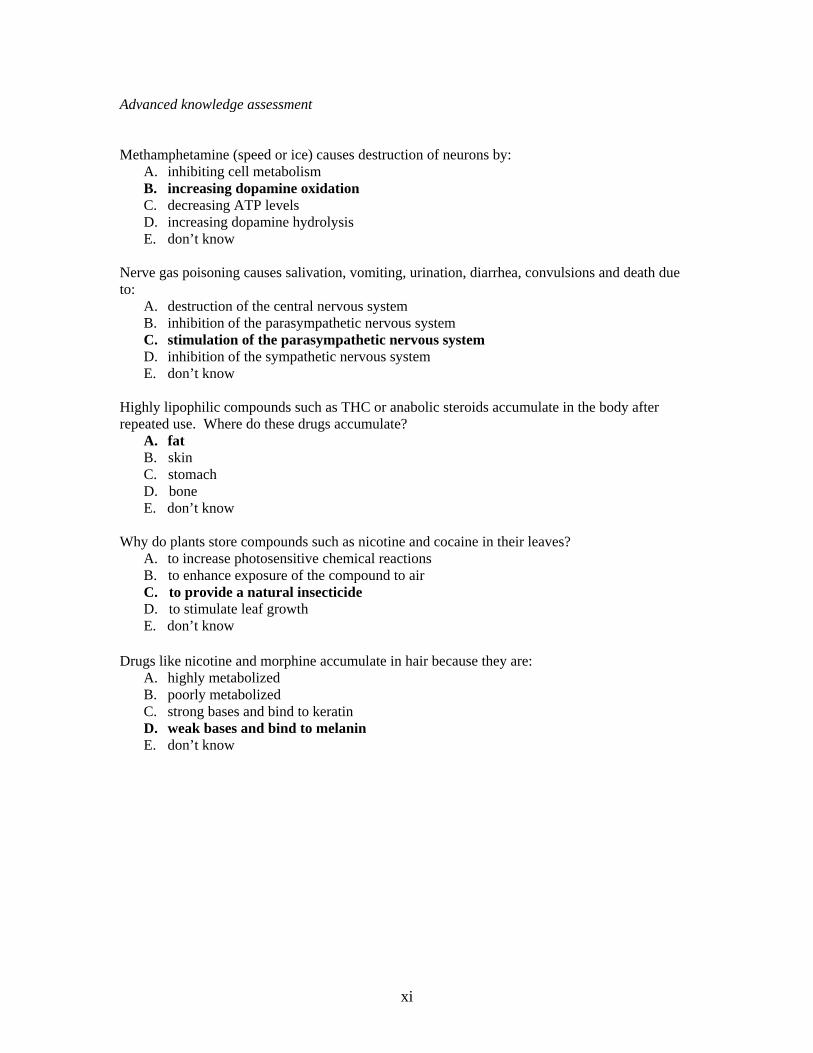
Advanced knowledge assessment
ethamphetamine (speed or ice) causes destruction of neurons by:
ation
drolysis
erve gas poisoning causes salivation, vomiting, urination, diarrhea, convulsions and death due
A. destruction of the central nervous system system
em
ighly lipophilic compounds such as THC or anabolic steroids accumulate in the body after
ch
now
hy do plants store compounds such as nicotine and cocaine in their leaves?
rugs like nicotine and morphine accumulate in hair because they are:
d to keratin
M
A. inhibiting cell metabolism B. increasing dopamine oxidC. decreasing ATP levels D. increasing dopamine hyE. don’t know
Nto:
B. inhibition of the parasympathetic nervous C. stimulation of the parasympathetic nervous systD. inhibition of the sympathetic nervous system E. don’t know
Hrepeated use. Where do these drugs accumulate? A. fat B. skin C. stoma D. bone E. don’t k W A. to increase photosensitive chemical reactions B. to enhance exposure of the compound to air C. to provide a natural insecticide D. to stimulate leaf growth E. don’t know D
A. highly metabolized B. poorly metabolized C. strong bases and binD. weak bases and bind to melaninE. don’t know
xi
Demographics of Students in Classes of Participating Teachers
Demographic Percent of students (n = 7210)
Male 47 White 69 Asian 6 Black 17 Native American 2 Hispanic/Latino 6 First year 15 Sophomore 35 Junior 38 Senior 12 Biology 1 40 Chemistry 1 40 Biology 2/AP 14 Chemistry 2/AP 6
_____________________________________________________________________ AP = Advanced placement
xii
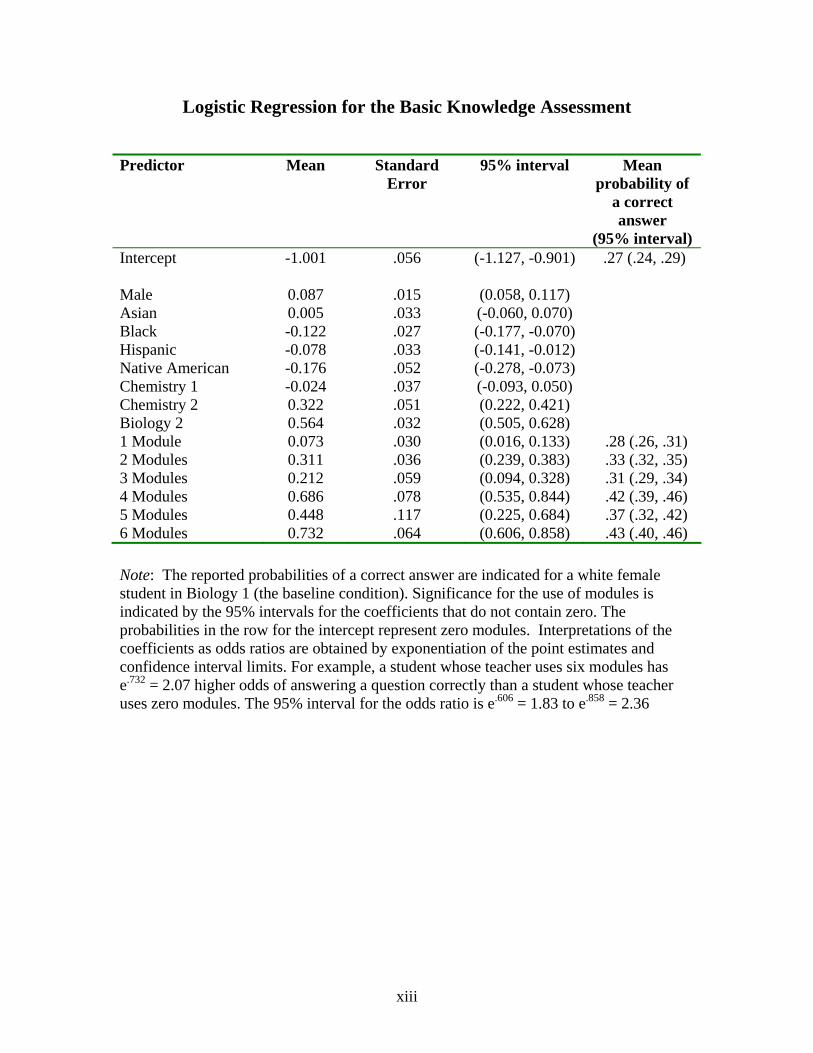
Logistic Regression for the Basic Knowledge Assessment
Note: The reported probabilities of a correct answer are indicated for a white female student in Biology 1 (the baseline condition). Significance for the use of modules is indicated by the 95% intervals for the coefficients that do not contain zero. The probabilities in the row for the intercept represent zero modules. Interpretations of the coefficients as odds ratios are obtained by exponentiation of the point estimates and confidence interval limits. For example, a student whose teacher uses six modules has e.732 = 2.07 higher odds of answering a question correctly than a student whose teacher uses zero modules. The 95% interval for the odds ratio is e.606 = 1.83 to e.858 = 2.36
xiii
Logistic Regression for the Advanced Knowledge Assessment
Male 0.054 .020 (0.014, 0.094) Asian -0.085 .044 (-0.174, 0.001) Black -0.194 .036 (-0.266, -0.123) Hispanic -0.029 .045 (-0.117, 0.060) Native American -0.141 .071 (-0.281, -0.001) Chemistry 1 0.003 .043 (-0.085, 0.085) Chemistry 2 0.157 .065 (0.034, 0.285) Biology 2 0.297 .040 (0.220, 0.374) 1 Module 0.159 .039 (0.083, 0.236) .26 (.24, .28) 2 Modules 0.322 .048 (0.231, 0.417) .29 (.27, .32) 3 Modules 0.383 .076 (0.232, 0.538) .31 (.27, .34) 4 Modules 0.709 .109 (0.491, 0.916) .38 (.33, .43) 5 Modules 1.082 .159 (0.773, 1.392) .47 (.39, .55) 6 Modules 0.707 .080 (0.557, 0.868) .38 (.34, .42) Note: The reported probabilities of a correct answer are indicated for a white female student in Biology 1 (the baseline condition). Significance for the use of modules is indicated by the 95% intervals for the coefficients that do not contain zero. The probabilities in the row for the intercept represent zero modules. Interpretations of the coefficients as odds ratios are obtained by exponentiation of the point estimates and confidence interval limits. For example, a student whose teacher uses six modules has e.707 = 2.03 higher odds of answering a question correctly than a student whose teacher uses zero modules. The 95% interval for the odds ratio is e.557 = 1.75 to e.868 = 2.38.
xiv
SOM References 1. A. Gelman, J. B. Carlin, H. S. Stern, D. B. Rubin. Bayesian Data Analysis,
Second Edition (Chapman and Hall, Boca Raton, 2004). 2. S. W. Raudenbush, A. S. Bryk, in Advanced quantitative techniques in the social
sciences. (Sage Publications, Thousand Oaks, 2002). 3. S. P. Brooks, A. Gelman, Journal of Computational and Graphical Statistics 7,
434 (1998). 4. We gratefully acknowledge Eric Loken, Pennsylvania State University for helpful
statistical discussions. 5. We gratefully acknowledge all the high school teachers who participated in this
study and contributed to the success of the Pharmacology Education Partnership.