Page 1
1
Phase relations in the Fe-FeSi system at high pressures and temperatures 1
2
Rebecca A. Fischera,*, Andrew J. Campbella, Daniel M. Reamana, Noah A. Millerb, Dion L. 3
Heinza, Przymyslaw Derac, and Vitali B. Prakapenkac 4
5 aDepartment of the Geophysical Sciences, University of Chicago, 5734 S Ellis Ave, Chicago, IL 6
60637, USA 7 bDepartment of Geology, University of Maryland, College Park, MD 20742, USA 8
cGeoSoilEnviroCARS, University of Chicago, 5640 S Ellis Ave, Chicago, IL 60637, USA 9 *Corresponding author. Email: [email protected] . Phone: 773.834.1085. 10
Fax: 773.702.9505. 11
12
13
Accepted for publication in Earth and Planetary Science Letters, 23 April 2013 14
15
16
Abstract 17
The Earth’s core is comprised mostly of iron and nickel, but it also contains several weight 18
percent of one or more unknown light elements, which may include silicon. Therefore it is 19
important to understand the high pressure, high temperature properties and behavior of alloys in 20
the Fe-FeSi system, such as their phase diagrams. We determined melting temperatures and 21
subsolidus phase relations of Fe-9wt%Si and stoichiometric FeSi using synchrotron X-ray 22
diffraction at high pressures and temperatures, up to ~200 GPa and ~145 GPa, respectively. 23
Combining this data with that of previous studies, we generated phase diagrams in pressure-24
temperature, temperature-composition, and pressure-composition space. We find the B2 crystal 25
structure in Fe-9Si where previous studies reported the less ordered bcc structure, and a shallower 26
slope for the hcp+B2 to fcc+B2 boundary than previously reported. In stoichiometric FeSi, we 27
Page 2
2
report a wide B2+B20 two-phase field, with complete conversion to the B2 structure at ~42 GPa. 28
The minimum temperature of an Fe-Si outer core is 4380 K, based on the eutectic melting point of 29
Fe-9Si, and silicon is shown to be less efficient at depressing the melting point of iron at core 30
conditions than oxygen or sulfur. At the highest pressures reached, only the hcp and B2 structures 31
are seen in the Fe-FeSi system. We predict that alloys containing more than ~4-8 wt% silicon will 32
convert to an hcp+B2 mixture and later to the hcp structure with increasing pressure, and that an 33
iron-silicon alloy in the Earth’s inner core would most likely be a mixture of hcp and B2 phases. 34
35
Keywords: high pressure, iron-silicon alloys, phase diagrams, Earth’s core 36
37
38
1. Introduction 39
Earth’s core is an iron-rich alloy containing some nickel and several weight percent of 40
elements lighter than iron (Birch, 1952). This light element component is likely a mixture of 41
silicon, oxygen, sulfur, carbon, and/or hydrogen (e.g., Allègre et al., 1995; McDonough, 2003; 42
Poirier, 1994). Understanding phase relations in systems containing iron and one or more light 43
elements is critical for deducing the composition and structure of the Earth’s core. Binary phase 44
diagrams are a necessary step before more realistic phase diagrams containing two or more light 45
elements can be studied. Extrapolations of high pressure-temperature (P-T) phase diagrams allow 46
prediction of the crystal structure of the inner core, which may help explain its observed anisotropy 47
(e.g., Deguen, 2012; Mattesini et al., 2010; Stixrude and Cohen, 1995). Phase diagrams reveal 48
which phases’ equations of state and other properties should be compared to those of the core (e.g., 49
Fischer et al., 2011). In this study, we determine the phase diagrams of iron-silicon alloys. 50
Estimates of the core’s maximum silicon content vary, ranging from less than 4 wt% (Antonangeli 51
et al., 2010), to ~6-7 wt% (Allègre et al., 1995, Brosh et al., 2009; Javoy et al., 2010; McDonough, 52
2003; Shahar et al., 2009), to 8-12 wt% (Alfè et al., 2002; Asanuma et al., 2011; Fischer et al., 53
2012; Lin et al., 2003; Ricolleau et al., 2011; Rubie et al., 2011), to up to 20 wt% (Balchan and 54
Page 3
3
Cowan, 1966; Ringwood, 1959), based on a wide range of experimental and modeling techniques. 55
Pure iron has the hexagonal close-packed (hcp) structure at Earth’s inner core conditions 56
(Tateno et al., 2010), but the effects of light elements need to be studied systematically as a 57
function of composition. Some work has previously been done on high P-T phase diagrams of 58
iron-silicon alloys. Fischer et al. (2012) studied the subsolidus phase relations and melting curve of 59
Fe-16wt%Si alloy (Fe-16Si) to 140 GPa (Figure 1). Asanuma et al. (2008) investigated Fe-3.4Si, 60
finding a mixture of face-centered cubic (fcc) and hcp structures, and only the hcp structure at 61
lower temperatures and higher pressures. Sakai et al. (2011) studied Fe-4.8Ni-4.0Si, finding only 62
the hcp structure at pressures above ~150 GPa. Lin et al. (2002, 2009) studied Fe-7.9Si, 63
discovering a mixture of fcc and body-centered cubic (bcc) structures at low pressures and high 64
temperatures, hcp+bcc at intermediate pressures, and hcp at the highest pressures. Hirao et al. 65
(2004) performed room temperature compression on Fe-8.7Si, finding a conversion from bcc to 66
hcp structures at 16-36 GPa, consistent with results of Lin et al. (2003) on Fe-7.9Si. Kuwayama et 67
al. (2009) investigated the phase diagrams of Fe-9.9Si and Fe-6.4Si, while Zhang and Guyot 68
(1999a, 1999b) studied Fe-8.9Si. 69
Stoichiometric FeSi is known from quench studies and theory to transform from the B20 70
(FeSi-type) structure to the B2 (CsCl-type) structure at higher pressures (Caracas and 71
Wentzcovitch, 2004; Dobson et al., 2002, 2003; Lord et al., 2010; Vo!adlo et al., 1999), but the 72
location and slope of this boundary have been uncertain. Guyot et al. (1997) and Whitaker et al. 73
(2008, 2009) report thermal equations of state and elastic properties of B20-FeSi, respectively. 74
Knittle and Williams (1995) and Lin et al. (2003) compressed B20-FeSi at 300 K, while Dobson et 75
al. (2003), Sata et al. (2010), and Ono et al. (2007) studied compression of B2-FeSi at 300 K. The 76
melting curve of FeSi was measured by Lord et al. (2010) and Santamaría-Pérez and Boehler 77
(2008). Melting curves of other Fe-Si alloys have also been studied (Asanuma et al., 2010; Morard 78
et al., 2011; Fischer et al., 2012). Phase relations in the Fe-FeSi system were reported by Massalski 79
(1986) at one bar, and by Kuwayama and Hirose (2004) at 21 GPa. The system has also been 80
studied computationally (e.g., Brosh et al., 2009; Côté et al., 2010; Zhang and Oganov, 2010). 81
Page 4
4
In various studies, different compositions of Fe-Si alloys have been reported to have the 82
bcc, B2, and D03 crystal structures, which are highly related. The B2 structure is an ordered 83
version of the bcc structure, containing two sites in equal abundance. In Fe-Si alloys with the B2 84
structure, one of the sites is preferentially occupied by Fe and the other site is preferentially 85
occupied by Si. The D03 structure can be thought of as a doubling of the B2 unit cell in each 86
direction, with a higher degree of ordering. Again, in Fe-Si alloys with the D03 structure, iron 87
atoms will prefer one site and Si atoms will prefer the other site. There cannot be perfect ordering 88
in Fe-Si alloys unless the stoichiometry precisely matches the structure (FeSi for the B2 structure, 89
Fe3Si for the D03 structure), but the alloys may be partially ordered, with Fe and Si atoms showing 90
a site preference. 91
In this study, we determine the high P-T phase diagrams of Fe-9Si and FeSi, using 92
synchrotron X-ray diffraction in a laser-heated diamond anvil cell, up to pressures and 93
temperatures approaching those of Earth’s outer core. We synthesize our results with other recent 94
studies on the Fe-FeSi system to determine how phase relations in this system evolve as a function 95
of pressure, temperature, and composition. This allows prediction of the crystal structure of the 96
Earth’s inner core and identification of the phase(s) whose properties are most relevant to the inner 97
and outer core, assuming a predominantly Fe-Si core. These phase diagrams can be applied to 98
studies of other planetary cores, and will serve as a basis for future studies on multi-component 99
systems of candidate core materials. 100
101
102
2. Experimental methods 103
The Fe-9Si starting material (Goodfellow Corporation) was analyzed by electron 104
microprobe (Miller, 2009) and found to be chemically homogeneous, containing 8.75 ± 0.40 wt% 105
silicon (Fe0.84Si0.16 by mole, hereafter Fe-9Si). Fe-9Si or stoichiometric FeSi (Alfa Aesar) was 106
pressed in a diamond cell to produce a foil ~3-5 "m thick. Rhenium gaskets, initially 250 "m 107
thick, were preindented to 25-30 GPa, then a hole up to 100 "m in diameter was machined in the 108
Page 5
5
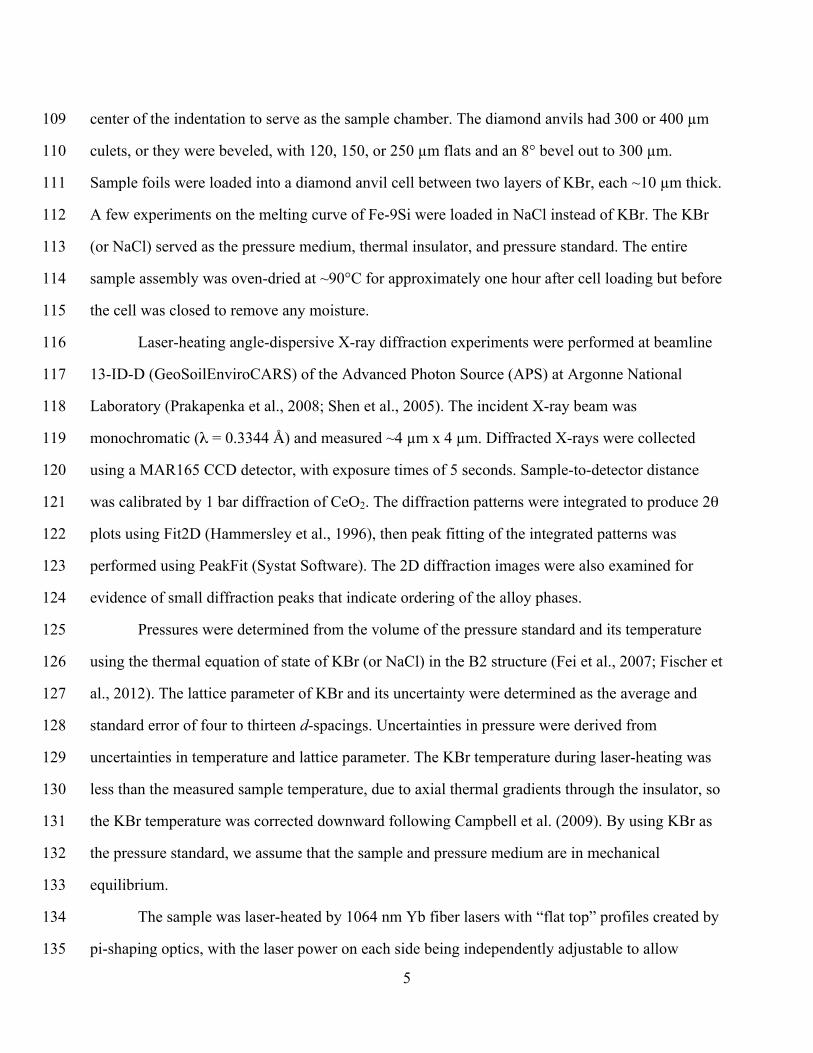
center of the indentation to serve as the sample chamber. The diamond anvils had 300 or 400 "m 109
culets, or they were beveled, with 120, 150, or 250 "m flats and an 8° bevel out to 300 "m. 110
Sample foils were loaded into a diamond anvil cell between two layers of KBr, each ~10 "m thick. 111
A few experiments on the melting curve of Fe-9Si were loaded in NaCl instead of KBr. The KBr 112
(or NaCl) served as the pressure medium, thermal insulator, and pressure standard. The entire 113
sample assembly was oven-dried at ~90°C for approximately one hour after cell loading but before 114
the cell was closed to remove any moisture. 115
Laser-heating angle-dispersive X-ray diffraction experiments were performed at beamline 116
13-ID-D (GeoSoilEnviroCARS) of the Advanced Photon Source (APS) at Argonne National 117
Laboratory (Prakapenka et al., 2008; Shen et al., 2005). The incident X-ray beam was 118
monochromatic (! = 0.3344 Å) and measured ~4 "m x 4 "m. Diffracted X-rays were collected 119
using a MAR165 CCD detector, with exposure times of 5 seconds. Sample-to-detector distance 120
was calibrated by 1 bar diffraction of CeO2. The diffraction patterns were integrated to produce 2" 121
plots using Fit2D (Hammersley et al., 1996), then peak fitting of the integrated patterns was 122
performed using PeakFit (Systat Software). The 2D diffraction images were also examined for 123
evidence of small diffraction peaks that indicate ordering of the alloy phases. 124
Pressures were determined from the volume of the pressure standard and its temperature 125
using the thermal equation of state of KBr (or NaCl) in the B2 structure (Fei et al., 2007; Fischer et 126
al., 2012). The lattice parameter of KBr and its uncertainty were determined as the average and 127
standard error of four to thirteen d-spacings. Uncertainties in pressure were derived from 128
uncertainties in temperature and lattice parameter. The KBr temperature during laser-heating was 129
less than the measured sample temperature, due to axial thermal gradients through the insulator, so 130
the KBr temperature was corrected downward following Campbell et al. (2009). By using KBr as 131
the pressure standard, we assume that the sample and pressure medium are in mechanical 132
equilibrium. 133
The sample was laser-heated by 1064 nm Yb fiber lasers with “flat top” profiles created by 134
pi-shaping optics, with the laser power on each side being independently adjustable to allow 135
Page 6
6
minimization of axial temperature gradients through the sample (Prakapenka et al., 2008). 136
Diffraction patterns were collected on heating and cooling. Temperatures were determined by 137
spectroradiometry (Heinz and Jeanloz, 1987) using the graybody approximation, and were 138
measured simultaneously with the diffraction patterns. Laser-heated spots were ~20 "m in 139
diameter, much larger than the X-ray beam to minimize radial temperature gradients in the region 140
probed by X-rays. Temperatures were simultaneously measured on the upstream and downstream 141
sides of the sample from an area 5 "m in diameter in the center of the laser-heated spot, 142
comparable to the size of the X-rayed region. X-ray-induced fluorescence of KBr was used to align 143
the optical axes of the laser heating and temperature measurement system with the X-ray beam. 144
Upstream and downstream temperatures were averaged to obtain the measured sample 145
temperature. For subsolidus measurements, the measured temperatures were then corrected 146
downward by 3% to estimate the sample temperature, accounting for a small axial temperature 147
gradient through the sample (Campbell et al., 2007, 2009). Reported temperature uncertainties 148
include an analytical uncertainty of 100 K from the temperature measurement system (Shen et al., 149
2001), the difference between the upstream and downstream temperatures, and uncertainty from 150
the correction for the thickness of the sample (Campbell et al., 2007, 2009). 151
Temperature measurements in the diamond cell were benchmarked by analyzing a sample 152
of iron in an MgO pressure medium to check the location of the hcp-fcc transition in iron (Fischer 153
et al., 2011, 2012). The sample was compressed to ~45 GPa based on the equation of state of hcp-154
Fe (Dewaele et al., 2006) and laser-heated. The phase transition was bracketed between volumes 155
and temperatures of 5.862 ± 0.026 cm3/mol (hcp volume), 1769 ± 120 K; and 6.039 ± 0.021 156
cm3/mol (fcc volume), 1820 ± 109 K. These values agree with the published phase diagram of 157
Komabayashi and Fei (2010). 158
Samples for room temperature compression were loaded in a quasi-hydrostatic neon 159
pressure medium using the COMPRES/GSECARS gas-loading system at the APS (Rivers et al., 160
2008). The sample was loaded with a few grains of KBr and ruby for pressure standards (Fischer et 161
al., 2012; Mao et al., 1986). Room temperature compression of FeSi was performed at the APS, 162
Page 7
7
while compression of Fe-9Si was done at beamline 12.2.2 of the Advanced Light Source (ALS), 163
Lawrence Berkeley National Laboratory (Kunz et al., 2005). At the ALS, LaB6 was used to 164
calibrate the sample-to-detector distance. A MAR345 image plate or Bruker CCD detector was 165
used, with a monochromatic incident beam (! = 0.41323 Å) measuring 30 "m x 30 "m. Exposure 166
times at the ALS were typically 20 seconds. 167
168
169
3. Results 170
3.1. Fe-9Si phase diagram 171
We determined the high P-T phase diagram of Fe-9Si to 200 GPa and over 4000 K, as 172
shown in Figure 1b (the phase diagram of pure iron is shown in Figure 1a for comparison). This 173
alloy has the D03 crystal structure at ambient conditions (Massalski, 1986) and under compression 174
at 300 K to 29 GPa. The D03 structure, with space group Fm3m, was previously reported for Fe-175
16Si (Fischer et al., 2012) and for Fe-5Ni-10Si (Morard et al., 2011). At high pressures and 176
temperatures, the Fe-9Si alloy took on the hcp structure. With increasing temperature, it converted 177
to an hcp+B2 mixture, then to fcc+B2. At the highest temperatures, sometimes three phases 178
(fcc+hcp+B2) were present in the experiments. The P-T data and the phase(s) observed are 179
recorded in Supplemental Table S1. 180
Figure 2 shows two diffraction patterns of Fe-9Si in KBr. The lower pattern was collected 181
at 30 GPa and 1490 K on heating, with peaks corresponding to B2 KBr, fcc Fe-9Si, and B2 Fe-9Si. 182
The alloy is shown to have the B2 structure, and not the bcc structure as previously reported (Lin 183
et al., 2002, 2009), due to the presence of the 111 peak. The upper pattern in Figure 2 was 184
collected on a different sample of Fe-9Si at 87 GPa and 2760 K, also on heating. All observed 185
peaks correspond to B2 KBr, hcp Fe-9Si, or B2 Fe-9Si. In this pattern, the 100 peak of B2 Fe-9Si 186
is visible, indicating that the alloy has the B2 (not bcc) structure. Supplemental Figure S1 shows a 187
series of diffraction patterns at ~200 GPa. The B2 peaks appear on heating and increase in 188
intensity with progression into the two-phase loop as the temperature is raised. 189
Page 8
8
We measured high pressure melting of Fe-9Si, based on the appearance of diffuse X-ray 190
scattering from the liquid alloy with increasing temperature (e.g., Dewaele et al., 2007; Fischer et 191
al., 2012; Morard et al., 2008, 2011). Figure 3 shows an example of diffuse scattering during laser 192
heating at ~74 GPa. These diffraction patterns were all obtained with the same exposure time, and 193
they were offset (by <1%) to match intensities at 2# = 5.0°. Beginning at 3390 K, a broad elevated 194
bump in the background appears at approximately 2# = 8-12°, due to X-ray scattering by the 195
liquid. The diffuse scattering intensity increases with increasing temperature, indicating a higher 196
fraction of partial melt. Peaks from one phase persist with the liquid while peaks from the other 197
phase shrink when diffuse scattering appears, indicating eutectic melting. Pressures and 198
temperatures of bounds on melting from X-ray diffuse scattering are listed in Supplemental Table 199
S2. 200
We also detected melting by analyzing the relationship between laser power and 201
temperature in cases where laser power data were recorded during the experiment, to compare to 202
the data on diffuse scattering. Figure 4 illustrates this relationship for two heating cycles on Fe-203
9Si, at ~88 GPa and ~101 GPa. Below the melting point, temperature increases monotonically and 204
linearly with laser power, then there is a discontinuity at the melting temperature. As laser power is 205
increased further, the temperature plateaus, fluctuating unstably around the melting point. The 206
melting temperature is taken as the average of temperatures within the plateau (Lord et al., 2010), 207
with its uncertainty calculated as the standard deviation of these values. Pressures and 208
temperatures of melting from laser power-temperature discontinuities are reported in Supplemental 209
Table S3. 210
211
3.2. FeSi phase diagram 212
We determined the high P-T phase diagram of stoichiometric FeSi to ~145 GPa and over 213
3400 K, as shown in Figure 1d. FeSi is stable in the B20 structure at ambient conditions. It 214
maintained the B20 structure under room temperature compression to ~36 GPa. At high 215
temperatures between 14 GPa and 42 GPa a two-phase region was observed, with coexisting B2 216
Page 9
9
and B20 structures. Figure 5 shows a diffraction pattern of FeSi in KBr collected at 39 GPa and 217
1210 K. It shows coexistence of the B2 and B20 structures of FeSi under these conditions. 218
From 42 GPa to 145 GPa, the highest pressure reached in this study for this composition, 219
FeSi maintained the B2 structure (Figure 1d). A single melting experiment was performed on FeSi, 220
at ~80 GPa. The melting point was bracketed between 3410 K and 3610 K, based on the 221
appearance of diffuse scattering in the X-ray diffraction pattern. The P-T data and the 222
corresponding phase(s) observed in FeSi are recorded in Supplemental Table S4. 223
224
225
4. Discussion 226
4.1. Fe-9Si subsolidus phase diagram 227
Recent studies on compositions similar to Fe-9Si (Hirao et al., 2004; Lin et al., 2003; 228
Zhang and Guyot, 1999a, 1999b) did not report the D03 structure at ambient conditions or under 229
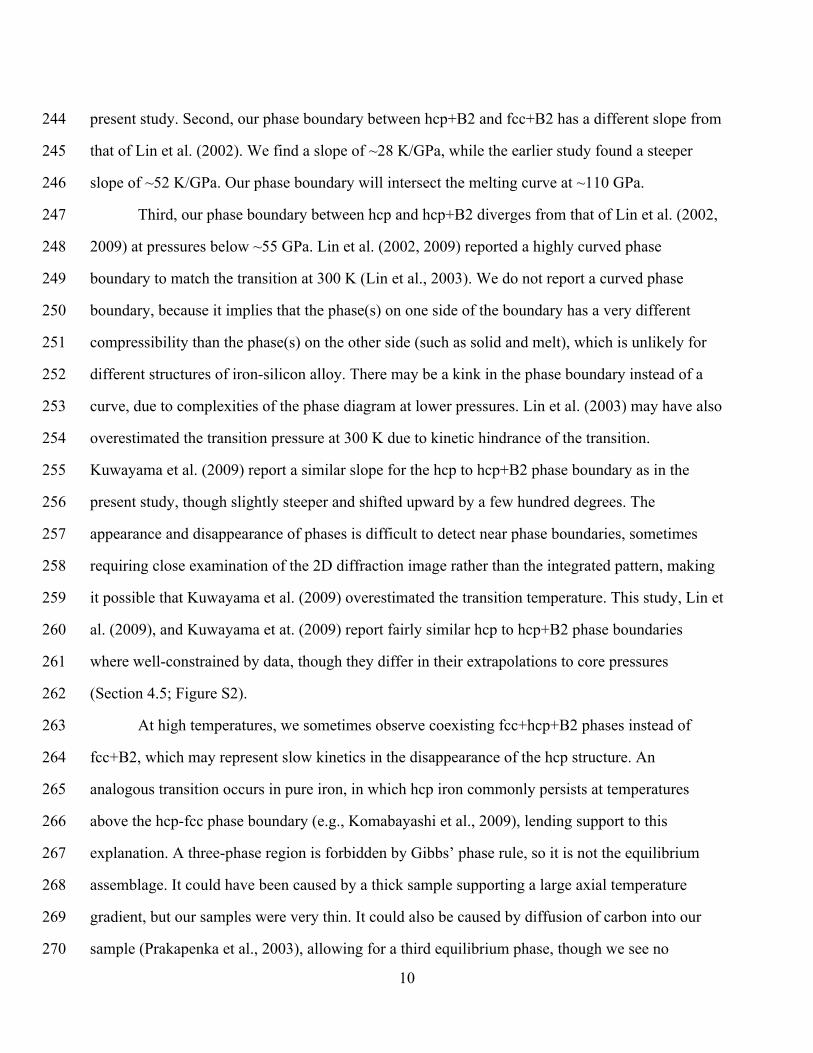
room temperature compression, possibly because it is an ordered version of the bcc structure, and 230
the diffraction peaks indicating this ordering are small and difficult to detect (Fischer et al., 2012). 231
While we observed this structure to 29 GPa at room temperature, other studies reported a gradual 232
transition to the hcp structure beginning at 16 GPa (Hirao et al., 2004; Lin et al., 2003). This 233
difference may be due to slow kinetics at room temperature, with an even more sluggish 234
transformation expected under the more hydrostatic conditions used in the present study. Due to 235
this kinetic effect, we were unable to constrain the P-T conditions under which the D03 structure is 236
the equilibrium phase. 237
Silicon partitions between coexisting phases, as discussed in Section 4.4 and in previous 238
studies (Kuwayama et al., 2009; Lin et al., 2002). Our phase diagram is generally consistent with 239
those reported by Lin et al. (2002, 2009) and Kuwayama et al. (2009) for Fe-7.9Si and Fe-9.9Si, 240
respectively, but with several minor differences. First, we observe the B2 structure at high P-T 241
conditions where Lin et al. (2002, 2009) reported the bcc structure. It may be technological 242
advances in sample preparation and data analysis that permitted the detection of B2 ordering in the 243
Page 10
10
present study. Second, our phase boundary between hcp+B2 and fcc+B2 has a different slope from 244
that of Lin et al. (2002). We find a slope of ~28 K/GPa, while the earlier study found a steeper 245
slope of ~52 K/GPa. Our phase boundary will intersect the melting curve at ~110 GPa. 246
Third, our phase boundary between hcp and hcp+B2 diverges from that of Lin et al. (2002, 247
2009) at pressures below ~55 GPa. Lin et al. (2002, 2009) reported a highly curved phase 248
boundary to match the transition at 300 K (Lin et al., 2003). We do not report a curved phase 249
boundary, because it implies that the phase(s) on one side of the boundary has a very different 250
compressibility than the phase(s) on the other side (such as solid and melt), which is unlikely for 251
different structures of iron-silicon alloy. There may be a kink in the phase boundary instead of a 252
curve, due to complexities of the phase diagram at lower pressures. Lin et al. (2003) may have also 253
overestimated the transition pressure at 300 K due to kinetic hindrance of the transition. 254
Kuwayama et al. (2009) report a similar slope for the hcp to hcp+B2 phase boundary as in the 255
present study, though slightly steeper and shifted upward by a few hundred degrees. The 256
appearance and disappearance of phases is difficult to detect near phase boundaries, sometimes 257
requiring close examination of the 2D diffraction image rather than the integrated pattern, making 258
it possible that Kuwayama et al. (2009) overestimated the transition temperature. This study, Lin et 259
al. (2009), and Kuwayama et at. (2009) report fairly similar hcp to hcp+B2 phase boundaries 260
where well-constrained by data, though they differ in their extrapolations to core pressures 261
(Section 4.5; Figure S2). 262
At high temperatures, we sometimes observe coexisting fcc+hcp+B2 phases instead of 263
fcc+B2, which may represent slow kinetics in the disappearance of the hcp structure. An 264
analogous transition occurs in pure iron, in which hcp iron commonly persists at temperatures 265
above the hcp-fcc phase boundary (e.g., Komabayashi et al., 2009), lending support to this 266
explanation. A three-phase region is forbidden by Gibbs’ phase rule, so it is not the equilibrium 267
assemblage. It could have been caused by a thick sample supporting a large axial temperature 268
gradient, but our samples were very thin. It could also be caused by diffusion of carbon into our 269
sample (Prakapenka et al., 2003), allowing for a third equilibrium phase, though we see no 270
Page 11
11
evidence of carbides in our diffraction patterns. An identical three-phase assemblage was seen by 271
Lin et al. (2002) in an alloy of similar composition, suggesting a problem with kinetics rather than 272
sample preparation. Furthermore, in Fischer et al. (2012), we performed identical experiments on 273
Fe-16Si, and saw no effects of temperature gradients in crossing the hcp+B2 to D03 phase 274
boundary, again suggesting a kinetic problem in this case. The hcp diffraction peaks rapidly decay 275
in intensity after crossing into the fcc+B2 field (Figure 3). 276
277
4.2. Fe-9Si melting 278
The high pressure melting curve of Fe-9Si is illustrated in Figure 6. There is good 279
agreement between data obtained from diffuse scattering and from laser power-temperature 280
discontinuities. To extrapolate the melting curve, we fit the data to the Simon equation, Tm = 281
Tref([Pm-Pref]/a + 1)1/c, where Tm and Pm are the temperature and pressure of melting; Tref and Pref 282
are a reference temperature and pressure of melting, set equal to the melting point at one bar; and a 283
and c are fitted parameters (Simon and Glatzel, 1929). We fit both the data obtained by the laser 284
power-temperature method and by the diffuse scattering method, averaging each set of upper and 285
lower bounds. Using an unweighted least squares routine, we find a = 23.6 and c = 1.89. The 286
Simon equation fit to our data is shown in Figure 6. 287
Kuwayama and Hirose (2004) measured melting in the Fe-FeSi system at 21 GPa, 288
including experiments on Fe-10Si that agree with our results on Fe-9Si (Figure 6). Morard et al. 289
(2011) bracketed melting points of Fe-5Ni-10Si using X-ray diffuse scattering at 34 GPa and 52 290
GPa (Figure 6), also consistent with our results. In some cases we could identify which solid phase 291
coexisted with the melt (the liquidus phase) in Fe-9Si (Supplemental Table S2). At pressures of 20 292
to 63 GPa, the liquidus phase has the fcc structure, while from 74 to 101 GPa, it has the B2 293
structure. 294
295
4.3. FeSi phase diagram 296
This study represents the highest pressure to which FeSi has been investigated with in situ 297
Page 12
12
X-ray diffraction in a laser-heated diamond anvil cell. Therefore, the present study more accurately 298
reflects the equilibrium phase assemblage of FeSi than previous studies, in which samples were 299
quenched from high temperatures (Lord et al., 2010), or from both high temperatures and pressures 300
(Dobson et al., 2002), or were only compressed at 300 K (Dobson et al., 2003; Ono et al., 2007; 301
Sata et al., 2010). 302
We observed the B20 structure in FeSi to at least 36 GPa at room temperature, but this may 303
not accurately represent its stability field due to slow transition kinetics at 300 K. In our lowest 304
pressure laser-heating experiments (~14 GPa), we observed a B2+B20 mixture over all 305
temperatures investigated, with this mixture stable to ~42 GPa at high temperatures. This is 306
consistent with many, but not all, earlier data on the FeSi phase diagram, in which a B2+B20 307
mixture was often quenched (Dobson et al., 2002; Lord et al., 2010). While this earlier data was 308
usually interpreted as a back-conversion from the B2 structure to the B20 structure upon quench or 309
polishing (Dobson et al., 2002), our results demonstrate that a wide two-phase loop exists in the 310
FeSi phase diagram. We observe coexisting phases over an extensive pressure-temperature range, 311
and our samples were sufficiently thin that the observation of two phases cannot be attributed to 312
temperature gradients within the sample. The two-phase assemblage was seen in seven distinct 313
heating and cooling cycles on multiple samples. Relative proportions of the two phases change 314
across this region, with X-ray diffraction patterns dominated by B20 peaks at lower pressures and 315
by B2 peaks as the pressure approached 42 GPa (e.g., Figure 5), consistent with a two-phase loop. 316
Frequently one phase was only visible in the 2D diffraction image as a few faint reflections, too 317
weak to appear in the integrated pattern. This may explain why earlier studies (Dobson et al., 2002, 318
2003; Lord et al., 2010) sometimes report only one phase in this region of P-T space. 319
At higher pressures, FeSi converts to the B2 structure only (Figure 1d), as reported in 320
previous experimental studies (Dobson et al., 2002, 2003; Lord et al., 2010) and predicted 321
theoretically (Vo!adlo et al., 1999). We did not cross this phase boundary in any heating cycle, so 322
it must be very steep (slope of greater than approximately ±180 K/GPa) and located at ~40-43 323
GPa, notably steeper and at a higher pressure than previously reported for a direct B20-to-B2 324
Page 13
13
transition (Lord et al., 2010). FeSi has the B2 structure to at least ~145 GPa, the highest pressure 325
reached for this composition, in agreement with calculations (Brosh et al., 2009; Zhang and 326
Oganov, 2010). We have extended the subsolidus phase diagram to higher pressures than previous 327
high-temperature experimental studies, which reached maximum pressures of 35-40 GPa (Dobson 328
et al., 2003; Lord et al., 2010). Lin et al. (2003) performed a single laser-heating X-ray diffraction 329
experiment on FeSi at 2219 K and 54 GPa and reported the B20 structure, which is inconsistent 330
with our results and with other experimental studies (Dobson et al., 2002; Lord et al., 2010). 331
We performed one melting experiment on FeSi at ~80 GPa, finding agreement with the 332
melting curve of Lord et al. (2010) (Figure 1d), which was based on discontinuities between laser 333
power and temperature. However, the melting curve of Santamaría-Pérez and Boehler (2008), 334
based on changes in sample texture determined by shining a laser on the sample, lies ~500 K 335
lower. This lower melting curve conflicts with our result at 80 GPa and some of our experiments at 336
lower pressures (e.g., at ~24 GPa), in which we reached temperatures above the melting curve of 337
Santamaría-Pérez and Boehler (2008) but did not observe melting. 338
339
4.4. Phase diagrams in the Fe-FeSi system 340
Figure 1 illustrates pressure-temperature phase diagrams in the Fe-FeSi system with 341
varying silicon contents. The addition of Si stabilizes B2 and related structures in the Fe-FeSi 342
system, whereas increasing pressure promotes stability of the hcp structure. This suggests that at 343
pressures higher than those achieved in Fischer et al. (2012) and the present study, Fe-16Si and 344
FeSi might eventually also transform to the hcp structure. The fcc structure was only observed in 345
two-phase fields in Fe-FeSi alloys, and only those with low silicon contents (Asanuma et al., 2008; 346
Figure 1b). Ordered versions of the bcc structure (D03 and B2) are stable to high pressures in Fe-347
16Si and FeSi (Fischer et al., 2012) (Figure 1c and d). The appearance of the D03 structure only in 348
the Fe-16Si phase diagram at high pressures and temperatures may be due to its composition, 349
which is very close to Fe3Si, having the preferred stoichiometry of the D03 structure. The B20 350
structure appears only in the phase diagram of FeSi, again likely driven by the stoichiometry of 351
Page 14
14
this composition. 352
Figure 7 shows a series of temperature-composition (T-X) phase diagrams at 50, 80, 125, 353
and 145 GPa, based on the compilation of this study with earlier subsolidus phase diagrams of iron 354
(Komabayashi and Fei, 2010) and Fe-16Si (Fischer et al., 2012). Most of the compositions of triple 355
points shown in Figure 7 are estimated but are bracketed by the available data. Data from 356
Asanuma et al. (2008) on Fe-3.4Si are shown, but are incompatible with the constraints imposed 357
by other studies. Therefore, in constructing T-X plots we do not match the temperatures reported 358
by Asanuma et al. (2008), only the structures they report as stable at 3.4 wt% silicon. Experiments 359
by Asanuma et al. (2008) likely suffered from large temperature gradients, since the laser-heated 360
spot was similar in size to the X-ray beam. With large temperature gradients and the persistence of 361
the hcp phase outside of equilibrium (such as in the Fe-9Si phase diagram), Asanuma et al. (2008) 362
may have reported coexisting fcc+hcp phases over a wider temperature range than the mixture 363
would occupy at equilibrium. This is supported by Brosh et al. (2009), who were also unable to fit 364
the data of Asanuma et al. (2008) in their thermodynamic modeling of the Fe-FeSi system. 365
Subsolidus data on Fe-Si-Ni alloys are not included in Figure 7 (e.g., Morard et al., 2011; Sakai et 366
al., 2011) due to uncertain and inconsistent effects of Ni on the crystal structures of these alloys. 367
Melting points for Fe (Ma et al., 2004); Fe-10Si-5Ni and Fe-15Si-5Ni (Morard et al., 368
2011); Fe-16Si (Fischer et al., 2012); Fe-18Si (Asanuma et al., 2010); and FeSi (Lord et al., 2010) 369
are also shown in Figure 7. The melting curve of pure iron predicted by our T-X phase diagrams is 370
similar to or slightly higher than that reported by Ma et al. (2004), but is compatible within 371
uncertainty. 372
The melting temperatures that we report for Fe-9Si and Fe-16Si most likely represent 373
solidus temperatures, since the appearance of diffuse scattering probably coincides with the first 374
appearance of melt. As shown in Figure 7, the melting points of Fe, Fe-9Si, Fe-10Si-5Ni, Fe-15Si-375
5Ni, Fe-16Si, and Fe-18Si are indistinguishable within uncertainty up to 80 GPa, in contrast to the 376
conclusions of Morard et al. (2011) (also see Figure S3). This suggests that silicon does not 377
strongly depress the melting point of iron, and that low concentrations of nickel also have no 378
Page 15
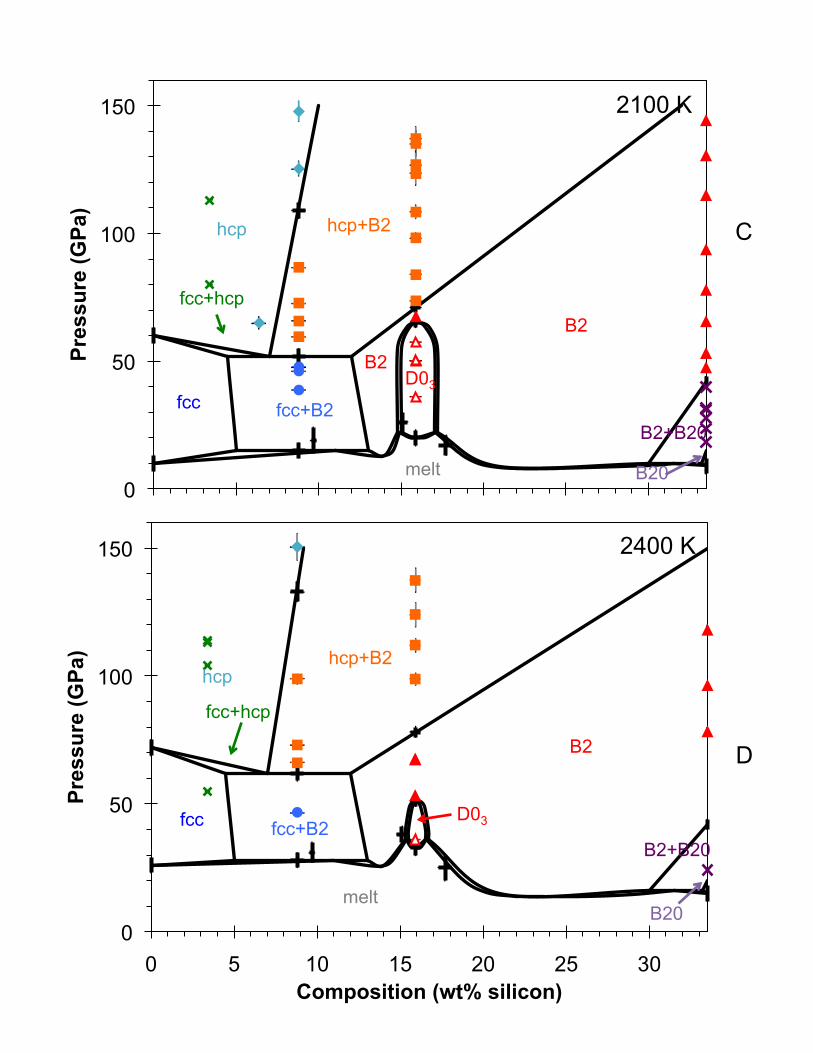
15
detectable effect. The melting point of FeSi (Lord et al., 2010) is higher than those of the other 379
alloys at lower pressures, but is more similar by 125 GPa (Figure 7d). This necessitates a narrow 380
phase loop on the iron-rich side of the eutectic, and a fairly narrow phase loop on the FeSi side that 381
shrinks with increasing pressure. However, this interpretation depends on the melting curve of iron 382
chosen as the basis for comparison. 383
At 50 GPa, the fcc-B2 eutectic lies between 9 and 16 wt% silicon (Figure 7a), based on the 384
observed structures of the liquidus phases (Si-poor fcc phase for Fe-9Si; Si-rich B2 for Fe-16Si). 385
By 80 GPa, the eutectic has shifted to less than 9 wt% Si, while the fcc+B2 field has shrunk to a 386
narrow region just below the melting point. By 125 GPa, the fcc phase disappears. The eutectic at 387
125 GPa is between the hcp and B2 phases, located somewhere lower than 16 wt% silicon. The 388
hcp+B2 field exists at all pressures shown in Figure 7 and expands with increasing pressure. At 50 389
GPa, the D03 structure is stable near stoichiometric Fe3Si. Figure 7a depicts this region as not 390
converging with higher temperature phase boundaries, allowing for a single B2 field surrounding 391
it. This type of topology in T-X phase diagrams involving ordering transitions occurs in other 392
systems at 1 bar, such as the Fe-Pt and Co-Pt systems (Massalski, 1986). It is also possible that the 393
D03 region lies tangent to the fcc+B2 field, creating two distinct B2 fields at lower pressures. The 394
ordered region shrinks to lower temperatures with increasing pressure as the D03 structure is 395
replaced by the less ordered B2 structure at high temperatures, and is gone from the phase diagram 396
by 80 GPa. Kuwayama and Hirose (2004) reported the existence of a phase with 25.1 wt% silicon 397
at 21 GPa, corresponding to stoichiometric Fe3Si2. However, we do not have data near this 398
composition to evaluate its stability at these higher pressures, so we do not include it in our phase 399
diagrams. Further in situ work is needed to clarify that part of the phase diagram at pressures 400
below 50 GPa. Figure 7 illustrates that phase diagrams of iron-silicon alloys contain fewer phases 401
at higher pressures. We only report the hcp and B2 structures at 125 and 145 GPa, though other 402
structures may exist at other compositions. 403
Figure 8 shows a series of pressure-composition (P-X) phase diagrams at 1500, 1800, 2100, 404
and 2400 K, based on the same datasets shown in Figure 7, with one bar phase relations from 405
Page 16
16
Massalski (1986). As in Figure 7, data from Asanuma et al. (2008) are shown but conflict with the 406
other datasets. While we do predict an fcc+hcp field at 3.4 wt% silicon, it does not generally match 407
the pressures (or equivalently, temperatures) of that study’s data. We also include data from 408
Kuwayama et al. (2009) on Fe-6.4Si, which are consistent with our data. Morard et al. (2011) 409
performed a crossing of the hcp+B2 to fcc+B2 boundary in Fe-5Ni-10Si and found a transition at 410
~50 GPa and 2150 K, in agreement with our results (Figures 1b, 7a, 8c). 411
The bcc structure is stable only in a thin lens-shaped field near one bar at 1500 K. At 1800 412
K, this field has shrunk towards the iron-rich, 1 bar corner of the phase diagram, disappearing by 413
2100 K. The Fe2Si structure is only stable at low pressures and at 1500 K. As in the T-X plots of 414
Figure 7, the D03 structure is stable over a narrow compositional range but more extended pressure 415
range. Though the width of this field is not precisely constrained, it becomes stable over a smaller 416
pressure range with increasing temperature. As mentioned above, the range of P-T-X stability of 417
the Fe3Si2 phase discovered by Kuwayama and Hirose (2004) remains uncertain, so this phase is 418
not included in Figure 8. 419
The composition of the fcc-hcp-B2 triple point (where the hcp+B2, fcc+hcp, and fcc+B2 420
fields meet) is only constrained by the available data to fall between 3.4 and 8.8 wt% silicon, so 421
the composition of this triple point is set at 7 wt% Si in Figure 8. For this case, the hcp+B2 field 422
expands with increasing temperature. The hcp to hcp+B2 and the hcp+B2 to B2 phase boundaries 423
both have positive slopes in P-X space at all temperatures. When extrapolated to higher pressures, 424
Figure 8 illustrates that alloys containing more silicon than the triple point composition will exist 425
as an hcp+B2 mixture then transform to a pure hcp structure with increasing pressure. This is seen 426
in Fe-9Si at 1500 K and 1800 K (Figure 8a and b). Conversion from an hcp+B2 mixture to the hcp 427
structure with increasing pressure was predicted for Fe-16Si (Fischer et al., 2012), but the P-X 428
phase diagrams illustrate that this series of transitions should occur for a wide compositional range 429
of Fe-Si alloys extending from ~4-8 wt% silicon, possibly to FeSi or even more silicon-rich alloys 430
at sufficiently high pressures. 431
Kuwayama et al. (2009) produced a P-X phase diagram in the Fe-FeSi system at 2100 K. 432
Page 17
17
They report an hcp+B2 region with a compositional gap of only 3 wt% silicon based on 433
microprobe analysis of a recovered sample from 61 GPa, but our observation of hcp+B2 mixtures 434
in both Fe-9Si and Fe-16Si requires that the two-phase loop be wider than this (Figure 8c). This 435
minor discrepancy could be due to Kuwayama et al. (2009) probing an activation volume within 436
their sample that was larger than its grain size, so that their compositional determination for each 437
phase included some averaging over both phases. 438
Brosh et al. (2009) calculated a P-X phase diagram in the Fe-FeSi system at 300 K. Their 439
results are in approximate agreement with our findings, though they do not differentiate between 440
different bcc-like structures (bcc, B2, D03). They predict a very wide hcp+B2 compositional gap, 441
extending all the way to FeSi by ~130 GPa, which is not incompatible with our phase diagram. 442
However, they draw an hcp to hcp+B2 boundary whose slope has the opposite sign from ours, 443
where our slope is constrained by data at Fe-9Si and knowledge of the fcc-hcp-B2 triple point 444
location. 445
446
4.5. Iron-silicon alloys in the Earth 447
It has been proposed that FeSi occurs in the Earth’s D˝ layer, either as a reaction product 448
between silicates and the outer core (Knittle and Jeanloz, 1991), or as an exsolution product of the 449
outer core formed during secular cooling (Buffett et al., 2000). Recovered B2-FeSi is an electrical 450
conductor at 1 bar (Dobson et al., 2002), so Dubrovinsky et al. (2003) proposed that B2-FeSi could 451
explain the electrically conductive layer at the base of Earth’s mantle (e.g., Buffett, 1992). Based 452
on our phase diagram (Figure 1c), FeSi at these pressures should have the B2 structure. Since our 453
melting data are consistent with those of Lord et al. (2010), we similarly conclude that solid FeSi 454
could be stable within some region of the D˝ layer, with the thickness and depth of this region 455
depending on the thermal structure of the D˝ layer. 456
The melting curve of Fe-9Si can be used to constrain core temperatures, for a core of this 457
composition. Using the Simon equation parameterization, we can extrapolate to melting at core-458
mantle boundary (CMB) conditions (136 GPa), finding a melting point of 4380 K. This is a 459
Page 18
18
minimum core temperature, if the outer core is Fe-9Si alloy. There may be a kink in the melting 460
curve where it intersects the hcp+B2 to fcc+B2 phase boundary at ~110 GPa; this would raise the 461
melting temperature at 136 GPa. We can also extrapolate the melting curve of Fe-9Si to the inner 462
core boundary (329 GPa), finding a temperature of 6650 K. However, this calculation requires 463
very large extrapolations in pressure and temperature, and neglects phase transitions in the solid 464
that could change the melting curve. 465
Silicon is relatively inefficient at depressing the melting point of iron-rich alloys at core 466
pressures (Figures 7 and S3). The light element in Earth’s core is thought to depress the melting 467
point by ~700-1100 K at core conditions (Anderson, 1998), but our results show that silicon may 468
be a poor candidate for this. The melting point of Fe-FeSi alloys is no more than ~200 K less than 469
that of pure iron (Ma et al., 2004) at 70-80 GPa, for example. This is less than the ~500 K melting 470
point depression in the Fe-FeO system (Fischer and Campbell, 2010; Seagle et al., 2008) and the 471
1000-1100 K depression in the Fe-S system (Campbell et al., 2007) at similar pressures relative to 472
the iron melting curve of Ma et al. (2004). Comparing to a different melting curve of iron changes 473
these numbers (Figure S3), but does not change the relative differences in melting point depression 474
for these various elements. An Fe-Si core would therefore require higher temperatures than an Fe-475
S or Fe-O core. The melting curve of Fe-9Si is also much steeper than the slope of the iron-sulfide 476
eutectic (Campbell et al., 2007), and somewhat steeper than that of the Fe-FeO eutectic (Seagle et 477
al., 2008), so an Fe-Si core would crystallize more slowly and drive compositional convection less 478
efficiently for a given cooling rate. 479
Our phase diagrams in the Fe-FeSi system can be used to determine which phases are 480
stable in the Earth’s core. Figure 7d illustrates a T-X phase diagram near core-mantle boundary 481
pressures. It shows that for a compositional range spanning at least 9 to 16 wt% Si, an hcp+B2 482
mixture is the stable assemblage at temperatures near melting in the outer core. We find 483
approximately the same slope for the hcp to hcp+B2 phase boundary as Lin et al. (2009) and 484
Kuwayama et al. (2009) (Figure S2), though our denser P-T coverage resolves a slight curvature of 485
the phase boundary at high pressures. Extrapolating these phase boundaries to 329 GPa, Fe-9Si 486
Page 19
19
will exist as a mixture of hcp and B2 phases for an inner core boundary temperature greater than 487
~3500 K (Figure S2), whereas the phase boundaries of Lin et al. (2009) and Kuwayama et al. 488
(2009) require higher temperatures for the B2 phase to be stable. However, there is a high degree 489
of uncertainty inherent to such large extrapolations of phase diagrams. At temperatures closer to 490
6650 K, the phase loop is much wider, and an inner core alloy containing 6-8 wt% Si (Brosh et al., 491
2009; Fischer et al., 2012) or less will also exist as an hcp+B2 mixture at inner core pressures, in 492
agreement with the results of Brosh et al. (2009) and Dubrovinsky et al. (2003). The possibility of 493
a two-phase mixture in Earth’s inner core should motivate future studies on the thermal evolution, 494
geodynamics, and anisotropy of a heterogeneous core. For example, an iron-rich alloy may begin 495
crystallizing as an hcp+B2 mixture, but evolve to crystallize a pure hcp structure as secular cooling 496
proceeds, depending on the composition, thermal history, and temperature structure of the core. 497
This could relate to layered anisotropy variations in the inner core (e.g., Deguen, 2012; Mattesini 498
et al., 2010). 499
The effect of nickel on the melting point of Fe-Si alloys appears negligible within the 500
resolution of our data and that of Morard et al. (2011) (Figures 6, 7, and 8). Effects of nickel on the 501
crystal structures of iron-silicon alloys are unclear (e.g., Kuwayama et al., 2008), but recent studies 502
suggest that Fe-Si alloys with ~5-10 wt% nickel have the hcp structure at inner core pressures and 503
room temperature (Asanuma et al., 2011; Sakai et al., 2011). Further study on Fe-Ni-Si alloys at 504
high pressures and temperatures is needed to clarify effects of nickel on the phase diagram at inner 505
core conditions. 506
507
508
5. Conclusions 509
The pressure-temperature phase diagrams of Fe-9Si and stoichiometric FeSi have been 510
determined to high temperatures and pressures using synchrotron X-ray diffraction. The phase 511
diagram of Fe-9Si reported here is similar to those of prior studies (Kuwayama et al., 2009; Lin et 512
al., 2002), although a melting curve had not previously been determined for this composition. The 513
Page 20
20
Fe-9Si phase diagram also includes the B2 crystal structure, representing a higher degree of 514
ordering than the bcc structure reported previously (Lin et al., 2002, 2009). In situ study of the B20 515
to B2 phase transition in FeSi shows a wide two-phase region where these structures coexist, 516
completely converting to the B2 structure at higher pressures. At the highest pressures reached in 517
this study, Fe-FeSi phase diagrams become simpler, containing only the hcp and B2 structures. 518
Alloys containing more than ~4-8 wt% silicon will convert to an hcp+B2 mixture, and later to the 519
hcp structure, with increasing pressure. For a postulated Earth's core comprised of Fe-Si alloy, 520
4380 K is a minimum outer core temperature, based on the eutectic melting point of Fe-9Si. 521
Melting temperatures of Fe-FeSi alloys are very similar at core conditions, indicating that silicon is 522
inefficient at depressing the melting point of iron. For Fe-Si alloys with plausible inner core 523
compositions, our phase diagrams suggest the stability of an hcp+B2 mixture under P-T conditions 524
of the Earth’s inner core. 525
526
527
References 528
Alfè, D., Gillan, M.J., Price, G.D., 2002. Composition and temperature of the Earth’s core 529
constrained by combining ab initio calculations and seismic data. Earth Planet. Sci. Lett. 195, 530
91-98. 531
Allègre, C.J., Poirier, J.-P., Humler, E., Hofmann, A.W., 1995. The chemical composition of the 532
Earth. Earth Planet. Sci. Lett. 134, 515-526. 533
Anderson, O.L., 1998. The Grüneisen parameter for iron at outer core conditions and the resulting 534
conductive heat and power in the core. Phys. Earth Planet. Inter. 109, 179-197. 535
Antonangeli, D., Siebert, J., Badro, J., Farber, D.L., Fiquet, G., Morard, G., Ryerson, F.J., 2010. 536
Composition of the Earth’s inner core from high-pressure sound velocity measurements in Fe-537
Ni-Si alloys. Earth Planet. Sci. Lett. 295, 292-296. 538
Asanuma, H., Ohtani, E., Sakai, T., Terasaki, H., Kamada, S., Hirao, N., Sata, N., Ohishi, Y., 539
2008. Phase relations of Fe-Si alloy up to core conditions: Implications for the Earth inner 540
Page 21
21
core. Geophys. Res. Lett. 35, L12307. 541
Asanuma, H., Ohtani, E., Sakai, T., Terasaki, H., Kamada, S., Kondo, T., Kikegawa, T., 2010. 542
Melting of iron-silicon alloy up to the core-mantle boundary pressure: Implications to the 543
thermal structure of the Earth’s core. Phys. Chem. Minerals 37, 353-359. 544
Asanuma, H., Ohtani, E., Sakai, T., Terasaki, H., Kamada, S., Hirao, N., Ohishi, Y., 2011. Static 545
compression of Fe0.83Ni0.09Si0.08 alloy to 374 GPa and Fe0.93Si0.07 alloy to 252 GPa: 546
Implications for the Earth’s inner core. Earth Planet. Sci. Lett. 310, 113-118. 547
Balchan, A.S., Cowen, G.R., 1966. Shock compression of two iron-silicon alloys to 2.7 megabars. 548
J. Geophys. Res. 71, 3577-3588. 549
Birch, F., 1952. Elasticity and constitution of the Earth’s interior. J. Geophys. Res. 37, 227-286. 550
Brosh, E., Makov, G., Shneck, R.Z., 2009. Thermodynamic analysis of high-pressure phase 551
equilibria in Fe-Si alloys, implications for the inner-core. Phys. Earth Planet. Inter. 172, 289-552
298. 553
Buffett, B.A., 1992. Constraints on magnetic energy and mantle conductivity from the forced 554
nutations of the Earth. J. Geophys. Res. 97, 19581-19597. 555
Buffett, B.A., Garnero, E.J., Jeanloz, R., 2000. Sediments at the top of Earth’s core. Science 17, 556
1338-1342. 557
Campbell, A.J., Seagle, C.T., Heinz, D.L. ,Shen, G., Prakapenka, V.B., 2007. Partial melting in the 558
iron-sulfur system at high pressure: A synchrotron X-ray diffraction study. Phys. Earth Planet. 559
Inter. 162, 119-128. 560
Campbell, A.J., Danielson, L., Righter, K., Seagle, C.T., Wang, Y., Prakapenka, V.B., 2009. High 561
pressure effects on the iron-iron oxide and nickel-nickel oxide oxygen fugacity buffers. Earth 562
Planet. Sci. Lett. 286, 556-564. 563
Campbell, A.J., Fischer, R.A., Prakapenka, V.B., in preparation. Equation of state of potassium 564
bromide: Applications to pressure calibration in laser-heated diamond anvil cell experiments. 565
Caracas, R., Wentzcovitch, R., 2004. Equation of state and elasticity of FeSi. Geophys. Res. Lett. 566
31, L20603. 567
Page 22
22
Côté, A.S., Vo!adlo, L., Dobson, D.P., Alfè, D., Brodholt, J.P., 2010. Ab initio lattice dynamics 568
calculations on the combined effect of temperature and silicon on the stability of different iron 569
phases in the Earth’s inner core. Phys. Earth Planet. Inter. 178, 2-7. 570
Deguen, R., 2012. Structure and dynamics of Earth’s inner core. Earth Planet. Sci. Lett. 333-334, 571
211-225. 572
Dewaele, A., Loubeyre, P., Occelli, F., Mezouar, M., Dorogokupets, P.I., Torrent, M., 2006. 573
Quasihydrostatic equation of state of iron above 2 Mbar. Phys. Rev. Lett. 97, 215504. 574
Dewaele, A., Mezouar, M., Guignot, N., Loubeyre, P., 2007. Melting of lead under high pressure 575
studied using second-scale time-resolved x-ray diffraction. Phys. Rev. B 76, 144106. 576
Dobson, D.P., Vo!adlo, L., Wood, I.G., 2002. A new high-pressure phase of FeSi. Am. Mineral. 577
87, 784-787. 578
Dobson, D.P., Crichton, W.A., Bouvier, P., Vo!adlo, L., Wood, I.G., 2003. The equation of state 579
of CsCl-structured FeSi to 40 GPa: Implications for silicon in the Earth’s core. Geophys. Res. 580
Lett. 30, 1014. 581
Dubrovinsky, L., Dubrovinskaia, N., Langenhorst, F., Dobson, D., Rubie, D., Gessmann, C., 582
Abrikosov, I.A., Johansson, B., Baykov, V.I., Vitos, L., Le Bihan, T., Crichton, W.A., 583
Dmitriev, V., Weber, H.-P., 2003. Iron-silica interaction at extreme conditions and the 584
electrically conducting layer at the base of Earth’s mantle. Nature 422, 58-61. 585
Fei, Y., Ricolleau, A., Frank, M., Mibe, K., Shen, G., Prakapenka, V., 2007. Toward an internally 586
consistent pressure scale. Proc. Natl. Acad. Sci. U.S.A. 104, 9182-9186. 587
Fischer, R.A., Campbell, A.J., 2010. High-pressure melting of wüstite. Am. Mineral. 95, 1473-588
1477. 589
Fischer, R.A., Campbell, A.J., Shofner, G.A., Lord, O.T., Dera, P., Prakapenka, V.B., 2011. 590
Equation of state and phase diagram of FeO. Earth Planet. Sci. Lett. 304, 496-502. 591
Fischer, R.A., Campbell, A.J., Caracas, R., Reaman, D.M., Dera, P., Prakapenka, V.B., 2012. 592
Equation of state and phase diagram of Fe-16Si alloy as a candidate component of Earth’s 593
core. Earth Planet. Sci. Lett. 357-358, 268-276. 594
Page 23
23
Guyot, F., Zhang, J., Martinez, I., Matas, J., Ricard, Y., Javoy, M., 1997. P-V-T measurements of 595
iron silicide ($-FeSi): Implications for silicate-metal interactions in the early Earth. Eur. J. 596
Mineral. 9, 277-285. 597
Hammersley, A.P., Svensson, S.O., Hanfland, M., Fitch, A.N., Hausermann, D., 1996. Two-598
dimensional detector software: From real detector to idealized image or two-theta scan. High 599
Press. Res. 14, 235-248. 600
Hirao, N., Ohtani, E., Kondo, T., Kikegawa, T., 2004. Equation of state of iron-silicon alloys to 601
megabar pressure. Phys. Chem. Minerals 31, 329-336. 602
Javoy, M., Kaminski, E., Guyot, F., Andrault, D., Sanloup, C., Moreira, M., Labrosse, S., Jambon, 603
A., Agrinier, P., Davaille, A., Jaupart, C., 2010. The chemical composition of the Earth: 604
Enstatite chondrite models. Earth Planet. Sci. Lett. 293, 259-268. 605
Knittle, E., Jeanloz, R., 1991. Earth’s core-mantle boundary: Results of experiments at high 606
pressures and temperatures. Science 251, 1438-1443. 607
Knittle, E., Williams, Q., 1995. Static compression of $-FeSi and an evaluation of reduced silicon 608
as a deep Earth constituent. Geophys. Res. Lett. 22, 445-448. 609
Komabayashi, T., Fei, Y., Meng, Y., Prakapenka, V., 2009. In-situ X-ray diffraction measurements 610
of the #-$ transition boundary of iron in an internally-heated diamond anvil cell. Earth Planet. 611
Sci. Lett. 282, 252-257. 612
Komabayashi, T., Fei, Y., 2010. Internally consistent thermodynamic database for iron to the 613
Earth’s core conditions. J. Geophys. Res. 115, B03202. 614
Kunz, M., MacDowell, A.A., Caldwell, W.A., Cambie, D., Celestre, R.S., Domning, E.E., Duarte, 615
R.M., Gleason, A.E., Glossinger, J.M., Kelez, N., Plate, D.W., Yu, T., Zaug, J.M., Padmore, 616
H.W., Jeanloz, R., Alivisatos, A.P., Clark, S.M., 2005. A beamline for high-pressure studies at 617
the Advanced Light Source with a superconducting bending magnet as the source. J. 618
Synchrotron Rad. 12, 650-658. 619
Kuwayama,Y., Hirose, K., 2004. Phase relations in the system Fe-FeSi at 21 GPa. Am. Mineral. 620
89, 273-276. 621
Page 24
24
Kuwayama, Y., Hirose, K., Sata, N., Ohishi, Y., 2008. Phase relations of iron and iron-nickel 622
alloys up to 300 GPa: Implications for composition and structure of the Earth’s inner core. 623
Earth Planet. Sci. Lett. 273, 379-385. 624
Kuwayama, Y., Sawai, T., Hirose, K., Sata, N., Ohishi, Y., 2009. Phase relations of iron-silicon 625
alloys at high pressure and high temperature. Phys. Chem. Minerals 36, 511-518. 626
Lin, J.-F., Heinz, D.L., Campbell, A.J., Devine, J.M., Shen, G., 2002. Iron-silicon alloy in Earth’s 627
core? Science 295, 313-315. 628
Lin, J.-F., Campbell, A.J., Heinz, D.L., Shen, G., 2003. Static compression of iron-silicon alloys: 629
Implications for silicon in the Earth’s core. J. Geophys. Res. 108, 2045. 630
Lin, J.-F., Scott, H.P., Fischer, R.A., Chang, Y.-Y., Kantor, I., Prakapenka, V.B., 2009. Phase 631
relations of Fe-Si alloy in Earth’s core. Geophys. Res. Lett. 36, L06306. 632
Lord, O.T., Walter, M.J., Dobson, D.P., Armstrong, L., Clark, S.M., Kleppe, A., 2010. The FeSi 633
phase diagram to 150 GPa. J. Geophys. Res. 115, B06208. 634
Ma, Y., Somayazulu, M., Shen, G., Mao, H.-k., Shu, J., Hemley, R.J., 2004. In situ X-ray 635
diffraction studies of iron to Earth-core conditions. Phys. Earth Planet. Inter. 143-144, 455-636
467. 637
Mao, H.K., Xu, J., Bell, P.M., 1986. Calibration of the ruby pressure gauge to 800 kbar under 638
quasi-hydrostatic conditions. J. Geophys. Res. 91, 4673-4676. 639
Massalski, T.B., 1986. Binary Alloy Phase Diagrams. American Society for Metals, Metals Park, 640
Ohio. 641
Mattesini, M., Belonoshko, A.B., Buforn, E., Ramírez, M., Simak, S.I., Udías, A., Mao, H.-K., 642
Ahuja, R., 2010. Hemispherical anisotropic patterns of the Earth’s inner core. Proc. Natl. Acad. 643
Sci. U.S.A. 107, 9507-9512. 644
McDonough, W.F., 2003. Compositional model for the Earth’s core. In: Carlson, R.W. (Ed.), 645
Treatise of Geochemistry, Vol. 2. Elsevier-Pergamon, Oxford, pp. 547-568. 646
Miller, N.A., 2009. Melting and phase relations in iron-silicon alloys with applications to the 647
Earth’s core. M.S. thesis, University of Maryland, College Park. 648
Page 25
25
Morard, G., Andrault, D., Guignot, N., Sanloup, C., Mazouar, M., Petitgirad, S., and Fiquet, G., 649
2008. In-situ determination of Fe-Fe3S phase diagram and liquid structural properties up to 65 650
GPa. Earth Planet. Sci. Lett. 272, 620-626. 651
Morard, G., Andrault, D., Guignot, N., Siebert, J., Garbarino, G., Antonangeli, D., 2011. Melting 652
of Fe-Ni-Si and Fe-Ni-S alloys at megabar pressures: Implications for the core-mantle 653
boundary temperature. Phys. Chem. Minerals 38, 767-776. 654
Ono, S., Kikegawa, T., Ohishi, Y., 2007. Equation of state of the high-pressure polymorph of FeSi 655
to 67 GPa. Eur. J. Mineral. 19, 183-187. 656
Poirier, J.P., 1994. Light elements in the Earth’s outer core: A critical review. Phys. Earth Planet. 657
Inter. 85, 319-337. 658
Prakapenka, V.B., Shen, G., Dubrovinsky, L.S., 2003. Carbon transport in diamond anvil cell. 659
High Temp. – High Press. 35/36, 237-249. 660
Prakapenka, V.B., Kuba, A., Kuznetsov, A., Laskin, A., Shkurikhin, O., Dera, P., Rivers, M.L., 661
Sutton, S.R., 2008. Advanced flat top laser heating system for high pressure research at 662
GSECARS: Application to the melting behavior of germanium. High Press. Res. 28, 225-235. 663
Ricolleau, A., Fei, Y., Corgne, A., Siebert, J., Badro, J., 2011. Oxygen and silicon contents of 664
Earth’s core from high pressure metal-silicate partitioning experiments. Earth Planet. Sci. Lett. 665
310, 409-421. 666
Ringwood, A.E., 1959. On the chemical evolution and densities of the planets. Geochim. 667
Cosmochim. Acta 15, 257-283. 668
Rivers, M., Prakapenka, V.B., Kubo, A., Pullins, C., Holl, C.M., Jacobsen, S.D., 2008. The 669
COMPRES/GSECARS gas-loading system for diamond anvil cells at the Advanced Photon 670
Source. High Press. Res. 28, 273-292. 671
Rubie, D.C., Frost, D.J., Mann, U., Asahara, Y., Nimmo, F., Tsuno, K., Kegler, P., Holzheid, A., 672
Palme, H., 2011. Heterogeneous accretion, composition and core-mantle differentiation of the 673
Earth. Earth Planet. Sci. Lett. 301, 31-42. 674
Sakai, T., Ohtani, E., Hirao, N., Ohishi, Y., 2011. Stability field of the hcp-structure for Fe, Fe-Ni, 675
Page 26
26
and Fe-Ni-Si alloys up to 3 Mbar. Geophys. Res. Lett. 38, L09302. 676
Santamaría-Pérez, D., Boehler, R., 2008. FeSi melting curve up to 70 GPa. Earth Planet. Sci. Lett. 677
265, 743-747. 678
Sata, N., Hirose, K., Shen, G., Nakajima, Y., Ohishi, Y., Hirao, N., 2010. Compression of FeSi, 679
Fe3C, Fe0.95O, and FeS under the core pressures and implication for light element in the Earth’s 680
core. J. Geophys. Res. 115, B09204. 681
Seagle, C.T., Heinz, D.L., Campbell, A.J., Prakapenka, V.B., Wanless, S.T., 2008. Melting and 682
thermal expansion in the Fe-FeO system at high pressure. Earth Planet. Sci. Lett. 265, 655-665. 683
Shahar, A., Ziegler, K., Young, E.D., Ricolleau, A., Schauble, E.A., Fei, Y., 2009. Experimentally 684
determined Si isotope fractionation between silicate and Fe metal and implications for Earth’s 685
core formation. Earth Planet. Sci. Lett. 288, 228-234. 686
Shen, G., Rivers, M.L., Wang, Y., Sutton, S.R., 2001. Laser heated diamond cell system at the 687
Advanced Photon Source for in situ measurements at high pressure and temperature. Rev. Sci. 688
Instrum. 72, 1273-1282. 689
Shen, G., Rivers, M.L., Wang, Y., Sutton, S.R., 2005. Facilities for high-pressure research with the 690
diamond anvil cell at GSECARS. J. Synchrotron Rad. 12, 642-649. 691
Simon, F., Glatzel, G., 1929. Bemerkungen zur Schmelzdruckkurve. Anorg. (Allg.) Chem. 178, 692
309-316. 693
Stixrude, L., Cohen, R.E., 1995. High-pressure elasticity of iron and anisotropy of Earth’s inner 694
core. Science 267, 1972-1975. 695
Tateno, S., Hirose, K., Ohishi, Y., Tatsumi, Y., 2010. The structure of iron in Earth’s inner core. 696
Science 330, 359-361. 697
Vocadlo, L., Price, G.D., Wood, I.G., 1999. Crystal structure, compressibility and possible phase 698
transitions in $-FeSi studied by first-principles pseudopotential calculations. Acta Crystallogr. 699
Sect B: Struct. Sci. 55, 484–493. 700
Whitaker, M.L., Liu, W., Liu, Q., Wang, L., Li, B., 2008. Combined in situ synchrotron X-ray 701
diffraction and ultrasonic interferometry study of $-FeSi at high pressure. High Press. Res. 28, 702
Page 27
27
385-395. 703
Whitaker, M.L., Liu, W., Liu, Q., Wang, L., Li, B., 2009. Thermoelasticity of $-FeSi to 8 GPa and 704
1273 K. Am. Mineral. 94, 1039-1044. 705
Zhang, J., Guyot, F., 1999a. Thermal equation of state of iron and Fe0.91Si0.09. Phys. Chem. 706
Minerals 26, 206-211. 707
Zhang, J., Guyot, F., 1999b. Experimental study of the bcc-fcc phase transformations in the Fe-708
rich system Fe-Si at high pressures. Phys. Chem. Minerals 26, 419-424. 709
Zhang, F., Oganov, A.R., 2010. Iron silicides at pressures of the Earth’s inner core. Geophys. Res. 710
Lett. 37, L02305. 711
712
713
Acknowledgments 714
We thank the two anonymous reviewers for their comments and the editor for handling our 715
manuscript. We wish to acknowledge Jason Knight, Alastair MacDowell, and Jinyuan Yan, 716
beamline scientists who helped us during this project. We would like to thank Maria Valdes for 717
help with sample preparation, Sergey Tkachev for assistance with gas-loading, and Bethany 718
Chidester, Gwen Gage, and Hannah Mark for their assistance at the beamline. This material is 719
based upon work supported by a National Science Foundation (NSF) Graduate Research 720
Fellowship to R.A.F. This work was also supported by the NSF by grant EAR-0847217 to A.J.C. 721
and by grant EAR-0944298 to D.L.H. Portions of this work were performed at 722
GeoSoilEnviroCARS (Sector 13), Advanced Photon Source (APS), Argonne National Laboratory. 723
GeoSoilEnviroCARS is supported by the NSF - Earth Sciences (EAR-0622171) and Department 724
of Energy (DOE)- Geosciences (DE-FG02-94ER14466). Use of the APS was supported by the U. 725
S. DOE, Office of Science, Office of Basic Energy Sciences, under Contract No. DE-AC02-726
06CH11357. This research was partially supported by COMPRES, the Consortium for Materials 727
Properties Research in Earth Sciences under NSF Cooperative Agreement EAR 10-43050. The 728
Advanced Light Source is supported by the Director, Office of Science, Office of Basic Energy 729
Page 28
28
Sciences, of the U.S. DOE under Contract No. DE-AC02-05CH11231. 730
731
732
Figure captions 733
Figure 1: Pressure-temperature phase diagrams in the Fe-FeSi system for various compositions. A: 734
Phase diagram of pure Fe. Subsolidus phase boundaries are taken from Komabayashi and Fei 735
(2010), and the melting curve is from Ma et al. (2004). B: Phase diagram of Fe-9Si, this study. 736
Filled blue circles: fcc+B2. Open blue circles: metastable fcc+hcp+B2. Orange squares: hcp+B2. 737
Teal diamonds: hcp. C: Phase diagram of Fe-16Si, from Fischer et al. (2012). Open red triangles: 738
D03 structure. Filled red triangles: B2. D: Phase diagram of FeSi, this study. Grey line: melting 739
curve of Lord et al. (2010). Purple %s: B2+B20. 740
741
Figure 2: Diffraction patterns of Fe-9Si, showing different phase assemblages. Data were collected 742
on heating. Lower: pattern collected at 30 GPa and 1490 K, with peaks corresponding to B2 KBr, 743
fcc Fe-9Si, and B2 Fe-9Si. Upper: pattern collected at 87 GPa and 2760 K, with peaks 744
corresponding to B2 KBr, hcp Fe-9Si, and B2 Fe-9Si. The 100 and 111 peaks of B2 Fe-9Si 745
indicate that the alloy has the B2 (not bcc) structure. 746
747
Figure 3: Diffuse X-ray scattering, indicating melting of Fe-9Si alloy at ~74 GPa. An elevated 748
background appears between 2# = 8-12° (Q ~ 33 nm-1) at temperatures between 3180 K and 3390 749
K, bracketing the melting point. This signal continues to increase with increasing temperature, 750
indicating a higher fraction of partial melt. Metastable hcp peaks diminish rapidly with increasing 751
temperature. Upon melting, B2 peaks persist while fcc peaks shrink, indicating that B2 is the 752
liquidus phase for Fe-9Si at this pressure. 753
754
Figure 4: Laser power-temperature relationships during two heating cycles on Fe-9Si. Upper: 755
Heating cycle at ~88 GPa. Lower: ~101 GPa. Below the melting point, temperature increases 756
Page 29
29
linearly and monotonically with laser power; once the melting point is reached, the temperature 757
fluctuates around a plateau as laser power is increased further. Shaded grey regions indicate the 758
melting point with width showing uncertainty. Laser powers are rounded to the nearest whole 759
number. Black dashed lines indicate the bounds on the melting temperature from X-ray diffuse 760
scattering during the same experiments. 761
762
Figure 5: X-ray diffraction pattern of FeSi collected at 39 GPa and 1210 K. Peaks correspond to 763
B2 KBr, B20 FeSi, and B2 FeSi, with one faint peak from the rhenium gasket. 764
765
Figure 6: High pressure melting curve of Fe-9Si: lower bounds (filled blue circles) and upper 766
bounds (filled black circles) on melting temperatures from X-ray diffuse scattering. Black %s: 767
melting points from laser power-temperature relationships. Grey %: 1 bar melting point, from 768
Massalski (1986). Small solid blue and black circles (at 21 GPa): lower and upper bounds on 769
melting, respectively, from Kuwayama and Hirose (2004). Small open blue and black circles (34 770
and 52 GPa): lower and upper bounds on melting of Fe-5Ni-10Si (Morard et al., 2011). Black line: 771
Simon equation fit to the data of this study. 772
773
Figure 7: Composition-temperature phase diagrams in the Fe-FeSi system at varying pressures. A: 774
50 GPa. B: 80 GPa. C: 125 GPa. D: 145 GPa. Grey crosses: melting points. Green %s: fcc+hcp. 775
Other data symbols are as in Figure 1. Data points indicate actual constraints on the phase 776
diagrams; black lines (phase boundaries) and triple points are estimated. Some two-phase fields are 777
unlabeled for clarity. Data from three phase regions (fcc+hcp+B2) in Figure 1 are labeled as 778
fcc+B2 (see text for details). Data are shown for Fe (Komabayashi and Fei, 2010; Ma et al., 2004); 779
Fe-3.4Si (Asanuma et al., 2008); Fe-9Si (this study); Fe-10Si-5Ni and Fe-15Si-5Ni (Morard et al., 780
2011); Fe-16Si (Fischer et al., 2012); Fe-18Si (Asanuma et al., 2010); and FeSi (this study; Lord et 781
al.; 2010). 782
783
Page 30
30
Figure 8: Composition-pressure phase diagrams in the Fe-FeSi system at varying temperatures. A: 784
1500 K. B: 1800 K. C: 2100 K. D: 2400 K. Symbols are as described in Figures 1 and 7. Data 785
points indicate actual constraints on the phase diagrams; black lines (phase boundaries) and triple 786
points are estimated. Some two-phase fields are unlabeled for clarity. Black crosses: melting points 787
and other phase boundaries with estimated 1% uncertainties. Asanuma et al. (2008) do not report 788
uncertainties in pressure (Fe-3.4Si data). References are the same as in Figure 7, with one bar 789
phase relations from Massalski (1986) and data for Fe-6.4Si from Kuwayama et al. (2009). 790
791
792
Supplemental tables 793
Table S1: P-T data for Fe-9Si alloy and the phase(s) observed under each set of conditions. 794
795
Table S2: Pressures and temperatures of upper and lower bounds on the melting curve of Fe-9Si, 796
based on X-ray diffuse scattering. The stable phase coexisting with the melt is identified where 797
possible. 798
799
Table S3: Pressures and temperatures of melting of Fe-9Si, based on discontinuities in the 800
samples’ laser power-temperature relationships. 801
802
Table S4: P-T data for FeSi and the phase(s) observed under each set of conditions. 803
804
805
Supplemental figure captions 806
Figure S1: Diffraction patterns of hcp Fe-9Si in KBr at ~200 GPa during heating, showing the 807
appearance of B2 peaks between 2566 K and 2696 K, which increase in intensity and becomes 808
sharper with increasing temperature. B2 Fe-9Si peaks are marked with arrows, from left: 100, 110, 809
200, and 211. 810
Page 31
31
811
Figure S2: Phase diagram of Fe-9Si, extrapolated to core pressures. Symbols are as in Figure 1b; 812
lines indicate the hcp to hcp+B2 phase boundary. Black lines: this study. Dark grey lines: Lin et al. 813
(2009). Light grey lines: Kuwayama et al. (2009). Solid lines are constrained by data, while dashed 814
lines are extrapolations. Purple vertical line indicates inner core boundary pressure. There is a high 815
degree of uncertainty in extrapolating phase boundaries over such a large P-T range. 816
817
Figure S3: Melting data for Fe-Si alloys, compared to proposed melting curves of pure iron. Solid 818
blue and black circles: lower and upper bounds on melting of Fe-9Si from X-ray diffuse scattering. 819
Black %s: melting temperatures of Fe-9Si from laser power-temperature relationship. Open blue 820
and black circles: lower and upper bounds on melting of Fe-16Si from X-ray diffuse scattering, 821
from Fischer et al. (2012). Solid red triangle and open grey triangle: lower and upper bound on 822
melting on FeSi, from X-ray diffuse scattering. Grey line: melting of FeSi (Lord et al., 2010). 823
Solid black line: melting curve of pure Fe from Williams et al. (1991). Dashed black line: melting 824
curve of iron from Ma et al. (2004). Dot-dashed black line: melting curve of Fe from Boehler et al. 825
(1990, 1993). Dotted black line: melting curve of iron from Alfè et al. (2002). 826
827
828
829 Supplemental references 830
Alfè, D., Price, G.D., Gillan, M.J., 2002. Iron under Earth’s core conditions: liquid-state 831
thermodynamics and high-pressure melting curve from ab initio calculations. Phys. Rev. B 65, 832
165118. 833
Boehler, R., von Bargen, N., Chopelas, A., 1990. Melting, thermal expansion, and phase 834
transitions of iron at high pressures. J. Geophys. Res. 95, 21731-21737. 835
Boehler, R., 1993. Temperature in the Earth’s core from melting point measurements of iron at 836
Page 32
32
high static pressure. Nature 363, 534-536. 837
Fischer, R.A., Campbell, A.J., Caracas, R., Reaman, D.M., Dera, P., Prakapenka, V.B., 2012. 838
Equation of state and phase diagram of Fe-16Si alloy as a candidate component of Earth’s 839
core. Earth Planet. Sci. Lett. 357-358, 268-276. 840
Kuwayama, Y., Sawai, T., Hirose, K., Sata, N., Ohishi, Y., 2009. Phase relations of iron-silicon 841
alloys at high pressure and high temperature. Phys. Chem. Minerals 36, 511-518. 842
Lin, J.-F., Scott, H.P., Fischer, R.A., Chang, Y.-Y., Kantor, I., Prakapenka, V.B., 2009. Phase 843
relations of Fe-Si alloy in Earth’s core. Geophys. Res. Lett. 36, L06306. 844
Lord, O.T., Walter, M.J., Dobson, D.P., Armstrong, L., Clark, S.M., Kleppe, A., 2010. The FeSi 845
phase diagram to 150 GPa. J. Geophys. Res. 115, B06208. 846
Ma, Y., Somayazulu, M., Shen, G., Mao, H.-k., Shu, J., Hemley, R.J., 2004. In situ X-ray 847
diffraction studies of iron to Earth-core conditions. Phys. Earth Planet. Inter. 143-144, 455-848
467. 849
Williams, Q., Knittle, E., Jeanloz, R., 1991. The high-pressure melting curve of iron: a technical 850
discussion. J. Geophys. Res. 96, 2171-2184. 851
Page 33
1000
1500
2000
2500
3000
3500
4000
4500 Te
mpe
ratu
re (K
)
1000
1500
2000
2500
3000
3500
4000
4500
0 50 100 150 200
Tem
pera
ture
(K)
Pressure (GPa)
hcp
hcp+B2
fcc+B2
melt
fcc+hcp +B2
hcp fcc
bcc
melt
Fe
Fe-9Si
Figure 1
A
B
Page 34
1000
1500
2000
2500
3000
3500
4000
4500
0 50 100 150 200
Tem
pera
ture
(K)
Pressure (GPa)
1000
1500
2000
2500
3000
3500
4000
4500 Te
mpe
ratu
re (K
)
melt
melt
D03
B2
B2
hcp+B2
B2 +B20
FeSi
Fe-16Si
D
C
Page 35
5 10 15 20
Inte
nsity
(arb
itrar
y un
its)
2! (degrees)
Inte
nsity
(arb
itrar
y un
its)
fcc
Fe-9
Si 1
11
KB
r 100
KB
r 111
KB
r 200
KB
r 210
KB
r 220
KB
r 221
+300
KB
r 310
KB
r 311
KB
r 222
KB
r 321
fcc
Fe-9
Si 2
00
fcc
Fe-9
Si 3
11
fcc
Fe-9
Si 2
22
B2
Fe-9
Si 1
10
B2
Fe-9
Si 1
11 K
Br 2
11
KB
r 110
KB
r 320
hcp
Fe-9
Si 0
02
hcp
Fe-9
Si 1
00
KB
r 111
hcp
Fe-
9Si 1
01
hcp
Fe-9
Si 1
02
hcp
Fe-9
Si 1
10
30 GPa, 1490 K
Figure 2
KB
r 100
KB
r 110
KB
r 200
KB
r 211
KB
r 220
KB
r 221
+300
KB
r 310
K
Br 3
11
KB
r 222
B2
Fe-9
Si 1
00
B2
Fe-9
Si 1
10
KB
r 210
B2
Fe-9
Si 2
00
B2
Fe-9
Si 2
10
B2
Fe-9
Si 2
11
hcp
Fe-9
Si 2
00
hcp
Fe-9
Si 1
12
87 GPa, 2760 K
Page 36
7 8 9 10 11 12 13
Inte
nsity
(arb
itrar
y un
its)
2! (degrees)
2290 K 2480 K 2640 K 2950 K 3180 K 3390 K 3600 K 3520 K
KB
r
hcp
hcp+
fcc
fcc
B2 K
Br
KB
r
hcp
Figure 3
Page 37
1000
1500
2000
2500
3000
3500
4000
4500
!" #" $!" $#" %!" %#" &!" &#"
Tem
pera
ture
(K)
!"#$%&'()$%&*+,&
Figure 4
3648 ± 149 K
1000
1500
2000
2500
3000
3500
4000
4500
0 5 10 15 20 25 30 35
Tem
pera
ture
(K)
Laser Power (W)
3662 ± 224 K
88 GPa
101 GPa
Page 38
5 8 11 14 17
Inte
nsity
(arb
itrar
y un
its)
2! (degrees)
!"#$%
%&$
KB
r 100
KB
r 110
KB
r 111
KB
r 200
KB
r 210
KB
r 211
KB
r 300
KB
r 310
B20
FeS
i 110
B20
FeS
i 200
B20
FeS
i 211
B20
FeS
i 311
B2
FeS
i 100
"%$'()*$++&
$
B2
FeS
i 111
B2
FeS
i 211
Re
101
Figure 5
Page 39
Figure 6
1500
2000
2500
3000
3500
4000
0 20 40 60 80 100
Tem
pera
ture
(K)
Pressure (GPa)
Page 40
1000
1500
2000
2500
3000
3500
4000
4500
0 5 10 15 20 25 30
Tem
pera
ture
(K)
Composition (wt% silicon)
1000
1500
2000
2500
3000
3500
4000
4500
Tem
pera
ture
(K)
Figure 7
A
B
melt
fcc+B2
hcp+B2 hcp
fcc
B2
D03
hcp
fcc
hcp+B2
fcc+B2
B2
melt
fcc+hcp
fcc+hcp
50 GPa
80 GPa
Page 41
1000
1500
2000
2500
3000
3500
4000
4500
0 5 10 15 20 25 30
Tem
pera
ture
(K)
Composition (wt% silicon)
1000
1500
2000
2500
3000
3500
4000
4500 Te
mpe
ratu
re (K
)
D
C
hcp
hcp+B2
B2
melt
melt
B2
hcp+B2
hcp
125 GPa
145 GPa
Page 42
0
50
100
150
0 5 10 15 20 25 30
Pre
ssur
e (G
Pa)
Composition (wt% silicon)
0
50
100
150
Pre
ssur
e (G
Pa)
Figure 8
A
B
fcc+B2
hcp+B2 hcp
fcc
B2
D03
hcp
fcc
hcp+B2
fcc+B2
B2
melt
fcc+hcp
fcc+hcp
1500 K
1800 K
D03
B2
B2
bcc
B2+B20
B2+B20
B20
B20
Fe2Si
bcc
Page 43
0
50
100
150
0 5 10 15 20 25 30
Pre
ssur
e (G
Pa)
Composition (wt% silicon)
0
50
100
150 P
ress
ure
(GP
a)
D
C
hcp
fcc
hcp+B2
B2
melt
fcc+hcp
melt
B2
hcp+B2 hcp
2100 K
2400 K
B2 D03
fcc+B2 B2+B20
B20
fcc fcc+B2 D03
B2+B20
B20
fcc+hcp
Page 44
Supplemental Figure 1
6 8 10 12 14 16 18 20
Inte
nsity
2! (degrees)
3796 K 3416 K 2916 K 2816 K 2696 K 2566 K 2338 K
Page 45
Supplemental Figure 2
1000
2000
3000
4000
5000
6000
0 50 100 150 200 250 300 350
Tem
pera
ture
(K)
Pressure (GPa)
ICB
This study
hcp only
hcp +B2
Page 46
Supplemental Figure 3
1500
2000
2500
3000
3500
4000
4500
5000
0 50 100 150
Tem
pera
ture
(K)
Pressure (GPa)