Max-Planck-Institut für Metallforschung Stuttgart Phase Transformations in Interstitial Pd-B Alloys Tilmann Georg Berger Dissertation an der Universität Stuttgart Bericht Nr. 164 April 2005
Transcript
Max-Planck-Institut für Metallforschung Stuttgart
Phase Transformations in Interstitial Pd-B Alloys
Tilmann Georg Berger
Dissertation an der Universität Stuttgart Bericht Nr. 164 April 2005
Meinen Eltern gewidmet
Phase transformations in interstitial Pd-B alloys
Von der Fakultät Chemie der Universität Stuttgart zur
Erlangung der Würde eines Doktors der Naturwissenschaften (Dr. rer. nat.)
genehmigte Abhandlung
Vorgelegt von
Tilmann Georg Berger aus Stuttgart
Hauptberichter: Prof. Dr. Ir. E.J. Mittemeijer
Mitberichter: Prof. Dr. T. Schleid
Mitprüfer: Prof. Dr. F. Aldinger
Tag der mündlichen Prüfung: 20.04.05
INSTITUT FÜR METALLKUNDE DER UNIVERSITÄT STUTTGART
Metals constitute one of the most important group of materials used to craft tools
since mankind acquired the necessary knowledge to extract metals from raw ore. This is due
to the valuable and for many different purposes adjustable properties of metals. For a long
time in history, improvement of the quality of metallic workpieces or jewellery, mostly
bronze, steel and precious metals, was achieved on a largely empirical basis by varying the
composition of the alloys and the applied heat treatments. A deeper understanding of the
importance of the microstructure, e.g. the kind and density of crystal defects and the
distribution of chemical elements and different phases in the metal, was only developed in the
last century.
This research revealed that a profound knowledge in particular about the occurring
phase transformations is required to make predictions about the resulting microstructure for a
certain alloy composition and the applied heat treatment. A prerequisite for this is sufficient
knowledge about the phase-equilibria between the components of an alloy and about the
crystal structures adopted by the different phases, which are themselves very revealing with
respect to the nature of long-range and local interactions between different atomic species.
Many alloys with attractive and adjustable mechanical properties contain interstitial
solid solutions as important constituents, which are mainly phases formed by transition
metals and small-sized elements such as carbon, nitrogen, oxygen, boron and hydrogen.
However, the properties of substitutional solid solutions are still considerably better
understood than those of interstitial solid solutions. This is probably due to the restricted
number of systems with an extensive (terminal) interstitial solubility available for
experimental investigations.
8 Introduction
One, on the first view exotic interstitial phase, but as model system very interesting is
the terminal palladium-rich solid solution PdBy [1-12]. It is able to dissolve boron up to a B
content corresponding to PdB0.25 [9], the highest (terminal) solid solubility of B in a transition
metal1. This solid solution is a high-temperature phase which is only stable above about
450°C but which can, however, be retained at room temperature by quenching. The low-
temperature regime consists of a miscibility gap, other two-phase areas and one or two low-
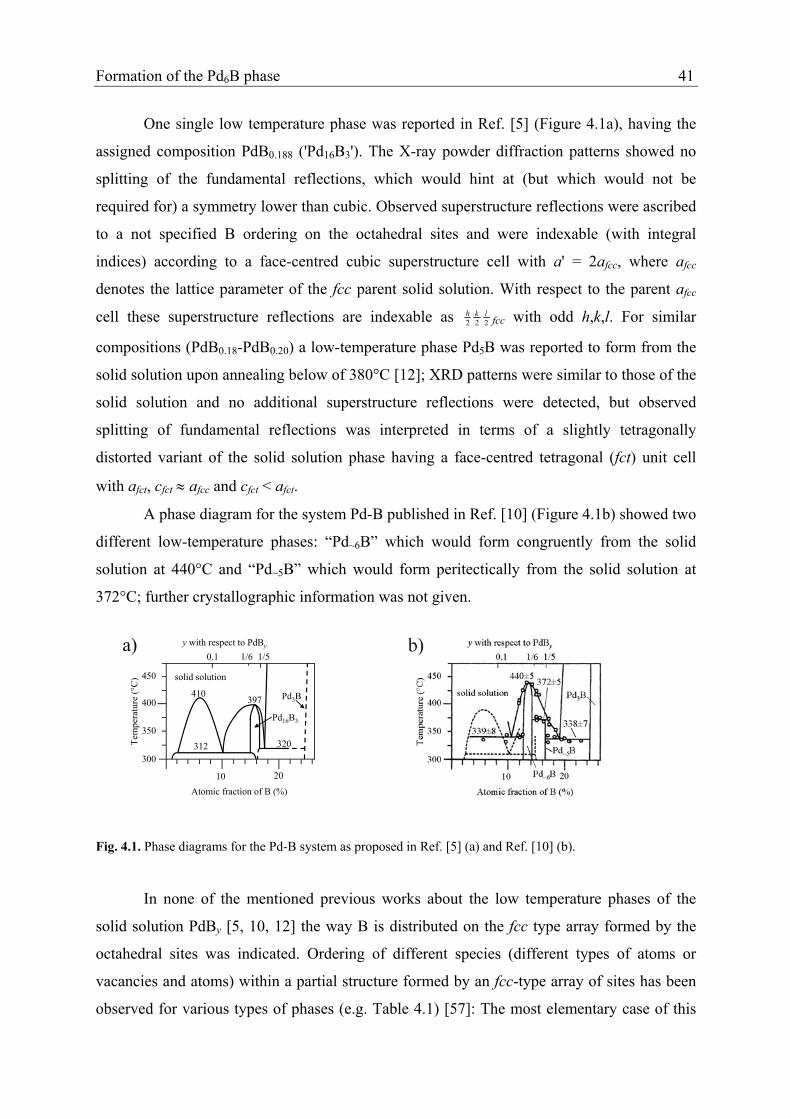
temperature phases [4, 5, 10, 12] (see Figure 1.1).
Atomic fraction of B (%)
Pd16B3
410397
312 320
Pd3B
solid solution
y with respect to PdBya)
Tem
pera
ture
(°C
)
10 20
300
350
400
450
0.1 1/51/6
Figure 1.1. Pd-B phase diagrams according to (a) Ref. [5] and Ref. [10]
1 y denotes the for crystallographic purposes more significant atomic ratio instead of the often for phase diagrams used atomic fraction. At the same time, y denotes the fraction of occupied octahedral interstices in the fcc-type Pd host lattice.
Introduction 9
The Pd host lattice experiences an extraordinarily large expansion upon dissolving
boron. Earlier H diffusivity investigations in Pd-B alloys [7] and EXAFS measurements [8]
have indicated a random occupation of the octahedral interstices by the boron atoms in the
solid solution. The observed lattice expansion upon incorporation of boron atoms suggested
large static displacements of the Pd atoms from their ideal coordinates in the crystal resulting
in a large attenuation of diffracted Bragg intensities (as described in terms of a Debye-Waller
factor) with a characteristic dependence from the interstitial boron content [13]. Results from
neutron powder diffraction experiments performed on a series of PdBy alloys to study these
static displacements as a function of composition are presented in Chapter 2 [14]. Indeed
significant static displacements were observed for the PdBy alloys when their diffraction
patterns were compared to those of pure Pd, for which no static displacements should occur.
However, no further systematic interdependency between the interstitial content y and the
magnitude of the static displacements was obtained. Comparison with isotypic defect-NaCl
(interstitial) type transition metal nitrides and carbides indicated that the measured values for
the static displacements of the PdBy alloys are exceptionally small. Additionally, the analysis
of a compilation of data on static displacement parameters for these non-stoichiometric
(interstitial) transition metal nitrides and carbides didn’t show the expected magnitude of the
composition-dependent static displacement parameter either, in contrast to the currently
accepted theories. The latter seem to, however, work well for substitutional solid solutions
[15].
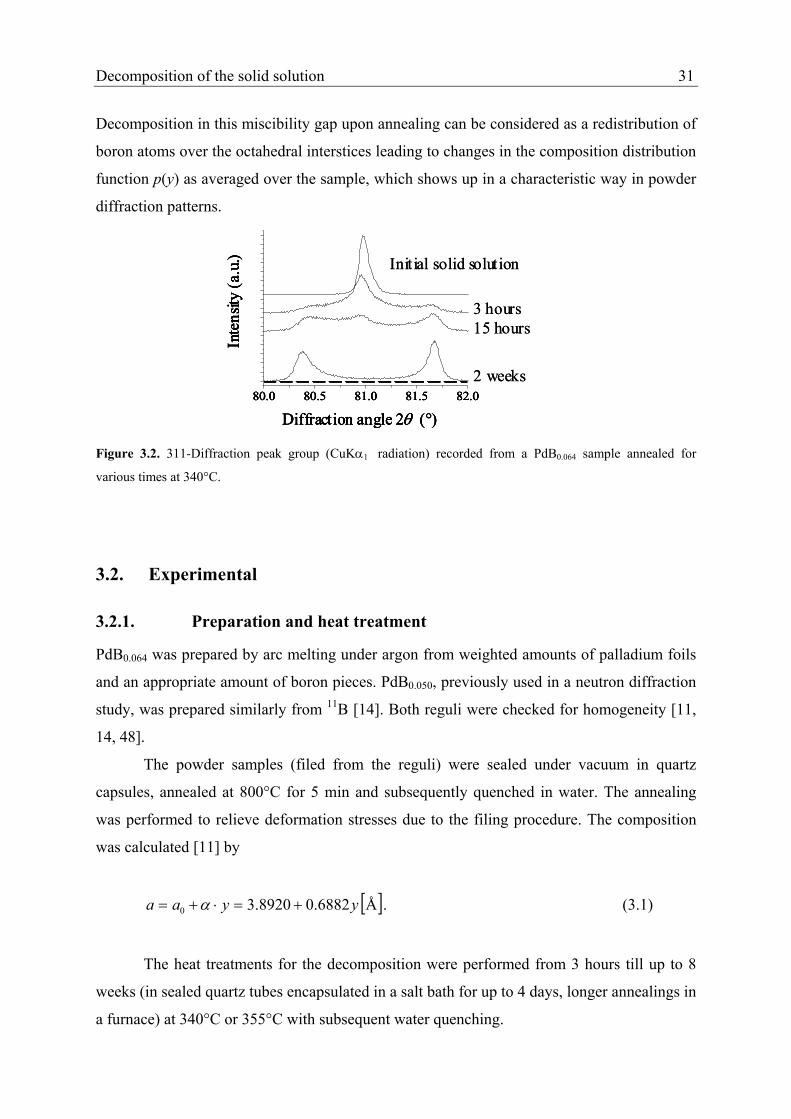
The miscibility gap in the phase PdBy is a rare phenomenon for binary interstitial
solid solution with fcc-type structure. It was reported in the range of 0.02 < y < 0.11 at 312°C
with a critical point at 410°C (y = 0.065) [4]. An annealing time-resolved X-ray powder
diffraction study of composition distributions is presented in Chapter 3 to trace the process of
the decomposition of the solid solution upon annealing for various times in the field of the
miscibility gap. For the analysis of the diffraction data a method was developed to fit the
composition distribution of PdBy in partially decomposed samples by a discretised
probability-density function for composition to the diffraction data [16]. Three main
component phases could be observed, first the initial solid solution with a phase content
decreasing with increasing annealing time and secondly two boundary phases with increasing
phase contents. It was shown that the decomposition into two solid solution phases is not
complete even after the longest applied annealing times. One striking observation is that the
observed final state after long annealing times with respect to the compositions of the
boundary phases depends slightly on the boron content of the initial solid solution.
10 Introduction
As mentioned above, one or two low-temperature phases have been reported in the
composition range of 0.16 < y < 0.20 without providing convincing and consistent crystal
structure information [5, 10, 12]. The low-temperature phases occur in relatively small
composition ranges because their formation is driven by ordering of boron atoms on the
octahedral interstices. The loss of symmetry as exhibited by the occurrence of superstructure
reflections and splitting of fundamental reflections (those reflections already occurring for the
solid solution) is difficult to observe on the basis of X-ray powder diffraction data alone, (i)
due to the low scattering power of the boron atoms for X-ray radiation leading to very weak
superstructure reflections and (ii) due to the partially severe overlap between inequivalent
fundamental reflections. Therefore, transmission electron microscopy and neutron powder
diffraction were additionally employed to characterise in particular the superstructure
reflections. The monoclinic superstructures of the low temperature phases Pd6B (cf. Chapter
4 [17]) and ‘Pd5B’ (cf. Chapter 5 [18, 19]) could be identified. The basic ‘rule’ underlying the
boron ordering in the fcc host lattice was determined to be avoidance of simultaneous
occupation of nearest and in particular of next nearest octahedral interstices by B. The crystal
structure information obtained by electron and neutron diffraction allowed a successful
interpretation of the X-ray powder diffraction data. Surprisingly, the Pd6B phase was found to
occur in two different forms: a pseudotetragonal form, which shows an apparent tetragonal
splitting of the fundamental reflections, as well as a pseudocubic form, showing no visible
splitting of the fundamental reflections as if Pd6B was cubic. Yet, both forms show the same
monoclinic superstructure.
Pd6B
y with respect to PdBy
Tem
pera
ture
(°C
)
440°C
300
400
0.05 0.10 0.15 0.20
‘Pd5B’
Figure 1.2. Pd-B phase diagram as presented in detail in Chapter 5.
Introduction 11
Many disagreements about the crystal structure and composition of the low-
temperature phases and about the miscibility gap in the Pd-B system remained in spite of
several works on that topic. In the light of the recent crystallographic investigations, in
particular about the Pd6B and the incommensurate ‘Pd5B’ low-temperature phases, a
summary is given in Chapter 5 leading to a revised Pd-B phase diagram (see Figure 1.2),
which explains nearly all observations from this and previous works.
12 Introduction
2.
Static displacements of Pd in the solid solution PdBy (0 < y < 0.2) as
determined by neutron diffraction
T. G. Berger, A. Leineweber, E. J. Mittemeijer, and P. Fischer
The mean square atomic displacement parameter of Pd in the fcc interstitial solid solution
PdBy, ( )yu 2Pd , was determined for atomic ratios of y = 0.050, 0.100, and 0.184 using
neutron powder diffraction data obtained at 15 K and 300 K. The values determined are
significantly larger than those determined for pure Pd, ( )02Pdu , at the same temperatures.
Assuming that the dynamic (thermal) contribution to ( )yu 2Pd equals ( )02
Pdu , the static
mean square atomic displacement parameter ( )st
2Pd yu = ( )yu 2
Pd − ( )02Pdu was obtained as
0.0020(1) Å2 to 0.0027(1) Å2. ( )st
2Pd yu showed no systematic variation with y or the sample
temperature. This contrasts with an expected y·(1 − y) concentration dependence for
( )st
2Pd yu . Comparison of ( )
st
2Pd yu with values for the static mean square displacements of
the metal atoms in different defect-NaCl type transition metal nitrides and carbides indicates
that the current values for Pd in PdBy are exceptionally small.
14 Static displacements of Pd by neutron diffraction
2.1. Introduction
The palladium rich terminal solid solution PdBy (fcc arrangement of Pd, B on octahedral sites
without long-range order) is a remarkable model system for the study of the character of
interstitial compounds. According to Hägg’s rule of critical atomic radius ratio [20, 21],
boron should actually be too large in order to fit into the fcc lattice [11]. Yet, the interstitial
solubility extends to approximately PdB0.20 (corresponding to ~17 at. % boron) above about
720 K [22], which is by far the largest one of boron in transition metals. The solid solution is
only stable at elevated temperatures, but can be retained by quenching2; the low temperature
region of the Pd-B phase diagram in the range of compositions Pd - PdB0.20 consists of
several low-temperature phases and two-phase regions [10, 12].
The wide range of solid solubility of B in Pd motivated a large number of studies of
the PdBy solid solution, in particular devoted to its crystal structure [4, 8, 11], its
thermodynamic properties [4, 6] and the boron diffusivity [23, 24]. Besides the high
solubility of B in Pd itself, also the large lattice expansion occurring upon dissolving B in Pd
has attracted considerable interest [4, 11]. The following equation describes the dependence
of the lattice parameter, a, upon composition y [11]
a = a0 + α · y = 3.8920 Å+ 0.6882 Å · y (2.1)
at room temperature, where y equals the average occupancy of the octahedral sites and is
equal to y in the formula PdBy. Eq. (2.1) can be used to derive the B contents of PdBy solid
solutions from X-ray diffraction data.3
Boron in the solid solution PdBy appears to be randomly distributed (without long-
range order) over the octahedral interstices, i.e. in the fcc unit cell any octahedral site can
either be occupied by a B atom or by a vacancy. Around such locally different configurations
the structure can relax by shifts of atoms relative to their positions in the average lattice.
These displacements of the atoms are called "static displacements" [13] and are of a
2 Internal friction experiments [23] hinted at local aging/decomposition effects of the material at room
temperature on the time scale of months. However, there is no confirmation from other experiments,
including those performed in the present project, for such effects. 3 It should be noted that equations slightly different from Eq. (2.1) have been reported previously
(e.g. [4]) and used to derive compositions from cell parameters.
Static displacements of Pd by neutron diffraction 15
statistically largely uncorrelated nature, i.e. they do not cause diffraction line broadening.
These static displacements attenuate the diffracted intensity in the same way as the dynamic
(thermal) displacements due to the thermal vibrations do. Hence, both these static and
dynamic displacements exhibit themselves in their effect on the diffracted intensity through a
so-called Debye-Waller factor [13].
It has been derived on a common basis for fcc based solid solutions of interstitial
character (MXy, with M indicating the fcc arranged metal atoms and X the interstitial atoms,
e.g. N, C, O, B, H… located on octahedral sites) and of substitutional character (M’yM”1-y,
with M’ and M” indicating atoms of two different metal elements) that in the absence of
short-range ordering the static mean square atomic displacements of a three-dimensional
Gaussian distribution of M (for the substitutional case M = M’ or M”), 2M st
u , should vary
with the composition variable y (note that y in MXy and in M’yM’’1-y denotes in both cases
the atomic fraction of solute on the (sub)lattice available for the solute) like [13]:
( )st
yu 2M ~ · y·(1 − y) (2.2) 2
sfΩ
where is the so-called volume size factor, which has been taken in Eq. (2.2) as [26] 2sfΩ
( )0
ln
=∂∂
=y
sf yyVΩ (2.3)
where V is the volume of the fcc type unit cell. In order to use the volume size factor at y = 0
in Eq. (2.3), it has been assumed to be constant over the relevant composition range.
Extended X-ray Absorption Fine Structure (EXAFS) measurements on two fcc PdBy
solid solutions (PdB0.114 and PdB0.160) indicated the presence of static displacements for the
Pd atoms [8]. The values reported for the static displacements are not compatible with the
y·(1 − y) dependence as expected from Eq. (2.2). The reported static displacements for
PdB0.160 are even smaller than for PdB0.114.
In this work, neutron powder diffraction experiments for PdBy samples with
y = 0.050, 0.100, and 0.184 were performed, in order to determine the magnitude of the static
displacements as a function of the boron content. Compared to X-ray diffraction, which is
dominated by heavy atoms and characterised by an atomic scattering factor that decreases
strongly with sinθ/λ and thus leads to relatively weak high angle reflections, neutron
16 Static displacements of Pd by neutron diffraction
diffraction is particularly sensitive to light atoms and well suited for atomic displacement
measurements because of relatively strong high angle reflections due to a coherent nuclear
scattering length which does not depend on sinθ/λ. The results obtained will be discussed
with respect to theoretical expectations [13, 25] and experimental results on static
displacements in the structurally related defect-NaCl type transition metal carbides and
nitrides.
2.2. Experimental
2.2.1. Preparation
The alloys were prepared from weighted amounts of ca. 3.5 g palladium foils (99.9 wt.%;
Heraeus) and an appropriate amount of boron pieces (99.29% 11B; chemical purity 99.97
wt.%; Eagle Picher) by arc melting under argon (550 hPa, 99.999 vol.%; Messer Griesheim).
The pure isotope 11B was used instead of boron with the natural mixture of its isotopes,
corresponding to about 20% 10B, because 10B has a very high neutron absorption cross
section [27] and by its use the diffracted intensities would decrease dramatically.
The homogeneity of the reguli and their compositions was checked by means of X-ray
diffraction (cf. Eq. (2.1)). For that purpose, small parts of the cast bulk were removed by
filing from the top and bottom of the reguli using a diamond rasp. The filings were sealed
under vacuum in quartz capsules, annealed at 1073 K for 5 min and subsequently quenched in
water. The heat treatment was performed in order to relieve deformation stresses due to the
filing procedure. If homogeneity had not been achieved, the corresponding regulus was
remelted and the X-ray test procedure was repeated.
Homogenous reguli were fully filed. For relief of internal stresses, the resulting
powders (ca. 2.5 g) were encapsulated under helium (ca. 500 hPa, 99.999 vol.%; Westfalen
Reinstgase) in a quartz tube, heated for 5 min at 1073 K and water quenched.4
The same procedure, except for the arc melting, was performed to prepare a pure
palladium powder sample from the initial palladium foil.
4 The He-atmosphere was chosen in order to achieve a fast cooling rate for the relatively large batch
sizes.
Static displacements of Pd by neutron diffraction 17
2.2.2. X-ray diffraction
X-ray powder diffraction patterns were recorded at a Philips X’Pert MPD diffractometer
applying Bragg-Brentano geometry and equipped with a primary beam monochromator
selecting the Kα1 component of the employed copper radiation (1.54056 Å). The samples
consisted of a thin layer of the PdBy alloy filings mixed with silicon powder (a = 5.43102 Å)
as internal standard, deposited onto single crystalline silicon wafers with a (510)-plane
parallel to the surface.
All reflections were recorded by measuring over 2θ-ranges sufficiently large to
determine the background at both sides of each reflection. The reflection positions from the
X-ray diffraction pattern were obtained by fitting the reflections with symmetrical pseudo-
Voigt functions [28]. The 2θ-values of the PdBy reflections were corrected using the positions
of the Si reflections. The lattice parameters of the fcc solid solutions were subsequently
determined by using the programme CELREF [29].
2.2.3. Neutron diffraction
Neutron diffraction experiments were performed at the HRPT powder diffractometer [30]
installed at the spallation neutron source SINQ (Paul Scherrer Institute, Villigen, CH)
employing the high intensity mode of the instrument. The wavelength of the neutron beam
(λ = 1.1966 Å) was determined by using a silicon standard sample. The powder filings (Pd,
PdB0.050, PdB0.100, PdB0.184) were kept in closed vanadium cylinders (d = 4 mm). To avoid
frozen air in the vanadium cylinders and for better thermal contact, the powders had been put
into the cylinders in a glovebox under helium atmosphere. Each sample was measured for
about 8 h at 15 K and at 300 K, respectively (closed cycle CTI refrigerator).
For the applied wavelength the absorption of a representative sample was determined
by a transmission experiment as µR = 0.065 (R: cylinder radius, µ: linear absorption
coefficient); for this value of µR, calculations show that the resulting angle dependent effects
on reflection intensities are negligible [27]. Therefore, absorption was not considered in the
course of all Rietveld refinements (cf. section 2.2.4.)
18 Static displacements of Pd by neutron diffraction
2.2.4. Rietveld refinement
Rietveld refinement of the neutron diffraction patterns was performed using the programme
Jana2000 [31]. A fixed background was estimated from measured intensities at a series of 2θ-
values in between occurring reflections and substracted from the intensity profile. In the
subsequent Rietveld refinements allowance was made for a residual background described by
a Legendre function with fitted coefficients. The reflection profiles were refined using the
Thompson-Cox-Hastings version of the pseudo-Voigt function [32]. The values used for the
coherent nuclear scattering lengths of Pd and 11B were bPd = 5.91⋅10-12 cm and
bB = 6.65⋅10-12 cm, respectively [27]. The crystal structure model used for refinement is
based on the fcc Pd host lattice with the boron atoms statistically distributed over the
octahedral interstices (Table 2.1). This yields the following formula for the structure factor of
the hkl reflection, allowed by the fcc Bravais lattice, F(hkl):
a Fixed for all PdBy compositions to the displacements of boron in the PdB0.184 sample at the corresponding
temperature (see text). b Calculated from the lattice parameter as determined by X-ray diffraction and application of Eq. (2.1)
2.3. Results
2.3.1. X-ray diffraction experiments
The lattice parameters for the four different samples used for neutron diffraction analysis, as
determined by X-ray diffraction analysis, are shown in Table 2.2. These lattice parameters
were used to determine the PdBy compositions by application of Eq. (2.1). These
compositions were adopted in the following to identify the samples and were used as known
data in the Rietveld refinements.
20 Static displacements of Pd by neutron diffraction
Table 2.2. Lattice parameters as determined after filing the whole reguli by X-ray diffraction (XRD)
measurements at room temperature (RT) and by neutron diffraction measurements (ND) at 15 K and 300 K
Composition for
weighing
Lattice parameter
XRD data at RT
(Å)
Calculated
composition
using Eq. (2.1)
Lattice parameter
ND data at 300 K
(Å) a
Lattice parameter ND
data at 15 K (Å) a
Pd 3.8910(1) - 3.8898 3.8804
PdB0.05 3.9264(1) PdB0.050 3.9252 3.9163
PdB0.10 3.9608(1) PdB0.100 3.9598 3.9509
PdB0.20 4.0186(1) PdB0.184b 4.0173 4.0090
a Standard deviations by Rietveld refinements have not been listed here. The numerical values are <0.0001 Å,
disregarding uncertainties in the neutron wavelength. b For this sample arc melting had to be repeated due to inhomogeneities in the bulk. This resulted for this sample
in an overall loss of boron, cf. weighted and calculated boron content.
2.3.2. Rietveld refinement of neutron diffraction data
The relative intensities of the reflections in the neutron diffraction patterns agreed well with
the expectation on the basis of Eqs. (2.4) and (2.5), thereby confirming that the boron atoms
are located in all cases on the interstitial octahedral sites of the Pd fcc arrangement. No
superstructure reflections due to a possible long-range ordering of boron atoms were
observed. The site occupancies of the boron atoms were imposed on the basis of the value of
y obtained from the lattice parameter determined by X-ray diffraction and application of
Eq. (2.1); refinements of the occupancy of the B site did not lead to significantly different
values for y. A Rietveld fit of the neutron diffraction pattern recorded for PdB0.184 at 300 K is
shown in Figure 1. The amount of diamond impurity in this powder caused by the filing
(cf. section 2.2.1. and section 2.2.4.) is well below 1 mass %. The other samples contained
similar amounts of diamond impurity.
Static displacements of Pd by neutron diffraction 21
θ (°)
Inte
nsity
Fig 2.1. Rietveld fit of
points, calculated patte
line: PdB0.184). The sha
counts (Residual value
2,
The atomic
resulting from the
displacements for p
temperatures. Evid
PdBy alloys are sign
The atomic
contributions from
static displacement
( )yu 2Pd equals u
( )st
2Pd yu is obtain
( )st
2Pd yu =
Diffraction angle
a neutron diffraction pattern of the PdB0.184 sample measured at 300 K: Measured data
rn (full line); difference curve as well as reflection markers (upper line: diamond, lower
ded regions were excluded from the refinement. The intensity of 1 corresponds to 10609
s (see Ref. [34] for definitions): Rp = 3.86; Rwp = 4.82; RBragg = 1.09).
displacement parameters determined for Pd in PdBy and pure Pd, as
Rietveld refinements, have been listed in Table 2.3. The atomic
ure Pd, ( )02Pdu , are close to previously published values [35] for both
ently, the atomic displacements parameters ( )yu 2Pd determined for the
ificantly larger than those for pure Pd.
displacement parameters ( )yu 2Pd of pure Pd are only caused by dynamic
lattice vibrations. For the PdBy alloys an additional contribution from
s is expected for the Pd atoms. If for PdBy the dynamic contribution to
( )02Pd at the same temperature, the static atomic displacement parameter
ed according to
( )yu 2Pd − ( )02
Pdu (2.6)
22 Static displacements of Pd by neutron diffraction
thereby implicitly assuming that both the static and the dynamic contributions obey a
Gaussian distribution.
For each composition the static displacement parameters thus calculated at 15 K and
300 K agree well, as should be expected (cf. Table 2.3); the values at 300 K are only slightly
higher. This supports the above adopted treatment.
Table 2.3. Values of the mean square atomic displacements for the Pd atoms, ( )02Pdu and ( )yu 2
Pd ,
obtained from Rietveld refinements and the static displacement parameters ( )st
2Pd yu calculated from these
data according to Eq. (2.6).
y according to
PdBy
( )yu 2Pd at
15 K (Å2)
( )yu 2Pd at
300 K (Å2)
( )st
2Pd yu at
15 K (Å2)
( )st
2Pd yu at
300 K (Å2)
0 0.00092(7) 0.00511(7) 0 0
0.050 a 0.00325(8) 0.00767(8) 0.0023(1) 0.0026(1)
0.100 a 0.00343(8) 0.00785(8) 0.0025(1) 0.0027 (1)
0.184 a 0.00292(7) 0.00749(8) 0.0020(1) 0.0024(1)
a 2Bu = 0.0071 Å2 at 15 K and 2
Bu = 0.0124 Å2 at 300 K as determined in the course of the separate
refinement of the PdB0.184 data (see section 2.2.4.).
2.4. Discussion
2.4.1. Comparison with EXAFS experiments
EXAFS measurements of PdB0.114 and PdB0.160, with reference to pure Pd, were evaluated [8]
in terms of local interatomic Pd-Pd distances (1st, 3rd and 4th ‘shell’ of Pd around a reference
Pd atom5) as well as Gaussian smearing expressed in terms of the 'EXAFS Debye-Waller
factor' σPd, which has the dimension of length, and can be conceived as more or less an
analogue of 21
2Pdu rather than of TPd (cf. Eq. (2.4)). ( )yi
2,Pdσ (i designates the shell number)
of the PdBy alloys, due to dynamic and static displacements, was related to the corresponding
5 The 2nd shell contribution to the EXAFS signal could not be evaluated quantitatively because it is
corrupted by the boron atoms acting as ‘lens’ atoms [9].
Static displacements of Pd by neutron diffraction 23
value of pure palladium, , assumed to be of purely dynamic nature, by the static
contribution (cf. Eq. (2.6)):
( )02,Pd iσ
( )yi2
,Pdδσ
( ) ) yi2
,Pdδσ+ ( )y i2
,Pdσ=
2,Pd iδσ
24,Pdδσ
u 2Pd2=∞→
( )st, 2 ui =∞→
(i2
,Pd 0σ (2.7)
For the first shell, which corresponds to an average Pd-Pd distance of a/21/2, the pair
distribution function g1(r), with r as the Pd-Pd distance, was found to be largely bimodal; two
Pd-Pd distances with high frequency occurred, which both are only marginally smeared by
small values of . The longer Pd-Pd distance was interpreted as an elongated Pd-Pd pair
which forms an edge of an occupied Pd6 octahedron, while the shorter Pd-Pd distance was
interpreted as an Pd-Pd pair which forms an edge of an empty Pd6 octahedron. These discrete
Pd-Pd pair distances are not easily translated into root mean square atomic displacement
parameters as observed by diffraction experiments.
For the 3rd and 4th shell the pair distributions g3(r) and g4(r) could not be decomposed
into different contributions. They each showed only one maximum at a Pd-Pd distance of
(3/2)1/2a and 21/2a, respectively, which were smeared by significant static displacements
and , respectively, because of the different possibilities to place one or more
boron interstitials along the Pd-Pd distance concerned.
23,Pdδσ
For large interatomic distances (i.e. for high shell numbers) and thereby minimising
the influence of short-range order, the displacement parameters used to fit EXAFS data
[8] can be related to the atomic displacement parameter
2,Pd iσ
2Pdu according to Ref. [36]
( )yi2
,Pdσ (2.8a)
and thus for the static displacements
2Pd
2Pd yδσ (2.8b)
Eq. (2.8b) can be used to compare the - and -values of the 323,Pdδσ 2
4,Pdδσ rd and 4th
shells (cf. Eq. (2.7)) with ( )st
2Pd yu . Thus, from the - and -values in Ref. [8], 2
3,Pdδσ 24,Pdδσ
24 Static displacements of Pd by neutron diffraction
one obtains ( )st
2Pd yu
( )
-values of 0.0019 Å2 and 0.0025 Å2 for PdB0.114 and 0.0014 Å2 and
0.0019 Å2 for PdB0.160. It can be concluded that, even recognising the limited range of
evaluated i, the EXAFS data of Ref. [8] give estimates for the static displacements of Pd
which are of the same order of magnitude as those obtained directly in this study on the basis
of neutron diffraction data (cf. Table 2.3).
2.4.2. Comparison with theoretical predictions and with experimental
observations of static displacements in defect-NaCl type transition metal nitrides
and carbides
Different approaches exist for the prediction of the static displacements in fcc based
interstitial solid solutions as a function of concentration [13, 37]. If short-range order is
absent and if a Gaussian distribution of the displacements is assumed, the different
approaches give expressions like Eq. (2.2) in case of sufficiently small static displacements.
Calculations of static displacements on the basis of micromechanical models for fcc based
interstitial solid solutions (employing the elastic constants of pure Pd and the concentration
dependence of the lattice parameters as given by Eq. (2.1)) [13] and consideration of the
consequences of these displacements for diffraction [13] yield an explicit version of Eq. (2.2)
for PdBy [A. Udyansky, V. N. Bugaev, unpublished]:
st
2Pd yu = 0.113 Å· y·(1 - y) (2.9)
Values of ( )st
2Pd yu according to Eq. (2.9) are shown for the relevant range of y in
Figure 2.2 in comparison with the present experimental values (Table 2.3). The disagreement
is obvious: PdBy shows neither the expected concentration dependence of ( )st
2Pd yu , nor do
the static displacement values have the large magnitude as expected from theory. A reason
may be that chemical (electronic) interactions may modify the static displacements,
recognising that Eq. (2.9) is based on purely elastic interactions. Indeed there are hints that
chemical interactions are quite important as suggested by the high solubility of boron in
palladium and the lattice parameter change upon boron dissolution [11]. Furthermore, it was
shown, that the electronic structure of the palladium, which changes considerably upon
Static displacements of Pd by neutron diffraction 25
dissolving boron, has an important influence on the thermodynamic properties of the solid
solution [4].
There is a lack of static atomic displacement data for other metal rich fcc based
interstitial solid solutions as a function of the interstitial content. According to
Refs. [13, 38, 39] the models leading to Eq. (2.2) should also apply to non-stoichiometric
defect NaCl-type intermediate solid solutions MX1-y' for which M is an early transition metal
(groups IVb and Vb) having an fcc arrangement and X is N, C on octahedral sites. Here, the
state of reference is not the pure fcc type metal but the defect free NaCl type solid MX1 (i.e.
y' = 0). Upon raising y', vacancies are introduced on the initially fully occupied octahedral
interstitial sites. These vacancies play the same role as the interstitials on the metal rich side
(e.g. PdBy). Experimental data for static displacements in MX1-y' are available for several
systems [38], but for one and the same system the values given in the literature may vary
considerably, as for TiC1-y' [40, 41]. These data have been plotted in Figure 2.2. For most of
the systems concerned the static displacements are considerably larger than for PdBy; the
values show more or less an increase of st
2Mu with increasing y' for y' < 0.5.
It is difficult to give reasonable values for the volume size factors for some of the
MX1-y' systems considered in Fig 2.2, except for ThC1-y', ZrN1-y' and TiN1-y', because the
volume size factors vary considerably with y [42, 43]. Average values for the range
0 ≤ y’ ≤ 0.2 have also been given in Figure 2.2. The volume size factor should play an
important role for the magnitude of the static displacements of the metal atoms according to
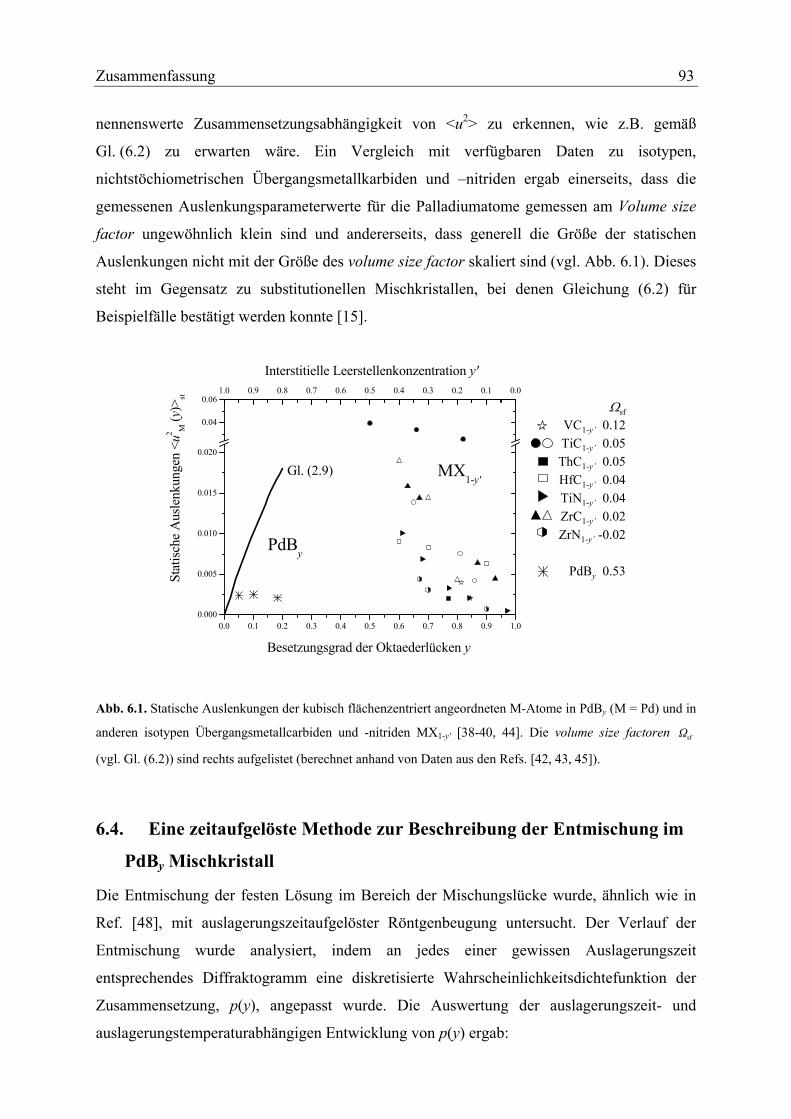
Eq. (2.2), but this is not apparent from the data compiled in Figure 2.2. The largest value for
the volume size factor occurs for PdBy, which is according to Eq. (2.1) and Eq. (2.3) given
by:
( ) 53.03PdB0
sf ≈=a
Ω yα
The second largest volume size factor occurs for VC1-y' (0.12). Yet, for both PdBy and VC1-y',
the observed static displacements are, by far, not the largest ones (cf. Figure 2.2). If,
according to Eq. (2.2), the volume size factor dominates the magnitude of the static
displacements, then values of ( )st
2M yu / should be similar for the different systems.
Clearly such behaviour does not occur.
2sfΩ
26 Static displacements of Pd by neutron diffraction
Hence, the observed static displacements of the metal atoms in fcc based interstitial
solid solutions do not comply with Eq. (2.2) regarding the dependencies on (a) concentration
(especially for PdBy) and (b) the volume size factor. This contrasts with several examples of
substitutional solid solutions which obey Eq. (2.2), e.g. see Ref. [15]. It is unclear why the
approximations used to derive Eq. (2.2) are apparently less well justified for interstitial than
for substitutional fcc based solid solutions. An explanation might be that occurrence of short-
range order and the influence of other than microelastic interaction has a more important
impact on the static atomic displacements of interstitial solid solutions than on those of
6 This supercell structure proposal is reasonable because no splitting of the fundamental reflections was observed which would hint at a crystal system of lower symmetry than cubic. See further results obtained in the present work.
Fig. 4.2. Crystal structure of pseudocubic Pd6B (space group C2/c) as obtained by Rietveld refinement of NPD
data: (a) view along [1 10]; alternate sequence of layers of octahedral interstitial sites (looked upon ‘edge on’)
within the cubic close packed arrangement of Pd with average occupancies for B of yav = 1/3 and 0. The stacking
direction corresponds to [111]fcc (see Table 2). One fcc unit cell has been highlighted in the upper part of the
figure, and one monoclinic unit cell at the bottom. (b) view along [111]fcc; arrangement of B atoms with the
surrounding Pd atoms within one of the occupied octahedral layers, vacant octahedral sites within this layer are
indicated by squares, . (c) One BPd6 entity with shortest distances B-Pd.
4.3. Experimental
4.3.1. Preparation of the Pd-B alloys
The three PdBy alloys investigated in this study were prepared from weighted amounts of
about 3.5 g and about 1.5 g Pd foils (Heraeus, 99.9 wt.%), for the neutron and X-ray
diffraction measurements, respectively, and an appropriate amount of B pieces (isotope
enriched boron: Eagle Picher, 99.29% 11B, chemical purity 99.97 wt.%; or B with isotopes in
natural abundance: Johnson Matthey, chemical purity 99.5 wt.%) by arc melting under argon
(550 hPa; Messer Griesheim, 99.999 vol.%). For an overview of the prepared alloys, see
Table 4.3. For alloy 2 intended for neutron diffraction measurements the pure isotope 11B was
used instead of B with the natural mixture of its isotopes (about 20 at.% 10B), because 10B has
Formation of the Pd6B phase 47
an extremely high neutron absorption cross section [27] and by its use the diffracted neutron
beam intensities would decrease dramatically.
The homogeneity of the reguli and their compositions was checked by measuring the
cubic lattice parameters by X-ray diffraction (XRD; cf. section 4.3.3.). The compositions
were calculated by application of [11]:
a = 3.8920 Å + 0.6882 Å y (4.1)
In the following the actual compositions, described by PdBy, are used to identify the alloys
used in the experiments (Table 4.3).
For the homogeneity measurements, small parts of the as-cast bulk samples were
removed by filing from the top and bottom of the reguli using a diamond rasp7. The filings
were sealed under vacuum in quartz capsules, annealed at 1073 K for 5 min and subsequently
quenched in water. The heat treatment was performed in order to relieve deformation stresses
due to the filing procedure. If homogeneity had not been achieved, the corresponding regulus
was remelted and the X-ray test procedure was repeated. The samples listed in Table 4.3
contain apparently a little less B than corresponding to the composition aimed at; experience
with the preparation of other Pd-B alloys has suggested that some B loss can happen during
the arc beam melting.
For the structural and thermal analyses, heat treated powder and pieces of bulk
specimen were prepared starting from the homogeneous reguli. The powder specimens (for
XRD) were obtained by filing the reguli as described above for the homogeneity verification,
and bulk pieces (for transmission electron microscopy, TEM and differential thermal
calorimetry, DSC) were cut from the reguli by electrical discharge machining. The thus
obtained powder filing batches and bulk pieces were encapsulated in evacuated quartz tubes
and stress relieved at 1073 K for 5 min followed by quenching (including, for the bulk pieces,
immediate subsequent crushing of the quartz tubes to obtain a higher cooling rate). For
further heat treatments at lower temperatures, leading to the ordered and/or two-phase states
(see sections 4.4.2. and 4.4.3.), filings and bulk pieces were re-encapsulated (as above) and
again quenched (and crushed for the bulk pieces) after annealing.
7 The filing with the diamond rasp introduced diamond as an impurity phase as exhibited by corresponding reflections in diffraction patterns, as particularly visible in the neutron diffraction patterns.
48 Formation of the Pd6B phase
For the neutron diffraction measurements a larger amount of powder than for the
XRD measurements was required. To this end, the homogeneous regulus was filed entirely.
The resulting powder (ca. 2.5 g) was encapsulated under helium (at about 500 hPa; Westfalen
Reinstgase, 99.999 vol.%) in a quartz tube, stress relieved and water quenched. The He
atmosphere (instead of vacuum) was chosen in order to achieve a fast cooling rate for the
relatively large batch size.
Table 4.3. Overview of prepared Pd-B alloys, measured cubic lattice parameters by X-ray diffraction and
calculated compositions (cf. Eq. (4.1)), and techniques applied for (structure and constitution) characterisation
A bulk piece of PdB0.163 was annealed at 800°C for 5 min and subsequently quenched in
water by crushing the quartz capsule. In this way the disordered state occurring at high
temperature should be retained. Subsequently, in the DSC the sample was heated up to 500°C
and cooled down, for three times in succession (Figure 4.3a). Only the first of these DSC
cycles showed upon heating an exothermic signal in the range of 100°C to 230°C with the
maximum at about 160°C (Figure 4.3b). This is followed by an endothermic signal with an
onset temperature for the heating runs of about 440(5)°C (Figure 4.3a). In the following
heating runs only the latter signal is observed. In all cooling runs an exothermic signal occurs
with onset temperature of about 440(5)°C, i.e. the same temperature at which the endothermic
signal occurring in all three heating runs is observed.
The exothermic signal at about 160°C during only the first heating run is ascribed to ordering
of the as-quenched disordered alloy, disordered PdB0.163 ordered Pd→ 6B. The signal at
about 440°C observed upon heating and cooling in all cycles is attributed to the reversible
order-disorder phase transition, ordered Pd6B →← disordered PdB0.163, in agreement with
earlier results [10].
It was found that samples which were quenched from 800°C without immediate
subsequent crushing (see section 4.3.1.), led to absence of the initial exothermic signal at
about 160°C upon heating in the first cycle. This implies that crushing is essential to realise
efficacious quenching to retain the disordered solid solution state.
52 Formation of the Pd6B phase
200 300 400 500
Temperature (°C)
(a)
(b)
exo
end
oD
SC si
gnal
(a.u
.)
Temperature (°C)100 150 200 250
(b)
heat run, first cycle
heat run, second + third cycle;
all cooling runs
exo
end
oD
SC si
gnal
(a.u
.)
Fig. 4.3. DSC scans recorded from a PdB0.163 (alloy 3) bulk piece (after annealing for 5 min at 800°C followed
by water quenching thereby retaining the disordered solid solution). During the first heating run the exothermic
signal observed at about 160°C (b) indicates the at this temperature irreversible ordering of B atoms leading to
Pd6B. Upon further heating and subsequent cooling, at 440(5)°C the (reversible) transition ordered Pd6B →←
disordered PdB0.163 occurs, in this and in all following heating and cooling cycles (a).
Formation of the Pd6B phase 53
4.4.2. Electron diffraction; type of B ordering in the Pd6B phase
Electron diffraction patterns recorded from PdB0.163 (alloy 3) annealed for 1 week at 360°C
showed not only the fundamental reflections pertaining to the mean fcc-type arrangement of
the Pd atoms but also many reflections ascribed to the occurrence of a superstructure (see
Figure 4.4 a): a comparison of the recorded diffraction patterns with diffraction patterns
simulated [74] on the basis of the three candidate structures (see section 4.2, Table 4.1 and
the Appendix) showed that all observed superstructure reflections can be explained by the
exclusive occurrence of type 2 ordering (C2/c, Table 4.2); diffraction patterns requiring the
(additional) presence of ordering types 1 and 3 not were observed.
Fig. 4.4. Electron diffraction pattern negatives of a thin foil prepared from (a) PdB0.163 (alloy 3) quenched and
annealed for 1 week at 360°C and (b-d) PdB0.144 (alloy 1) quenched and annealed for 3 weeks at 280°C. The
fundamental reflections and zone axes of each pattern except (d) have been indicated according to the fcc
average structure (white numbers) and to the monoclinic type 2 superstructure (black numbers, see Table 4.2).
The directions of the incident electron beams have been indicated; (d) can be understood as a superposition of
patterns (b) and (c). Weak streaks parallel to [ 111 ]fcc hint at faults in the stacking sequence of partially occupied
(by B) layers of octahedral interstitial sites of the close packed cubic arrangement of Pd, and have been
indicated in the enlarged part of pattern (b). The circle in (d) indicates the (superstructure) reflections used to
record the dark-field image in shown Figure 4.5.
54 Formation of the Pd6B phase
Fig. 4.5. Dark field images (positive) taken using the superstructure reflections of the ordering of type 2
encircled in Figure 4.4d. The plate-like dark regions are the solid solution disordered with respect to B.
Since the monoclinic superstructure of type 2 is formed from a cubic high temperature
phase, different orientations of the superlattice with respect to the fcc lattice of the parent
high temperature phase are possible, and thus differently oriented domains are expected to
occur. Indeed some diffraction patterns were observed which could be explained as
superpositions of diffraction patterns from differently oriented (with respect to the incident
electron beam) domains, as shown in Figure 4.4d.
Whereas the annealed PdB0.163 (alloy 3, a week at 360°C) apparently consists of only
one single phase, TEM of the annealed PdB0.144 (alloy 1, 3 weeks 280°C followed by
quenching) reveals plates of a second phase in a matrix consisting of Pd6B with the
superstructure of type 2 (see Figures 4.4b-d). According to the selected area electron
diffraction performed these plates (typical thickness < 100 nm) have − with respect to the
fundamental reflections − the same crystallographic orientation as the surrounding matrix, but
the superstructure reflections lack. Indeed, the plates appear dark in dark-field images
Formation of the Pd6B phase 55
recorded from the superstructure reflections of the surrounding matrix (Figure 4.5). The
superstructure reflections used for the dark field images have been indicated in Figure 4.4d.
Certain diffraction patterns pertaining to <211>fcc zones showed besides the
superstructure reflections corresponding to the type 2 ordering additional diffuse streaks
parallel to [ 111 ]fcc directions in these patterns (Figure 4.4b; see section 4.5). For the
monoclinic Pd6B phase specific directions [uvw]fcc or planes (hkl)fcc are defined according to
Table 2.
4.4.3. X-ray powder diffraction; identification of two-phase equilibria
X-ray diffraction measurements on powder samples quenched from the solid solution phase
field (i.e. from 800°C) were used to determine the lattice parameters of the fcc unit cell of the
solid solution. Subsequent application of Eq. (4.1) led to determination of the B contents (cf.
Table 4.3).
Inspection of the XRD patterns obtained from the Pd11B0.158 (alloy 2) and PdB0.163
(alloy 3) powders quenched from 800°C revealed the presence of 222lkh
fcc superstructure
reflections with odd h,k,l (Figure 4.6) as reported previously for 'Pd16B3' [5], and which are
also consistent with the C2/c (type 2) superstructure (as confirmed for this specimen by NPD,
see section 4.4.4.). This indicates that the quenching for these powder samples was not
sufficiently drastic; the quenched sample already reveals ordering of B, although splitting of
the fundamental reflections does not occur, i.e. the fundamental reflections can be indexed on
the basis of a fcc lattice with lattice parameter afcc; Pd6B in fact is monoclinic with 'true'
lattice parameters which can easily be calculated from afcc using the relations given in Table
4.2. Thus in the following the present form of the ordered Pd6B phase is designated as
pseudocubic.
Upon annealing this batch of quenched Pd11B0.158 powder for 70 h at 360°C or for 96
h at 280°C, according to the XRD analysis, decomposition into two apparently − according to
the fundamental reflections − face-centred cubic phases occurred: a majority high-B content
phase showing the same superstructure reflections as observed already for the sample
quenched from 800°C and a minority low-B content phase showing no superstructure
reflections. Thus it appears that low-B solid solution has precipitated from the initial ordered
Pd6B phase leading to a slight increase of the B content of the latter (which remains
56 Formation of the Pd6B phase
pseudocubic). Single peak fitting of selected fundamental reflection pairs, of the solid
solution phase and of the pseudocubic Pd6B phase (originating from the 111fcc, 200fcc, 220fcc,
311fcc and 222fcc reflections of the sample quenched from 800°C), provided the lattice
parameters of the fcc unit cells as well as the integrated intensities of the different reflections.
The mole fractions of the two phases (referring to formula PdBy) were then calculated
adopting that the mole fractions are proportional with the corresponding integrated
intensities8. This was done separately for the abovementioned five reflection pairs of the two
phases and the averaged results have been given in Table 4.4. The average B content of the
samples (PdB0.153 for the annealing at 280°C and PdB0.152 for the annealing at 360°C), as
calculated on the basis of the mole fractions and the B contents of the two phases, is close to
the expected value of the alloy Pd11B0.158 (Table 4.4).
0.25 0.30 0.35sinθ /λ (Å-1)
NPD PdB0.158
XRD PdB0.158
XRD PdB0.144
Inte
nsity
(a.u
.)
** ♦ ♦♦
200fcc 220fcc
Fig. 4.6. Part of the neutron (NPD) and X-ray powder diffraction (XRD) patterns of Pd11B0.158 (quenched from
800°C) and the XRD pattern of PdB0.144 (annealed for 70 h at 360°C; see also Figure 4.7), all in the range
between the 200fcc and 220fcc reflections. The patterns have been scaled and shifted in order to allow easier
comparison of the patterns. The 222lkh
fcc superstructure reflections with odd h, k, l have been indicated by stars
(*); further superstructure reflections have been indicated by diamonds (♦).
8 This is justified because the unit-cell volumes, the structure factors and the absorption coefficients are very similar for both phases.
Formation of the Pd6B phase 57
The XRD patterns recorded from the PdB0.144 powder (alloy 1) showed no
superstructure reflections after quenching from 800°C, indicating that the solid solution had
been fully retained. Upon annealing for 70 h at 360°C and 70 h at 280°C new weak
reflections and splitting of the fundamental reflections occurs. For both annealing
temperatures the reflection groups originating from the fundamental reflections of the solid
solution can be interpreted in terms of formation of a fcc low-B content solid solution phase
and an apparently face-centred tetragonal (fct) high-B content phase. The latter shows unsplit
fundamental reflections hhhfct (originating from 111fcc and 222fcc of the initial solid solution)
and split (doublets) hhlfct and lhhfct of intensity ratio 2:1 or 1:2 (originating from 200fcc, 220fcc,
311fcc, Figure 4.7). For both annealing temperatures the lattice parameter of the cubic low-B
content phase (depending on the annealing temperature, see Figure 4.7) largely corresponds
to that observed for the disordered low-B content phase that developed upon annealing of
Pd11B0.158 (see above and Table 4.4). The according to the fundamental reflections face-
centred tetragonal high-B content phase has cfct > afct; its B content is estimated on the basis
of Eq. (4.1) by substituting the lattice parameter afcc in Eq. (4.1) by (afct2×cfct)1/3. As for the
low-B content phase, the resulting B content of the pseudotetragonal Pd6B phase is about
equal to the one of the pseudocubic Pd6B phase (with superstructure of type 2) developing
upon annealing of Pd11B0.158 at the same annealing temperatures (see Table 4.4). TEM
analysis of PdB0.144 (alloy 1) annealed at 280°C indicated the presence of a two-phase state
with a disordered solid solution minority component and an ordered majority component
showing type 2 superstructure (see section 4.4.2.). Hence, it is concluded, that the two phases
observed by XRD are the same: the fcc low-B component is the disordered solid solution, and
the apparently face-centred tetragonal component is indeed the (same) monoclinic Pd6B
phase exhibiting now different lattice parameters (pseudotetragonal Pd6B) than the Pd6B
phase produced by annealing PdB0.158 (pseudocubic Pd6B). The pseudotetragonal unit cell
suggested by inspection of the fundamental reflections in the XRD patterns can be related to
the monoclinic supercell as described in Table 4.2 by choosing cfct = [001]fcc (afct = [100]fcc
and bfct = [010]fcc). The two other alternatives, cfct = [100]fcc and cfct = [010]fcc, would lead to
lattices with lattice parameters incompatible with monoclinic symmetry. In fact, if the
monoclinic lattice parameters for a type 2 superstructure (Table 4.2) are calculated on the
basis of the pseudotetragonal cell parameters and the choice cfct = [001]fcc, the weak
reflections observed in the XRD patterns of annealed PdB0.144 (alloy 1) can be indexed with
respect to this monoclinic cell; most of these superstructure reflections are observed (with the
58 Formation of the Pd6B phase
same Miller indices) in the XRD patterns of the pseudocubic Pd6B phase produced from
Pd11B0.158 (alloy 2). This confirms that indeed the pseudotetragonal Pd6B produced from
PdB0.144 (alloy 1) and the pseudocubic Pd6B produced from Pd11B0.158 (alloy 2) are different
manifestations of the same phase (see section 4.5.1.). Furthermore, the superstructures as
revealed for alloys 1 and 3 by electron diffraction are also the same as deduced from the
corresponding XRD patterns. It follows that the ordered Pd6B phase forming in all three
alloys is the same and of ordering type 2.
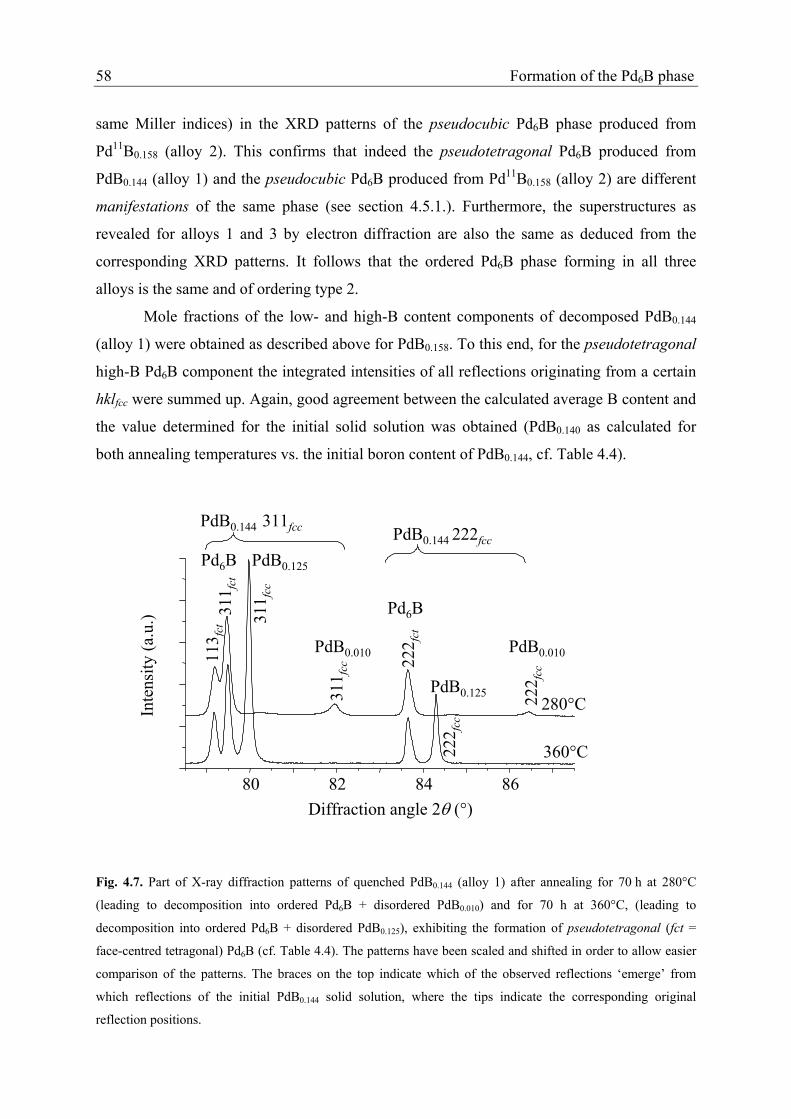
Mole fractions of the low- and high-B content components of decomposed PdB0.144
(alloy 1) were obtained as described above for PdB0.158. To this end, for the pseudotetragonal
high-B Pd6B component the integrated intensities of all reflections originating from a certain
hklfcc were summed up. Again, good agreement between the calculated average B content and
the value determined for the initial solid solution was obtained (PdB0.140 as calculated for
both annealing temperatures vs. the initial boron content of PdB0.144, cf. Table 4.4).
280°C
360°C
311 f
cc
PdB0.010
PdB0.144 311fcc PdB0.144 222fcc
PdB0.125
PdB0.125
Pd6B
Pd6B
Diffraction angle 2θ (°)
Inte
nsity
(a.u
.)
80 82 84 86
311 f
ct11
3 fct
222 f
ct
PdB0.010
311 f
cc
222 f
cc
222 f
cc
Fig. 4.7. Part of X-ray diffraction patterns of quenched PdB0.144 (alloy 1) after annealing for 70 h at 280°C
(leading to decomposition into ordered Pd6B + disordered PdB0.010) and for 70 h at 360°C, (leading to
decomposition into ordered Pd6B + disordered PdB0.125), exhibiting the formation of pseudotetragonal (fct =
face-centred tetragonal) Pd6B (cf. Table 4.4). The patterns have been scaled and shifted in order to allow easier
comparison of the patterns. The braces on the top indicate which of the observed reflections ‘emerge’ from
which reflections of the initial PdB0.144 solid solution, where the tips indicate the corresponding original
reflection positions.
Formation of the Pd6B phase 59
Table 4.4. Lattice parameters (measured by XRD at ambient temperatures) and mole fractions (referring to the
formula PdBy) of the high B component (ordered Pd6B) and low B component (disordered solid solution)
obtained by decomposing PdB0.144 (alloy 1) and Pd11B0.158 (alloy 2) both at 280°C and 360°C.
Annealing
temperature
(°C)
Annealing
time (h)
Calculated
composition of
low-B content
solid solution
phase using
Eq. (4.1)
Lattice
parameters of
Pd6B phase
afcc or afct, cfct
(Å)
Calculated
composition
using Eq.
(4.1)
Mole
fraction
Pd6B
Calculated average
B content yav of
the whole sample
starting material Pd11B0.158 (alloy 2, unsuccessfully quenched from 800°C, see section 4.4.3.)
280 a 96 PdB0.008 afcc= 4.0020(1)
pseudocubic
PdB0.160 0.95(1) 0.153(2)
360 70 PdB0.127 afcc= 4.0022(1)
pseudocubic
PdB0.160 0.75(0) 0.152(0)
starting material PdB0.144 (alloy 1, successfully quenched from 800°C, see section 4.4.3.)
280 a 70 PdB0.010 afct= 3.9971(2)
cfct= 4.0133(3)
pseudo-
tetragonal
PdB0.161 b 0.86(1) 0.140(4)
360 70 PdB0.125 afct= 3.9960(2)
cfct= 4.0146(2)
pseudo-
tetragonal
PdB0.160 b 0.42(1) 0.140(1)
a A small and broad residual hump in the X-ray powder patterns indicates the presence of some remaining parent
solid solution (see Figure 4.7). This is not considered here. b For the pseudotetragonal Pd6B phase the cubic root of the unit cell volume is taken as the lattice parameter in
Eq. (4.1); see text.
60 Formation of the Pd6B phase
4.4.4. Neutron diffraction; structure parameters of Pd6B
As compared to the corresponding XRD pattern taken at ambient temperatures, the NPD
pattern (Figure 4.6 and 4.8) of the Pd11B0.158 sample taken at 15 K9 shows much stronger
superstructure reflections relative to the intensities of the fundamental reflections: the effect
of ordering of B is more pronounced in NPD patterns because the scattering power of B is
higher than that of Pd in NPD (as can be expressed in terms of the coherent scattering
lengths; see Table 4.5), whereas for XRD the scattering power (expressed in terms of the
atomic form factors, or basically in terms of the number of electrons) is much smaller for B
than for Pd.
0.0
0.1
0.2
0.3
0.4
0.5
0.6
0.7
0.8
0.9
1.0 13965 COUNTS(o) 13229 COUNTS(c)
0.00.0
10.0 30.0 50.0 70.0 90.0 110.0 130.0 150.0
111 fc
c
200 fc
c 220 fc
c
Nor
mal
ised
inte
nsity
Diffraction angle 2θ (°)
Fig. 4.8. Rietveld refinement on the basis of the neutron diffraction pattern recorded at 15 K from the quenched
Pd11B0.158 sample after annealing for 5 min at 800°C (alloy 1): measured data points, calculated intensity profile
and difference curve. The reflection markers indicate reflection positions of diamond (top of marker bar), an
impurity (see section 4.3.1.) and of ordered Pd6B. Regions excluded from the refinement have been shaded; the
corresponding 2θ ranges 80-85° and 87-89° were excluded as well due to the accidental occurrence of electronic
interfering signals.
9 The low temperature compared to room temperature has no influence on the B ordering in the phase, the measurements were recorded at 15°K in the course of another investigation [4].
Formation of the Pd6B phase 61
In agreement with the XRD data (section 4.4.3.), the 222lkh
fcc superstructure reflections
with odd hkl are the strongest superstructure reflections. Additionally, peculiar broad
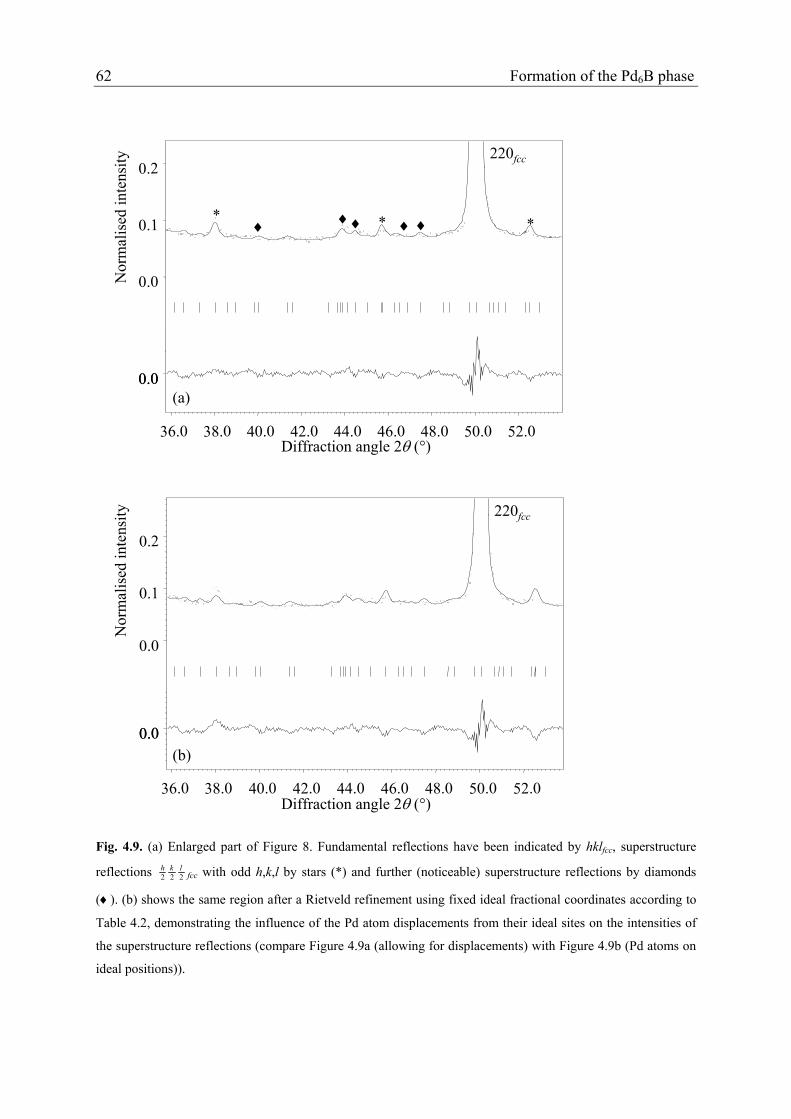
intensity humps occur in the NPD pattern (e.g. at about 2θ = 44°, Figure 4.9a). Rietveld
refinement was performed adopting ordering according to superstructure of type 2 (sections
4.4.2. and 4.4.3.). The monoclinic lattice parameters were taken consistent with the
pseudocubic lattice as indicated by the unsplit fundamental reflections in the NPD data (and
also in XRD data of the same specimen showing narrower reflections than the NPD data) by
fixing the ratios of am1, bm1, cm1 as well as by fixing the value of βm1 to 100.03° (Table 4.2).
Rietveld refinement was initially performed with the fixed fractional coordinates from Table
4.2 which already gives a reasonable fit to the experimental profile (Figure 4.9b), implying
that the above-mentioned intensity humps are superstructure reflections additional to the
indexed 222lkh
fcc reflections with odd hkl, and being thus characteristic for the superstructure
of type 2. In a next step refinement of the fractional coordinates of the Pd and B atoms led to
a significant improvement of the fits (Figure 4.9a), in particular to the superstructure
reflections, although considerable correlations occur between the refined fractional
coordinates, in particular for the Pd atoms. The final coordinates are listed in Table 4.6.
Comparison of the finally calculated diffraction pattern with the observed diffraction pattern
suggests that some superstructure reflections are relatively broad, whereas others are
relatively sharp (in particular the 222lkh
fcc reflections with odd hkl) (see 4.5.1.).
62 Formation of the Pd6B phase
0.0
0.1
0.2
0.00.0
36.0 38.0 40.0 42.0 44.0 46.0 48.0 50.0 52.0
♦ ♦♦ ♦♦* **
220fcc
Nor
mal
ised
inte
nsity
Diffraction angle 2θ (°)
(a)
0.0
0.1
0.2
0.00.0
36.0 38.0 40.0 42.0 44.0 46.0 48.0 50.0 52.0
Nor
mal
ised
inte
nsity
Diffraction angle 2θ (°)
220fcc
(b)
Fig. 4.9. (a) Enlarged part of Figure 8. Fundamental reflections have been indicated by hklfcc, superstructure
reflections 222lkh
fcc with odd h,k,l by stars (*) and further (noticeable) superstructure reflections by diamonds
(♦). (b) shows the same region after a Rietveld refinement using fixed ideal fractional coordinates according to
Table 4.2, demonstrating the influence of the Pd atom displacements from their ideal sites on the intensities of
the superstructure reflections (compare Figure 4.9a (allowing for displacements) with Figure 4.9b (Pd atoms on
ideal positions)).
Formation of the Pd6B phase 63
Table 4.5. Experimental details for the neutron powder diffraction data taken at 15 K from ordered Pd6B phase
powder of the composition Pd11B0.158 (alloy 2 powder quenched from 800°C), containing diamond impurities
from filing. Figure of merits for the performed Rietveld analysis have been indicated. For the refined fractional
coordinates of the Pd6B phase see Table 4.6.
wave length (Å) 1.1966
diffraction angle range used (°) 12-162
stepwidth (°) 0.05
excluded regions (°) a 80-85, 87-89
phase 1 Pd6B (composition Pd11B0.158)
space group C2/c
coherent scattering lengths [27],
b (barn)
Pd 11B
5.91
6.65
am1 (Å) = 26 afcc
bm1 (Å) 223 afcc
cm1 (Å) = 222 afcc
βm1 (°) arccos(-1/ 33 )
afcc (Å) b 3.99279(4) Å
fractional coordinates: see Table 4.6
phase 2 diamond
crystal system monoclinic
space group Fd 3 m
fractional coordinates: C 1/8 1/8 1/8
coherent scattering lengths [27],
b (barn)
C
6.646
a (Å) 3.56692(8)
weight fraction diamond 0.0082(3)
Rwp [34] 0.0569
RB [34] 0.0579
Rwp and RB with ideal fractional coordinates from Table 4.2:
Rwp = 0.0624; RB = 0.0746
a Due to accidental occurrence of interfering signals b The lattice parameters are restricted to be pseudocubic, so that afcc constitutes effectively the only refined
see Table 4.2) as obtained by Rietveld analysis of the neutron powder diffraction data taken at 15 K.
Atom Wyckoff site x=xid + δx b y=yid + δy b z=zid + δz b 2u (Å2)c occupancy
B 4e 0 0.0807(10) ¼ 0.0071(-) 0.954(-)d
Pd1 8f 0.125(3) 0.2507(7) 0.1200(6) 0.0026(1) 1
Pd2 8f 0.120(2) 0.5819(7) 0.1244(4) = ( )1Pd2u 1
Pd3 8f 0.128(3) 0.9104(7) 0.1223(4) = ( )1Pd2u 1
a Further details of the crystal structure investigation is available from the Fachinformationszentrum Karlsruhe,
D-76344 Eggenstein-Leopoldshafen, Germany (fax: +49-7247-808-666; email: [email protected]) on
quoting the depository number CSD-415013, the name of the author, and the citation of the paper. b The fractional coordinates are regarded as the sum of the ideal coordinates (see Table 4.2) modified by
displacements δx, δy, δz. c The atomic displacement parameter for B was fixed at the same value used for a series of PdBy alloys at 15 K
[14]. The atomic displacement parameters of Pd were assumed to be the same for the three different Pd sites. d The occupancy of the B site was fixed at the value expected from the composition Pd11B0.158 and the
assumption that all B is located on this site.
4.5. Discussion
4.5.1. The ordered arrangement of B in Pd6B
The here observed ordering pattern of B on the octahedral interstices of the ccp arrangement
of Pd atoms (superstructure of type 2) corresponds to that of vacancies on the octahedral
interstices of the ccp arrangement of V atoms in a superstructure reported for V6C5 [75].
The formation of superstructures of types 1-3, i.e. including the observed one of type
2 (see Figure 4.2), can be understood qualitatively considering repulsive pair interactions
B⋅⋅⋅B: The superstructure avoids the occurrence of (i) nearest neighbour B⋅⋅⋅B pairs (i.e.
avoids 'edge-sharing' Pd6B octahedra using the terminology of the Pauling rules [76], for
which d = 21/2/2afcc, where d is the distance between the pair of B atoms considered, if
distortions with respect to the initially disordered fcc structure are neglected) and of (ii) next-
nearest neighbour B⋅⋅⋅B pairs (i.e. avoids 'corner-sharing' Pd6B octahedra for which d = afcc).
This is realised by keeping each second layer of octahedral sites perpendicular to one [111]fcc
direction (i.e. [ 111 ]fcc in the Pd6B structure as given in Table 4.2) devoid of B atoms, whereas
Formation of the Pd6B phase 65
the other half of the octahedral layers is occupied by B with an (average) occupancy10 of 1/3
(Figure 4.2a). By this type of incorporation of B atoms into only each second layer of
octahedral sites, the occurrence of next-nearest neighbour pairs B⋅⋅⋅B is excluded.
Furthermore, a specific ordering of B atoms exists within the occupied layers, as indicated in
Figure 4.2b, ensuring that also no nearest-neighbour pairs B⋅⋅⋅B occur, and leads to the
occurrence of isolated [BPd6] (formally molecular) entities. The composition PdBy with
y = 1/6 is the one with the highest B content for which this is possible.
The superstructures of types 1-3 differ only in the way of stacking of the (partially)
occupied layers of octahedral interstices [68]. In all these superstructures nearest and next-
nearest neighbour B⋅⋅⋅B pairs are absent. The relative stability of the three superstructure
types is determined by (subtle) longer distance (pair-)interactions. This makes faulting in the
stacking sequence discussed likely. The occurrence of faulting is indeed suggested by the
diffraction streaks (see section 4.4.2.) along [ 111 ]fcc, i.e. parallel to the stacking direction of
the alternately (partly) occupied and unoccupied layers of octahedral sites; a similar
phenomenon was observed for V6C5 [78]. Moreover, the line-broadening of certain weak
superstructure reflections as observed in the NPD data (see section 4.4.4.) also suggests
faulting; see similar phenomena in NPD patterns observed for Nb6C5 (for which type 1
superstructure occurred) [79].
According to the fundamental reflections the average lattice of the Pd6B phase of the
Pd11B0.158 as quenched from 800°C is apparently not distorted: it is pseudocubic (cf. section
4.4.2.). This means that systematic overlap between inequivalent Bragg reflections occurs in
the NPD data, in particular for the fundamental reflections. Yet, the Rietveld refinement on
the basis of the NPD data is able to reveal (Table 4.6, and comparison of Figure 4.9a and b)
that shifts of the Pd and B atoms with respect to their ideal fractional coordinates occur
(Table 4.2). In the undistorted structure (as described by the ideal fractional coordinates (cf.
Table 4.2) using the refined pseudocubic lattice parameter afcc = 3.993 Å, (cf. Table 4.5) all
distances Pd − B within the isolated Pd6B entities would be afcc/2 = 1.996 Å. However, the
refined fractional coordinates indicate significantly larger Pd − B distances within these
entities ranging from 2.02(1) to 2.05(1) Å (Figure 4.2c). The angles B − Pdideal − Pd (where
Pdideal corresponds to Pd sites with the ideal fractional coordinates from Table 2) vary
between 138° and 166° for Pd1, Pd2 and Pd3, indicating that the displacements of the Pd
10 Note that complete occupation of the latter octahedral layers leads to the CdCl2-type structure as occurring for a couple of hemicarbides, M2C [38].
66 Formation of the Pd6B phase
atoms from their ideal sites occur largely radially away from the B atom (for purely radial
displacements the angle B − Pdideal − Pd would be 180°). For the disordered solid solution
such Pd atom displacements were observed and described in terms of a static displacement
contribution to the overall atomic displacement parameters [14]. The shortest Pd-B distances
in Pd6B, 2.02 to 2.05 Å (at 15 K), are about equal to or somewhat shorter than those observed
for other compounds with octahedral coordination of B by Pd, e.g. d(Pd-B) = 2.04 Å for
YbPd3B [80], 2.10-2.12 Å for Pd2B [81] or 2.13 Å for Li2Pd3B [82].
The displacements of the Pd atoms in Pd6B lead to Pd-Pd distances ranging from
2.74(1) to 2.91(1) Å (see Figure 4.10; the twelve nearest Pd neighbours of Pd1, Pd2 and Pd3
were considered, leading to 36 Pd-Pd pairs), whereas the Pd-Pd nearest neighbour distances
would be equal to afcc/21/2 = 2.82 Å for an undistorted ccp structure of Pd atoms with lattice
parameter afcc. As follows from the radial displacements of the Pd atoms surrounding
octahedrally a B atom, the Pd-Pd distances which form the edges of [BPd6] octahedra are the
longest nearest neighbour distances for Pd, i.e. all longer than 2.855 Å (12 distances, see
Figure 4.10), whereas the other ones (being edges of only unoccupied Pd6 octahedra) are
shorter than 2.855 Å (24 distances). The present observations concerning Pd-Pd nearest
neighbour distances agree well with results from EXAFS measurements on disordered
PdB0.16 [8]. The EXAFS signals were interpreted by fitting to the experimental data two
different shortest Pd-Pd distances of 2.782(5) Å and 2.897(5) Å, respectively, which are
smeared due to static displacements in a Gaussian fashion (see Figure 4.10). The distance of
2.897(5) Å was attributed to edges of Pd6 octahedra occupied by B, and the distance of
2.782(5) Å was attributed to edges of unoccupied Pd6 octahedra.
The observed deviations of the fractional coordinates of Pd in Pd6B from the
geometrically ideal ones can be understood recognising the relative large size of B with
respect to the size of the octahedral sites of Pd [11], as also evidenced by the strong
dependence of the lattice parameter of the PdBy solid solution on the B content, as given by
Eq. (4.1).
Formation of the Pd6B phase 67
2.8distance Pd-Pd (Å)
2.92.7
2
1
prob
abili
ty fr
eque
ncy
24 pairs 12 pairs
Fig. 4.10. Histogram showing the distribution of Pd-Pd distances shorter than 3 Å for the coordination spheres
of one Pd1, one Pd2 and one Pd3 atom in Pd6B. The 24 distances shorter than 2.855 Å (limit indicated by
dashed line) correspond to edges of empty Pd6 octahedra, whereas the 12 longer ones correspond to Pd6
octahedra occupied by B ([BPd6] entities). The arrows indicate the maxima of two Gaussian Pd-Pd distance
distributions located at 2.782(5) Å and 2.897(5) Å fitted to EXAFS data for Pd-Pd distances [8]. The standard
deviation ranges 2σ of these distance distributions have been indicated by horizontal bars.
Formation of the Pd6B phase from disordered PdB0.144 led to a considerably distorted,
pseudotetragonal lattice (according to the fundamental reflections), whereas Pd6B obtained
by the not sufficiently drastic quenching of Pd11B0.158 from 800°C is pseudocubic, and
remains pseudocubic even after annealing treatments comparable to those subjected to
PdB0.144. Although the observed lattice parameters of the Pd6B generated in these two ways
are different, the volumes of the pseudocubic and of the pseudotetragonal cells are practically
the same, and thus the estimated compositions are the same (see Table 4.4). Further, the
electron and X-ray diffraction evidence attained in this work demonstrates that the type of
ordering in both cases is also the same (superstructure of type 2).
The occurrence of the pseudocubic and pseudotetragonal manifestations for the same
Pd6B phase is a striking observation, because, if equilibrium occurs, at the same measuring
temperature, pressure and composition the same lattice parameters should occur for a
crystalline phase irrespective of the way of preparation. Hence, the occurence of different
lattice parameters for the same phase must have a microstructural origin. Due to the
monoclinic symmetry of the Pd6B phase usually anisotropic ordering strain [83], with respect
68 Formation of the Pd6B phase
to the original fcc solid solution, is expected, reflecting a long-range accumulation of the
local atomic displacements due to the ordering. If monoclinic domains are formed initially
coherently in an initially cubic crystallite, the ordering strain can be accommodated by a
special arrangement of ordered domains and/or elastic/plastic deformation. Possibly
remaining coherency stresses counteracting the ordering strain will elastically distort the
domains so that lattice parameters different from the equilibrium ones are measured.
Therefore, the different lattice parameters of the pseudocubic and of the pseudotetragonal
manifestations of Pd6B are likely due to their different domain microstructures caused by
different initial alloy compositions and thus different ‘ways’ of formation (section 4.5.2.).
Probably, neither the pseudocubic nor the pseudotetragonal manifestation exhibit the 'true'
(stress free) lattice parameters of ordered Pd6B (of the considered composition).
4.5.2. Consequences for the constitution of the binary system Pd-B
The experimental results presented in this work are compatible with a tentative phase
diagram for the Pd-B system (Pd-rich side) as proposed in Figure 4.11. The compositions of
the three PdBy alloys investigated have been indicated (Table 4.3). The composition PdB0.163
(alloy 3) apparently lies within the homogeneity range of the Pd6B phase, because it was
possible to transform the whole quenched sample into this phase upon annealing at 360°C
(section 4.4.2.). The same quenched alloy was analysed by DSC, which indicated that the
congruent transformation, ordered Pd6B →← disordered PdB1/6, occurs at about 440(5)°C
(section 4.4.1.).
Formation of the Pd6B phase 69
Pd6B
312°C
410°C
0.160y with respect to PdBy
Tem
pera
ture
(°C
)
440°C
280
360
0.05 0.10 0.15Pd
B0.
144
PdB
0.15
8Pd
B0.
163
Fig. 4.11. Proposed phase diagram of the Pd-B system (Pd-rich side) indicating the observed phases, their
respective compositions and the initial compositions of the alloys investigated in this work. The shaded region
indicates that upon moderately fast cooling of the PdBy solid solution in that range a homogeneous (ordered)
Pd6B phase (of unchanged B content) develops, which upon annealing decomposes by diffusion according to the
two-phase regions as indicated (see open circles).
The not sufficiently drastic quenching of Pd11B0.158 (alloy 2) led to, also, an
apparently homogeneous Pd6B phase (sections 4.4.3. and 4.4.4.). However, the Pd6B phase
with this composition is not stable at the annealing temperatures of 360°C and 280°C because
it is decomposed into the Pd6B phase with the composition PdB0.160 and a disordered PdBy
solid solution (of composition about PdB0.009 at 280°C and of composition about PdB0.126 at
360°C; Table 4.4). These results are compatible with the presence of a miscibility gap with a
critical temperature of 410°C and a monotectic temperature at 312°C adopting values as
given in Ref. [5].
Evidently, the ordered phase Pd6B is easily formed upon cooling by ordering of the B
atoms on the octahedral interstices of ccp Pd as suggested by the difficulties to retain the
solid solution upon quenching of the PdB0.163 (alloy 3) bulk material (end of section 4.4.1.)
and the relatively large powder batch of Pd11B0.158 (alloy 2, section 4.4.3. and 4.4.4.). Clearly,
the subsequent decomposition of the latter alloy upon annealing (into the ordered phase Pd6B
70 Formation of the Pd6B phase
of composition PdB0.160 and the solid solution PdBy of lower B content) requires much more
time at the same temperature since long-range diffusion is necessary.
The rapid formation of the ordered Pd6B phase from the solid solution even during
quenching has only been observed in a limited composition range below about y = 1/6, as
indicated in Figure 4.11 by the shaded region: the solid solution of the composition PdB0.144
could be retained easily (section 4.4.3.). Subsequent annealing of PdB0.144 produced the same
equilibrium phases as annealing of quenched Pd11B0.158. This suggests that the Pd6B phase
cannot be formed with the composition PdB0.144. Thus, in the PdB0.144 alloy, long-range
diffusion is required leading to the enrichment of B in parts of the alloy where the ordered
Pd6B phase develops (now in its pseudotetragonal form; see sections 4.4.2. and 4.4.3., and
Figure 4.5).
Because of coincidence of the lattice parameter of afcc = 4.005 Å of the apparently cubic
'Pd16B3' phase (PdB0.188) [5] with the value of afcc = 4.001-4.002 Å as observed for
pseudocubic Pd6B as generated from alloy 2 of the average compositions Pd11B0.158 (see
section 4.4.3.) and because of the compatibility of the superstructure reflections 222lkh
fcc with
odd hkl observed for the 'Pd16B3' phase with similar reflections observed in this work for the
Pd6B phase (exhibiting the superstructure of type 2) for compositions close to PdB1/6, it
seems very likely that both phases, in fact, are the same. The difference between the assigned
compositions − PdB0.188 [5] and PdB0.163 (this work) − probably originates from the different
methods used to assign compositions to alloys, and their possible systematic errors: The good
agreement of the reported lattice parameter values (see above), in fact, suggests that the
composition of 'Pd16B3' from Ref. [5] in reality is close to the composition of the presently
observed Pd6B phases. In this context, it must be mentioned that in the present work all
compositions, of both the solid solution phase and the Pd6B phase were obtained by
application of Eq. (4.1), which was determined on the basis of measured lattice parameters of
an extensive series of PdBy solid solution samples and chemical analyses of the
corresponding samples [11]. In Ref. [5] a different equation was used11. Finally, in any case
the occurrence of an ordering pattern based on the avoidance of nearest-neighbour and next-
nearest-neighbour B⋅⋅⋅B pairs (leading to isolated Pd6B entities) strongly suggest that the B
content in the Pd6B phase cannot be higher than as indicated by PdB1/6.
11 A considerable lattice volume shrinkage of ∆V/V = 0.75 % was reported [6] to occur upon ordering. The present data cannot confirm this due to the lack of solid solution lattice parameters for these alloys. Yet the good consistency of the B considerations in Table 4.4 and section 4.4.3. seem to contradict the magnitude of this shrinkage.
Formation of the Pd6B phase 71
4.6. Conclusions
(i) The crystal structure of the Pd6B phase can be described as a superstructure variant of the
PdBy solid solution with fcc arrangement of Pd and B on the octahedral interstices. The
observed occupational ordering pattern (space group C2/c) of the B atoms avoids the
occurrence of nearest and next-nearest neighbour pairs B⋅⋅⋅B. The crystal structure can be
regarded as built from "isolated" BPd6 entities, conserving the basic cubic close-packed
arrangement of Pd. The same ordering pattern as observed for the B atoms in Pd6B 5 has
been observed previously for vacancies in defect-NaCl type V6C5 in which V takes the
places of Pd, C those of , and those of B.
(ii) The same ordered Pd6B phase can occur, for the same composition, in different
manifestations with respect to its lattice parameters, a pseudocubic one, which forms upon
direct formation of B ordering from the solid solution which has the same composition as the
Pd6B phase, and a pseudotetragonal one, which forms when the Pd6B precipitates from a
(quenched) solid solution of significantly lower B content than the Pd6B phase.
(iii) The phase equilibria between the ordered Pd6B phase and the disordered PdBy solid
solution of (much) lower B content have been established.
72 Formation of the Pd6B phase
Appendix toChapter 4 Table A1. Idealised structure parameters for the type 1 superstructure candidate for Pd6B:
than or equal to PdB0.167 are pseudocubic, i.e. the fundamental reflections of the cubic
fcc solid solution did not split up upon ordering according to XRD, although the
symmetry of the B ordering observed by electron diffraction is monoclinic. For this
range of original compositions (e.g. PdB0.163 and Pd0.158, assigned according to Eq.
(5.3)) quenching turned out to be difficult, i.e. the long-range-order of the Pd6B phase
is easily formed. For PdB0.158 the homogeneous Pd6B phase obtained upon quenching
decomposes only upon annealing at 280°C and 360° into low-B content solid solution
enriching the Pd6B-phase in B content, while it remains pseudocubic.
• Pd6B could also be obtained as a pseudotetragonal form (i.e. in XRD pattern the
fundamental reflections of the cubic fcc solid solution are split as expected for a
tetragonal lattice, while the B ordering is the same monoclinic one as observed for the
pseudocubic form). This situation was observed when solid solution of significantly
lower B content than PdB0.167 (e.g. PdB0.144), which is easily retained by quenching, is
annealed at 280°C or 360°C (cf. Ref. [17]). These annealing treatments give
apparently the same two-phase equilibria with low-B content solid solution produced
from PdB0.158 (see above). The only difference is the occurrence of a
pseudotetragonal form for Pd6B produced from PdB0.144 and of a pseudocubic form
for Pd6B produced from PdB0.158. The compositions of these two forms of Pd6B in the
corresponding two-phase equilibria were estimated to be the same on the basis of the
unit cell volumes.
This phenomenon (pseudocubic vs. pseudotetragonal) was ascribed to the way of formation
of the ordered phase from the solid solution. The ease to form the abovementioned
arrangement of [BPd6] octahedra depends clearly on the composition of the initial solid
solution, the closer to the composition Pd6B, the easier the Pd6B is formed. Whereas for the
composition PdB0.158 it is still possible upon quenching to form the homogeneous Pd6B
(which however decomposes upon annealing as described above), for PdB0.144 this was not
possible; only decomposition of the solid solution involving long-range diffusion allows
formation of Pd6B. This causes different microstructures which influence the possible
distortion of the Pd host lattice.
82 The Pd-rich part of the Pd-B phase diagram
80 82 84 86
311 f
cc
PdB0.010
311fcc 222fcc
Pd6BPd6B
Diffraction angle 2θ (°)
Inte
nsity
(a.u
.)
311 f
ct
113 f
ct
222 f
ct
PdB0.010
311 f
cc
222 f
cc22
2 fcc
311 f
cc
222 f
cc
pseudotetragonalfrom PdB0.144
pseudocubicfrom PdB0.158
Figure 5.3. X-ray powder diffraction patterns of PdB0.144 and PdB0.158 alloys after annealing at 280°C for 70 h
and for 3 weeks, respectively, in the two phase area below the monotectic temperature showing the expected
decomposition into the Pd6B phase and the fcc solid solution phase of a composition PdB0.010. For initial
compositions close to Pd6B such as PdB0.158, the Pd6B phase appears as a pseudocubic form, for lower B
contents such as PdB0.144 the exhibited reflection splitting is pseudotetragonal.
5.4.2. ‘Pd5B’ phase:
The apparently tetragonally distorted Pd5B phase, decomposing upon heating at about 385°C
has been suggested [12] to be identical with Pd16B3 [5]. This is not the case. Instead the Pd5B
phase is probably identical with the previously reported Pd~5B [19], occurring at somewhat
higher boron contents than Pd6B. Recent X-ray and neutron powder diffraction as well as
electron diffraction experiments have shown that the ‘Pd5B’ phase exhibits a monoclinic
crystal symmetry with an incommensurately modulated occupation of the octahedral sites by
B [19]. The main structural properties can be described by a commensurate approximant
structure having the ideal composition Pd5B which is isostructural with UCl5 (with space
group P21/n) [61], and with Pd and B taking the roles of Cl and U, respectively. This results
in a fcc arrangement of Pd atoms with 1/5 of the octahedral sites occupied by B in an ordered
fashion. The ordering pattern of B is associated with the occurrence of nearest-neighbour
The Pd-rich part of the Pd-B phase diagram 83
B⋅⋅⋅B pairs on the sublattice formed by the octahedral sites. This arrangement of nearest
neighbour B⋅⋅⋅B pairs can also be conceived as edge-sharing of [BPd6] octahedra which
results in [B2Pd10] entities (Figure 5.4b).
Whereas in the superstructure of Pd6B, isolated [BPd6] octahedral entities can be
discerned, i.e. nearest and next-nearest neighbour B⋅⋅⋅B pairs do not occur, such B⋅⋅⋅B pairs
unavoidably must occur for higher B contents (maintaining mostly the fcc Pd arrangement).
This could in principle be realised by the occurrence of either only nearest or only next-
nearest neighbours B⋅⋅⋅B. The ‘Pd5B’ structure reveals that the former occurs (B⋅⋅⋅B distance:
22 afcc), whereas the latter is prevented. The avoidance of next nearest B⋅⋅⋅B pairs can be
qualitatively understood as follows. Edge-sharing of [BPd6] octahedra (Figure 5.4b) is
energetically favourable compared to corner-sharing of [BPd6] octahedra (Figure 5.4c): An
interstitial B atom expands the surrounding Pd octahedron in order to increase the relatively
short B-Pd distances [8, 17]. The vectors describing these Pd atom displacements add up for
edge-sharing [BPd6] octahedra (Figure 5.4b) such that sideways displacement occurs of the
Pd atoms forming the common edge. For corner-sharing [BPd6] octahedra these
displacements would cancel each other, and the desired larger Pd-B distances cannot be
realised, thereby making this configuration energetically unfavourable (Figure 5.4c, see also
Ref. [19]).
84 The Pd-rich part of the Pd-B phase diagram
a) Pd
B
b)
c)
Figure 5.4. A single (a) and pairs of edge- (b) and corner-sharing (c) [BPd6] octahedra. The directions of these
displacements of the Pd atoms caused by the presence of the B atoms on the octahedral interstitial site have been
indicated.
The monoclinic ordering of B in the ‘Pd5B’ phase is evidenced by characteristic
splitting of the fundamental reflections in the X-ray diffraction patterns (i.e. the reflections
which were already visible for the solid solution phase) [19]. This splitting was interpreted
previously due to lesser instrumental resolution falsely in terms of a tetragonally distorted
structure with cfct < afct [12]. The structure has now been investigated in detail by TEM on a
single-phase sample with a composition PdB0.184 (annealed for 256h at 360°C). The deviation
from the ideal composition (PdB0.184 vs. PdB1/5) can be conceived as an ordered mixed
occurrence of [B2Pd10] entities (Figure 5.4b) and of isolated [BPd6] entities (Figure 5.4a).
Different compositions, i.e. different ratios of [B2Pd10] entities of edge-sharing octahedra and
[BPd6] entities of isolated octahedra, lead to a composition-dependent modulation vector
adjusting the crystal structure to composition by increasing upon lowering the B content, the
number of [BPd6] units in a systematic fashion, which permits a homogeneity range of the
The Pd-rich part of the Pd-B phase diagram 85
ordered ‘Pd5B’ phase14 [19]. In fact, the structure found for incommensurate ‘Pd5B’ of the
assigned composition PdB0.184 is very close to an idealised model structure of the
composition PdB0.1875 which can be regarded as [B2Pd10]·[BPd6] ≡ Pd16B3, i.e. with a 1:1 ratio
of [B2Pd10] entities and [BPd6] entities.
All observed/reported low-temperature phases demonstrate only slight monoclinic
distortions of the fcc Pd host lattice (or none at all as for pseudocubic form of Pd6B). Yet, the
observed boron ordering allows a multitude of similar structures built from [B2Pd10] and/or
[BPd6] entities for a given composition (e.g. possible alternative superstructures for Pd6B
[17]). Indeed, hints of at least one additional yet unresolved low-temperature phase have been
observed by TEM analysis performed by the present authors as a two-phase mixture (PdB0.193
annealed for 3 weeks at 350°C) with ‘Pd5B’ (closer to ideal PdB1/5 than ‘Pd5B’ mentioned
above of the composition PdB0.184). Hence, although it is claimed that all reported data until
now can be ascribed to the described Pd6B and ‘Pd5B’ phases, it cannot be excluded that
more ordered phases have still to be discovered.
Table 5.1. Overview of the low-temperature phases Pd6B and ‘Pd5B’, together with phases as reported in the
literature which, according to this work, are identical to either of the Pd6B or ‘Pd5B’ phases:
New phase denominations Previous phase denomination
Pd6B [17]: monoclinic C2/c,
pseudotetragonal and pseudocubic,
Vfcc= (4.002 - 4.004Å)3
- Pd16B3: cubic, superstructure hints at a’=2afcc [5],
Vfcc= (4.005Å)3
- Pd~6B [10], only indicated in phase diagram
‘Pd5B’ [19]: monoclinic incommensurate,
close to P21/n
- Pd16B3, Pd5B [12]
tetragonally distorted with cfct < afct
- Pd~5B [10], only indicated in phase diagram
14 This phase is denoted as ‘Pd5B’ (i.e. between quotes) due to its deviation from the ideal UCl5 structure prototype with respect to composition and commensurability.
86 The Pd-rich part of the Pd-B phase diagram
Table 5.2. Pd-B phase crystal structure data: the solid solution and the low-temperature phases.
phase composition range y
(atomic ratio)
Pearson
symbol
space group structure
prototype
reference
PdBy 0 to 0.25 cF(4+4y) a Fm 3 m Cu [8, 10, 14] b
Pd6B 0.160-0.164 c mC28 C2/c V6C5d [17]
‘Pd5B’ 0.184 e mP24 f P21/n f UCl5 [19] a (4+4y) denotes the presence of 4 Pd atoms and 4 y B atoms per unit cell. b Maximal solubility limit taken from Ref. [10]. c Upper solubility limit not determined precisely, probably close to 0.167. d denotes a vacancy, which is on the site of the boron atom in Pd6B; the C atom positions are vacancies in the
Pd6B structure. e Uncertain homogeneity range.
f Approximant structure; crystal structure in fact is incommensurate.
5.5. Conclusions for the phase diagram
On the basis of the evaluation given in this paper, an updated tentative phase diagram of the
Pd-B system is presented in Figure 5.5. The results from Ref. [4] (Figure 5.1a) for the range
of the miscibility gap have been confirmed by the recent data, whereas for the low-
temperature phases the findings from Ref. [10] (Figure 5.1b) seem to apply as evidenced by
the new, much more detailed data from Refs. [17, 19]. It has been found that both the Pd6B
and the ‘Pd5B’ phase are monoclinic (Table 1). The shaded regions indicate observed
features, which in the previous works often led to confusion:
I. Miscibility gap: the location of the boundary phase compositions are approximate due
to the incomplete demixing into two solid solution phases and the apparent
dependence of the ‘final’ state from the initial composition (coherency strains may
play a role). The compositions assigned to these phases may differ due to the use of
different available expressions, such as Eqs. (5.1-5.3), to relate the composition to the
lattice parameter.
II. For initial compositions in the range of the miscibility gap, observation of so-called
‘three phase samples’ (cf. Chapter 5.3) has been confirmed for the indicated
temperatures. Therefore, the exact location of the monotectic temperature of 312°C
could not be confirmed unequivocally.
The Pd-rich part of the Pd-B phase diagram 87
III. In this range of slightly lower boron contents than Pd6B, ordering upon cooling from
the solid solution phase field resulted in pseudocubic Pd6B; Pd6B phase developing
from the quenched solid solution with y < 0.15 is pseudotetragonal and exhibits the
same B ordering as pseudocubic Pd6B.
IV. The homogeneity ranges of the low-temperature phases, in particular ‘Pd5B’, were
approximated. The latter is probably not stoichiometric as suggested in Ref. [10]. The
occurrence of additional low-temperature phases cannot be excluded.
Pd6B
y with respect to PdBy
Tem
pera
ture
(°C
)
440°C
300
400
0.05 0.10 0.15 0.20
‘Pd5B’
IV
III
II
I
Figure 5.5. Phase diagram showing the miscibility gap corresponding to Ref. [4] and the low-temperature
phases corresponding to Ref. [10]. The shaded areas labelled with Roman numbers refer to particular regions in
this phase diagram referred to in section 5.5.
6.
Zusammenfassung der Dissertation in deutscher Sprache
90 Zusammenfassung
6.1. Einleitung
Die einzigartigen Eigenschaften des palladiumreichen Mischkristalls motivierten eine große
Zahl von Untersuchungen im System Pd-B, in denen es als Modelsystem für interstitielle
Legierungen angesehen wurde. Diese widmeten sich insbesondere der Kristallstruktur [1-5,
11, 12], den thermodynamischen Eigenschaften [4, 6, 86] und der Diffusion von B in Pd [23,
24] oder von H im Mischkristall PdBy [7]. Hinsichtlich gewisser Schlüsselmerkmale stimmen
alle neueren Veröffentlichungen überein [4, 5, 8-12]:
- Pd löst bei Temperaturen über 450°C bis zu ca. 20 Atom-% B (PdB~0.25). B besetzt die
Oktaederlücken im kubisch flächenzentrierten Palladiumgitter interstitiell ohne
Ausbildung von Fernordnung. Dieser Mischkristall ist eine Hochtemperaturphase,
bleibt jedoch bei rascher Abkühlung auf Raumtemperatur erhalten15.
- Durch Aufnahme von B wird das Palladiumgitter stark aufgeweitet, klar ersichtlich
durch die signifikante, weitgehend lineare Zunahme des kubischen Gitterparameters
afcc mit dem Borgehalt (vgl. Eq. (5.1-5.3)).
- Unter 450°C existieren im Bereich zwischen 0.02 < y < 0.11 eine Mischungslücke
und im Bereich zwischen 0.16 < y < 0.20 eine oder mehrere Tieftemperaturphasen, in
denen die Kristallstruktur von Palladium größtenteils erhalten bleibt.
Speziell hinsichtlich der Konstitution des Systems und der Struktur der Tieftemperaturphasen
existieren Widersprüche in der Literatur. Mittels eines kombinierten Einsatzes von Röntgen-,
Neutronen- und besonders Elektronenbeugung als komplementäre Methoden zur
Strukturanalyse konnte die Kristallstrukturen zweier Tieftemperaturphasen identifiziert
werden [17-19]. Diese neuen Ergebnisse erlaubten eine Überarbeitung des Phasendiagramms
Pd-B im Tieftemperaturbereich.
6.2. Experimentelles
Die verwendeten Legierungen wurden durch mehrfaches Aufschmelzen abgewogener
Mengen Pd und B im Lichtbogenofen unter einer schützenden Argonatmosphäre
15 Messungen innerer Reibung bei Raumtemperatur suggerieren einen Zerfall abgeschreckter Legierungen mit 0.3 bis 2 Atom-% B im Zeitraum von Monaten, was auf eine gewisse Mobilität von B auch bei Raumtemperatur hindeutet. Andere Meßmethoden konnten derartige Beobachtungen bisher nicht bestätigen.
Zusammenfassung 91
hergestellt16. Dabei traten kleinere Gewichtsverluste und Abweichungen von den
eingewogenen Zusammensetzungen auf. Die Homogenität der Reguli wurde durch
Röntgenographie mittels Messung des Gitterparameters überprüft. Die Zusammensetzung der
Probe wurde dann anhand von
a0 (Å)= 3.8920 + 0.6882 y (6.1)
bestimmt [11] und auch zur weiteren Bezeichnung der Probe als PdBy verwendet. Die
Pulverproben wurden mit einer Diamantfeile üblicherweise an Ober- und Unterseite der
Reguli abgefeilt, da dort die größten Zusammensetzungsunterschiede zu erwarten waren. Das
erhaltene Pulver wurde nach mehrmaligem Argonspülen unter Vakuum in Quartzkapillaren
eingeschmolzen und für 5 min auf 800°C erhitzt, danach wurde die geschlossene Kapillare in
Wasser abgeschreckt. Diese Wärmebehandlung wurde bei allen Proben durchgeführt, um
durch das Feilen entstandene Spannungen im Material zu beseitigen. Inhomogene Proben
wurden nochmals aufgeschmolzen, bis zufriedenstellende Homogenität erreicht worden war.
Für die durchgeführten strukturellen und thermischen Untersuchungen wurden Pulver
und Stücke der Gußproben verwendet. Die Pulverproben wurden wie bei den
Homogenitätstests hergestellt, die Gußproben wurden durch Diamantsägen oder
Funkenerosion vom Regulus getrennt, gesäubert, spannungsfreigeglüht, und für die
Elektronenbeugungsexperimente durch Polieren und Ionendünnen (letzteres unter Kühlung
mit flüssigem Stickstoff) weiterpräpariert (Details siehe Kapitel 4.3. des englischsprachigen
Teils). Für etwaige weitere Wärmebehandlungen wurden die massiven oder pulverförmigen
Proben wieder wie oben eingeschmolzen und nach dem Temperaturprogramm in Wasser
abgeschreckt, bei den Gußproben wurde dabei die Quartzkapillare zerbrochen.
Die derartig hergestellten und teilweise ausgelagerten Proben wurden mit folgenden
Messmethoden untersucht (Details im englischsprachigen Teil):
- Röntgenbeugung wurde zur Untersuchung von Phasenumwandlungen bei weiteren
Wärmebehandlungen (z.B. Entmischung, Ordnungsbildung) und zur
Charakterisierung der gebildeten Zustände verwendet.
- Transmissionselektronenmikroskopie und Elektronenfeinbereichsbeugung wurde für
Mikrostrukturuntersuchungen und zur Identifikation der Überstrukturen der
Tieftemperaturphasen durchgeführt. 16 Genauere Angaben zu Herstellern und Reinheit der verwendeten Ausgangsmaterialien sowie zur Verwendung des Isotops 11B für die Neutronenbeugungsexperimente finden sich im englischsprachigen Teil dieser Arbeit.
92 Zusammenfassung
- Neutronenpulverdiffraktometrie wurde zu zuverlässigen Messungen der Bragg-
Intensitäten eingesetzt und auch zur genauen Bestimmung des Beitrags der Boratome
zur gebeugten Intensität. Ersteres war bei der Bestimmung der statischen
Auslenkungen der Palladiumatome im Mischkristallbereich vonnöten, letzteres bei
der quantitativen Analyse der Überstrukturen in den Tieftemperaturphasen. Die
Neutronendiffraktogramme wurden mit Hilfe der Rietveldmethode ausgewertet.
- DSC (Differential Scanning Calorimetry)-Messungen wurden zur Überprüfung von
Phasenübergangstemperaturen eingesetzt. Außerdem wurde damit der Erfolg des
Abschreckens des Mischkristalls überprüft (siehe 4.4.1. im englischsprachigen Teil).
6.3. Neutronenbeugung: Statische Auslenkungen der Palladiumatome im
PdBy-Mischkristall (0 < y < 0.2)
Das Palladiumgitter wird durch die interstitielle Aufnahme von B ungewöhnlich stark
aufgeweitet. Diese Aufweitung lässt große statische Auslenkungen der Palladiumatome von
ihren idealen Gitterpositionen in der Umgebung um ein interstitielles Boratom erwarten.
Dieses sollte sich in Beugungsexperimenten als eine Abschwächung der Bragg-Intensitäten in
Form eines sogenannten statischen Debye-Waller-Faktors, insbesondere bei hohen
Beugungswinkeln, auswirken. Für substitutionelle und interstitielle Mischkristalle ist ein
Zusammenhang zwischen der mittleren quadratischen Auslenkung der Palladiumatome <u2>
von der Zusammensetzung y und dem sogenannten volume size factor Ωsf hergeleitet worden
[13].
<u2(y)> ~ · y·(1 − y) mit 2sfΩ
( )sf
0
ln
y
V yy
Ω=
∂= (6.2)
∂
Für die Untersuchung dieser statischen Auslenkungen wurde Neutronenbeugung
verwendet, da bei dieser Messmethode im Vergleich zur Röntgenbeugung keine
Beugungswinkelabhängigkeit des atomaren Streufaktors auftritt und wegen geringerer
Störeffekte (z.B. Absorption) die gebeugte Intensität zuverlässiger gemessen werden kann. Es
wurde eine Reihe von PdBy-Legierungen (mit y = 0.05, 0.100, 0.184) bei 15 K und 300 K
untersucht. Die thermischen Auslenkungen von Pd wurden durch den
Auslenkungsparameters von reinem Pd angenähert; für die PdBy-Legierungen wurde im
Vergleich zum reinen Pd ein signifikanter Anstieg des statischen Auslenkungsparameters
gemessen, der für beide Messtemperaturen ähnlich groß war. Allerdings war keine weitere
Zusammenfassung 93
nennenswerte Zusammensetzungsabhängigkeit von <u2> zu erkennen, wie z.B. gemäß
Gl. (6.2) zu erwarten wäre. Ein Vergleich mit verfügbaren Daten zu isotypen,
nichtstöchiometrischen Übergangsmetallkarbiden und –nitriden ergab einerseits, dass die
gemessenen Auslenkungsparameterwerte für die Palladiumatome gemessen am Volume size
factor ungewöhnlich klein sind und andererseits, dass generell die Größe der statischen
Auslenkungen nicht mit der Größe des volume size factor skaliert sind (vgl. Abb. 6.1). Dieses
steht im Gegensatz zu substitutionellen Mischkristallen, bei denen Gleichung (6.2) für