Environmental life cycle comparison of polyhydroxyalkanoates produced from renewable carbon resources by bacterial fermentation Minoru Akiyama a , Takeharu Tsuge a , Yoshiharu Doi a,b, * a SORST Group of Japan Science and Technology Corporation (JST), Department of Innovative and Engineered Materials, Tokyo Institute of Technology, 4259 Nagatsuta, Midori-ku, Yokohama 226-8502, Japan b Polymer Chemistry Laboratory, RIKEN Institute, 2-1 Hirosawa, Wako-shi, Saitama 351-0198, Japan Received 10 October 2002; accepted 15 November 2002 Abstract Large-scale fermentative production of poly(3-hydroxybutyrate-co-5mol% 3-hydroxyhexanoate) [P(3HB-co-5mol% 3HHx)] from soybean oil as sole carbon source is simulated using a recombinant strain of Ralstonia eutropha harboring a poly- hydroxyalkanoate (PHA) synthase gene from Aeromonas caviae. Its production costs, life cycle inventories (LCI) of energy con- sumption and carbon dioxide emissions from the cradle-to-factory gate are calculated and compared with the counterparts for microbial production of poly(3-hydroxybutyrate) [P(3HB)] from glucose as sole carbon source. In addition, the values of bio-based polymers are compared with those of petrochemical polymers. Annual production of 5000 tonnes of P(3HB-co-5mol% 3HHx) is estimated to cost from 3.5 to 4.5 US$/kg, depending on presumed production performances. Similar scale production of P(3HB) from glucose is estimated to cost 3.8–4.2 US$/kg. In contrast to the comparable production costs between P(3HB-co-5mol% 3HHx) and P(3HB), life cycle inventories of energy consumption and carbon dioxide emissions favor the former product over the latter, reflecting smaller inventories and higher production yields of soybean oil compared to glucose. The life cycle inventories of energy consumption and carbon dioxide emissions of bio-based polymers are markedly lower than those of typical petrochemical polymers. # 2003 Elsevier Science Ltd. All rights reserved. Keywords: Polyhydroxyalkanoates; Bio-based polymers; Renewable carbon sources; Production cost; Life cycle inventory; CO 2 emissions 1. Introduction A family of polyhydroxyalkanoates (PHA) including poly[(R)-3-hydroxybutyrate] [P(3HB)] as mother poly- mer has been a research focus since the oil crisis in the nineteen-seventies. In general, they are considered environmentally friendly because they are biodegrad- able, leaving no troublesome waste in time and because they are not produced from petrochemicals but from renewable natural resources such as glucose, sucrose and vegetable-oil derivatives. Around 1990, two industrial processes were developed for bacterial (fermentation) production of poly(3-hydroxybutyrate-co-3-hydro- xyvalerate) [P(3HB-co-3HV)] from a mixture of glucose and propionic acid by ZENECA BioProducts at Bill- ingham (UK) [1] and for fermentation production of P(3HB) from sucrose by Chemie Linz GmbH (Austria) [2], respectively. However, they have not yet been suc- cessful commercially. There seems to be two challenging subjects for indus- trial production of microbiol PHA polymers, especially copolymers containing 3HB as major constituent. One is to gain cost competitiveness of the bio-based poly- mers against petrochemical-based common polymers such as polyethylene, polypropylene or polystyrene. The other is to verify or support environmental friendliness of the bio-based polymers with evidence on the basis of technological progress in the production process, con- sidering the recent papers by Gerngross [3] and Gern- gross and Slater [4] which have suggested that PHA may not necessarily be environmentally friendly in view of fossil fuel consumption. Concerning the first subject, 0141-3910/03/$ - see front matter # 2003 Elsevier Science Ltd. All rights reserved. doi:10.1016/S0141-3910(02)00400-7 Polymer Degradation and Stability 80 (2003) 183–194 www.elsevier.com/locate/polydegstab * Corresponding author. Tel.: +81-45-924-5420; fax: +81-45-924- 5426. E-mail address: [email protected] (Y. Doi).
Transcript
Environmental life cycle comparison of polyhydroxyalkanoatesproduced from renewable carbon resources by
bacterial fermentation
Minoru Akiyamaa, Takeharu Tsugea, Yoshiharu Doia,b,*aSORST Group of Japan Science and Technology Corporation (JST), Department of Innovative and Engineered Materials,
Tokyo Institute of Technology, 4259 Nagatsuta, Midori-ku, Yokohama 226-8502, JapanbPolymer Chemistry Laboratory, RIKEN Institute, 2-1 Hirosawa, Wako-shi, Saitama 351-0198, Japan
Received 10 October 2002; accepted 15 November 2002
Abstract
Large-scale fermentative production of poly(3-hydroxybutyrate-co-5mol% 3-hydroxyhexanoate) [P(3HB-co-5mol% 3HHx)]from soybean oil as sole carbon source is simulated using a recombinant strain of Ralstonia eutropha harboring a poly-
hydroxyalkanoate (PHA) synthase gene from Aeromonas caviae. Its production costs, life cycle inventories (LCI) of energy con-sumption and carbon dioxide emissions from the cradle-to-factory gate are calculated and compared with the counterparts formicrobial production of poly(3-hydroxybutyrate) [P(3HB)] from glucose as sole carbon source. In addition, the values of bio-based
polymers are compared with those of petrochemical polymers. Annual production of 5000 tonnes of P(3HB-co-5mol% 3HHx) isestimated to cost from 3.5 to 4.5 US$/kg, depending on presumed production performances. Similar scale production of P(3HB) fromglucose is estimated to cost 3.8–4.2 US$/kg. In contrast to the comparable production costs between P(3HB-co-5mol% 3HHx) and
P(3HB), life cycle inventories of energy consumption and carbon dioxide emissions favor the former product over the latter, reflectingsmaller inventories and higher production yields of soybean oil compared to glucose. The life cycle inventories of energy consumptionand carbon dioxide emissions of bio-based polymers are markedly lower than those of typical petrochemical polymers.
# 2003 Elsevier Science Ltd. All rights reserved.
Keywords: Polyhydroxyalkanoates; Bio-based polymers; Renewable carbon sources; Production cost; Life cycle inventory; CO2 emissions
1. Introduction
A family of polyhydroxyalkanoates (PHA) includingpoly[(R)-3-hydroxybutyrate] [P(3HB)] as mother poly-mer has been a research focus since the oil crisis in thenineteen-seventies. In general, they are consideredenvironmentally friendly because they are biodegrad-able, leaving no troublesome waste in time and becausethey are not produced from petrochemicals but fromrenewable natural resources such as glucose, sucrose andvegetable-oil derivatives. Around 1990, two industrialprocesses were developed for bacterial (fermentation)production of poly(3-hydroxybutyrate-co-3-hydro-xyvalerate) [P(3HB-co-3HV)] from a mixture of glucose
and propionic acid by ZENECA BioProducts at Bill-ingham (UK) [1] and for fermentation production ofP(3HB) from sucrose by Chemie Linz GmbH (Austria)[2], respectively. However, they have not yet been suc-cessful commercially.There seems to be two challenging subjects for indus-
trial production of microbiol PHA polymers, especiallycopolymers containing 3HB as major constituent. Oneis to gain cost competitiveness of the bio-based poly-mers against petrochemical-based common polymerssuch as polyethylene, polypropylene or polystyrene. Theother is to verify or support environmental friendlinessof the bio-based polymers with evidence on the basis oftechnological progress in the production process, con-sidering the recent papers by Gerngross [3] and Gern-gross and Slater [4] which have suggested that PHA maynot necessarily be environmentally friendly in view offossil fuel consumption. Concerning the first subject,
0141-3910/03/$ - see front matter # 2003 Elsevier Science Ltd. All rights reserved.
doi:10.1016/S0141-3910(02)00400-7
Polymer Degradation and Stability 80 (2003) 183–194
Lee and Choi [5] estimated the production cost ofP(3HB) on a huge scale of 100,000 tonnes per year as2.6 US$/kg, based on the best experimental data ofP(3HB) produced by Alcaligenes latus cultured onsucrose as carbon source [6]. In Brazil, production ofP(3HB) in a pilot plant with capacity of 60 tonnes peryear is integrated into a sugarcane mill producing sugarand ethanol, not only to reduce production cost but toattain self-supply of required energy, waste disposalmanagement and all other merits of integration [7].Such predictive or real cost reduction is encouraging,but P(3HB) as product is not sufficient in performance[38, 39]. Therefore, it is desired to produce a PHAcopolymer with advanced material properties [38,39] ona large scale at a cheaper cost.In the second subject, what ‘‘environmental friendli-
ness’’ means is questioned. It may not either mean thata polymer material is simply produced from a natural orrenewable source, or that it is simply biodegradable.Even if it is made from a natural or renewable sourceand also biodegradable, it may be insufficient as envir-onmentally friendly material. To evaluate the environ-mental friendliness of a material, an approach based onlife cycle assessment seems appropriate. However, ana-lysis of biodegradable polymers based on life cycleassessment is scarce, especially for PHA polymers only afew reports having been published [3,4,8].These subjects may be solved if a carbon source and a
bacterial strain are properly selected in conjunction withdevelopment of an efficient fermentation technology.Fukui and Doi [9] generated a recombinant strain ofPHA-negative Ralstonia eutropha, harboring a PHAsynthase gene from Aeromonas caviae. The recombinantstrain was revealed to produce a random copolymer of3HB and (R)-3-hydroxyhexanoate (3HHx) from vege-table oils with a high cellular content (about 80% w/w)[10]. This result indicates that production of a copoly-mer requires a single carbon source such as vegetableoils, in contrast with the case of P(3HB-co-3HV) pro-duction from glucose and propionic acid [1], resulting inpotential cost reduction. Chen et al. [11] has alreadymade an effort to produce P(3HB-co-3HHx) on a largescale by cultivating Aeromonas hydrophila using lauricacid as carbon source which is closely related to theabove strategy. In addition, a vegetable oil is predictedto provide a much higher yield for production of thePHA copolymer and to reduce both production costand energy consumption, compared with sugar sub-strate such as glucose or sucrose, since it contains muchhigher carbon content per weight than sugar.As to P(3HB) [poly(C4H6O2)] production, the theore-
tical highest yields from glucose (C6H12O6) and a fattyacid, e.g., linoleic acid (C18H32O2; the main fatty acidcomponent of soybean oil) are estimated at 0.48 g-P(3HB)[12] and 1.38 g-P(3HB)/g-carbon source, respectively,according to the following stoichiometric equations:
C6H12O6 þ 1:5O2 ! C4H6O2 þ 2 CO2 þ 3 H2O ð1Þ
C18H32O2 þ 4:75 O2 ! 4:5 C4H6O2 þ 2:5 H2O ð2Þ
where C4H6O2 denotes a 3HB monomer unit. A mole-cule of glucose is metabolized in the Entner–Doudoroffpathway to form two molecules of acetyl-CoA releasingtwo molecules of CO2, and the two molecules of acetyl-CoA may be finally converted to a 3HB monomer unit.In contrast, a molecule of linoleic acid may undergorepeated oxidations in the b-oxidation pathway to formnine molecules of acetyl-CoA without CO2 release,which may possibly result in the formation of four and ahalf of 3HB monomer units. To our knowledge, experi-mental high level yields of PHA production from glu-cose and vegetable oils (or fatty acids derived fromthem) have been reported to roughly range from 0.3 to0.4 g-P(3HB)/g-glucose [13] and 0.6 to 0.8 g-PHA/g-oil[14,15], respectively. Naylor and Wood [14] reportedhigh yields ranging from 0.64 to 0.72 g-PHA/g-oil forthe fermentation production of P(3HB-co-3HV) fromrape seed oil or corn oil together with propionic acid inthe cultured R. eutropha. Recently, Kahar et al. [15]have also obtained a preliminary result that P(3HB) isproduced in a high yield of 0.76 g-P(3HB)/g-oil fromsoybean oil, again in the cultured R. eutropha.The present study has attempted to predict fermenta-
tive production cost of a PHA copolyester using soy-bean oil as carbon source, assuming that therecombinant strain of PHA-negative R. eutropha har-boring the A. caviae PHA synthase gene would produceP(3HB-co-5mol% 3HHx) on a large commercial scale,amounting to 5000 tonnes per year. In addition, lifecycle inventories of energy consumption and carbondioxide emissions from the cradle to the fermentationfactory-gate have been calculated for the copolyesterproduction to examine the basic environmental impactof the production. The corresponding cost and life cycleinventories for fermentative production of P(3HB) fromglucose are also estimated and used for comparison. Inaddition, the life cycle inventories of bio-based PHApolymers are compared with those of typical petro-chemical-based polymers.
2. Results and discussion
2.1. Cumulative energy use and CO2 emissions ofmaterials and utilities used in the fermentation
2.1.1. Soybean oil and glucoseSoybean oil and glucose as carbon sources are com-
mercially produced in very large amounts in the UnitedStates. To estimate cumulative energy use and CO2emissions of soybean oil and glucose, a variety of
184 M. Akiyama et al. / Polymer Degradation and Stability 80 (2003) 183–194
annual data from the United States Department ofAgriculture (USDA) and Department of Energy (DOE)was used. The summaries are illustrated in Figs. 1 and 2.As for glucose, Gerngross [3] calculated cumulativeenergy use from the cradle-to-factory gate based onfossil fuels. A value of 8.1 MJ/kg-glucose was providedfor the cumulative energy use together with 2.4 MJ/kgfor corn grain production quoted from Shapouri et al.[16] and 4.4 MJ/kg for corn wet milling to produce glu-cose. Therefore, we also calculated cumulative energy
use of glucose following the Shapouri’s and Gerngross’sprocedures and further expanded the calculations toestimate CO2 emissions. As in illustrated in Fig. 2, avalue of 7.5 MJ/kg-glucose was obtained for the cumula-tive energy use together with 2.5 MJ/kg for corn grainproduction and 4.9 MJ/kg [17,18] for corn wet milling toproduce glucose. In addition, a value of �0.97 kg/kg-glu-cose was obtained for the cumulative CO2 emissionstogether with 0.15 kg/kg for corn grain production and0.35 kg/kg [19,20] for corn wet milling to produce glucose,
Fig. 1. Cumulative energy use and CO2 emissions of soybean oil before the fermentation stage.
Fig. 2. Cumulative energy use and CO2 emissions of glucose before the fermentation stage.
M. Akiyama et al. / Polymer Degradation and Stability 80 (2003) 183–194 185
taking into account of CO2 of 1.47 kg/kg-glucoseabsorbed or fixed from the air when corn plant has beengrown up. The value of CO2 absorption was obtainedfrom the MW 180 and carbon number 6 of glucose.In the same way, the corresponding values were cal-
culated for soybean oil for the first time, as far as weknow. It is described briefly. In the agricultural stage toproduce soybeans, weighted averages of inputs [21] peracre of individual items [seed, fertilizer (N, P, K), che-micals, custom work, fuel use-natural gas (NG), diesel,coal, gasoline, oil, electricity] for soybeans productionin 1990 were calculated for the nine major states (AR,IL, IN, IA, MN, MO, NE, OH and SD). Then, theweighted averages were converted to primary energyrequirements by Btu per bushel, using soybeans yield(35.5 bushels/acre) and unit energy use [16] or content[22] of each item. The energy requirements were multi-plied by input efficiencies [16] of individual items,respectively, and added up to obtain the total energy byBtu per bushel again. Conversion of the unit (1 bushelof soybeans represents 60 pounds; 1 Btu 1.055kJ) pro-vided 2.9 MJ/kg-product as shown in Fig. 1 as totalenergy. On the other hand, the primary energy of eachitem was allocated to fuel types sharing its fuel feed-stock. Portions of primary energy of all items allocatedto each fuel type were summed (the sum for each fueltype is shown in Fig. 1) and then converted to CO2emissions by each fuel type, using energy content andemission coefficient [23]. Finally, CO2 emissions byindividual fuel types were summed again to obtain 0.19kg/kg-soybeans for the agricultural stage shown in Fig. 1as CO2.In the oil milling stage to produce soybean oil, in the
1994 data [17], 1405 million bushels (38,272 kilotonnes)of soybeans were processed or crashed to produce15,613 million pounds (7088 kilotonnes) of soybean oiland 33,270 short kilotons (30,209 kilotonnes) of soy-meal. In the same year, 55 trillion Btu (58.2 trillion kJ)of energy was consumed for soybean oil mills, including6.4 trillion Btu (6.7 trillion kJ or 1866 million kWh) ofelectricity as well as feed shares of different fuel types[18]. In soybean oil milling, electricity is one of maincontributors to energy supply, in contrast to its minimalcontribution in the agricultural stage where coal gen-erates electricity. The electricity of 6.4 trillion Btu wassupplied externally by public utilities which generatedelectricity totaling 2910 billion kWh from nuclear,hydro, thermal and other powers throughout the UnitedStates, including 22,061 trillion Btu (23,275 trillion kJ) offossil fuels shared by coal (18,036 trillion Btu), petroleum(949 trillion Btu) and gas (3077 trillion Btu) for thermalpower. Electricity generation of 1 kWh thus consumed8.0 MJ of fossil fuels. Calculations: 1866 millionkWh�8.0 MJ=14.9 trillion kJ and 58.2 trillion kJ�6.7trillion kJ + 14.9 trillion kJ=66.4 trillion kJ. Therefore,66.4 trillion kJ of fossil fuel energy, instead of 58.2 tril-
lion kJ, was consumed for soybean oil mills. Calculationagain: 66.4 trillion kJ/(7088 + 30,209) kilotonnes=1.8MJ/kg. Finally, the value of 1.8 MJ/kg-product, asshown in Fig. 1, is energy requirement based on fossilfuels for production of soybean oil on the weight basis.In summary, as illustrated in Fig. 1, 4.8 MJ/kg-soy-
bean oil was obtained for the cumulative energy usebased on fossil fuels together with 2.9 MJ/kg for soy-beans production and 1.8 MJ/kg for soybean oil mill. Inaddition, a value of �2.52 kg/kg-soybean oil wasobtained for the cumulative CO2 emissions togetherwith 0.19 kg/kg for soybeans production and 0.12 kg/kgfor soybean oil mill, taking into account of CO2 of 2.84kg/kg-soybean oil absorbed from the air when soybeanplant has been grown up.
2.1.2. Other materialsIn the fermentative production of a PHA copolymer
of P(3HB-co-5mol% 3HHx) by the recombinant R.eutropha, a mineral medium containing phospate,ammonium, Cl� etc. with metal ions such as Na+, K+,Mg2+ and other minor metal ions is required for cel-lular growth in addition to carbon source. In thedownstream process designed for this study to separategrown bacterial cells and harvest intracellular PHAgranules, sodium dodecylsulfate (SDS) and sodiumhypochlorite (NaOCl) are used. SDS acts as surfactantto dissociate proteins constituting cell membrane andthus renders cells more susceptible to attack by externalagents such as NaOCl. NaOCl is a strong oxidizingagent capable of digesting cellular biomass, leavingPHA granules alone.In this study, cumulative energy use and CO2 emis-
sions of the materials used in the fermentation werecalculated and determined as follows: NH3 33.8 MJ/kgand 1.68 kg-CO2/kg; SDS 28.2 MJ/kg and �0.21 kg-CO2/kg; aqueous NaOCl solution 2.3 MJ/kg and 0.12kg-CO2/kg. The calculation procedures for these esti-mates are not shown here. Ammonia is a well-knownenergy-intensive material, and it is produced under theconditions of high pressure and high temperature fromhydrocarbon such as liquid natural gas (LNG) (ashydrogen source and fuel) and air as nitrogen source.The cumulative energy use of ammonia has been repor-ted as 30.1 MJ/kg [3]. SDS is produced from coconut orpalm nut oil as starting material which is converted tomethyl esters by methanolysis, then reduced to higheralcohols under the conditions of high pressure and hightemperature by catalytic hydrogenation, then distilledfractionally to obtain a fraction mainly containingn-dodecanol and sulfated with anhydrous sulfuric acid,followed by neutralization with NaOH [24]. Energy useand CO2 emissions for production of coconut oil has beenreported [25] and used here with those of methanol [25],hydrogen [26] and NaOH [26]. Aqueous NaOCl solutionis made by just mixing chlorine gas with aqueous NaOH
186 M. Akiyama et al. / Polymer Degradation and Stability 80 (2003) 183–194
solution and contains 12.5 wt.% of positively chargedchlorine acting as oxidizing agent. Since both chlorine gasand aq. NaOH solution are produced by electrolysis ofaq. NaCl solution, cumulative energy use and CO2 emis-sions of aq. NaOCl solution were derived simply fromthose of chlorine gas [26] and aq. NaOH solution. BesidesNH3, SDS and aq. NaOCl solution, other components ofculture medium, such as Na2HPO4, KH2PO4, Na3PO4,MgCl2, (NH4)2SO4 and other minor components shouldbe cited or determined for cumulative energy use and CO2emissions, but relevant data are not available.
2.1.3. UtilitiesCumulative energy use and CO2 emissions of elec-
tricity, steam, process water and cooling water used inthe fermentative production of PHA are as follows:electricity 9.42 MJ/kWh [27] and 0.55 kg-CO2/kWh [28];steam [28] 3.35 MJ/kg and 0.25 kg-CO2/kg; processwater [29] 0.0038 MJ/kg and 0.0002 kg-CO2/kg; coolingwater [29] 0.0016 MJ/kg and 0.0001 kg-CO2/kg.
2.2. Model fermentation process
Fig. 3 illustrates the whole fermentation processincluding the downstream process to obtain granules ofthe PHA as end product. Production of P(3HB-co-5mol% 3HHx) was assumed to be conducted by culti-vating the recombinant strain of R. eutropha [9,10] usingsoybean oil as sole carbon source in a two-stage fed-batch mode. In this mode, the cells are grown in amineral medium containing soybean oil to a certainlevel when nitrogen source is exhausted, followed byproduction of the PHA from soybean oil in the absenceof nitrogen source. During this process, soybean oil isfed continuously, continually or intermittently. Fer-mentation is conducted under agitation and aeration ina jar fermenter. Heat generated by aerobic oxidation iscooled by cooling water to keep the culture medium at aconstant temperature. For comparison, soybean oil isreplaced by glucose.In the downstream process, the PHA granules in the
cells are removed out by means of chemical cell disrup-tion consisting of SDS surfactant pretreatment andNaOCl washing, reported first by Ramsay et al. [30,31]and utilized by Lee and Choi [5] and Choi and Lee [32].The cells and the PHA granules are separated from therespective liquid phases through disk-stack centrifugeswhich can be operated continuously. The PHA granulesare finally dried by a spray dryer to obtain the end product.
2.3. Simulation conditions and software
2.3.1. Process parameters and a stoichiometric equationfor fermentationTwo series of fermentation were assumed to be con-
ducted at an annual production rate of 5000 tonnes as
end product of PHA granules which are recovered at 95wt% from the cells. One batch was assumed to use asingle jar fermenter. The first series using soybean oil assole carbon source consisted of eight cases (1–8 inTable 1) where the fermentation performances werevariable and set referring to experimental data[10,14,15], including dry cell concentration (g/L), PHAcontent (wt%) within the cells, PHA yield (g/g) basedon carbon source and fermentation time (h), as shownin Table 1, while keeping fermentation conditions con-stant: aeration rate 0.5 vvm; compressor pressure 2,500kPa (absolute); power for agitation 1.0 kW/m3; char-ging ratio of culture medium to the fermenter 70 vol.%;and fermentation temperature 34 �C. In addition, twocases (9 and 10 in Table 1) using glucose as sole carbonsource were also simulated under the same fermentationconditions for comparison. One (case 9) was based onthe experimental data [33] having attained the highestproductivity of 4.63 g/l h for glucose-based PHB pro-duction, but its performance was set rather higher thanthe experimental data for simplicity as case 9 in Table 1:dry cell concentration 200 g/l; PHB content 75 wt.%;PHB yield 0.37 g/g-glucose; fermentation time 30 h. Theother was the case set by Gerngross [3], also shown ascase 10 in Table 1.The second series consisted of 10 cases (5 and 11–19
in Fig. 4) of which one case is the base case also inclu-ded as case 5 in the first series. These cases had differentfermentation conditions, including aeration rate (vvm),power for agitation (kW/m3) and fermentation tem-perature (�C), as shown in Fig. 4 where the base case 5is displayed three times for comparison.In the simulation of a fermentation process for PHA
production, an overall stoichiometric equation (orkinetic equations) was required to determine materialbalance in the fermentation reactions such as growth ofbiomass and PHA synthesis. Such a stoichiometricequation is established on the basis of intracellular PHAcontent and PHA yield relative to carbon source, if thecomposition of cellular biomass is given. For that pur-pose, the biomass formula C4.2H7.4O2.0N0.79, determinedfor A. latus by Yamane et al. [34], was utilized. Forexample, when PHA content and PHA yield are given at85 wt.% and 0.8 g/g, respectively, as in the cases (5 and11–19) of the second series, the overall stoichiometricequation for bacterial synthesis of P(3HB-co-5mol%3HHx) from soybean oil is expressed as follows:
0:81 C18H31O2ð Þ3C3H5 þ 29:06 O2 þ 0:79 NH3 !
C4:2H7:4O2:0N0:79 þ 6:22 C4H6O2 þ 0:33 C6H10O2
þ 15:40 CO2 þ 17:11 H2O ð3Þ
where (C18H31O2) 3C3H5, C4H6O2 and C6H10O2 denotetri-linoleyl glycerol (soybean oil), 3HB monomer unit and3HHx monomer unit, respectively. In the same way, the
M. Akiyama et al. / Polymer Degradation and Stability 80 (2003) 183–194 187
Fig. 3. The process flowsheet for fermentative production of polyhydroxyalkanoate (PHA).
overall stoichiometric equations can be also establishedfor the cases (1–10) of the first series other than case 5. Inthese aerobic fermentations, heat generation by oxidationwas assumed to be 3750 kcal/kg-O2 consumed [35].
2.3.2. Unit costsIn cost estimations, raw materials, labor-dependent,
equipment-dependent, laboratory/QC/QA, and wastetreatment/disposal costs were considered for calculations.Other miscellaneous items such as consumables, transpor-tation and tax were excluded. As to rawmaterials, soybeanoil [40], SDS and aq. NaOCl solution were set at 0.30, 1.50and 0.10 US $/kg, respectively, referring to internationalor US market prices in the year 2001. In a similar manner,glucose was set at 0.30 US $/kg [41]. Ammonia was set at0.20 US $/kg, while the mineral medium except ammoniawas set at 0.004 US $/kg. Waste treatment/disposal costwas set at 0.01 US $/tonne for the liquid wastes S-115 andS-123, and at 0.02 US $/tonne for the liquid wastes S-119and S-111 (see Fig. 3). All other costs such as equipmentand labor and rates depending on equipment, labor orsomething else were set at default values designed for theyear 2001 and incorporated into the software.
Plains, NJ, USA) was utilized for the whole fermenta-tion process including the downstream process. It ischaracterized by designing and optimizing integratedprocesses including chemical and pharmaceutical, bio-chemical and environmental processes.
2.4. Production cost
In the process for PHA production illustrated inFig. 3, the bottleneck procedure is fermentation. The
fermentation is performed for 40 or 50 h in the fed-batch process. After the fermentation in one of thesequential batches is complete, the subsequent fermen-tation is conducted in the batch after 12 h or more later,i.e. effective batch time is equal to fermentation timeplus 12 h. Since the total operating time is set at 7920 hannually, 40 and 50 h of fermentation time define 152and 128 batches per year, respectively. In order to pro-duce 5000 tonnes of PHA granules as end product at 95%of recovery, 152 and 128 batches produce 34.7 and 41.2tonnes of PHA per batch, respectively (see Table 1).When the amount of PHA production per batch is deter-mined, actual fermenter size required is defined by PHAconcentration in the medium, i.e. cell concentration mul-tiplied by intracellular PHA content. A larger fermentermakes equipment cost significantly higher since a fer-menter is the most expensive piece of the equipment forthe process. Table 1 lists the production cost for P(3HB-co-5mol% 3HHx) in each group with the same yield ofcases 1–4 or 5–8 using soybean oil as carbon source.Compared with cases 9 and 10 using glucose to pro-
duce P(3HB), the whole series of cases 1–8 using soy-bean oil as carbon source to produce P(3HB-co-5mol%3HHx) are generally shown to be in a range of produc-tion cost similar to cases 9 and 10. However, a closerinspection of the data in Table 1 reveals that a higheryield (g-PHA/g-oil) based on soybean oil has greatlyreduced production cost. Since the productivities arecomparable between cases 7 (3.19 g-PHA/l h) and 10(3.13 g-PHB/l h), cost reduction in case 7 (3.53 $/kg)relative to case 10 (4.24 $/kg) is attributable to thehigher yield of PHA based on carbon source in case 7(0.80 g-PHA/g-soy oil) vs. case 10 (0.30 g-PHB/g-glu-cose). The effect of higher yields on cost reduction istypically indicated in cases 7 and 8 compared with cases9 and 10.
Table 1
Cost estimation and conditions of polyhydroxyalkanaote production (5000 tonnes per year) from renewable resources by bacterial fermentation
Case Resource Product Production conditiona Operation conditiona PHAb
a Fermentations are carried out at 34 �C, aeration of 0.5 vvm, and power for agitation of 1.0 kW/m3 in a stirred tank fermenter containing culture
medium of 70 vol.%.b PHA recovery is 95% as the amount of isolation to production, and $ is US dollars.
M. Akiyama et al. / Polymer Degradation and Stability 80 (2003) 183–194 189
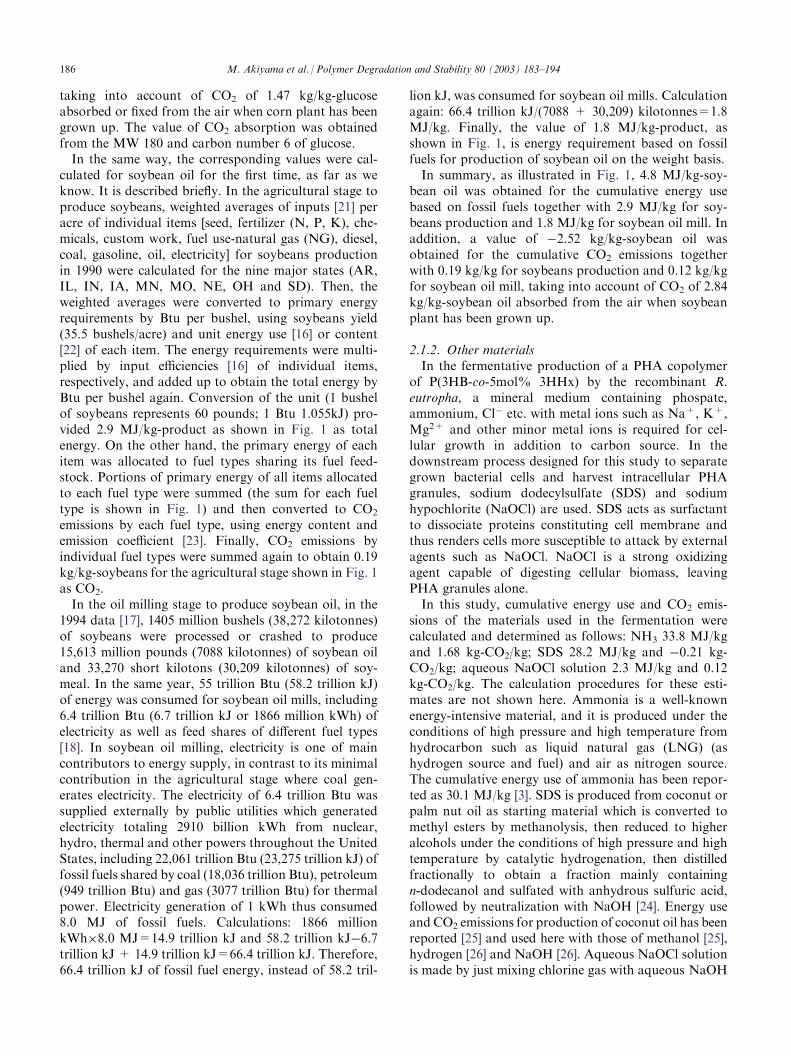
Table 2 shows the compositions of operating cost forsoybean-oil-based cases 4 and 5 and glucose-based cases9 and 10. Among the cost items listed, raw materialsitem for cases 4 and 5 shares lower percentages than thatfor cases 9 and 10, while equipment-dependent item andutilities for cases 4 and 5 share higher percentages. Thelower percentages of raw materials item are due to higheryields on soybean oil, while the higher percentages ofequipment-dependent item and utilities reflect larger fer-menters (see Table 1) and/or lower productivities (2.40and 2.13 g-PHA/l h vs. 5.00 and 3.13 g-PHB/l h).Fig. 4(A) shows the effects of fermentation condi-
tions, including aeration rate, power for agitation and
fermentation temperature, on production cost. Withinthe range of assumed fermentation conditions, the effectof aeration rate is most significant, while fermentationtemperature shows a negligible effect.
2.5. Life cycle inventories of energy and CO2 emissionsfrom the cradle-to-factory gate
In the simulations using the above software, con-sumptions of a variety of utilities, such as electricity,steam, process water, cooling water or chilled waterwere estimated. These consumptions were then con-verted to the cumulative energy uses required and CO2
Fig. 4. Estimation of production cost (A), total energy (B) and net CO2 emissions (C) in cases 5 and 11–19 from the cradle-to-granules for the
fermentative production (5,000 tonnes/year) of P(3HB-co-5mol% 3HHx) from soybean oil. Production conditions; PHA content in dry cells: 85
wt.%, yield of PHA to soybean oil: 0.80 g/g, cell concentration: 100 g/l, and fermentation period: 40 h.
190 M. Akiyama et al. / Polymer Degradation and Stability 80 (2003) 183–194
emissions involved to generate such utilities. The corre-sponding values of the materials used in the fermenta-tion and the downstream processes, i.e., carbon source,ammonia, SDS and aq. NaOCl solution, were also cal-culated using energy use and CO2 emissions per unitweight specified above. All these values of the cumulativeenergy uses and CO2 emissions were summed to obtainthe subtotals for the fermentation and the downstreamprocesses and the total for the entire process.Tables 3-1 and 3-2 show the detailed results for cases
1 to 10. In the fermentation using soybean oil in cases 1to 8, any one case of the group consisting of cases 1–4 ishigher by some MJ/kg than the counterpart of the
group consisting of cases 5–8, e.g., case 5 vs. case 1, withrespect to subtotal use of cumulative energy. In eachgroup, a larger fermenter requires a larger subtotalcumulative energy. It is also true to the whole series ofcases 1 to 8, irrespective of the difference of 0.1 g/g inthe yield between both groups. In comparison withcases 9 and 10 using glucose as carbon source, the cases1–8 using soybean oil have some notable features inenergy use. First of all, soybean oil introduces much lesscumulative energy than glucose into the process,because soybean oil has less cumulative energy per unitweight till production (Fig. 1) and less amount of oil isused for the production process due to higher yields
Table 2
Itemized processing cost for representative cases of PHA production
Unit values Soybean oil Glucose NH3 Process water Electricity Steam Cooling water
Energy use per unit 4.8 MJ/kg 7.5 MJ/kg 33.8 MJ/kg 0.0038 MJ/kg 9.42 MJ/kWh 3.35 MJ/kg 0.0016 MJ/kg
CO2 emission per unit �2.52 kg/kg �0.97 kg/kg 1.68 kg/kg 0.0002 kg/kg 0.55 kg/kWh 0.25 kg/kg 0.0001 kg/kg
M. Akiyama et al. / Polymer Degradation and Stability 80 (2003) 183–194 191
(Table 1). Secondly, the range of electricity require-ments for soybean-oil-based fermentations is centeredhigher than those for glucose-based fermentations incases 9 and 10. The electricity requirement for fermen-tation in case 9 is the least. Thirdly, as for subtotal useof cumulative energy, among cases 1–10, ranks 1–5 inthe increasing order are included among soybean-oil-based cases. In contrast, cases 9 and 10 using glucoseare rank 6 and the last rank, respectively. CumulativeCO2 emissions show similar trends among soybean-oil-based fermentations and between soybean-oil-based andglucose-based fermentations. One notable thing is thatfermentation in case 10 generates a larger amount ofCO2 than any other cases by bacterial metabolism,resulting in the only positive value of CO2 emissionsamong cases 1–10.As shown in Table 3-2, the subtotal use of cumulative
energy for the downstream process seems to shareapproximately 30–40% of the total use for the entireprocess all over the cases 1–10. Of the items constitutingthe subtotal, steam used for spray drying is the greatestcontributor and its consumption is significantly less forthe group of cases 5–8 than for any other case. Thissuggests introduction of a less amount of aqueous phaseinto the spray dryer in cases 5–8. In these cases, PHAgranules should be separated from other solid materialssuch as cell debris in a relatively higher concentrationduring centrifugation, since the intracellular content ofPHA produced in the fermentation is the highest.Cumulative CO2 emissions for the downstream processshow similar trends to the cumulative energy.
Finally, the total use of cumulative energy for theentire process was found to vary greatly from case tocase. Among cases 1–10, ranks 1–7 in the increasingorder are included among soybean-oil-based cases. Incontrast, cases 9 and 10 using glucose are rank 8 and thelast rank, respectively. A similar ranking is recognizedin cumulative CO2 emissions for the entire process.Ranks 1–5 in the increasing order are included amongsoybean-oil-based cases, while case 9 is even with cases 1and 6 behind rank 5 and case 10 the last rank again.Notably, values of cumulative CO2 emissions for theentire process are negative in cases 7 and 8, within thelimits of this study.Fig. 4(B) shows the effects of fermentation conditions
on cumulative energy use in the soybean-oil-based cases11–19 and 5. Within the range of assumed fermentationconditions, both effects of aeration rate and power foragitation are significant, while fermentation temperatureshows a negligible effect. A similar trend is recognizedfor the effects of fermentation conditions on cumulativeCO2 emissions, as shown in Fig. 4(C).
2.6. Environmental life cycle comparison ofpolyhydroxyalkanoates with typical petrochemicalpolymers
Fig. 5(A) and (B) compare cumulative energy use andCO2 emissions between PHA polymers and typical pet-rochemical polymers. The data for petrochemical poly-mers are published in detail by Association of PlasticManufacturers in Europe (APME) [36]. It is apparent
Table 3-2
Estimation of total energy use and net CO2 emissions from the cradle-to-granules for polyhydroxyalkanoate production (5000 tonnes per year) from
renewable resources by bacterial fermentations
Case Downstream Whole process
SDS NaOCl Electricity Steam Cooling water LCI subtotal LCI total
Unit values SDS NaOCl Electricity Steam Cooling water
Energy use per unit 28.2 MJ/kg 2.3 MJ/kg 9.42 MJ/kg 3.35 MJ/kg 0.0016 MJ/kg
CO2 emissions per unit �0.21 kg/kg 0.12 kg/kg 0.55 kg/kg 0.25 kg/kg 0.0001 kg/kg
192 M. Akiyama et al. / Polymer Degradation and Stability 80 (2003) 183–194
that the group of petrochemical polymers has muchhigher cumulative energy use and CO2 emissions thanPHAs in cases 5 and 9 produced fermentatively fromsoybean oil and glucose, respectively. The compositionof cumulative energy use forms a striking contrastbetween both types of polymers [the data are not shownin Fig. 5(A)]. Feedstock energy accounts for about 50%or more of cumulative energy use for petrochemicalpolymers but for nothing for PHAs due to differentorigins of feedstock, combustible fossils vs. renewableplants resources. On the contrary, process energy sharesnearly all of the cumulative energy used for PHA pro-duction. As for cumulative CO2 emissions, absorptionof CO2 from the air by the soybean or corn plant hasmainly contributed to reducing the CO2 emissions forPHA production.The comparison described above must be reviewed
carefully, however, since it is not necessarily made onthe same ground. In calculations of cumulative energyuse and CO2 emissions for soybean oil or glucose pro-duced in the United States, fuel production and deliveryenergy has not been taken into account. Nor has non-fossil fuel energy for electricity generation been takeninto account in these inventories. In addition, fuel use intransportation, which is required to transport the car-bon sources from relevant mills in US to a Japanesefermentation factory to produce PHAs in this case, has
been neglected. Also, there is a difference in final pro-duct form, granules of PHAs vs. pellets of petrochem-ical polymers. Furthermore, petrochemical polymers tobe compared are produced in Europe, while PHAs areassumed to be produced in Japan, so that regional dif-ferences in energy situation, processing techniques andso forth must be considered. All these barriers againstthe comparative study are recognized in fact, but it willbe meaningful to discuss the results of this study whilekeeping the above barriers in mind. It has already beenfound by calculations that inclusion of non-fossil fuelenergy for electricity generated by public utilities in allUS or even in the Corn Belt states [37] adds about 3–4%to the cumulative energy use for soybean oil, and about4–5% for glucose, indicating a small effect of the non-fossil fuel energy on the cumulative energy use.
3. Conclusions
Fermentative production of a P(3HB-co-5mol%3HHx) copolymer from soybean oil as carbon source wasfocused on and its feasibility was studied in terms of costand environmental loads. This result was compared withfermentative production of P(3HB) homopolymer fromglucose. Further, fermentative production of these bio-based PHA polymers was compared with petrochemical
Fig. 5. Estimation of total energy (A) and net CO2 emissions (B): petrochemical polymers (from the cradle-to-the pellets) and bio-based PHA
polymers (from the cradle-to-granules). LDPE: low density polyethylene, HDPE: high density polyethylene, PP: isotactic polypropylene, PS: poly-
styrene, and b-PET: bottle-grade poly(ethylene terephthalate).
M. Akiyama et al. / Polymer Degradation and Stability 80 (2003) 183–194 193
production of common-use polymers. In conclusion,production cost was comparable between P(3HB-co-5mol% 3HHx) and P(3HB). The LCI values of energyconsumption and CO2 emissions were estimated to besmaller for the PHA copolymer from soybean oil thanfor P(3HB) from glucose. In addition, the LCI valueswere much smaller for the bio-based PHA polymersthan for petrochemical polymers.
Acknowledgements
This study has been supported by the SORST (Solu-tion Oriented Research for Science and Technology)grant of Japan Science and Technology Corporation(JST).
References
[1] Byrom D. FEMS Microbiol Rev 1992;103:247.
[2] Hrabak O. FEMS Microbiol Rev 1992;103:251.
[3] Gerngross TU. Nature Biotechnol 1999;17:541.
[4] Gerngross TU, Slater SC. Scientific American 2000:36.
[5] Lee SY, Choi J. Polym Degrad Stab 1998;59:387.
[6] Wang F, Lee SY. Appl Environ Microbiol 1997;63:3703.