Page 1
PHENOMENA OF MIXING ETHYLENE GLYCOL
/WATER SYSTEM FOR FREEZING POINT
MEASUREMENTS
A Thesis
Submitted to the College of Engineering
of Nahrain University in Partial Fulfillment
of the Requirements for the Degree of
Master of Science
in
Chemical Engineering
by
SHAIMAA FADHAL AL-ZUBADI
(B.SC. in Chemical Engineering 2004)
Jamadi Al-Thani 1428
June 2007
Page 4
Abstract
Experimental work is carried out to find the minimum value of freezing
point that can be obtained for Ethylene Glycol – water solution. 5% wt. of
methanol is added to the Ethylene glycol – water solution to investigate its
effect on freezing temperature.
The experiments also included determination of boiling temperature of
Ethylene Glycol – water solution with and without methanol at different
ethylene glycol concentrations from 0 to 100 weight per cent at temperature
20°C and 1 atmosphere pressure.
The results revealed that increasing Ethylene Glycol percent from 0 to
55% leads to decrease in the freezing point. Above 80% the Ethylene Glycol
cause a rise in freezing temperature.
Also the presences of 5% methanol decreases the freezing temperature
for all values of ethylene glycol percents, while it cause little increase in the
boiling temperature.
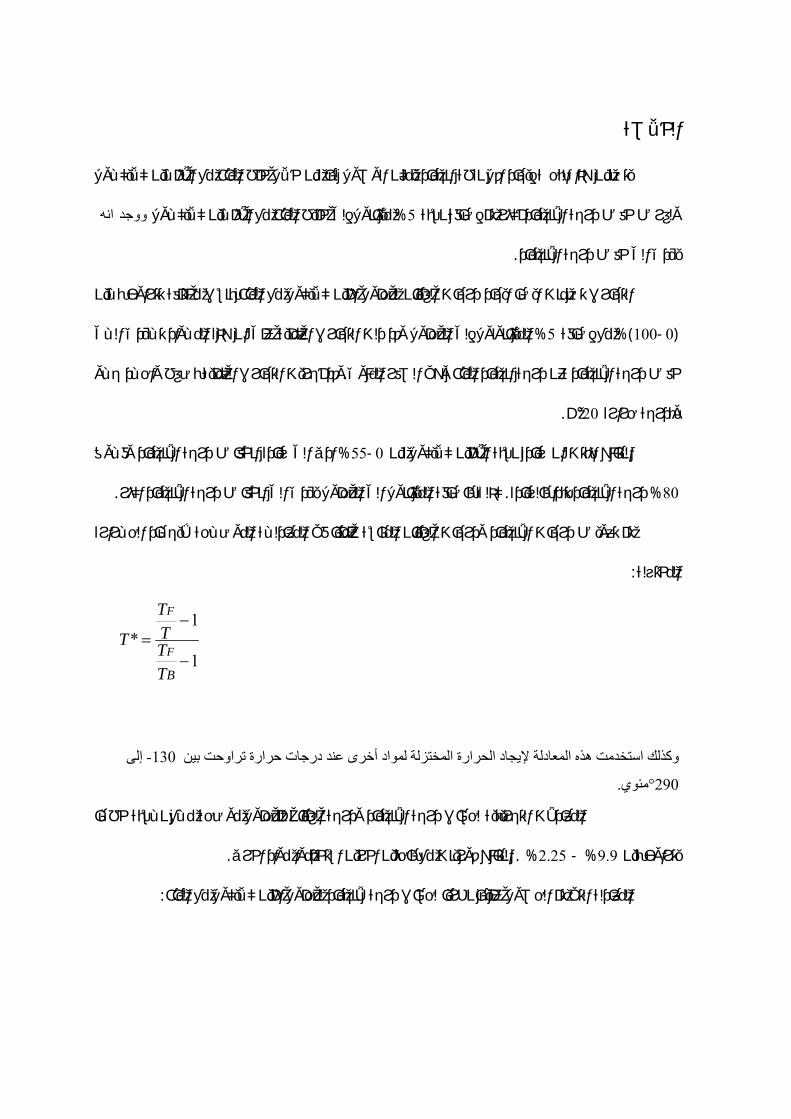
The freezing point and the boiling point that were measured
experimentally are substituted in Lielmezs model to obtain the reduced
temperature (T*):
1
1*
−
−=
NB
F
F
TTTT
T
The range of solution temperature that investigated is from -130°C to 290°C.
Empirical correlations for estimating the freezing and boiling
temperature for the solutions are obtained with error percents ranging from
2.25% to 9.9%. The results are compared with works of other authors that
investigated other components. The correlations obtained are:
I
Page 5
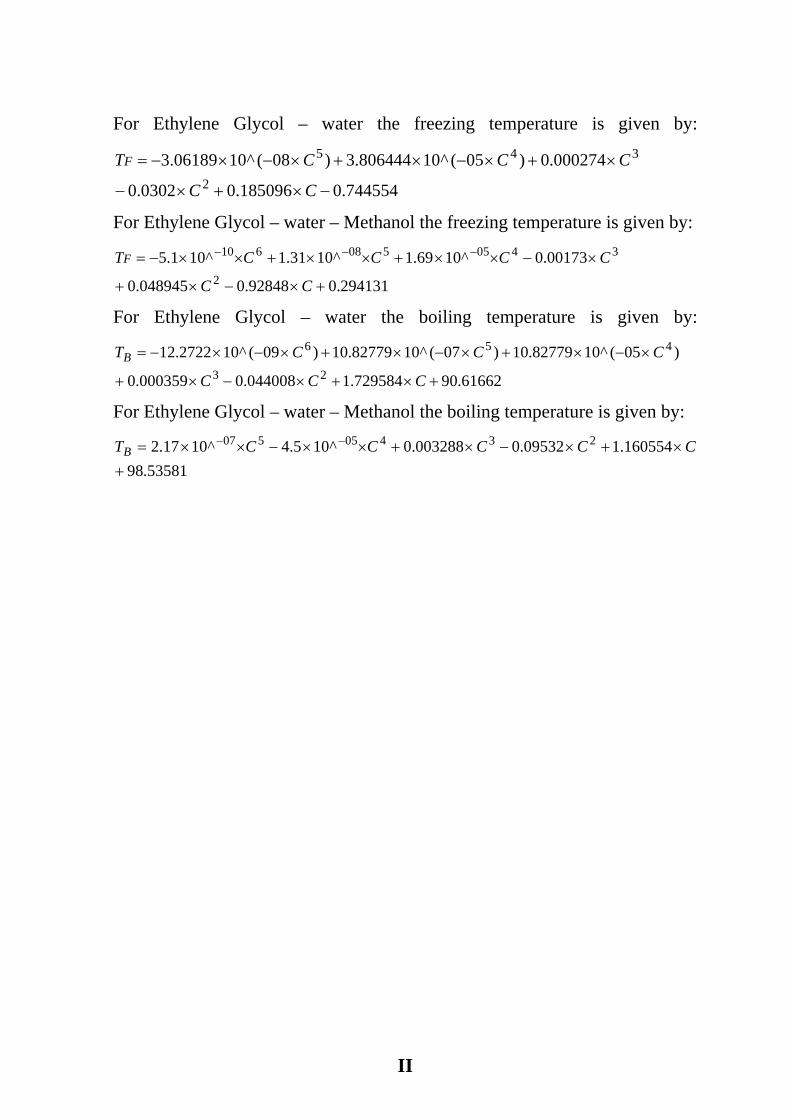
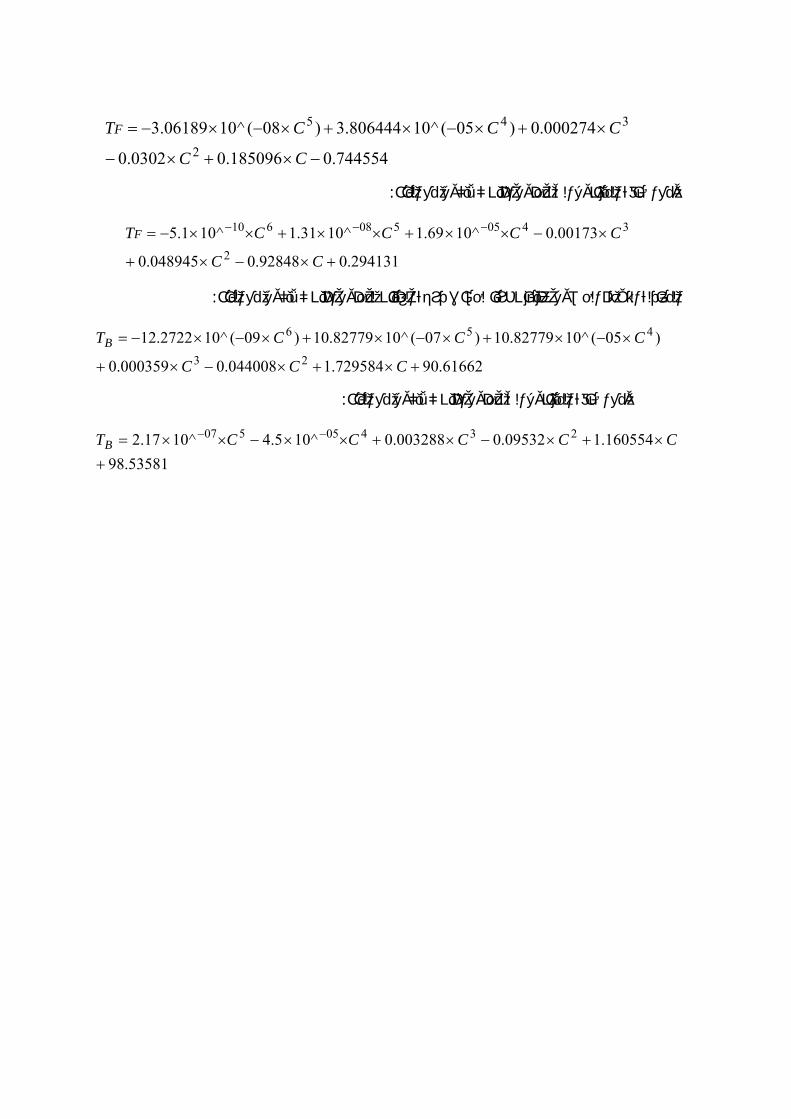
For Ethylene Glycol – water the freezing temperature is given by:
744554.0185096.00302.0
000274.0)05(^10806444.3)08(^1006189.32
345
−×+×−
×+×−×+×−×−=
CC
CCCTF
For Ethylene Glycol – water – Methanol the freezing temperature is given by:
294131.092848.0048945.0
00173.0^1069.1^1031.1^101.52
3405508610
+×−×+
×−××+××+××−= −−−
CC
CCCCTF
For Ethylene Glycol – water the boiling temperature is given by:
61662.90729584.1044008.0000359.0
)05(^1082779.10)07(^1082779.10)09(^102722.1223
456
+×+×−×+
×−×+×−×+×−×−=
CCC
CCCTB
For Ethylene Glycol – water – Methanol the boiling temperature is given by:
53581.98160554.109532.0003288.0^105.4^1017.2 23405507
+×+×−×+××−××= −− CCCCCTB
II
Page 6
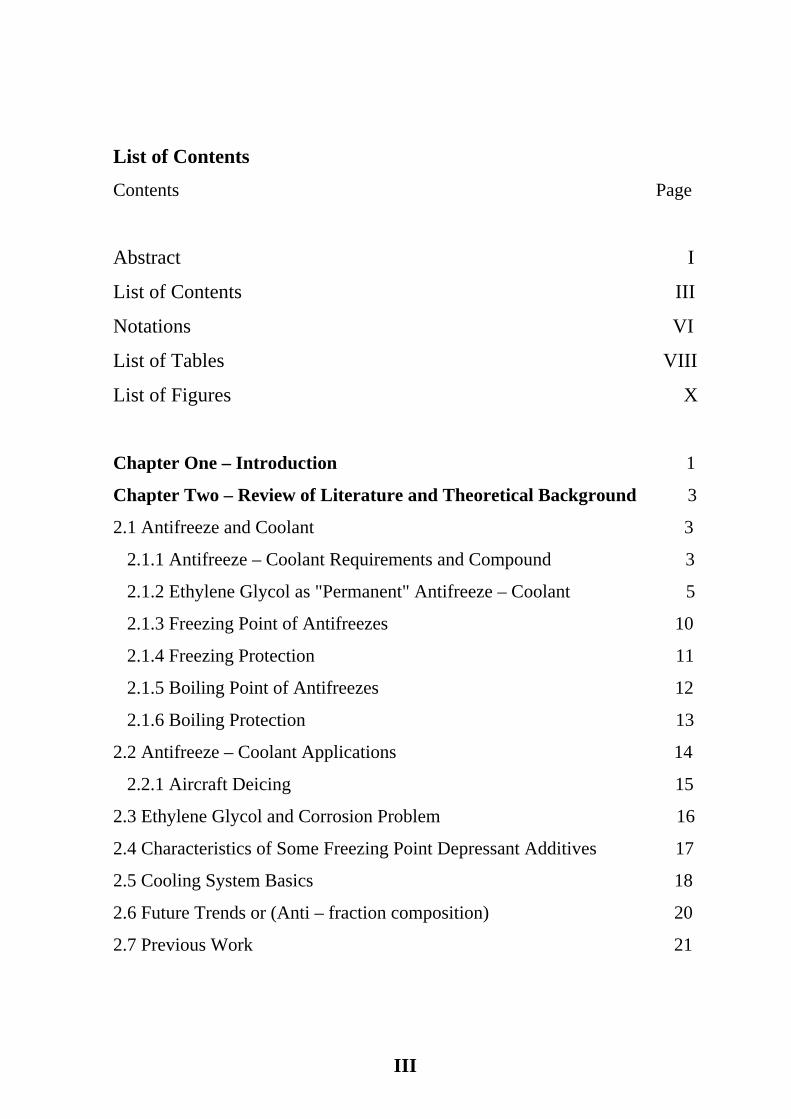
List of Contents
Contents Page
Abstract I
List of Contents III
Notations VI
List of Tables VIII
List of Figures X
Chapter One – Introduction 1
Chapter Two – Review of Literature and Theoretical Background 3
2.1 Antifreeze and Coolant 3
2.1.1 Antifreeze – Coolant Requirements and Compound 3
2.1.2 Ethylene Glycol as "Permanent" Antifreeze – Coolant 5
2.1.3 Freezing Point of Antifreezes 10
2.1.4 Freezing Protection 11
2.1.5 Boiling Point of Antifreezes 12
2.1.6 Boiling Protection 13
2.2 Antifreeze – Coolant Applications 14
2.2.1 Aircraft Deicing 15
2.3 Ethylene Glycol and Corrosion Problem 16
2.4 Characteristics of Some Freezing Point Depressant Additives 17
2.5 Cooling System Basics 18
2.6 Future Trends or (Anti – fraction composition) 20
2.7 Previous Work 21
III
Page 7
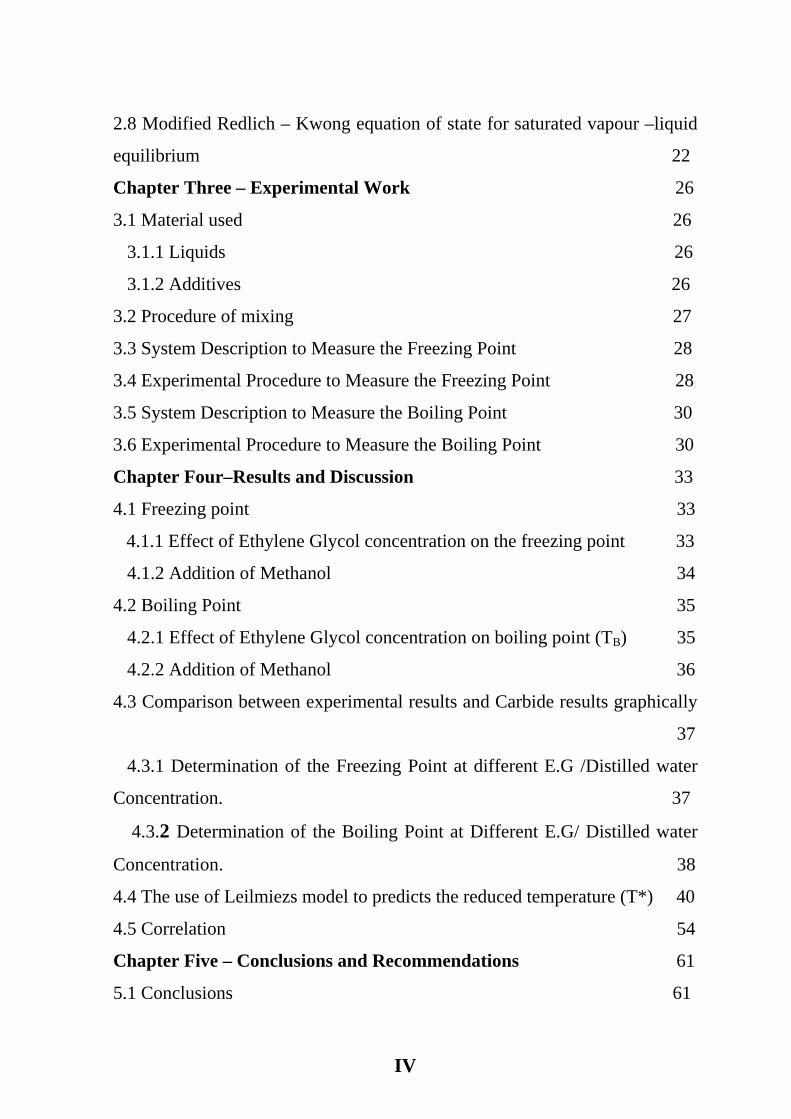
2.8 Modified Redlich – Kwong equation of state for saturated vapour –liquid
equilibrium 22
Chapter Three – Experimental Work 26
3.1 Material used 26
3.1.1 Liquids 26
3.1.2 Additives 26
3.2 Procedure of mixing 27
3.3 System Description to Measure the Freezing Point 28
3.4 Experimental Procedure to Measure the Freezing Point 28
3.5 System Description to Measure the Boiling Point 30
3.6 Experimental Procedure to Measure the Boiling Point 30
Chapter Four–Results and Discussion 33
4.1 Freezing point 33
4.1.1 Effect of Ethylene Glycol concentration on the freezing point 33
4.1.2 Addition of Methanol 34
4.2 Boiling Point 35
4.2.1 Effect of Ethylene Glycol concentration on boiling point (TB) 35
4.2.2 Addition of Methanol 36
4.3 Comparison between experimental results and Carbide results graphically
37
4.3.1 Determination of the Freezing Point at different E.G /Distilled water
Concentration. 37
4.3.2 Determination of the Boiling Point at Different E.G/ Distilled water
Concentration. 38
4.4 The use of Leilmiezs model to predicts the reduced temperature (T*) 40
4.5 Correlation 54
Chapter Five – Conclusions and Recommendations 61
5.1 Conclusions 61
IV
Page 8
5.2 Recommendations 62
References 63
Appendix A-1
V
Page 9
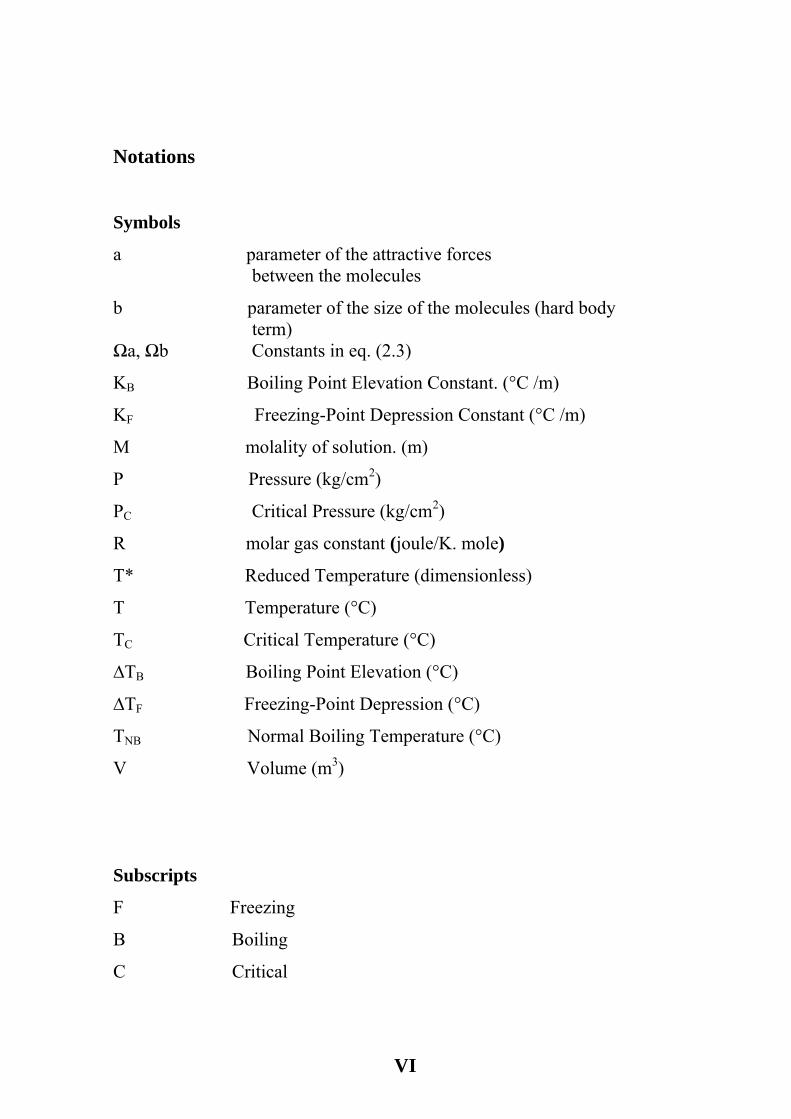
Notations
Symbols
a parameter of the attractive forces between the molecules
b parameter of the size of the molecules (hard body term) Ωa, Ωb Constants in eq. (2.3)
KB Boiling Point Elevation Constant. (°C /m)
KF Freezing-Point Depression Constant (°C /m)
M molality of solution. (m)
P Pressure (kg/cm2)
PC Critical Pressure (kg/cm2)
R molar gas constant (joule/K. mole)
T* Reduced Temperature (dimensionless)
T Temperature (°C)
TC Critical Temperature (°C)
∆TB Boiling Point Elevation (°C)
∆TF Freezing-Point Depression (°C)
TNB Normal Boiling Temperature (°C)
V Volume (m3)
Subscripts
F Freezing
B Boiling
C Critical
VI
Page 10
Abbreviations
EG Ethylene Glycol
AF & CS Antifreeze and Coolants
PET Polyethylene Terphthalate
NB Normal boiling point
VII
Page 11
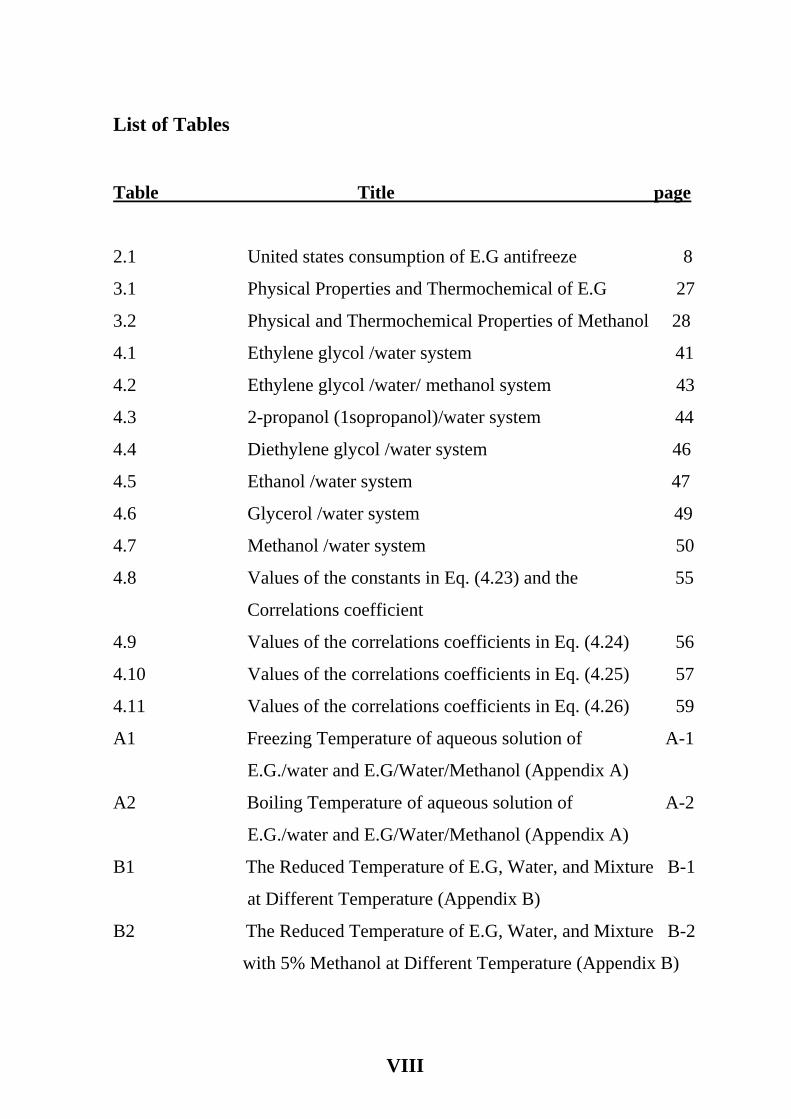
List of Tables
Table Title page
2.1 United states consumption of E.G antifreeze 8
3.1 Physical Properties and Thermochemical of E.G 27
3.2 Physical and Thermochemical Properties of Methanol 28
4.1 Ethylene glycol /water system 41
4.2 Ethylene glycol /water/ methanol system 43
4.3 2-propanol (1sopropanol)/water system 44
4.4 Diethylene glycol /water system 46
4.5 Ethanol /water system 47
4.6 Glycerol /water system 49
4.7 Methanol /water system 50
4.8 Values of the constants in Eq. (4.23) and the 55
Correlations coefficient
4.9 Values of the correlations coefficients in Eq. (4.24) 56
4.10 Values of the correlations coefficients in Eq. (4.25) 57
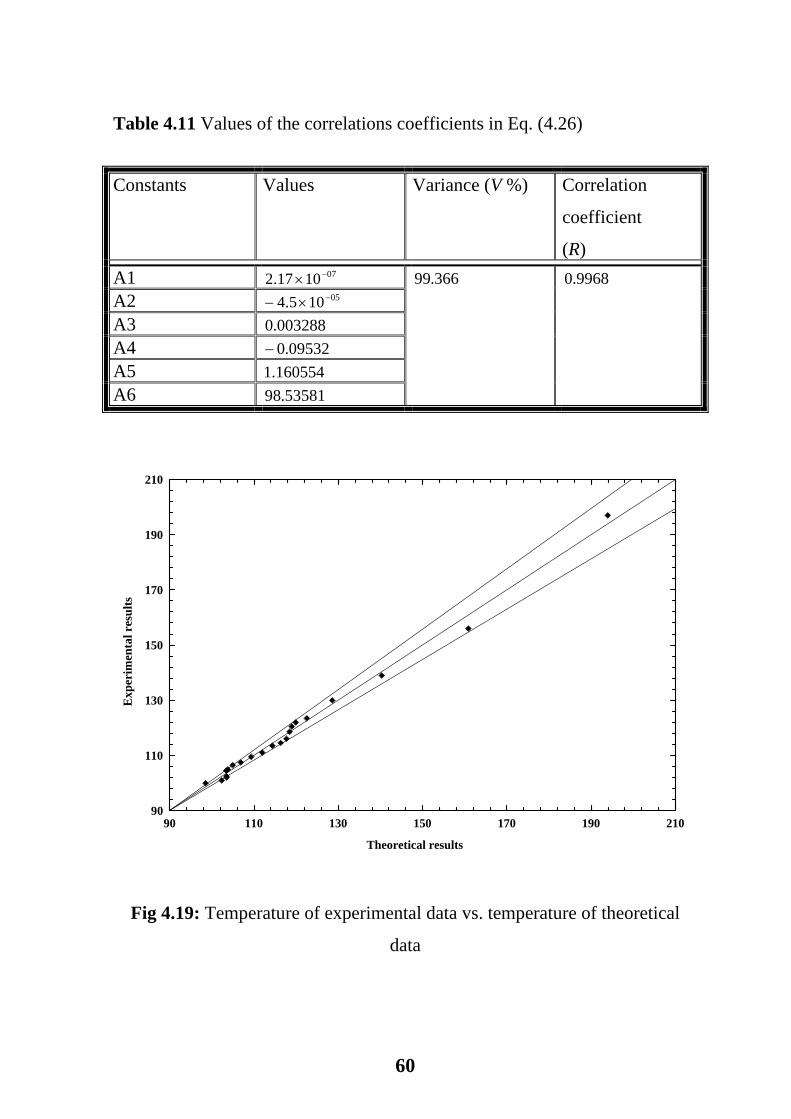
4.11 Values of the correlations coefficients in Eq. (4.26) 59
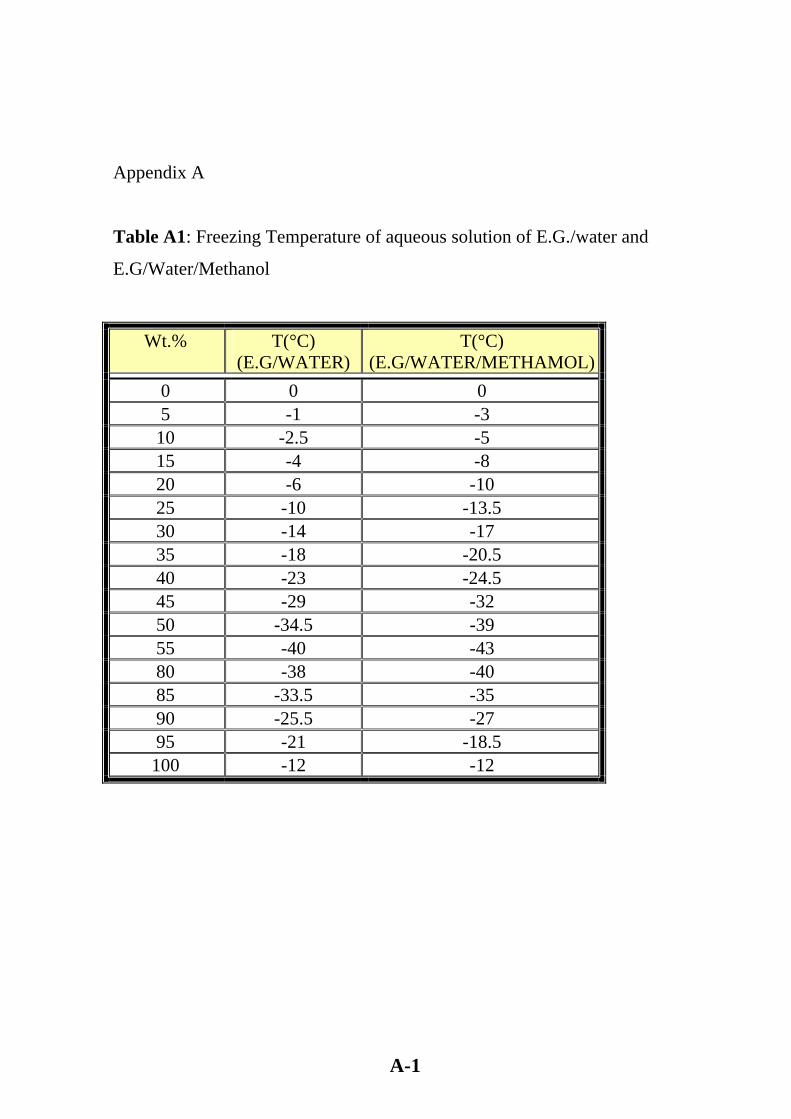
A1 Freezing Temperature of aqueous solution of A-1
E.G./water and E.G/Water/Methanol (Appendix A)
A2 Boiling Temperature of aqueous solution of A-2
E.G./water and E.G/Water/Methanol (Appendix A)
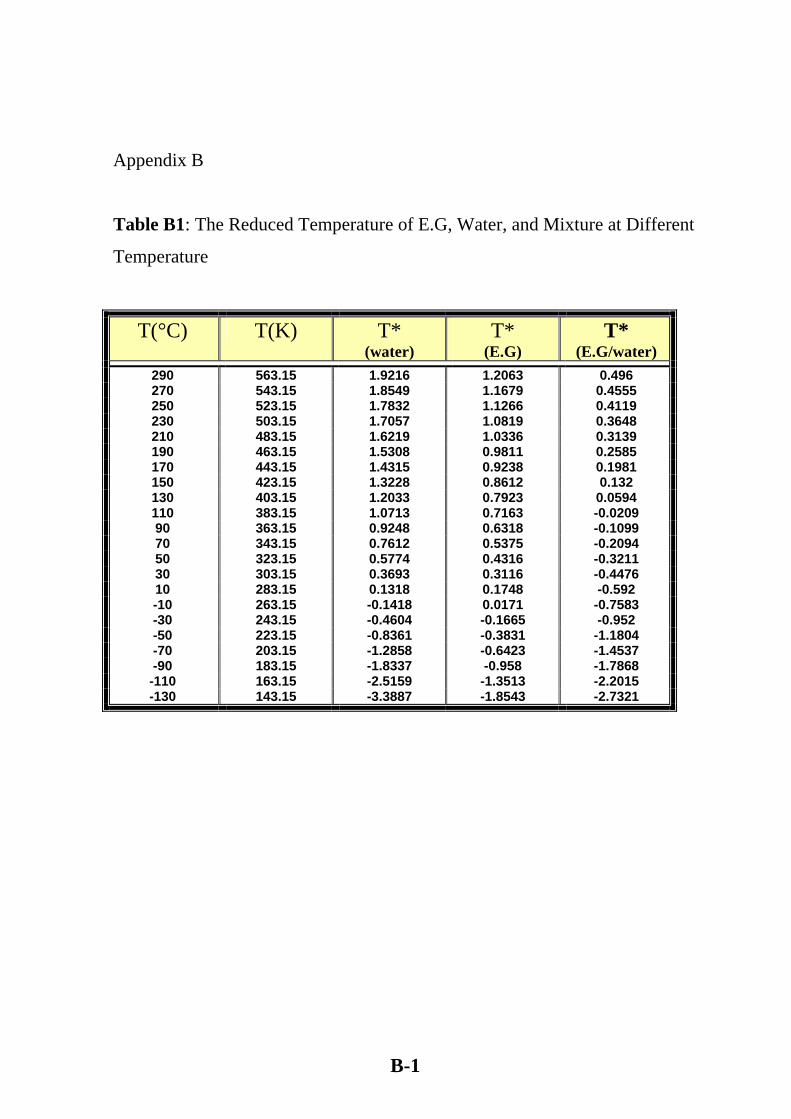
B1 The Reduced Temperature of E.G, Water, and Mixture B-1
at Different Temperature (Appendix B)
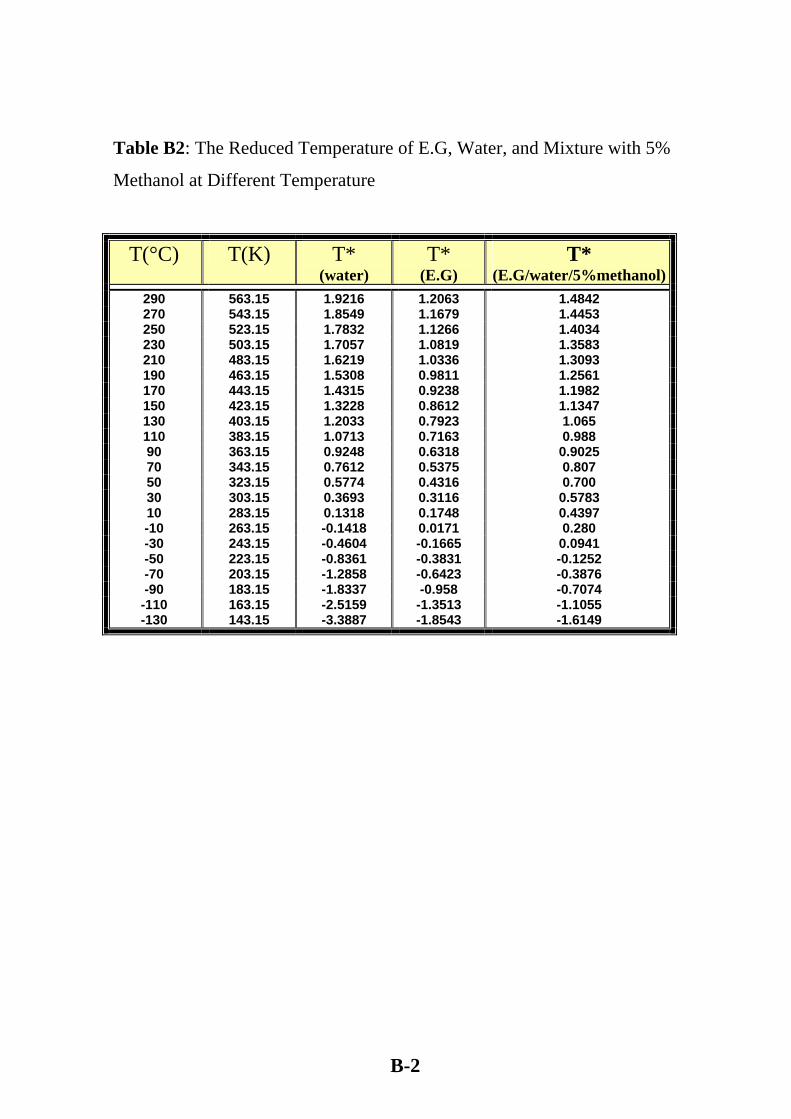
B2 The Reduced Temperature of E.G, Water, and Mixture B-2
with 5% Methanol at Different Temperature (Appendix B)
VIII
Page 12
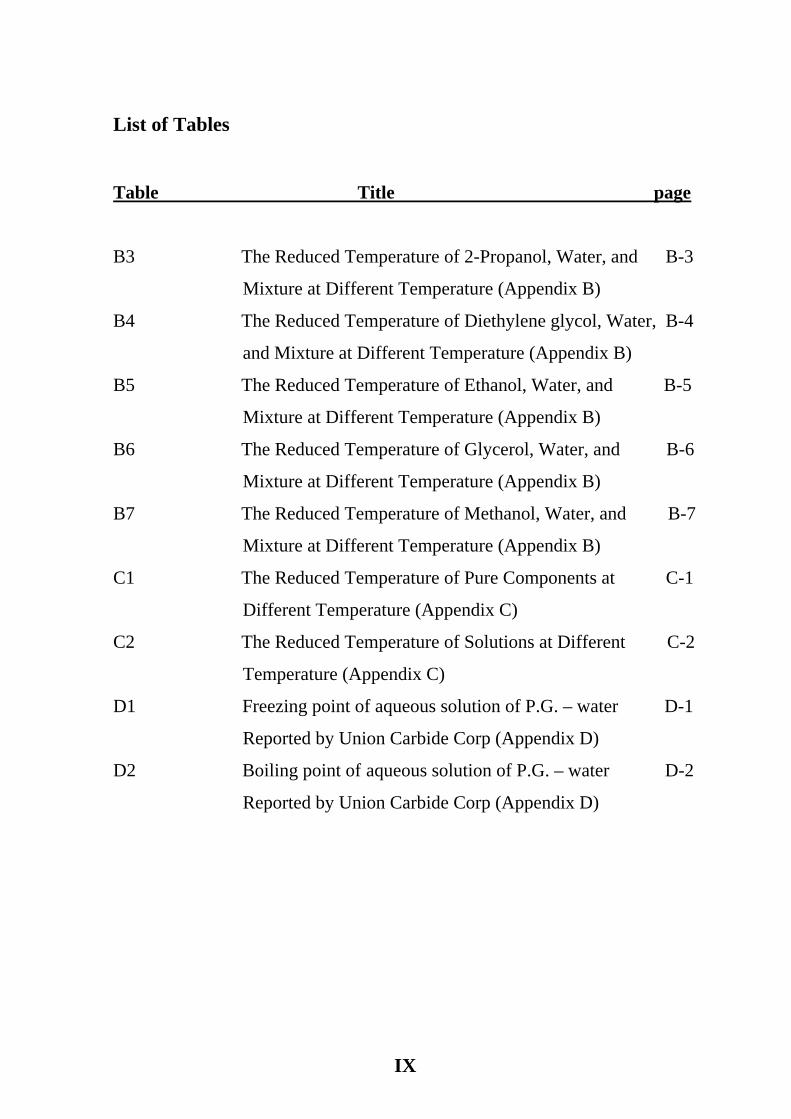
List of Tables
Table Title page
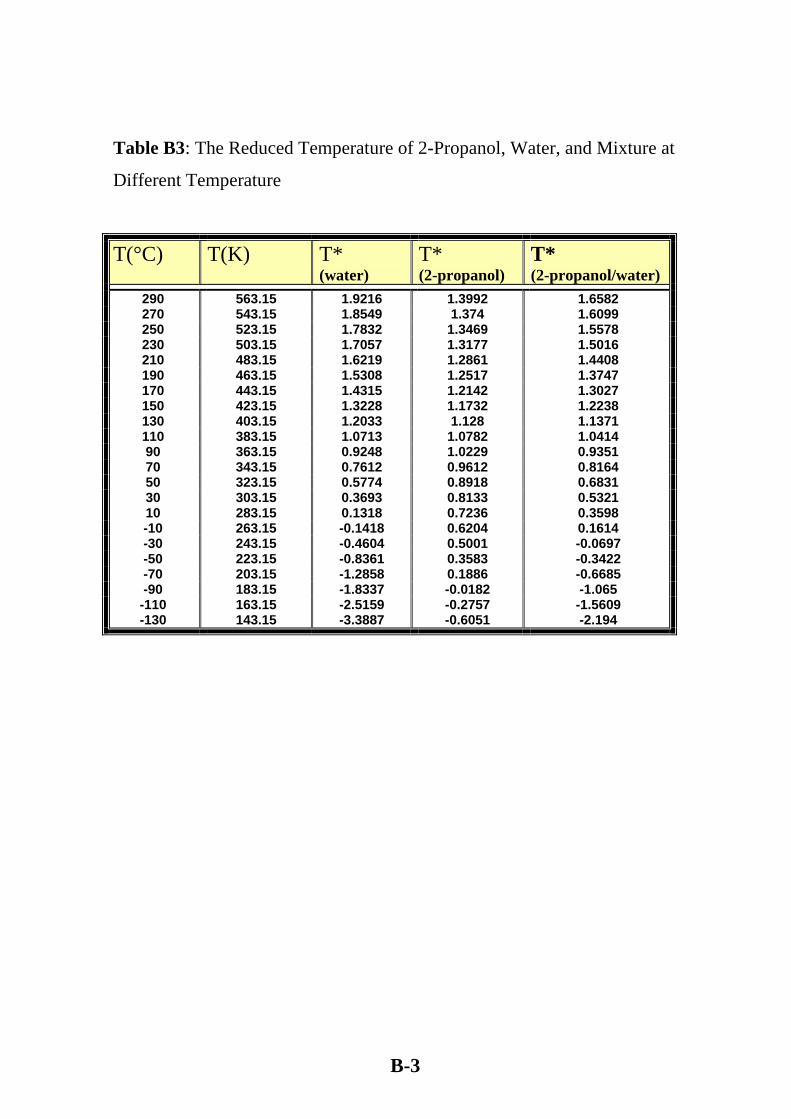
B3 The Reduced Temperature of 2-Propanol, Water, and B-3
Mixture at Different Temperature (Appendix B)
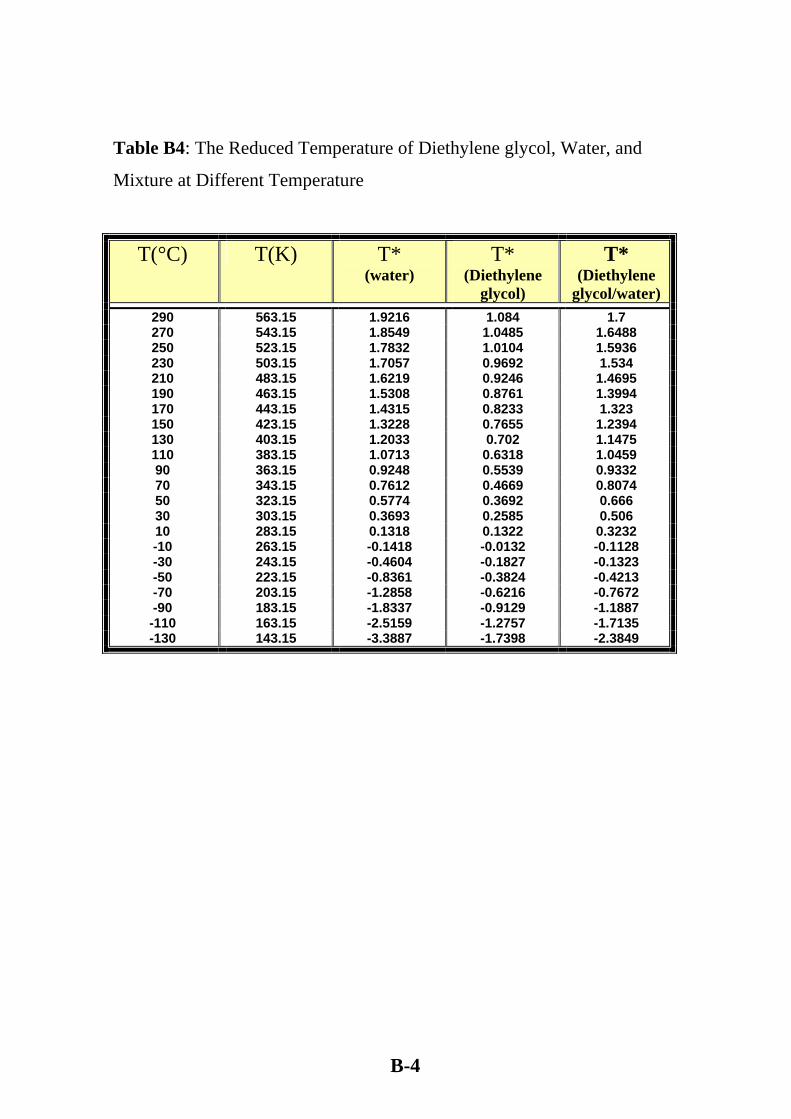
B4 The Reduced Temperature of Diethylene glycol, Water, B-4
and Mixture at Different Temperature (Appendix B)
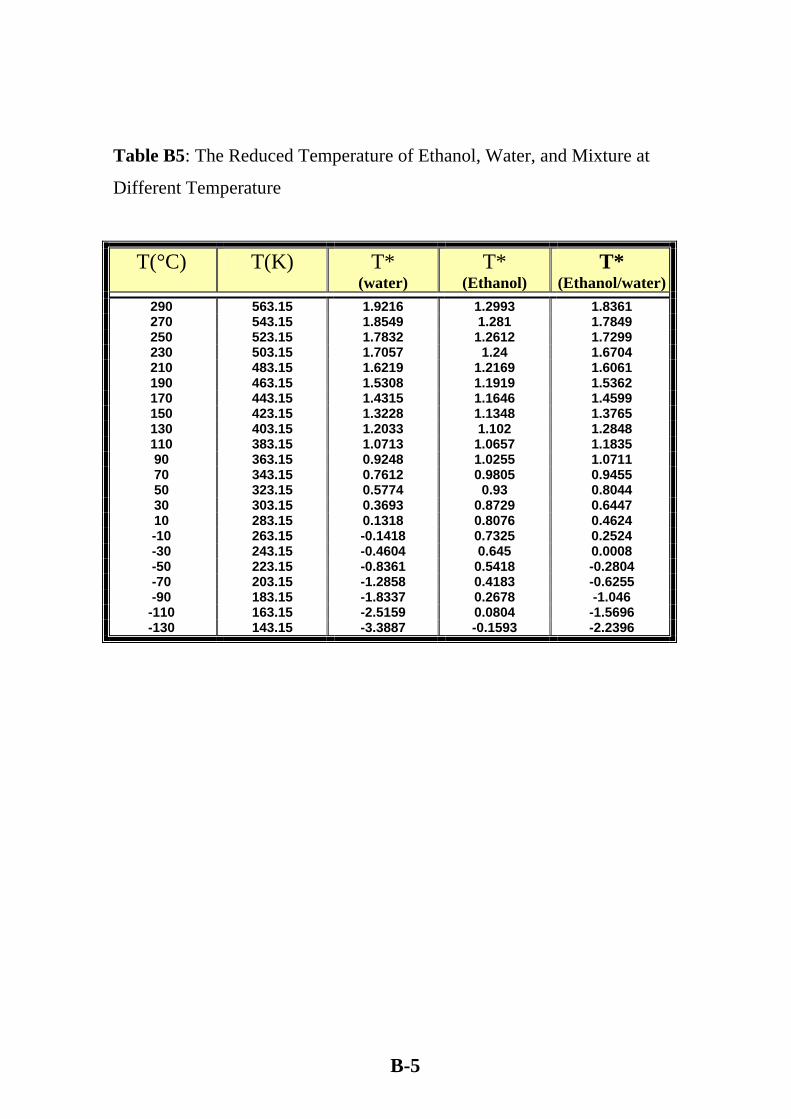
B5 The Reduced Temperature of Ethanol, Water, and B-5
Mixture at Different Temperature (Appendix B)
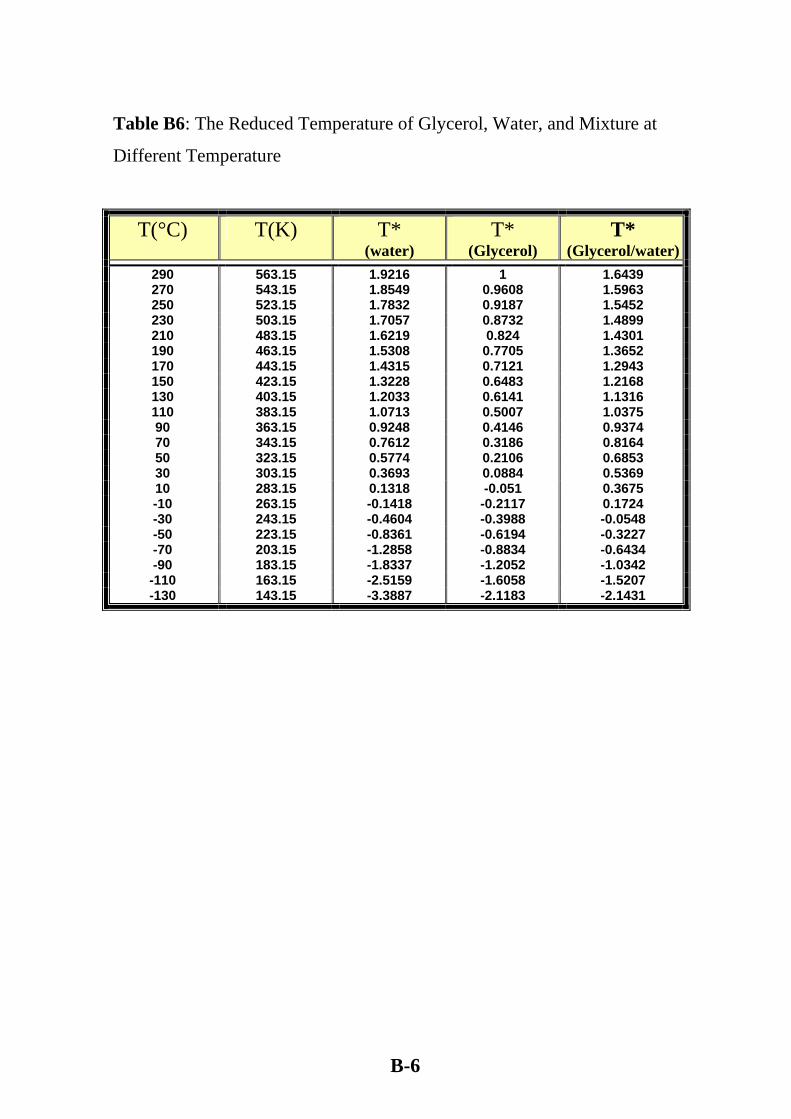
B6 The Reduced Temperature of Glycerol, Water, and B-6
Mixture at Different Temperature (Appendix B)
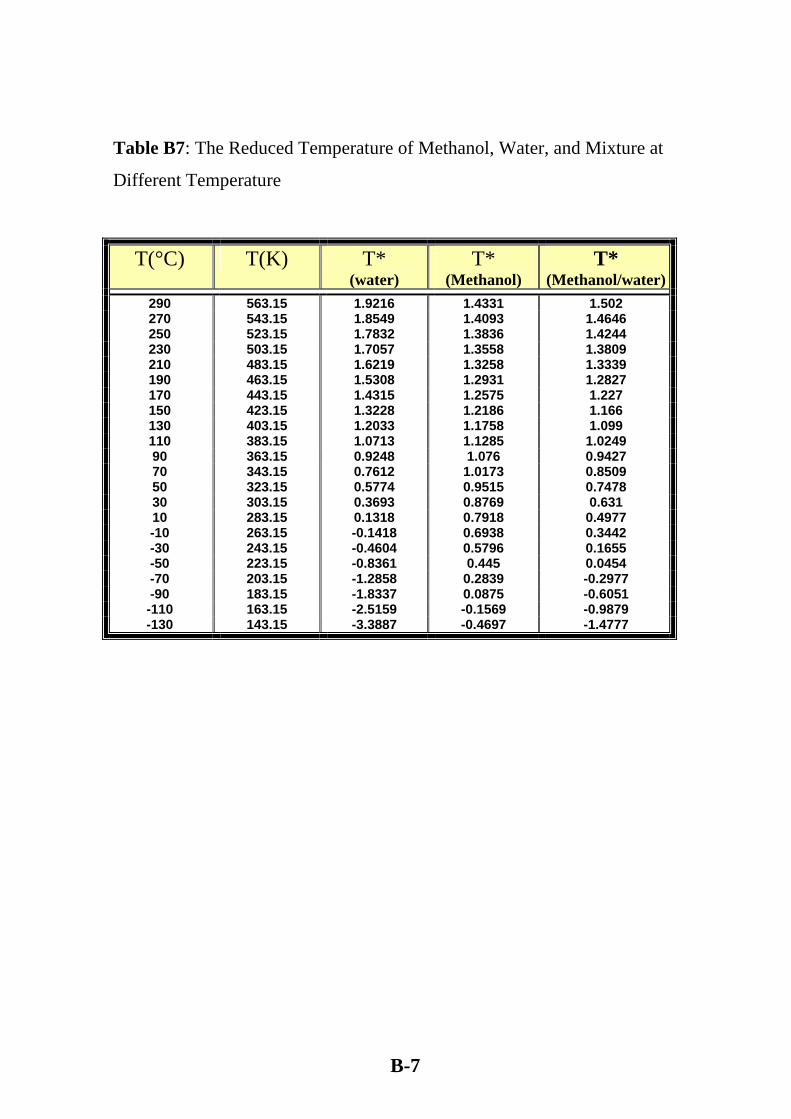
B7 The Reduced Temperature of Methanol, Water, and B-7
Mixture at Different Temperature (Appendix B)
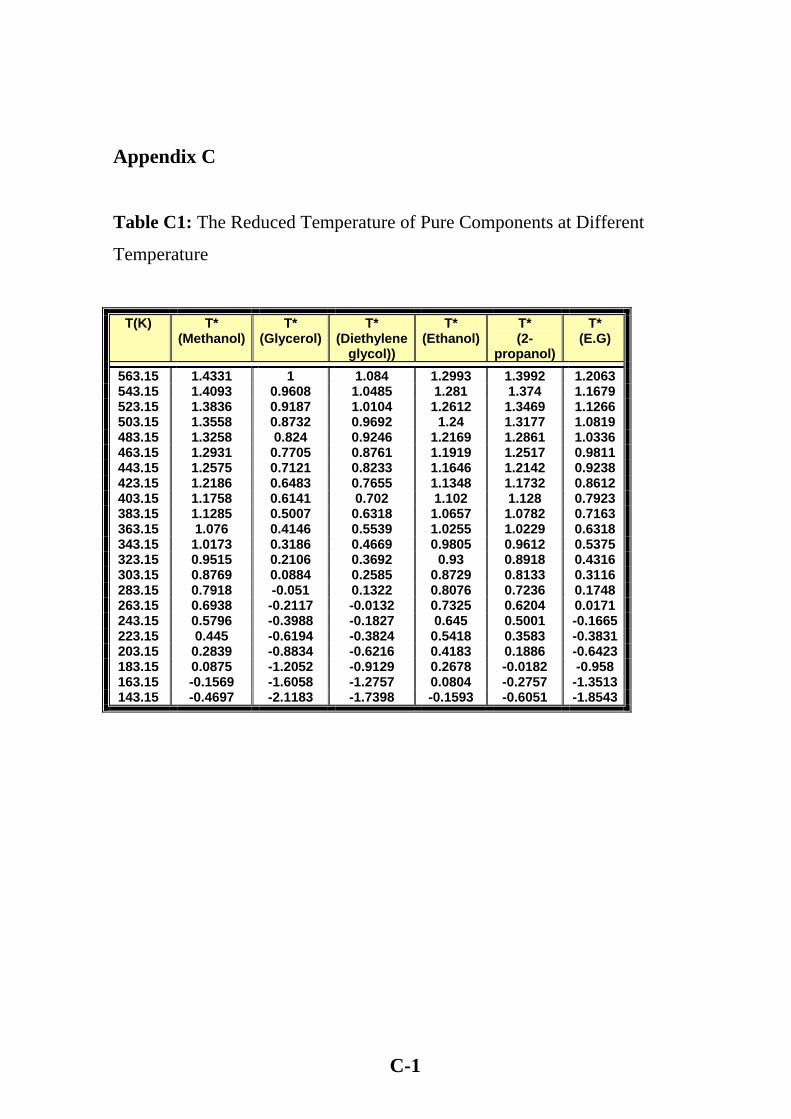
C1 The Reduced Temperature of Pure Components at C-1
Different Temperature (Appendix C)
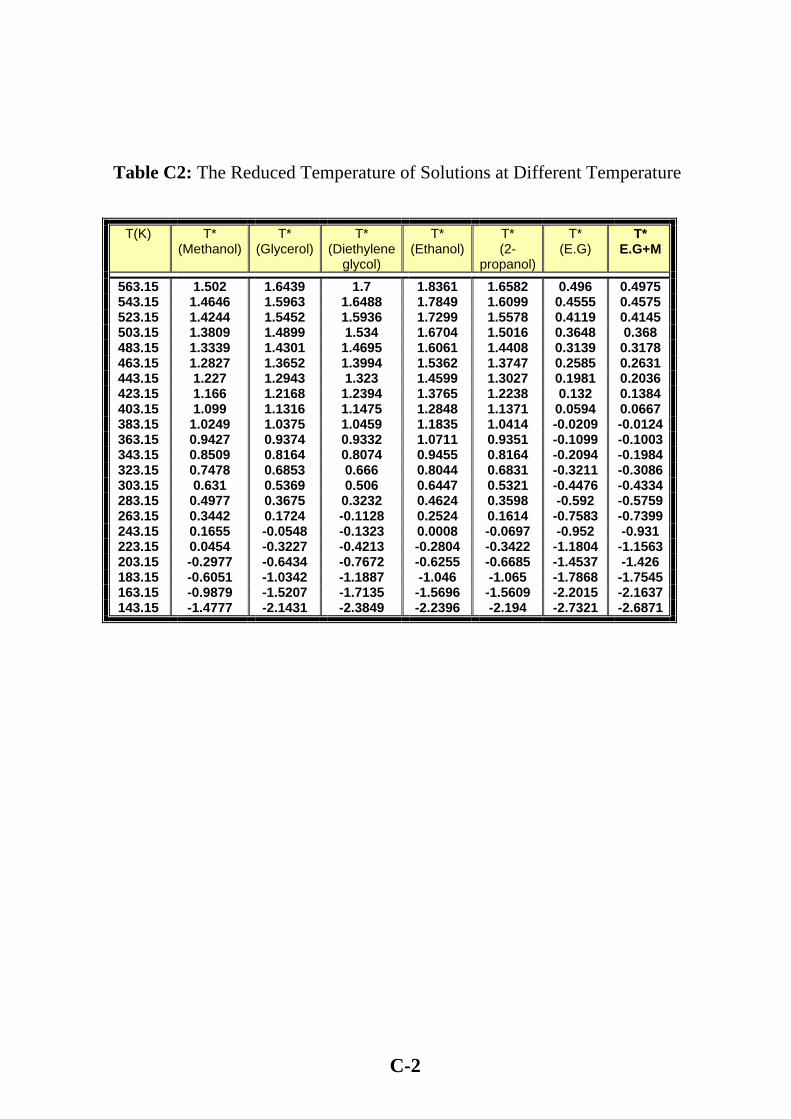
C2 The Reduced Temperature of Solutions at Different C-2
Temperature (Appendix C)
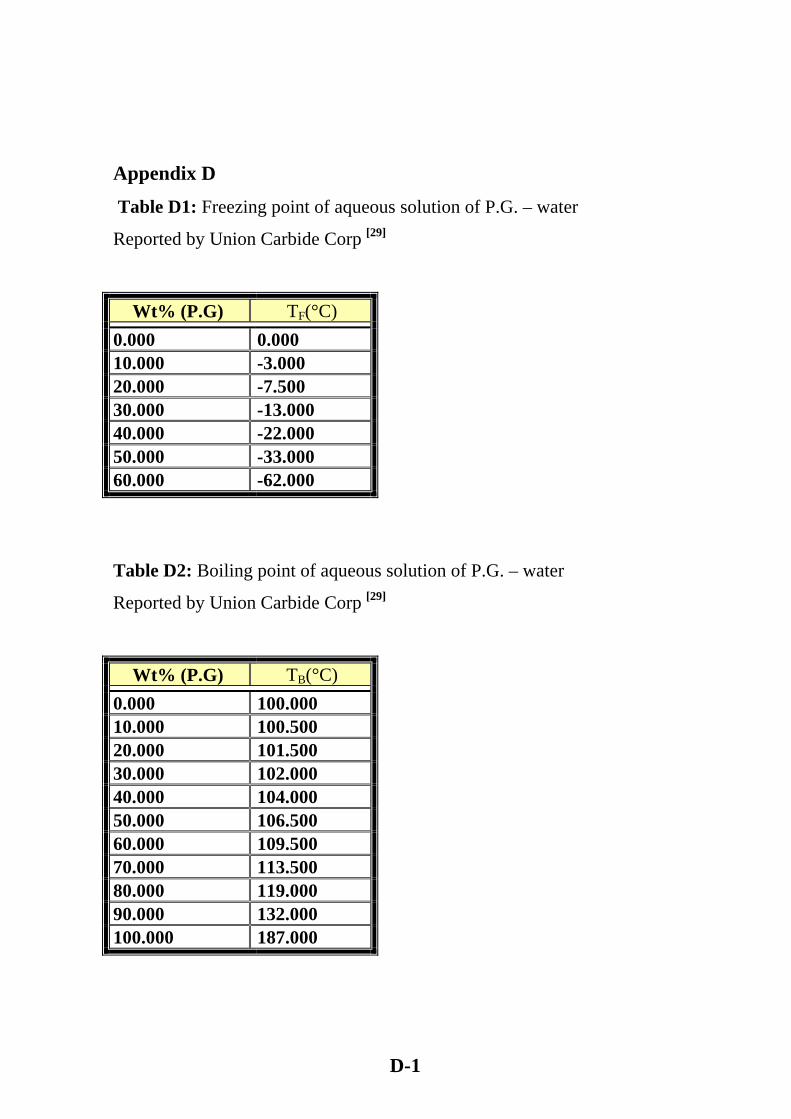
D1 Freezing point of aqueous solution of P.G. – water D-1
Reported by Union Carbide Corp (Appendix D)
D2 Boiling point of aqueous solution of P.G. – water D-2
Reported by Union Carbide Corp (Appendix D)
IX
Page 13
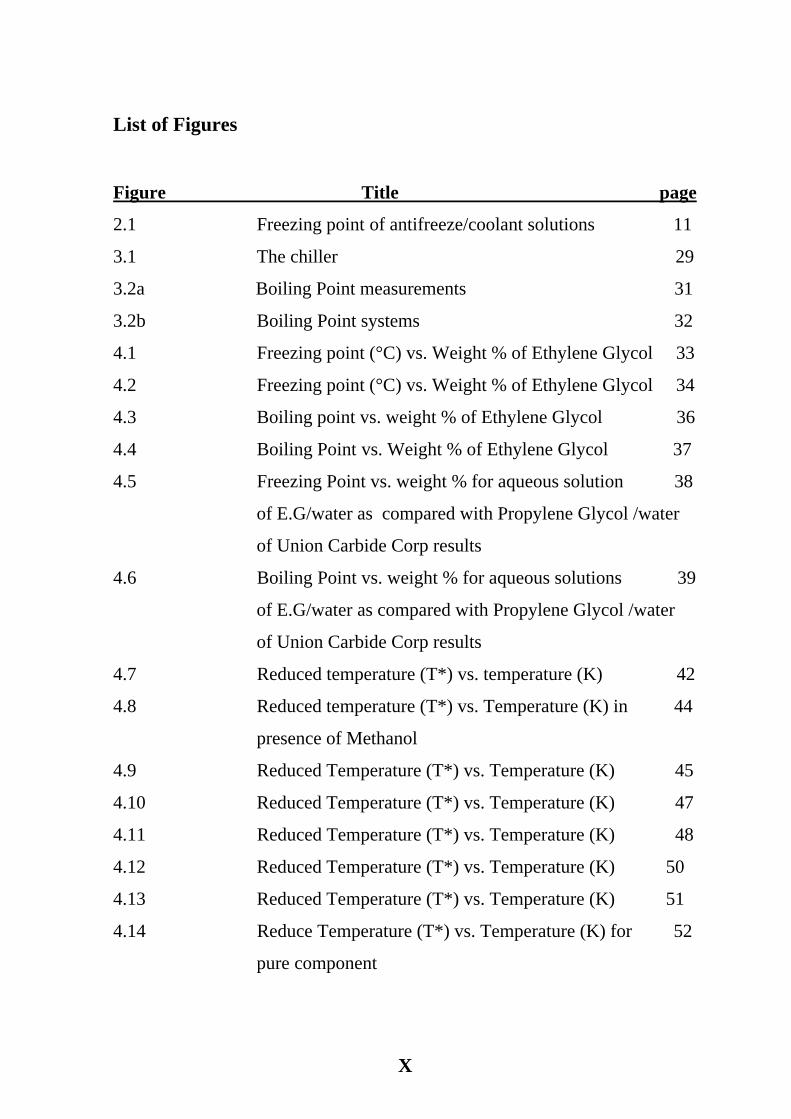
List of Figures
Figure Title page
2.1 Freezing point of antifreeze/coolant solutions 11
3.1 The chiller 29
3.2a Boiling Point measurements 31
3.2b Boiling Point systems 32
4.1 Freezing point (°C) vs. Weight % of Ethylene Glycol 33
4.2 Freezing point (°C) vs. Weight % of Ethylene Glycol 34
4.3 Boiling point vs. weight % of Ethylene Glycol 36
4.4 Boiling Point vs. Weight % of Ethylene Glycol 37
4.5 Freezing Point vs. weight % for aqueous solution 38
of E.G/water as compared with Propylene Glycol /water
of Union Carbide Corp results
4.6 Boiling Point vs. weight % for aqueous solutions 39
of E.G/water as compared with Propylene Glycol /water
of Union Carbide Corp results
4.7 Reduced temperature (T*) vs. temperature (K) 42
4.8 Reduced temperature (T*) vs. Temperature (K) in 44
presence of Methanol
4.9 Reduced Temperature (T*) vs. Temperature (K) 45
4.10 Reduced Temperature (T*) vs. Temperature (K) 47
4.11 Reduced Temperature (T*) vs. Temperature (K) 48
4.12 Reduced Temperature (T*) vs. Temperature (K) 50
4.13 Reduced Temperature (T*) vs. Temperature (K) 51
4.14 Reduce Temperature (T*) vs. Temperature (K) for 52
pure component
X
Page 14
List of Figures
Figure Title page
4.15 Reduced temperature (T*) vs. Temperature (K) for 53
mixture with water
4.16 Experimental results vs. theoretical result for 55
temperature
4.17 Experimental data vs. temperature of theoretical 56
data for temperature
4.18 Experimental data vs. temperature of theoretical 58
data for Temperature
4.19 Experimental data vs. temperature of theoretical 59
data for temperature
XI
Page 15
Chapter one
Introduction
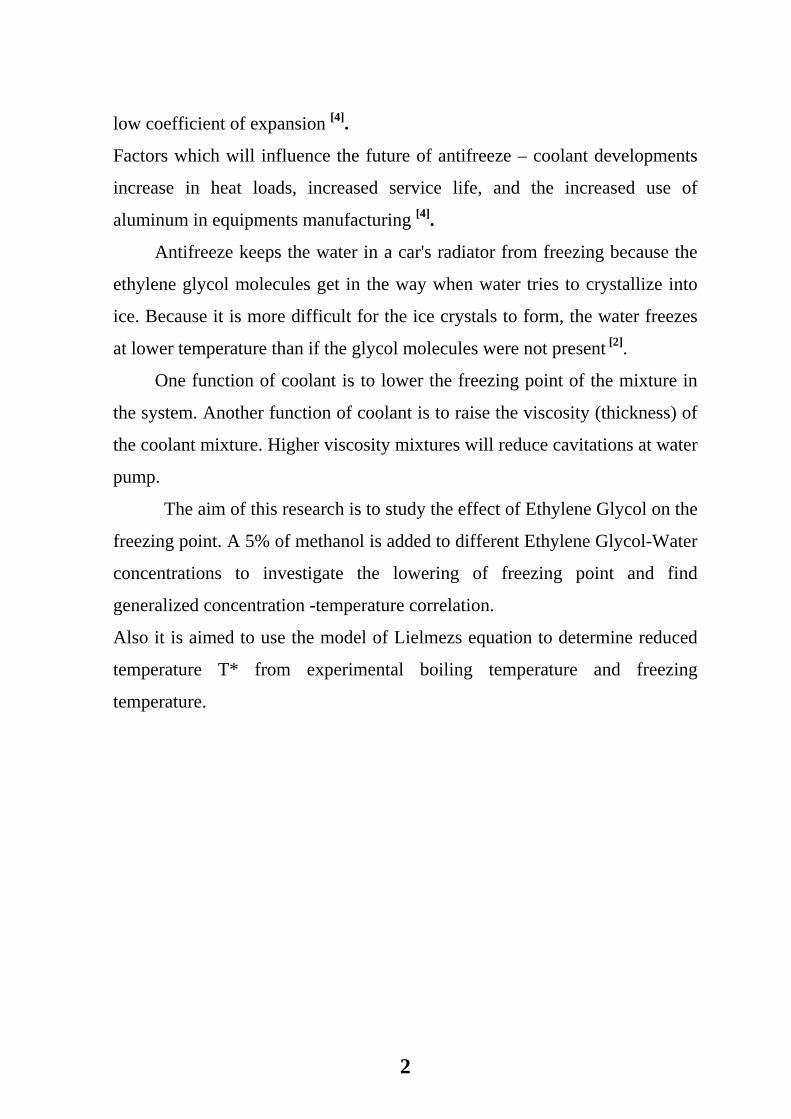
Antifreeze is a liquid, which prevents freezing when mixed with water in
cooling system. It also should provide year-round protection of the cooling
system from rust and corrosion and does not harm rubber hoses and plastics
[1].
Antifreeze is used to protect liquid-cooled internal-combustion engines to
prevent freezing during the winter and boil-over during the summer and
consequently damage to the engine water jacket and radiator.
Antifreeze and coolants contain mixture of additives designed to meet
many requirements such as introducing of more efficient engines operating at
higher temperatures, the use of light metals and plastics in the cooling system,
and a growing concern relative to the toxicological and ecological aspects of
the antifreezes and coolants themselves.
Water–ethylene glycol formulations are preferred AF and Cs (antifreeze
and coolants) because they provide year-round, cost effective, freezing,
boiling, and corrosion protection. In addition, they are chemically stable, and
compatible with plastics used in the cooling system.
The essential requirements for acceptable antifreeze-coolant materials are
:- (1) ability to lower the freezing point of water to the lowest winter
operating temperatures likely to be encountered. (2) Incapability of imparting
any undesirable properties to water that would interfere with its primary
function of efficient engine cooling. (3) Satisfactory chemical stability and
ability to protect cooling-system metals from the corrosive action of water.
Additional desirable characteristics of antifreeze materials are: availability at
low cost, minimum effect on rubber hose connections, low partial pressure,
and freedom from unpleasant odor, minimum effect on automobile finishes,
1
Page 16
low coefficient of expansion [4].
Factors which will influence the future of antifreeze – coolant developments
increase in heat loads, increased service life, and the increased use of
aluminum in equipments manufacturing [4].
Antifreeze keeps the water in a car's radiator from freezing because the
ethylene glycol molecules get in the way when water tries to crystallize into
ice. Because it is more difficult for the ice crystals to form, the water freezes
at lower temperature than if the glycol molecules were not present [2].
One function of coolant is to lower the freezing point of the mixture in
the system. Another function of coolant is to raise the viscosity (thickness) of
the coolant mixture. Higher viscosity mixtures will reduce cavitations at water
pump.
The aim of this research is to study the effect of Ethylene Glycol on the
freezing point. A 5% of methanol is added to different Ethylene Glycol-Water
concentrations to investigate the lowering of freezing point and find
generalized concentration -temperature correlation.
Also it is aimed to use the model of Lielmezs equation to determine reduced
temperature T* from experimental boiling temperature and freezing
temperature.
2
Page 17
Chapter Two
Review of Literature and TThheeoorreettiiccaall BBaacckkggrroouunndd
2.1 Antifreeze and Coolant
An antifreeze also known as engine coolant is a liquid substance that is
added to a liquid – usually water to lower its freezing point and raises its
boiling point which circulating through an internal combustion engine to cool
it. It provides protection from rust, leaks, corrosion, and does not harm rubber
hoses and plastics. In addition, it must be relatively low in cost, chemically
stable, does not have unpleasant odor, and does not affect the cooling finishes [1, 7, 9].
2.1.1 Antifreeze-Coolants Requirements and Compound
An acceptable antifreeze - coolant must specify many requirements.
The most essential of these are: (1) an effective heat exchange fluid (2)
capable of providing freezing and boiling protection, (3) capable of protecting
metals against corrosion; (4) compatible with plastics and elastomers; (5)
chemically stable at low and high temperatures; (6) compatible with hard
water; (7) low foaming; and (8) ecological and toxicologically acceptable [8, 2].
Because of its universal availability, cheapness, and high specific and
latent heats, water was selected early as the coolant for most systems. Despite
its valuable characteristics, water has two serious disadvantages: (1) its
considerable corroding action on metals; and (2) the fact that on freezing,
which can easily occur in the winter, it undergoes a volume expansion equal
3
Page 18
to about 9% of original volume, which is enough to cause rapture of the
cooling system or even the engine block (in automobiles). So that, many
materials found its way to appear through this problem to substitute water
completely or partially [5].
Antifreeze - Coolant compounds used in the past have fallen into disuse
for failure to meet one or more of these requirements. The low specific heats
and thermal conductivities of mineral oils and kerosene plus their high
viscosities at low temperatures called for a specially designed cooling system,
and this discouraged their using in automobiles. Since the heat capacity of
these materials is very low, cars using them as coolants tended to over heat in
warm weather. Additional disadvantages of kerosene and lubricating oils are
unpleasant odor, flammability, and undesirable effect on rubber hoses [5, 9].
In organic salts, such as sodium, calcium, and magnesium chlorides,
although they are effective freeze-point depressants for water and very
expensive, are too corrosive for satisfactory use in automotive cooling
systems. Salt brines, however, can be used satisfactoly where operating
conditions are less severe such as in ice making factories. There are no
generally recognized inhibitor systems for salt–based antifreezes that will
protect the variety of metals found in cooling systems. Solder and aluminum
are practically difficult to protect. If the inhibitor concentration becomes
depleted, these solutions become much more aggressive than the organic-
based antifreeze. Another disadvantage of the brine antifreeze is that it has
little effect on the boiling point [9].
Sugar and honey solutions, in addition to being thermally unstable,
require such high concentrations to obtain even moderate freeze-point
depression that the viscosity of the coolant is too high at low temperatures.
The same disadvantages have disqualified glycerol for automotive use [9]. The
first widely used automobile antifreeze was ethanol. But, at the other end of
4
Page 19
temperature scale, it did not raise the boiling point of water [28]. Ethanol and
isopropyl alcohol, along with diethylene glycol are less effective and more
expensive than methanol as freeze-point depressants. Diethylene glycol also
dissolves paints [10]. In 1930, Methanol was widely used an antifreeze. While
effective in preventing the coolant from freezing, its low boiling point and
low specific heat capacity led to considerably less cooling than water alone.
Also the concentration of methanol would tend to be reduced over time due to
its greater tendency to evaporate than the water with which it was mixed. [21]
Methanol has no taste or color but it does have a slight odor and it is
highly toxic. It is used as a fuel and antifreeze, and to make formaldehyde. It
is the simplest alcohol compound, comprised of one carbon atom, one oxygen
atom and four hydrogen (CH3OH). It also referred to as wood alcohol,
carbinol and methyl alcohol. [20, 22] In Alaska, 1989, methanol is used as
antifreeze and deicer, and it is usually mixed with water. [24]
Propylene glycol has been used in pharmaceuticals, ice-cream, make-
up, and soft drinks. Propylene glycol is not car antifreeze. Car antifreeze is
ethylene glycol, which is highly poisonous and must never be used in a well
with potable water. Using the water – propylene glycol mixture does two
things for the motor: first it keeps the motor from freezing during storage
second; it increases the lubricating properties of the water. The increased
lubricity helps maintain longer bearing life. [24]
2.1.2 Ethylene Glycol as "Permanent" Antifreeze – Coolant
Ethylene glycol (HOCH2CH2OH) is odorless, practically odorless, low-
volatility, low-viscosity, hygroscopic liquid. It is completely miscible with
water and many organic liquids. [51]
5
Page 20
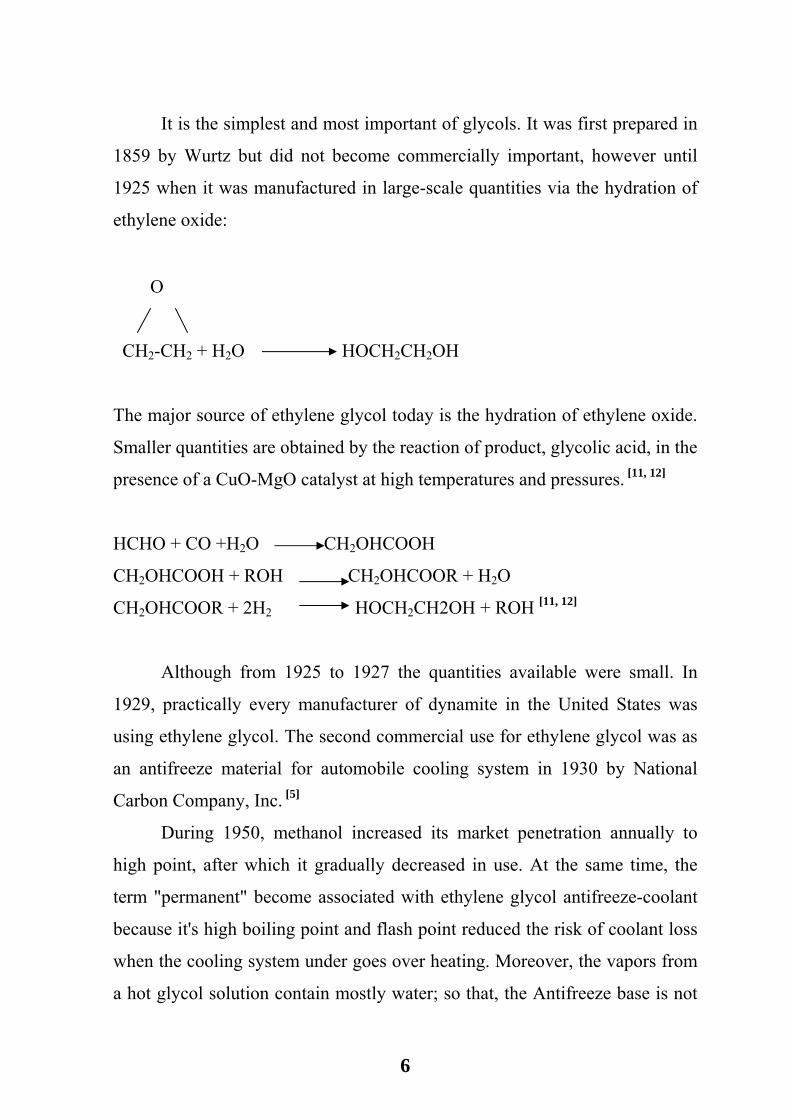
It is the simplest and most important of glycols. It was first prepared in
1859 by Wurtz but did not become commercially important, however until
1925 when it was manufactured in large-scale quantities via the hydration of
ethylene oxide:
O
CH2-CH2 + H2O HOCH2CH2OH
The major source of ethylene glycol today is the hydration of ethylene oxide.
Smaller quantities are obtained by the reaction of product, glycolic acid, in the
presence of a CuO-MgO catalyst at high temperatures and pressures. [11, 12]
HCHO + CO +H2O CH2OHCOOH
CH2OHCOOH + ROH CH2OHCOOR + H2O
CH2OHCOOR + 2H2 HOCH2CH2OH + ROH [11, 12]
Although from 1925 to 1927 the quantities available were small. In
1929, practically every manufacturer of dynamite in the United States was
using ethylene glycol. The second commercial use for ethylene glycol was as
an antifreeze material for automobile cooling system in 1930 by National
Carbon Company, Inc. [5]
During 1950, methanol increased its market penetration annually to
high point, after which it gradually decreased in use. At the same time, the
term "permanent" become associated with ethylene glycol antifreeze-coolant
because it's high boiling point and flash point reduced the risk of coolant loss
when the cooling system under goes over heating. Moreover, the vapors from
a hot glycol solution contain mostly water; so that, the Antifreeze base is not
6
Page 21
lost by evaporation and freezing protection is maintained [16]. In the years
1946-1960 the antifreeze market settled on two major products, methyl
alcohol and ethylene glycol; by 1960 the glycol had increased its share of the
market to over 90% [9, 5]. In 1953, however, some automobile companies
began installing ethylene glycol antifreeze on the assembly lines, and this
practice increased until, in late 1962, methanol was no longer used. All
antifreeze put in new cars at the factory was ethylene glycol-based and most
of car companies began putting ethylene glycol coolants in all their new cars
all year round. [16]
Table 2.1 shows the best available information on consumption of
ethylene glycol antifreeze in United States. This includes data Compiled by
the chemical specialties manufactures association and industrial estimates.
One of the top 50 chemicals produced in 1995, was ethylene glycol.
Ethylene glycol can be found in hydraulic brake fluids, adhesives, printer's
inks, and wood stains. The chemical is also used to de-ice airplanes,
synthesize safety explosives, and is used in softening agents for cellophane. It
is used in the manufacture of polyester films and fibers, plasticizers, and
elastomers. It is also an intermediate in the synthesis of PET (polyethylene
terphthalate), the polymer used in soft drink bottles. However, the great need
of ethylene glycol lies mainly in the great number of automobiles on the road,
not only in the United States, but also across the globe. This chemical is
mainly used as the active ingredient in antifreeze. In antifreeze, ethylene
glycol decreases the freezing point and increases the boiling point of the
fluids in a vehicle's radiator, thus preventing over boil and freezing. [50]
7
Page 22
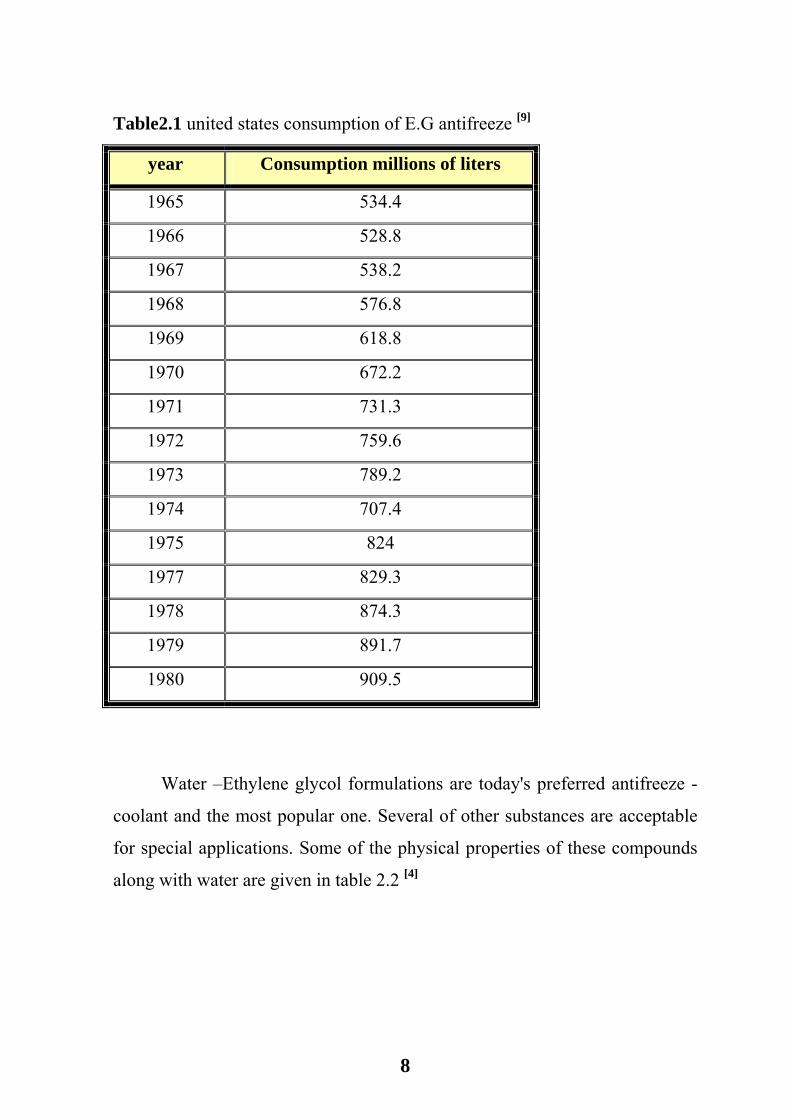
Table2.1 united states consumption of E.G antifreeze [9]
year Consumption millions of liters
1965 534.4
1966 528.8
1967 538.2
1968 576.8
1969 618.8
1970 672.2
1971 731.3
1972 759.6
1973 789.2
1974 707.4
1975 824
1977 829.3
1978 874.3
1979 891.7
1980 909.5
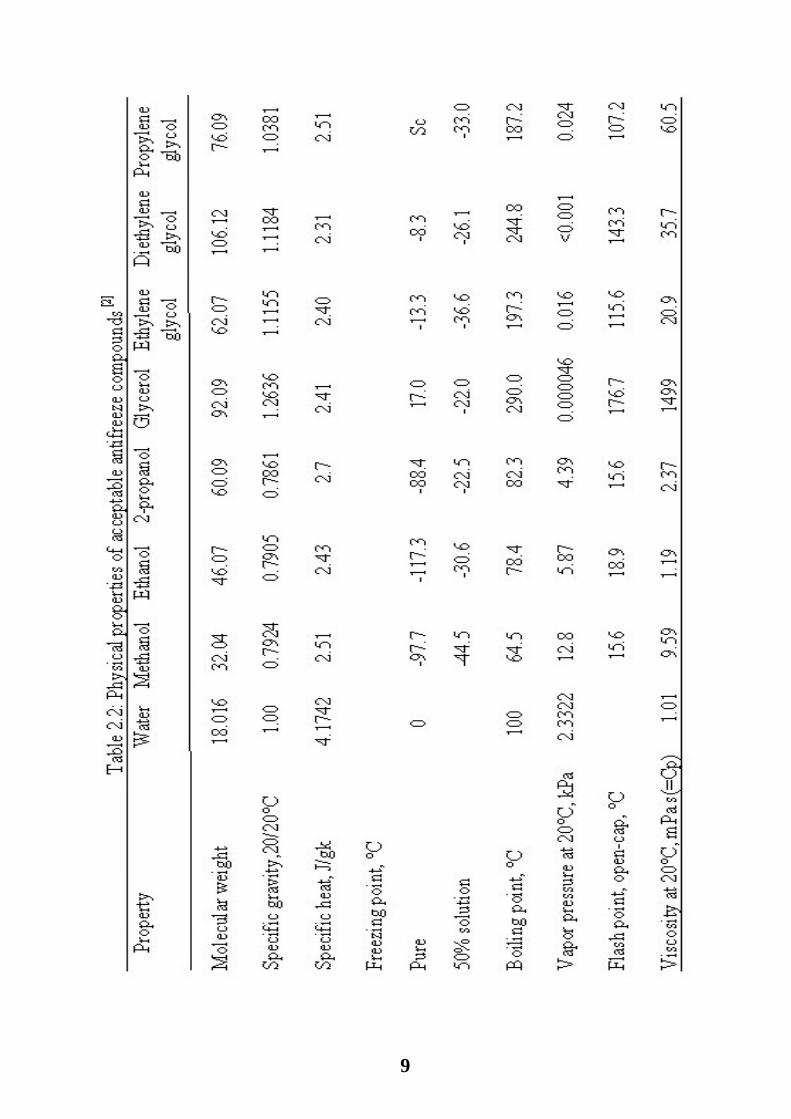
Water –Ethylene glycol formulations are today's preferred antifreeze -
coolant and the most popular one. Several of other substances are acceptable
for special applications. Some of the physical properties of these compounds
along with water are given in table 2.2 [4]
8
Page 24
2.1.3 Freezing Point of Antifreezes
For dilute ideal solutions of nonelectrolytes, the depression of the
freezing point of solvent brought about by addition of a solute is proportional
to the molar concentration of the solute and independent of the nature of the
solute. mKT FF ×=∆ ; Where ∆TF is freezing-point depression; KF is molal
freezing-point lowering of the solvent (1.86°C m-1. for water); m is molality
of solution. Although this equation is strictly applicable to dilute ideal
solutions, fair results can be obtained by its use for nonelectrolyic antifreezes.
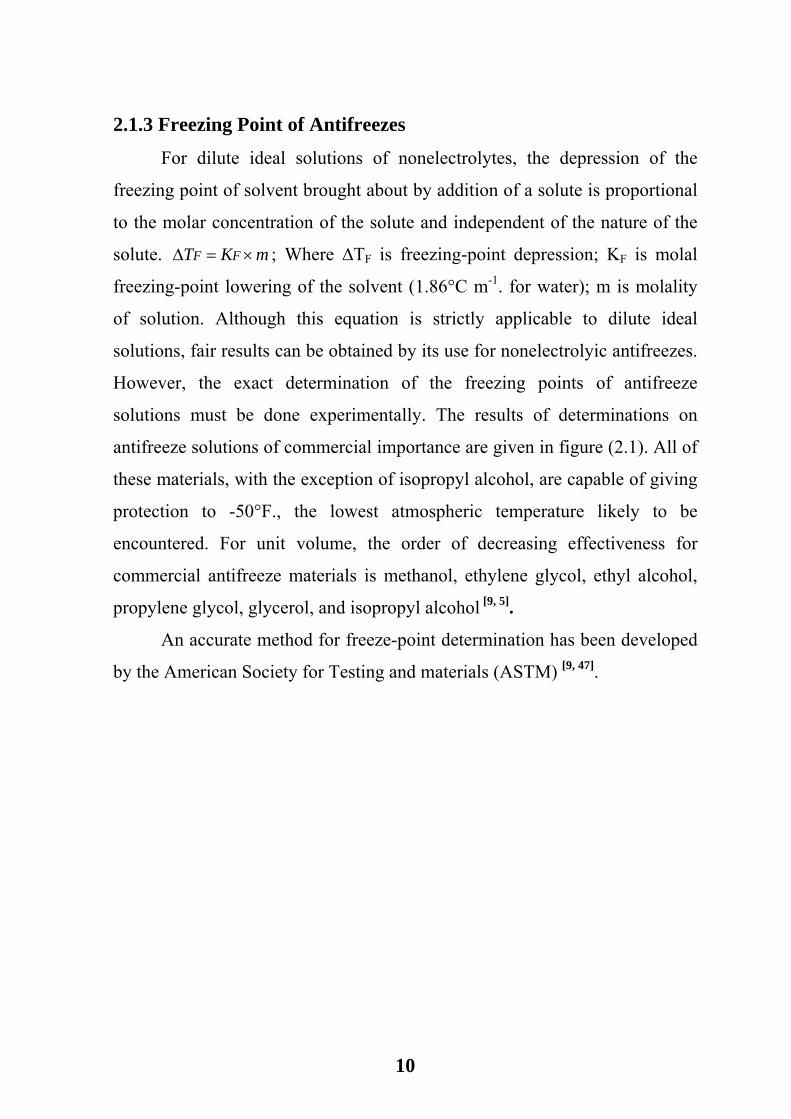
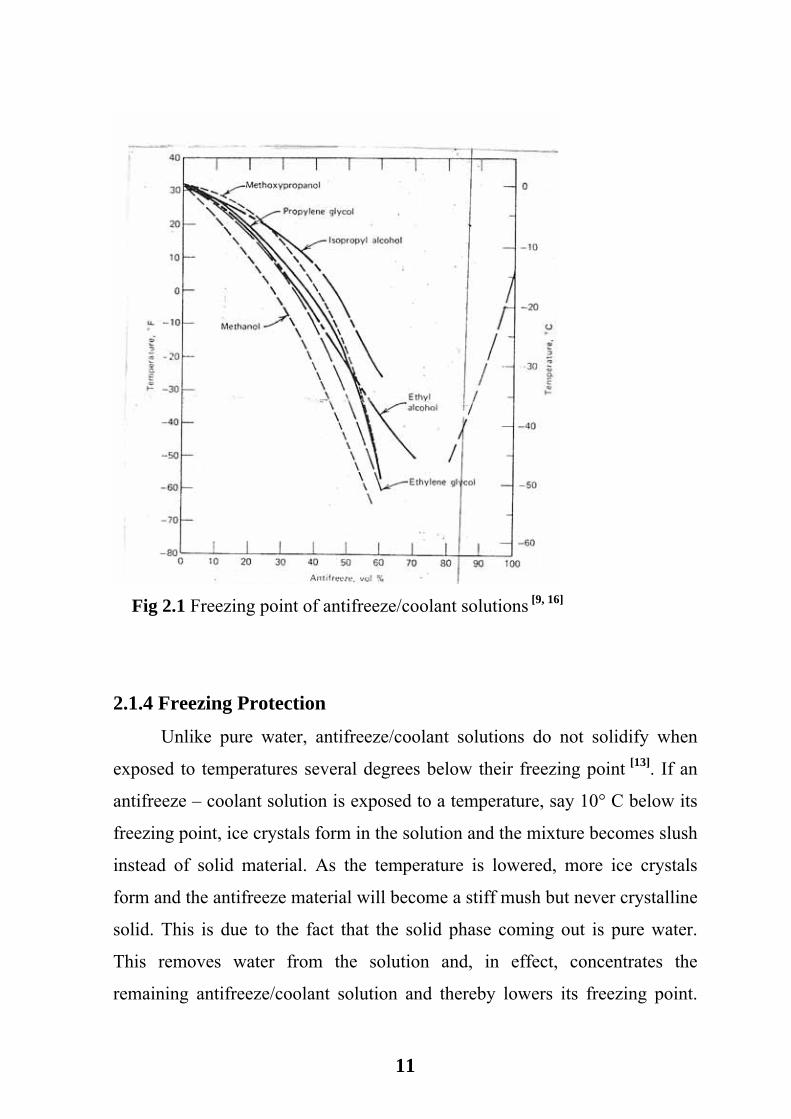
However, the exact determination of the freezing points of antifreeze
solutions must be done experimentally. The results of determinations on
antifreeze solutions of commercial importance are given in figure (2.1). All of
these materials, with the exception of isopropyl alcohol, are capable of giving
protection to -50°F., the lowest atmospheric temperature likely to be
encountered. For unit volume, the order of decreasing effectiveness for
commercial antifreeze materials is methanol, ethylene glycol, ethyl alcohol,
propylene glycol, glycerol, and isopropyl alcohol [9, 5].
An accurate method for freeze-point determination has been developed
by the American Society for Testing and materials (ASTM) [9, 47].
10
Page 25
Fig 2.1 Freezing point of antifreeze/coolant solutions [9, 16]
2.1.4 Freezing Protection
Unlike pure water, antifreeze/coolant solutions do not solidify when
exposed to temperatures several degrees below their freezing point [13]. If an
antifreeze – coolant solution is exposed to a temperature, say 10° C below its
freezing point, ice crystals form in the solution and the mixture becomes slush
instead of solid material. As the temperature is lowered, more ice crystals
form and the antifreeze material will become a stiff mush but never crystalline
solid. This is due to the fact that the solid phase coming out is pure water.
This removes water from the solution and, in effect, concentrates the
remaining antifreeze/coolant solution and thereby lowers its freezing point.
11
Page 26
The freezing point reported is the temperature at which the first ice crystals
appear, but the mixture will only become completely solid at the eutectic
temperature, although it may become very stiff before this is reached. For
practical purposes, therefore, it may be said that antifreeze/coolant solutions
have a freezing range rather than freezing point. While it is true that this
phenomenon practically eliminates the possibility of block breakage and
cooling system is protected, for stiff slush's can not be circulated and
therefore will not transfer heat as they should; this leads to boil over, local
overheating, and block breakage due to excessive heat[1,5].
Freezing protection of given antifreeze – coolant solution is taken to
mean the lowest temperature at which the solution operates satisfactory as
coolant. The difference between the freezing point (point at which the first ice
crystals appear) and the protection point varies with the nature of the
antifreeze – coolant and its concentration. Generally speaking, the greater
concentration, the greater the spread between freezing point and protection
point [5, 14].
In practice, depending upon the climate, freezing protection ranging
from -20 to -40°C (-4 to -40°F) will be required.
2.1.5 Boiling Point of Antifreezes
The boiling point of an antifreeze, and more important, of the coolant
solution used in the engine, can greatly influence the performance of the
engine. The low boiling point of methanol solutions (80°C for a concentration
of 35%) has practically eliminated it as antifreeze in high-pressure cooling
systems. Vehicles operating with methanol as an antifreeze must be equipped
with a low-temperature (70°C) thermostat whether the system is pressurized
or not. Since most automobiles today are equipped with hot water circulating
12
Page 27
heaters, the higher the coolant temperature the more effectively the passenger
compartment is heated in cold weather.
The boiling point is also important as it affects evaporation losses of
the coolant, water pump cavitations caused by flash boiling on the suction
side of pump, and after-boil. After-boil is boiling of coolant after a hand run
when the coolant temperature is relatively high and the engine is quite hot. It
is caused by residual heat form the shut off engine soaking into the coolant,
which is not being circulated. Although after-boil can occur with any coolant,
it is much more frequent with low boiling materials. [9]
For dilute ideal solutions of nonelectrolytes, the boiling point elevation of a
solvent brought about by addition of a solute is proportional to molar
concentration of the solute and independent of the nature of the solute.
mKT BB ×=∆ ;
Where:
∆TB is the boiling point elevation; KB is boiling point elevation constant
(0.51°C*m-1 for water), m is molality of the solution. [49]
2.1.6 Boiling Protection
As the power increased, more heat must be rejected through the cooling
system. Additional cooling can be provided in two ways – by enlarging the
cooling capacity of the system, or by increasing the cooling system pressure
(and thus the boiling point of the coolant) and following the coolant to
circulate at higher maximum temperature. Within reasonable limits, a higher
coolant temperature also helps increase the operating efficiency of the system
since less heat rejected to the coolant and more is available to power the
system. This temperature increase also has been shown to improve lubrication
and reduce engine wear. Practical limits obviously exist, e.g. as the coolant
13
Page 28
temperature increases there is a commensurate increase in the operating
temperature of the lubricating oil. If this temperature is increased too much,
rapid oxidation of oil occurs with a decrease in lubricating efficiency.
The elevated boiling point of ethylene glycol antifreeze – coolant relative to
water is important because it reduces evaporation losses, water pump
cavitations caused by flash boiling on the suction side of the pump and after-
boil caused by residual heat from a shut-off of the system [9, 1, 16].
2.2 Antifreeze – Coolant Applications
Antifreeze – coolants have many areas in addition to cooling systems
where freeze-retarding substances are needed such as, stationary engines used
in pipelines service, refrigeration systems, snow-melting system, hot-water
heating systems, air conditioning systems, solar energy units, freezing and
freeze drying units. Hydraulic systems often have antifreeze installed when
the operation of the equipment is intermittent and the possibility of freezing
exist. In many of these cases, the antifreeze – coolant used as a heat transfer
fluid and is designed to operate at temperatures below the freezing point of
water. In choosing antifreeze – coolant for one of these operations,
consideration should be given to the types of metals in the system, possible
fire hazards, and the operating conditions which may influence the selection
of the antifreeze base or the inhibitors used in it [9, 17, 18].
Ethylene glycol however remains the most important of the antifreezes
– coolants. While the biggest outlet for ethylene glycol is anti-freeze for
automobile-engine cooling systems, it has many applications. Its use as an
airplane-engine coolant developed rapidly during the World War II. It is
consumed as ethylene glycol dint rate in the manufacture of explosives.
14
Page 29
Polyethylene glycols, alkyl resins, and other miscellaneous materials are
manufactured form it. Consumption is significant in cellophane, hydraulic
fluids, adhesives, and radio condenser pastes. Newer applications in crude its
use as an intermediate for the synthetic fiber "Dacron" and for glyoxal [19].
2.2.1 Aircraft Deicing
Many liquids have been tested for their ability to melt ice from aircraft
surfaces, the more satisfactory ones being ethylene glycol, propylene glycol,
1,3-butylene glycol and glycerol. Of these, ethylene glycol and propylene
glycol are the most widely used. Diethylene glycol, triethylene glycol,
dipropylene glycol, and glycerol are used in some commercial deicing fluids,
but the first three, when used as the major component, have a tendency to mar
acrylic plastics, doped fabric finishes, and certain painted surfaces.
An ideal deicing fluid should: (1) display superior ice removing ability,
(2) be noncorrosive to metals, and (3) not craze or discolor plastics, painted
surfaces, or elastomers or otherwise cause deterioration of any of the
materials of construction.
Most products are based on ethylene glycol with propylene glycol,
corrosion inhibitors, a wetting agent, in some cases a thickener, and a small
amount of water. Some customers request an added dye. Many formulations
contain a triazole compound to reduce the hazard of glycol decomposition on
noble metal electrodes.
The ethylene glycol provides most of the freezing point depression. It
may contain small amounts (5-10 %) of higher glycols incidental to its
manufacture; these seem to have little effect on the overall performance of the
formulation. The propylene glycol reduces the low temperature pour point of
the solution. Propylene glycol is being increasingly used because it is much
15
Page 30
less toxic than ethylene glycol. The corrosion inhibitors may include
phosphates, nitrites, nitrates, borax, and silicates. Because of their superior
performance on metal surfaces, nonionic and anionic surfactants are preferred
to cationics as wetting agents. The water serves to solubilize the additives,
depresses the pour point of the fluid, raises the flash point, and reduces the
cost. Dye is often used to identify various solutions and to reduce the hazard
of accidental misapplication of fluid. It also serves to demarcate the areas that
have been treated. [9, 17]
2.3 Ethylene Glycol and Corrosion Problem
Ethylene glycol, which is the major antifreeze material, oxidized to a
mixture of corrosive acids of which the formic acid and oxalic acid are the
major constituents. This oxidation is promoted by mechanical defects, such as
air suction at pump shaft seal, bad hose connection, and exhaust gas leakage.
The resulting solution will be much more corrosive than tap water to which
no antifreeze has been added. The factors responsible for the rapid oxidation
of the antifreeze – coolant also are excessive aeration, the presence of local
hot spots in the cooling system, and operating of the antifreeze – coolant at
consistently high temperatures. It is proved that the addition of ethylene
glycol gives higher corrosion rate for many metals than when water alone is
used. This increase was especially the case for aluminum. [25, 26]
Thus, uninhibited solutions of ethylene glycol and water are corrosive to
metals contained in cooling system, requiring the addition of an effective
corrosion inhibitor package. The metals that need to be protected are of four
classes:
1. Iron, steel, and gray cast iron
2. Aluminum alloys in cast and wrought forms
16
Page 31
3. Copper and brass
4. Lead based solders
So that, many corrosion problems may arise such as pitting, crevice,
deposition of corrosion products, cavitations in coolant pumps, and high
temperature corrosion. This means that several inhibitors are required in a
balanced formulation to protect the aluminum, steel, cast iron, solder and
brass cooling system components it may encounter in service. [1, 27]
2.4 Characteristics of Some Freezing Point Depressant Additives
Ethylene glycol is slightly flammable and harmful. The minimum lethal
dose is 1-1.5 ml/kg or approximately 100 ml for an adult. Short-term
exposure can result in irritation to eyes, skin and respiratory tract. Repeated or
long-term exposure can bring about effects on the central nervous system and
eyes.
Propylene glycol is slightly water-polluting but practically non-toxic to
humans. The minimum lethal dose of pure propylene glycol for human adults
is more than 15 times greater than with ethylene glycol. Propylene glycol has
lower fire hazard when exposed to heat or flame. Propylene glycol can have
quite a low pH that might affect the corrosion potential.
Ethyl alcohol is highly flammable and therefore dangerous when
exposed to heat and flame. Vapours may form explosive mixtures with air.
Most vapours are heavier than air. Ethyl alcohol has very low surface tension,
which may cause leakage in sealing devices and foaming.
Methyl alcohol is like ethyl alcohol highly flammable. Methyl alcohol
is toxic. The chemical is a skin and eye irritant. The substance may be fatal if
inhaled, ingested or absorbed through the skin. Ingestion can also cause
blindness. The minimum lethal dose for human adults, in absence of medical
17
Page 32
treatment, is between 0.3 and 1 g/kg. Methyl alcohol is not compatible with
elastomers made of 100% FKM (Viton A), soft rubber or polyether-urethane
(EU).
Ammonia causes strong irritation to eyes, skin and the respiratory tract.
Swallowing the liquid is corrosive to the mouth, throat and stomach.
Exposure to high concentrations can cause temporary blindness and eye
damage. Ammonia is highly toxic to aquatic organisms. Ammonia is not
compatible with elastomers made of 100% soft rubber, isoprene (IR), natural
rubber (GRS), polyurethane (AU) or silicon rubbers. Ammonia is not
compatible with copper [57].
2.5 Cooling System Basics
The cooling system includes the water jackets, water pump, radiator,
fan, fan shroud, heater, thermostat, coolant, radiator cap, overflow reservoir,
and various hoses that circulate the coolant. Modern cooling systems are
closed systems, which mean they use a coolant recovery reservoir. When the
engine is shut off and cools downs, a vacuum is created as the coolant
contracts. This opens a valve in the radiator cap and sucks the overflow into
the reservoir. When the engine warms up again, the process reverses.
A water and antifreeze – coolant mixture cools the engine. It circulates
through the water passages while the water pump pushes the hot coolant into
the radiator. The radiator cools the mixture as much as possible before it
returns to the engine. All the little fins dissipate heat, which is carried away
by the air flowing through the radiator. Air enters through the grille as you
drive, and the fan helps pull it in. The fan also draws air when the vehicle is
stopped. When the fluid reaches the lower radiator hose, it is cooled and ready
18
Page 33
to re-enter the water pump where it's pushed back into the engine's water
jackets.
A cold engine has cold coolant. It needs to reach normal operating
temperatures as quickly as possible. The thermostat is a temperature-
controlled valve. When the coolant is too cold, the thermostat closes and the
water pump only circulates coolant in the block. When the coolant reaches
operating temperature, usually between 180 and 195°F (82.2 and 90.6 °C), the
thermostat opens and the coolant makes the full trip through the radiator.
When the truck's heater is on, a second valve opens allowing coolant
through a small radiator mounted either on the firewall or under the dash,
known as the heater core. The heater pulls warm coolant away from the
engine and uses it to heat the cab. The battling serious overheating situation,
turning the heater on high will pull heat out of the engine. It may sound
sadistic to crank up the heater on a day hot enough to make the engine boil
over, but sometimes the cooling system needs all the help it can get. When the
choice is between getting home sweaty or being stranded, we'll gladly turn on
the heater. Combustion produces a heat in the engine. Average combustion-
chamber temperatures are around 1,500°F (815.6°C) with extremes as high as
6000°F (3315.6°C). Since water boils at 212°F (100°C), there's a big gap that
requires a lot of cooling.
Pressure raises the boiling point of coolant, so most radiator caps are
designed to raise the pressure to about 15 psi (1.02 atm.). This adds 40
degrees to the boiling point, which is why it's important to replace defective
radiator caps. A cap with a bad pressure valve makes the engine run
substantially hotter. Elevation lowers the boiling point of coolant. For every
1,000 feet (3600 m) above sea level, the boiling point drops 3 degrees.
Antifreeze alone can reach 330°F (165.5°C) before it boils. Pure
antifreeze doesn’t absorb heat as well as water, so most manufactures
19
Page 34
recommend mixing the two. While the coolant protects against heat,
antifreeze protects against the extremely cold temperatures encountered when
the vehicle is parked. Water freezes at 32°F (0°C), and antifreeze is good
down to 0 degrees. Interestingly, a 1:1 mix offers protection down to about -
34°F (-36.7°C). People in extreme climates can use 60% antifreeze to lower
the freezing point to about -60°F (-51.1°C), but heat absorption suffers. That’s
a satisfactory trade-off in frigid climates, but the most vehicles should stick
with the stand 1:1 mix. [9, 30, 31]
2.6 Future Trends
The antifreeze market will continue to be divided into two main
categories: low priced volatile antifreezes, and relatively high-priced
permanent antifreezes. In the volatile field, methanol-based antifreezes are
expected to increase in popularity due to their superior antifreeze efficiency,
low cost, and lack of odor. This increase will be dependent primarily upon the
rate at which synthetic methanol is made available for antifreeze work. In the
nonvolatile field, Ethylene glycol-based antifreezes will continue to
predominate, because of the antifreeze efficiency of ethylene glycol and it's
relatively low cost as compared to its only close competitor, glycerol, which
has many other important commercial uses. It is expected that permanent-type
antifreezes will make further inroads on the business now held by the volatile
type, although the difference in manufacturing costs insures the continued use
of volatile antifreezes. Automotive manufactures are considering the use of
factory-sealed cooling system, in which case both the types and quantities of
antifreeze materials would be affected. [5]
20
Page 35
2.7 Other Antifreezes
The American Society for Testing Materials (ASTM) [17] is currently
working on developing standards for propylene glycol antifreeze and coolants
because propylene glycol has as high a boiling point and low freezing point.
Cecilia Hagg[57] proved that when water freezes out after the temperature of
the fluid has passed below the freezing point, the concentration of the additive
increases in the liquid-phase. The increased additive concentration implies
that the freezing point of the remaining liquid-phase is further lowered and in
order to freeze out more ice the temperature of the fluid has to be further
lowered below the current freezing point of the liquid. The result is that the
fluid has no definitive freezing point but rather a freezing range. She used in
her work different antifreezes mixed with water like potassium formate,
potassium acetate calcium chloride, potassium carbonate, ammonia, glycerol,
methyl alcohol, ethyl alcohol, and propylene glycol.
Duus[14] used methanol in automobile cooling system because the
boiling point of methanol 65°C is lower than that of other antifreeze material
such as alcohol 77.8°C, isopropanol 82.2°C, or glycerol 291°C. Nevertheless,
because of its low molecular weight, approximately 20 to 25% less volume of
methanol is required to affect a given lowering of the freezing point than of
glycol or denatured alcohol; this is an economic advantage.
21
Page 36
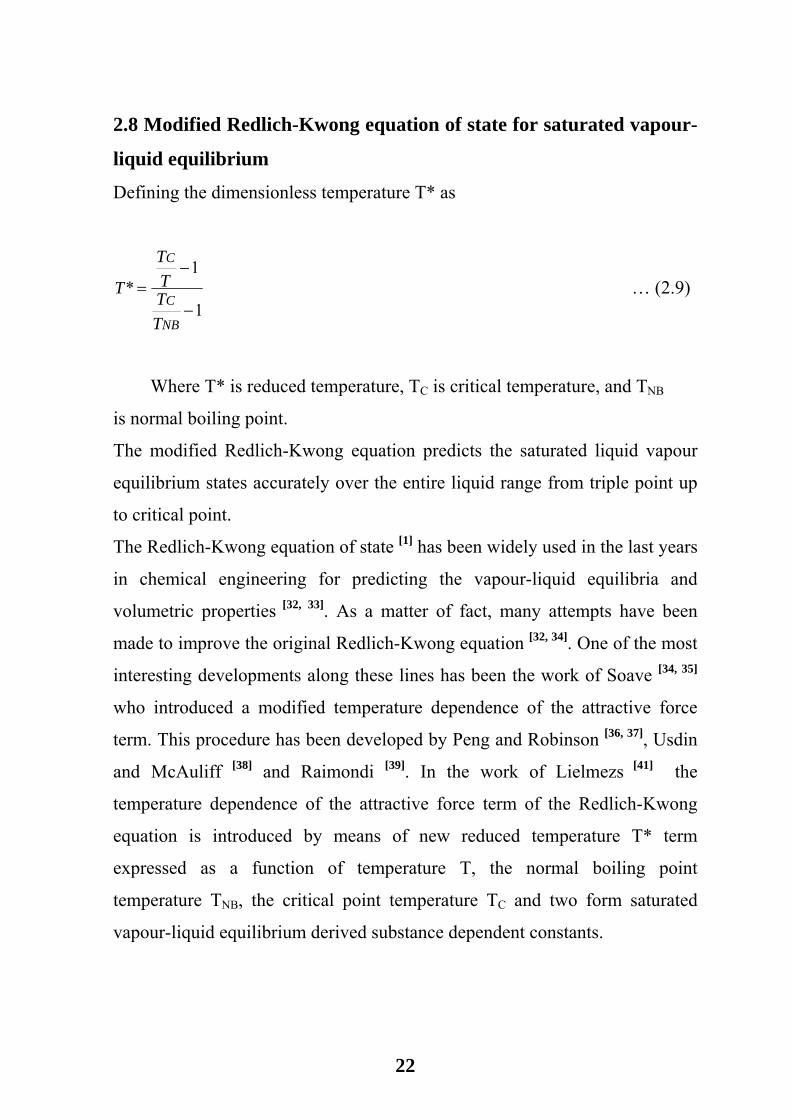
2.8 Modified Redlich-Kwong equation of state for saturated vapour-
liquid equilibrium
Defining the dimensionless temperature T* as
1
1*
−
−=
NB
C
C
TTTT
T … (2.9)
Where T* is reduced temperature, TC is critical temperature, and TNB
is normal boiling point.
The modified Redlich-Kwong equation predicts the saturated liquid vapour
equilibrium states accurately over the entire liquid range from triple point up
to critical point.
The Redlich-Kwong equation of state [1] has been widely used in the last years
in chemical engineering for predicting the vapour-liquid equilibria and
volumetric properties [32, 33]. As a matter of fact, many attempts have been
made to improve the original Redlich-Kwong equation [32, 34]. One of the most
interesting developments along these lines has been the work of Soave [34, 35]
who introduced a modified temperature dependence of the attractive force
term. This procedure has been developed by Peng and Robinson [36, 37], Usdin
and McAuliff [38] and Raimondi [39]. In the work of Lielmezs [41] the
temperature dependence of the attractive force term of the Redlich-Kwong
equation is introduced by means of new reduced temperature T* term
expressed as a function of temperature T, the normal boiling point
temperature TNB, the critical point temperature TC and two form saturated
vapour-liquid equilibrium derived substance dependent constants.
22
Page 37
This modification predicts the saturated liquid vapour equilibrium
states for all types off liquids accurately over the entire liquid range from the
triple point up to the critical point. [41]
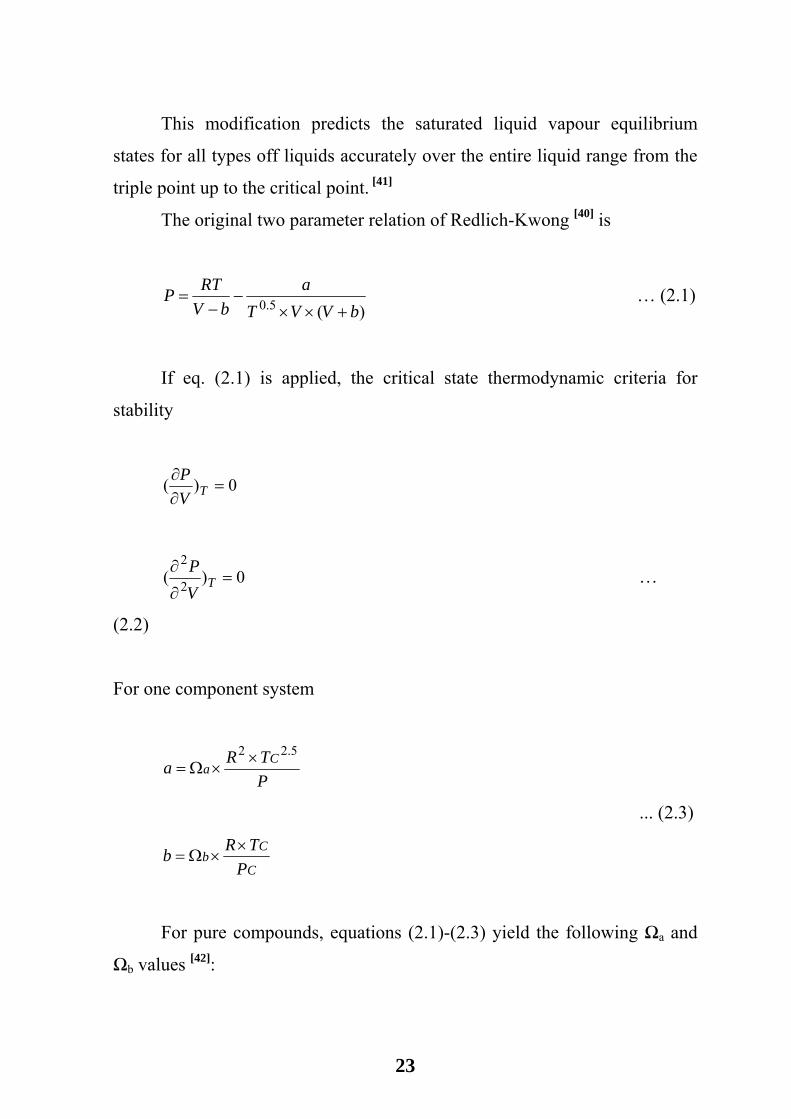
The original two parameter relation of Redlich-Kwong [40] is
)(0.5 bVVTa
bVRTP
+××−
−= … (2.1)
If eq. (2.1) is applied, the critical state thermodynamic criteria for
stability
0)( =∂∂
TVP
0)( 2
2=
∂
∂T
VP …
(2.2)
For one component system
PTRa C
a5.22 ×
×Ω=
... (2.3)
C
Cb
PTRb ×
×Ω=
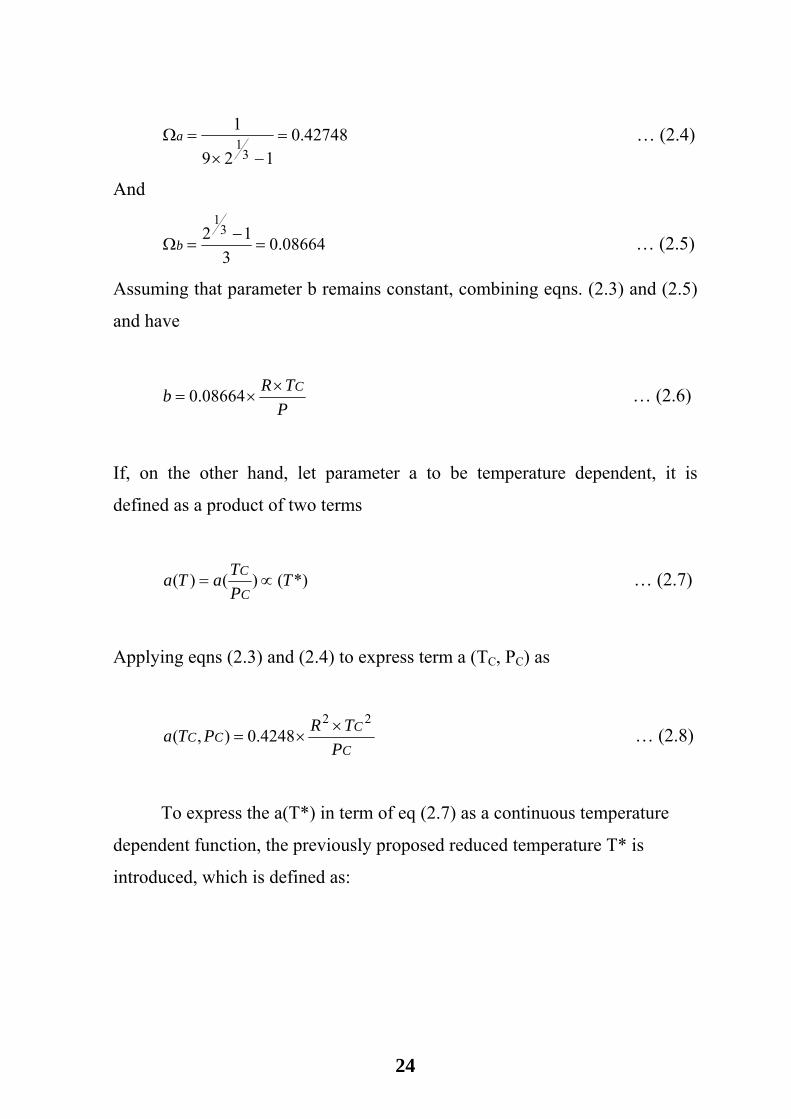
For pure compounds, equations (2.1)-(2.3) yield the following Ωa and
Ωb values [42]:
23
Page 38
42748.0129
1
31 =
−×=Ωa … (2.4)
And
08664.03
12 31
=−
=Ωb … (2.5)
Assuming that parameter b remains constant, combining eqns. (2.3) and (2.5)
and have
PTRb C×
×= 08664.0 … (2.6)
If, on the other hand, let parameter a to be temperature dependent, it is
defined as a product of two terms
*)()()( TPTaTa
C
C∝= … (2.7)
Applying eqns (2.3) and (2.4) to express term a (TC, PC) as
C
CCC
PTRPTa
224248.0),( ×
×= … (2.8)
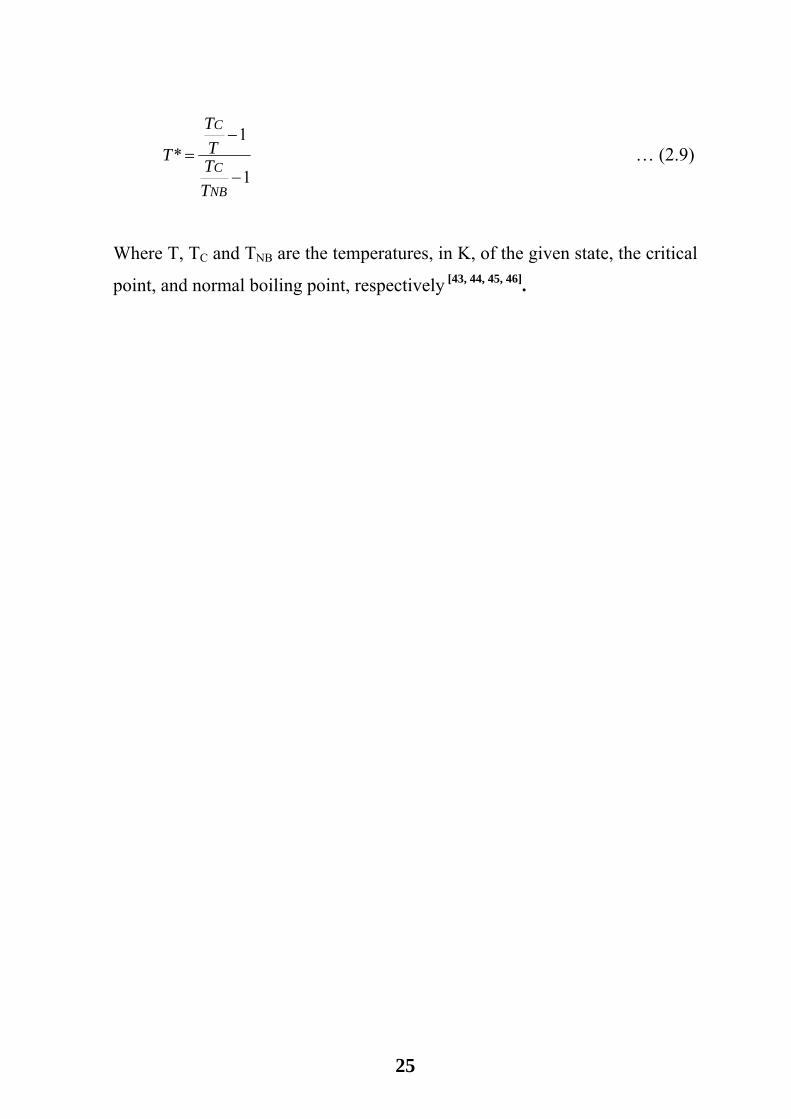
To express the a(T*) in term of eq (2.7) as a continuous temperature
dependent function, the previously proposed reduced temperature T* is
introduced, which is defined as:
24
Page 39
1
1*
−
−=
NB
C
C
TTTT
T … (2.9)
Where T, TC and TNB are the temperatures, in K, of the given state, the critical
point, and normal boiling point, respectively [43, 44, 45, 46].
25
Page 40
Chapter Three
Experimental Work
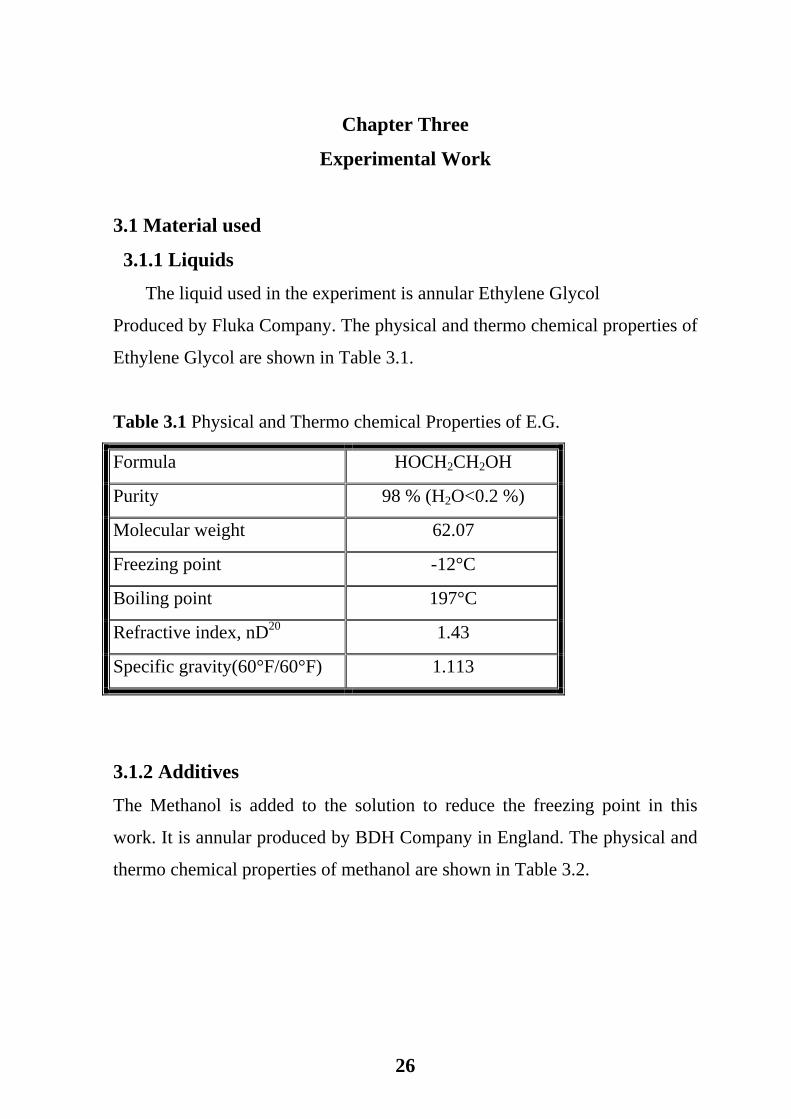
3.1 Material used
3.1.1 Liquids
The liquid used in the experiment is annular Ethylene Glycol
Produced by Fluka Company. The physical and thermo chemical properties of
Ethylene Glycol are shown in Table 3.1.
Table 3.1 Physical and Thermo chemical Properties of E.G.
Formula HOCH2CH2OH
Purity 98 % (H2O<0.2 %)
Molecular weight 62.07
Freezing point -12°C
Boiling point 197°C
Refractive index, nD20 1.43
Specific gravity(60°F/60°F) 1.113
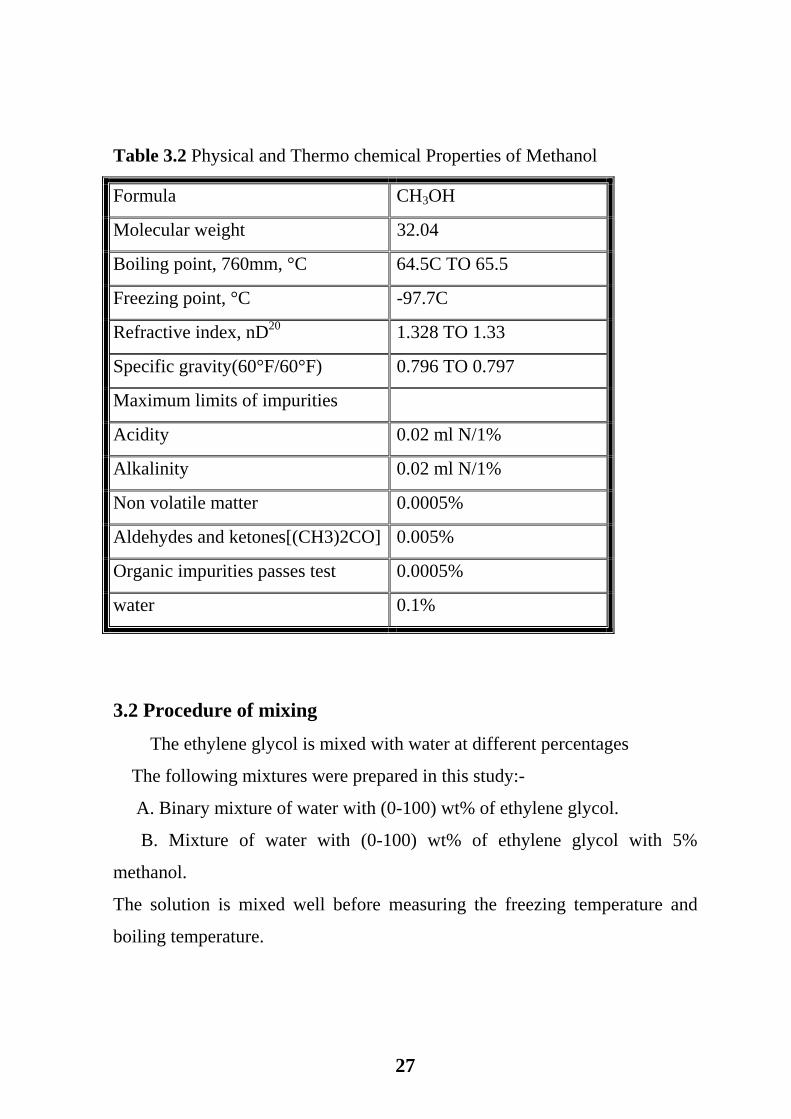
3.1.2 Additives
The Methanol is added to the solution to reduce the freezing point in this
work. It is annular produced by BDH Company in England. The physical and
thermo chemical properties of methanol are shown in Table 3.2.
26
Page 41
Table 3.2 Physical and Thermo chemical Properties of Methanol
Formula CH3OH
Molecular weight 32.04
Boiling point, 760mm, °C 64.5C TO 65.5
Freezing point, °C -97.7C
Refractive index, nD20 1.328 TO 1.33
Specific gravity(60°F/60°F) 0.796 TO 0.797
Maximum limits of impurities
Acidity 0.02 ml N/1%
Alkalinity 0.02 ml N/1%
Non volatile matter 0.0005%
Aldehydes and ketones[(CH3)2CO] 0.005%
Organic impurities passes test 0.0005%
water 0.1%
3.2 Procedure of mixing
The ethylene glycol is mixed with water at different percentages
The following mixtures were prepared in this study:-
A. Binary mixture of water with (0-100) wt% of ethylene glycol.
B. Mixture of water with (0-100) wt% of ethylene glycol with 5%
methanol.
The solution is mixed well before measuring the freezing temperature and
boiling temperature.
27
Page 42
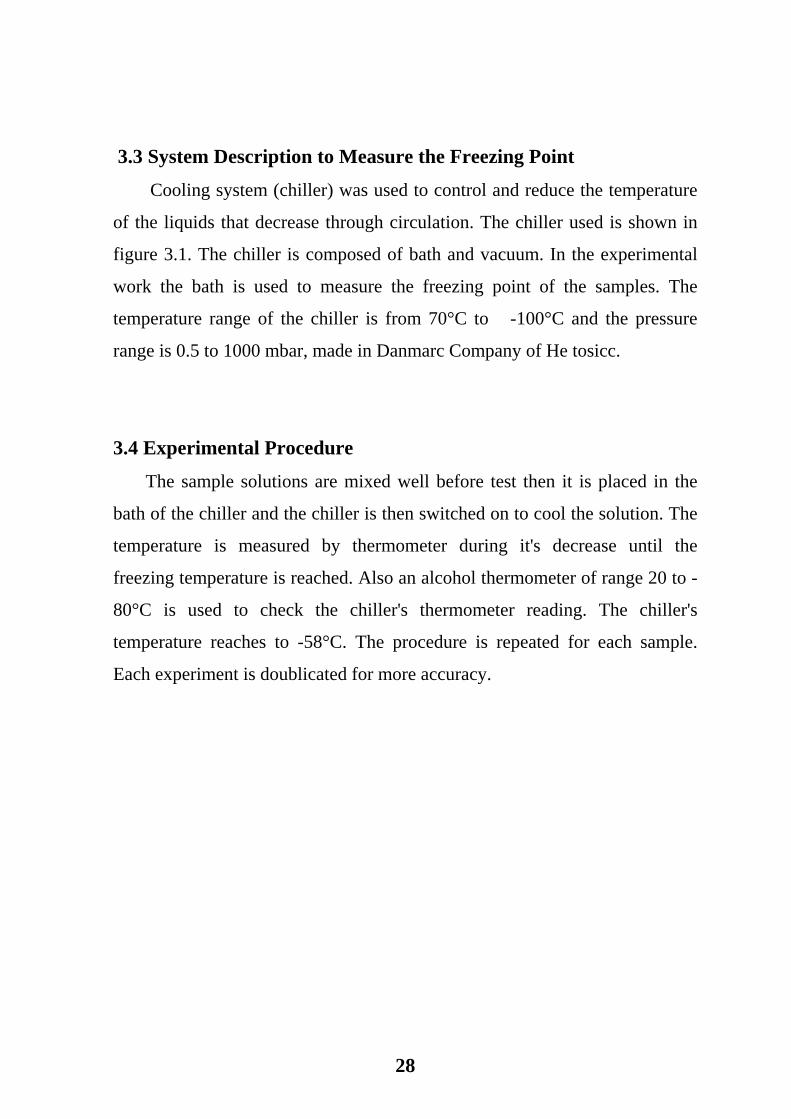
3.3 System Description to Measure the Freezing Point
Cooling system (chiller) was used to control and reduce the temperature
of the liquids that decrease through circulation. The chiller used is shown in
figure 3.1. The chiller is composed of bath and vacuum. In the experimental
work the bath is used to measure the freezing point of the samples. The
temperature range of the chiller is from 70°C to -100°C and the pressure
range is 0.5 to 1000 mbar, made in Danmarc Company of He tosicc.
3.4 Experimental Procedure
The sample solutions are mixed well before test then it is placed in the
bath of the chiller and the chiller is then switched on to cool the solution. The
temperature is measured by thermometer during it's decrease until the
freezing temperature is reached. Also an alcohol thermometer of range 20 to -
80°C is used to check the chiller's thermometer reading. The chiller's
temperature reaches to -58°C. The procedure is repeated for each sample.
Each experiment is doublicated for more accuracy.
28
Page 43
Fig. 3.1: The chiller
29
Page 44
3.5 System Description to Measure the Boiling Point
The flow system apparatus used for measuring the boiling temperature
is composed of thermometer, capillary tube, stirrer, beaker, elastic band, test
tube, oil bath, pipette, burner, and clamp.
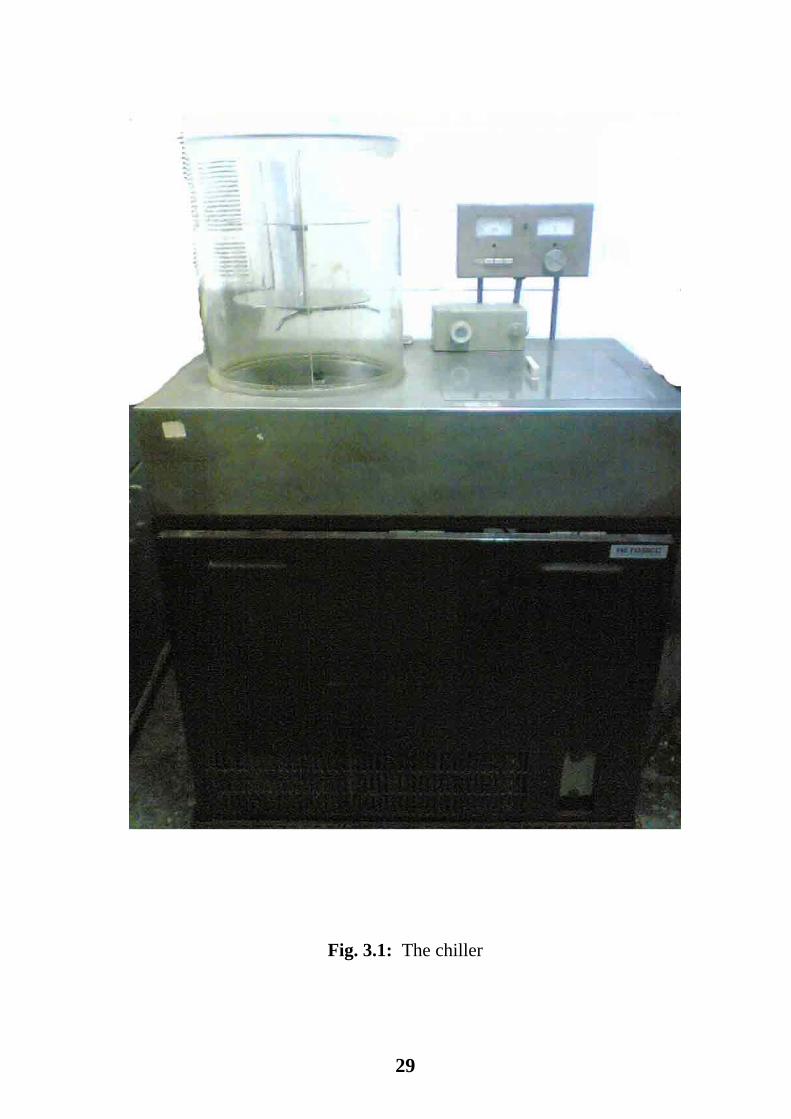
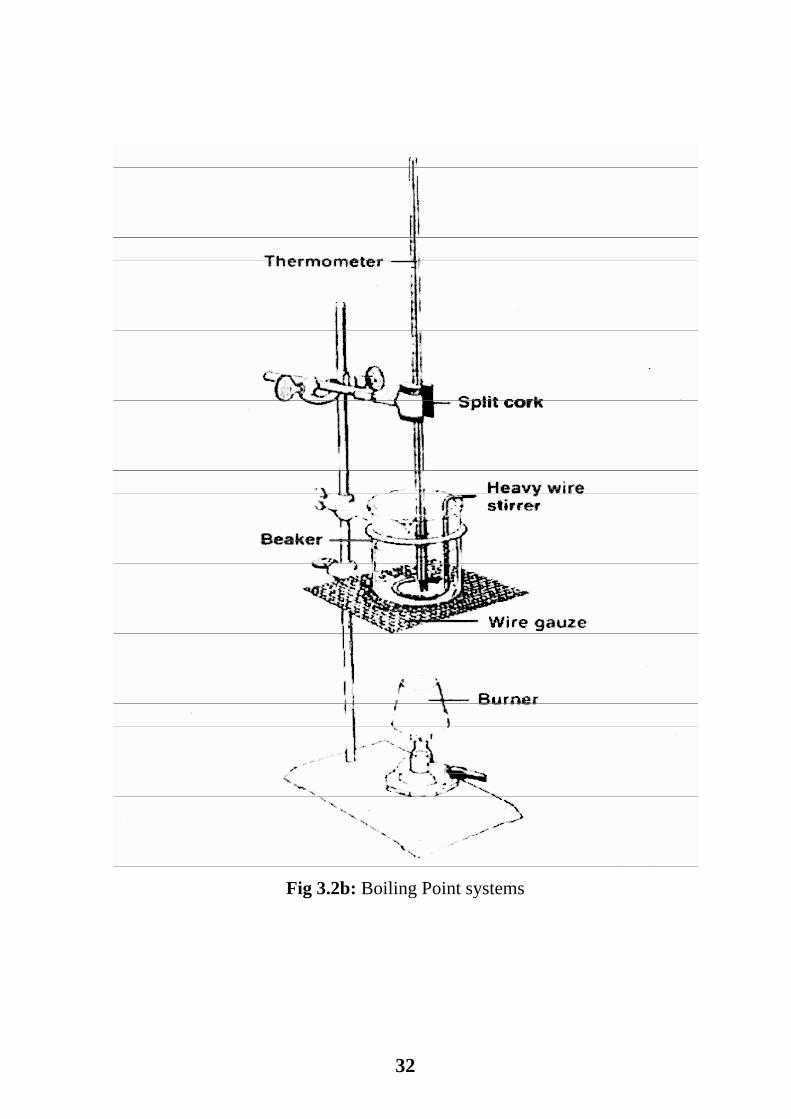
3.6 Experimental Procedure
The boiling point of smaller quantities of liquid may be determined by
using the following technique. Seal the end of 5 cm length and 4mm inside
diameter thin-walled glass tubing to make a small test-tube (outer jacket) and
attach to a thermometer with tape or an elastic band such that the sealed end
of the tube is in level with the bulb of the thermometer. The capillary tube is
cut about 2 cm from the sealed end. Mercury thermometer and attached tube
is immersed in oil bath. Finally, by a pipette, an Ethylene Glycol – Water
solution is introduced to measure the boiling point to a depth of a bout 1 cm.
Figure 3.2a.and 3.2b.
Oil bath is heated with stirring and the tip of the inner tube is
observed carefully. Initially, a slow erratic stream of air bubbles will be seen
to leave the tube as the air inside warms up and expands, but this will
eventually be replaced by a steady rapid stream of bubbles as the solution
reaches its boiling point. At this point the heating is stopped and the sample
stays in the oil bath the temperature of which will continue to rise for a short
time, while depending on the rate of heating and the actual temperature of the
bath. As the temperature begins to fall, the temperature is recorded at which
the stream of bubbles stops and the sample just begins to rise up within the
inner capillary tube, this is the boiling point of the sample. The procedure is
then repeated by using new capillary tube and another sample to measure its
30
Page 45
boiling point. This experiment is done at atmospheric pressure. Each test is
carried out twice.
Fig 3.2a: Boiling Point measurements
31
Page 46
Fig 3.2b: Boiling Point systems
32
Page 47
Chapter four
Results and discussion
The experimental results are presented in tables A.1 and A.2
In appendix A
4.1 Freezing point
4.1.1 Effect of Ethylene Glycol Concentration on the Freezing
Point
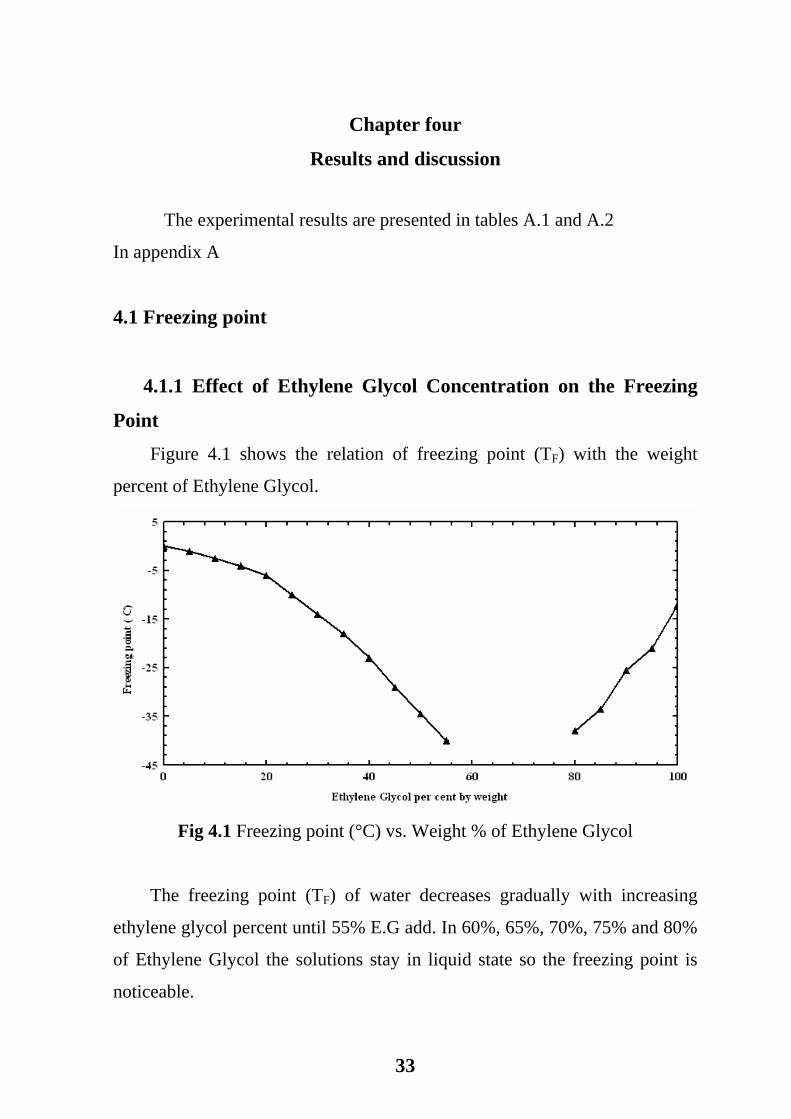
Figure 4.1 shows the relation of freezing point (TF) with the weight
percent of Ethylene Glycol.
Fig 4.1 Freezing point (°C) vs. Weight % of Ethylene Glycol
The freezing point (TF) of water decreases gradually with increasing
ethylene glycol percent until 55% E.G add. In 60%, 65%, 70%, 75% and 80%
of Ethylene Glycol the solutions stay in liquid state so the freezing point is
noticeable.
33
Page 48
Above 80% of Ethylene Glycol the increase in Ethylene Glycol results
in an increase in the freezing point (TF).
Johnston Services, Inc. [56] proved that the freezing point of propylene glycol
decreases with increasing it's weight percent, But over than of ethylene
glycol.
Cecilia Hägg[57] proved that the freezing point of different components like
Potassium formate, potassium acetate, calcium chloride, potassium carbonate,
ammonia, glycerol, methyl alcohol, ethyl alcohol, and propylene glycol
increased with increasing their weight percent with water.
4.1.2 Addition of Methanol
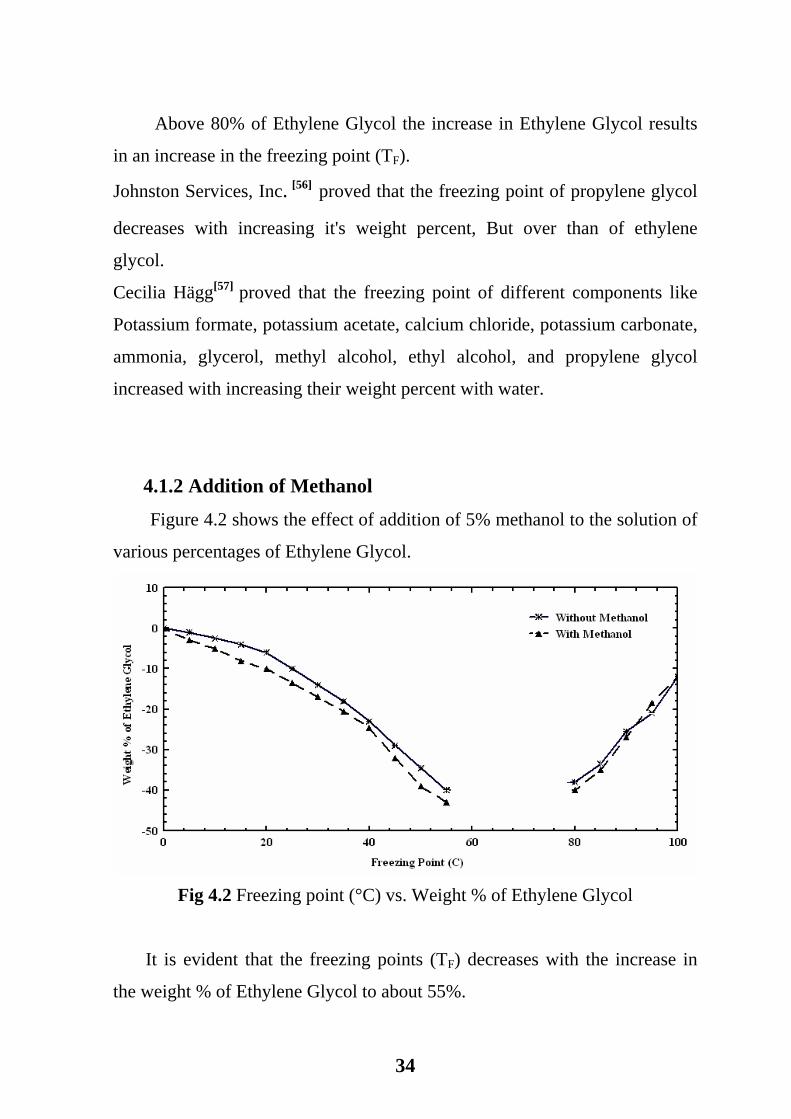
Figure 4.2 shows the effect of addition of 5% methanol to the solution of
various percentages of Ethylene Glycol.
Fig 4.2 Freezing point (°C) vs. Weight % of Ethylene Glycol
It is evident that the freezing points (TF) decreases with the increase in
the weight % of Ethylene Glycol to about 55%.
34
Page 49
In Figure 4.2, the Ethylene Glycol and water form eutectic mixture in the
range 55% to 80% Ethylene Glycol by weight, although the exact eutectic
composition and the temperature have not been accurately defined because
the solution remain liquid at temperature below their freezing points.
The range from 80% to 100% of Ethylene Glycol the freezing point
increases when the percent of Ethylene Glycol increased.
Also the figure reveals that the presence of methanol leads to decrease in
the freezing point below that when no methanol is added for the whole range
of Ethylene Glycol composition.
4.2 Boiling Point
The experimental work includes the investigation of the effect of addition of
ethylene glycol and the methanol on the boiling point.
4.3 Effect of Ethylene Glycol Concentration on Boiling Point (TB)
Figure 4.3 shows the effect of the ethylene glycol percent on the boiling
point of the solution.
35
Page 50
Ethylene Glycol per cent by weight
Boi
ling
Poin
t (C
)
90
110
130
150
170
190
210
0 20 40 60 80 100
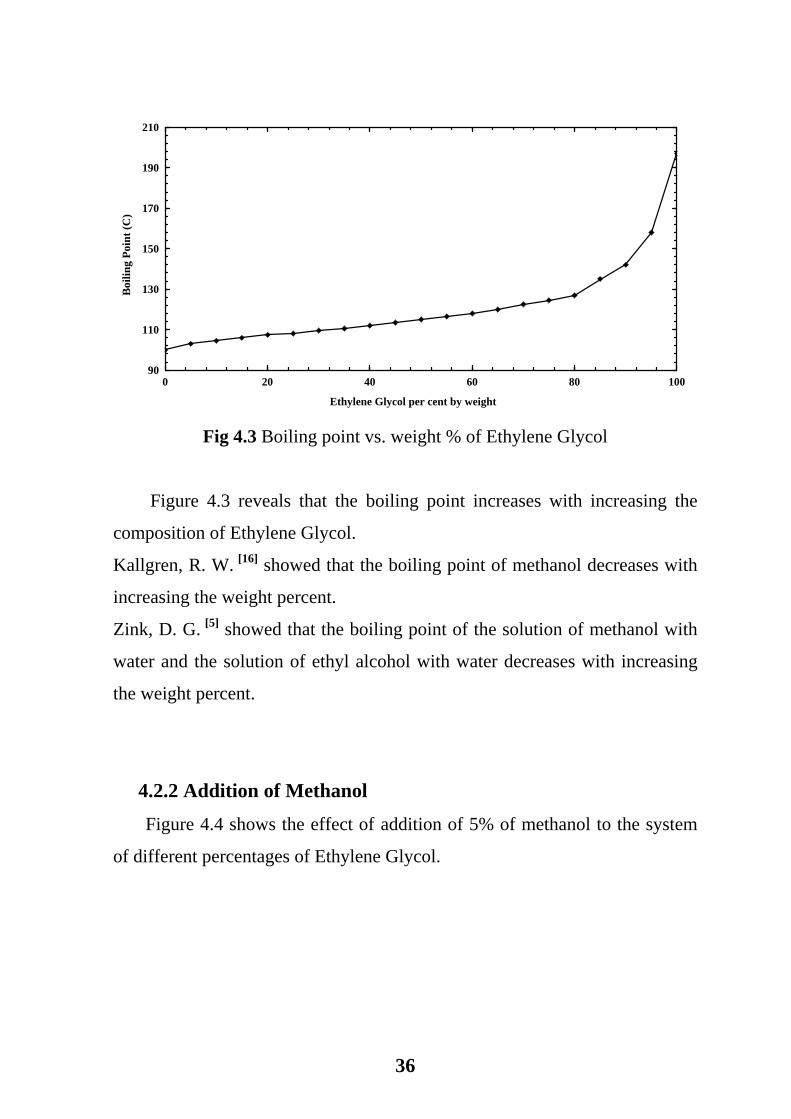
Fig 4.3 Boiling point vs. weight % of Ethylene Glycol
Figure 4.3 reveals that the boiling point increases with increasing the
composition of Ethylene Glycol.
Kallgren, R. W. [16] showed that the boiling point of methanol decreases with
increasing the weight percent.
Zink, D. G. [5] showed that the boiling point of the solution of methanol with
water and the solution of ethyl alcohol with water decreases with increasing
the weight percent.
4.2.2 Addition of Methanol
Figure 4.4 shows the effect of addition of 5% of methanol to the system
of different percentages of Ethylene Glycol.
36
Page 51
Ethylene Glycol per cent by weight
Boi
ling
Poin
t (C
)
90
110
130
150
170
190
210
0 20 40 60 80 100
Without MethanolWith Methanol
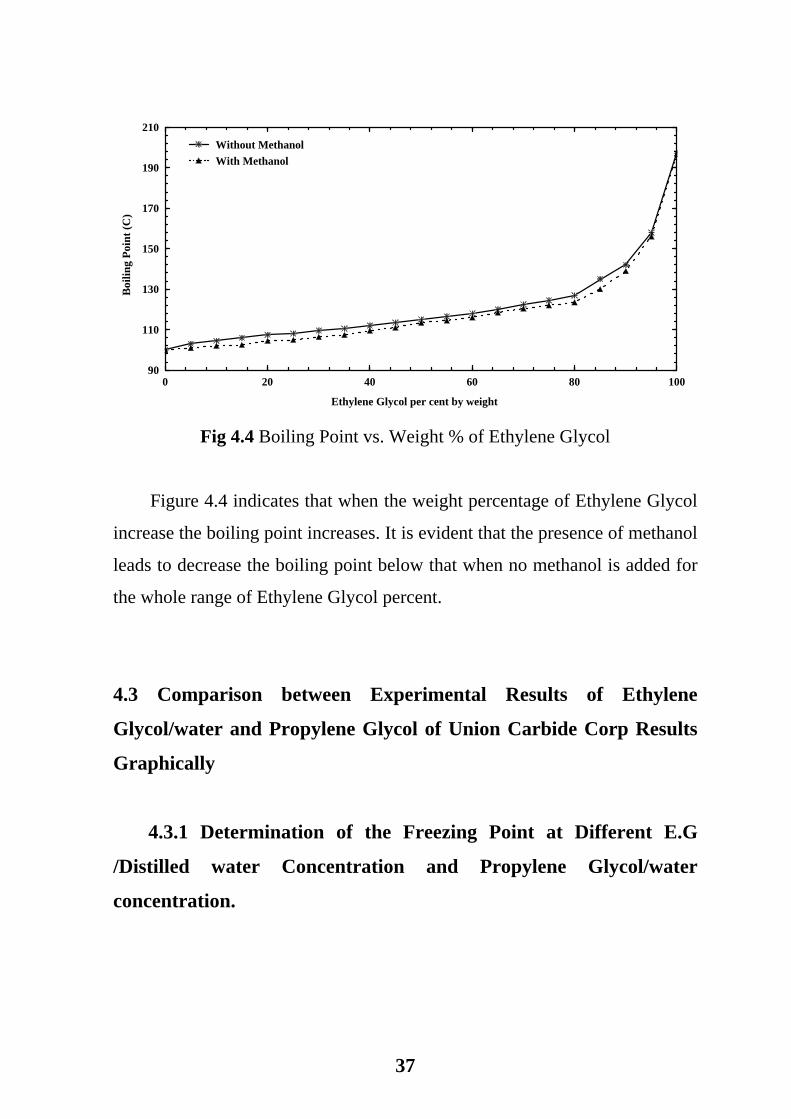
Fig 4.4 Boiling Point vs. Weight % of Ethylene Glycol
Figure 4.4 indicates that when the weight percentage of Ethylene Glycol
increase the boiling point increases. It is evident that the presence of methanol
leads to decrease the boiling point below that when no methanol is added for
the whole range of Ethylene Glycol percent.
4.3 Comparison between Experimental Results of Ethylene
Glycol/water and Propylene Glycol of Union Carbide Corp Results
Graphically
4.3.1 Determination of the Freezing Point at Different E.G
/Distilled water Concentration and Propylene Glycol/water
concentration.
37
Page 52
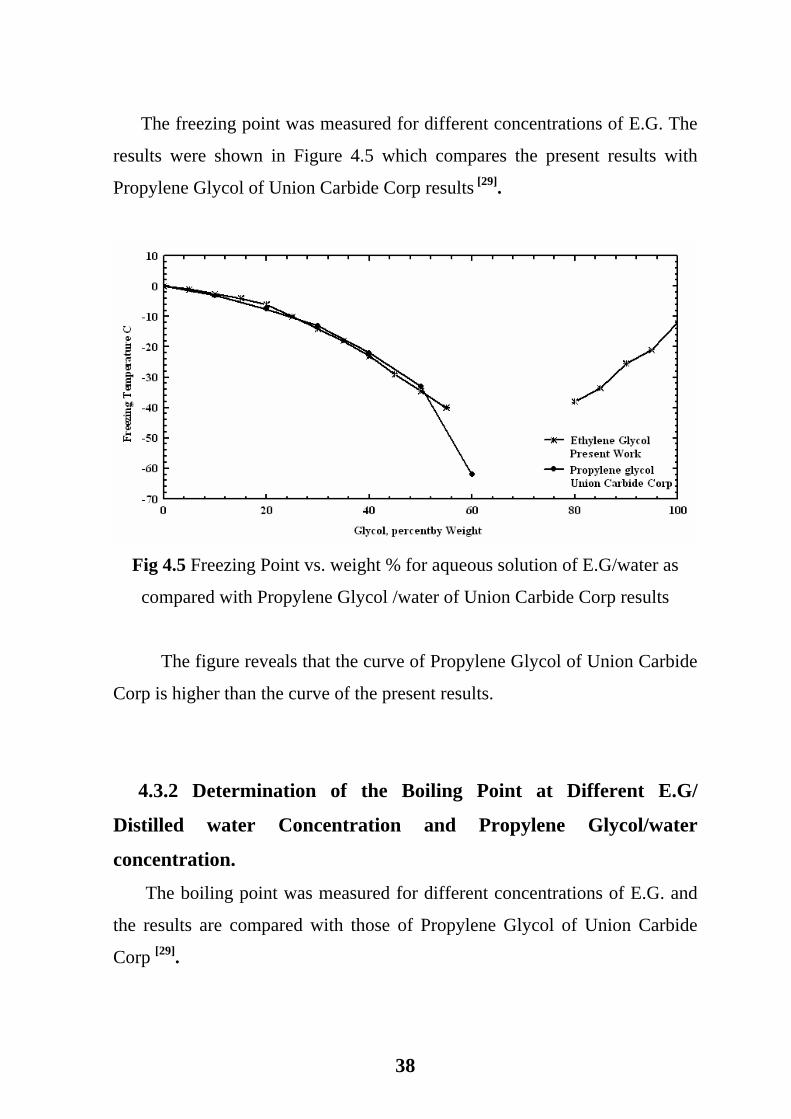
The freezing point was measured for different concentrations of E.G. The
results were shown in Figure 4.5 which compares the present results with
Propylene Glycol of Union Carbide Corp results [29].
Fig 4.5 Freezing Point vs. weight % for aqueous solution of E.G/water as
compared with Propylene Glycol /water of Union Carbide Corp results
The figure reveals that the curve of Propylene Glycol of Union Carbide
Corp is higher than the curve of the present results.
4.3.2 Determination of the Boiling Point at Different E.G/
Distilled water Concentration and Propylene Glycol/water
concentration.
The boiling point was measured for different concentrations of E.G. and
the results are compared with those of Propylene Glycol of Union Carbide
Corp [29].
38
Page 53
Glycol, percent by Weight
Boi
ling
Tem
pera
ture
90
110
130
150
170
190
210
0 20 40 60 80 100
Ethylene GlycolPresent WorkPropylene GlycolUnion Carbide Corp
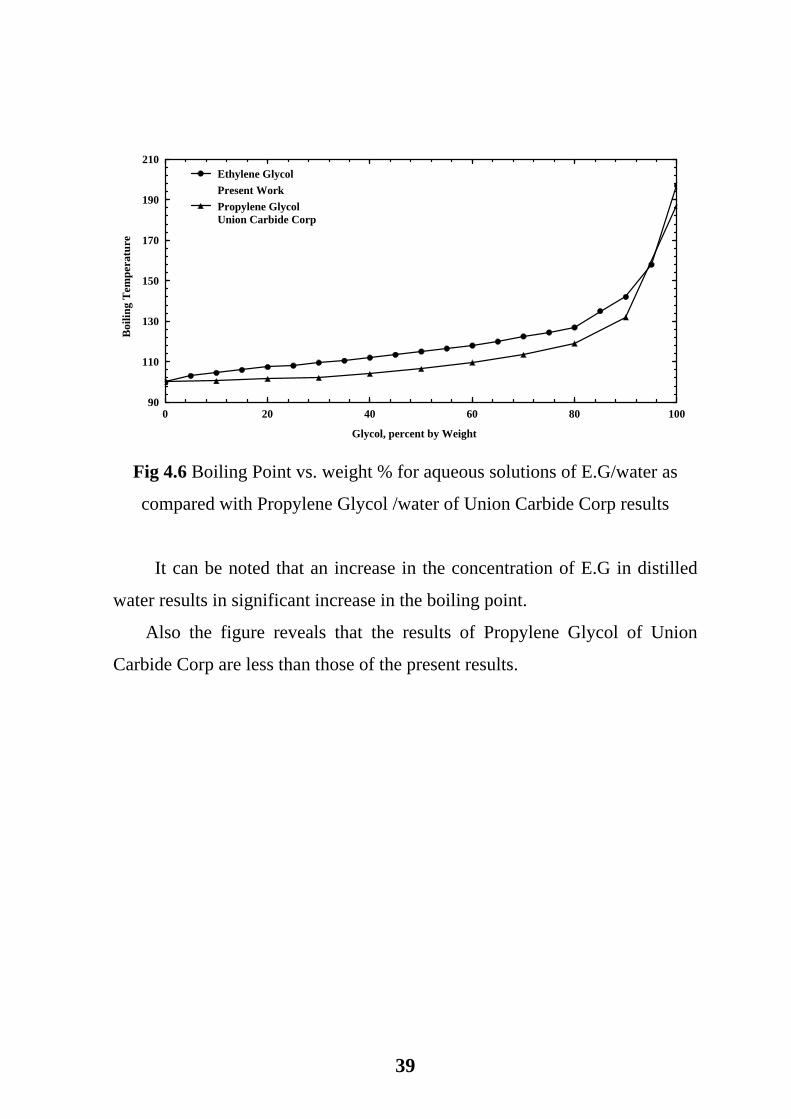
Fig 4.6 Boiling Point vs. weight % for aqueous solutions of E.G/water as
compared with Propylene Glycol /water of Union Carbide Corp results
It can be noted that an increase in the concentration of E.G in distilled
water results in significant increase in the boiling point.
Also the figure reveals that the results of Propylene Glycol of Union
Carbide Corp are less than those of the present results.
39
Page 54
4.4 The use of Leilmezs model to predict the reduced temperature
(T*)
Lielmiezs's proposed the following equation to predict T* [41]
1
1*
−
−=
B
C
C
TTTT
T … (4.1)
Where
T* = reduced temperature, Tc = critical point of liquid,TB = boiling point of
liquid, and T = the temperature of liquid
The Leilmezs equation is modified in the present work to estimate the T*
from freezing point and boiling point as follows
1
1*
−
−=
BTTTT
TF
F
… (4.2)
Where: TF = freezing point of liquid
BF
BF
TTT
TTTT
−×
−=* … (4.3)
)(*
BF
BBF
TTTTTTTT
−××−×
= … (4.4)
BF
B
BF
BF
TTT
TTTTTT
−−×
−×
=1* … (4.5)
The line equation is:
bxmY +×= … (4.6)
If equation (4.5) equals equation (4.6) then
YT =*
T
X 1=
BF
BF
TTTTm
−×
=
40
Page 55
BF
B
TTTb−
−=
Now the equation (4.5) become
bT
mT +×=1* … (4.7)
Substitutition of the freezing point and the boiling point that were
measured experimentally, gives the slop m, the intercept b and to obtain the
reduced temperature T* from equation (4.7) the results are shown in appendix
(B)
For Ethylene glycol /water system
Table 4.1 Ethylene glycol /water system
The substances TF (K) TB (K)
Water 273.15 373.15
E.G 261.15 470.15
50% mixture 238.65 388.15
For water the equation (4.7) becomes
7315.312592.1019* +×−=T
T … (4.8)
For E.G the equation (4.7) becomes
2495.214625.587* +×−=T
T … (4.9)
For 50% of E.G mixture the equation (4.7) becomes
5963.116120.619* +×−=T
T … (4.10)
41
Page 56
The initial value of temperature T is 143.15 K (-130°C) to 563.15 K
(290°C). Substitutition these temperatures in equations (4.8), (4.9) and (4.10)
gives the reduced temperature T*
The results are presented in appendix B in table B1.
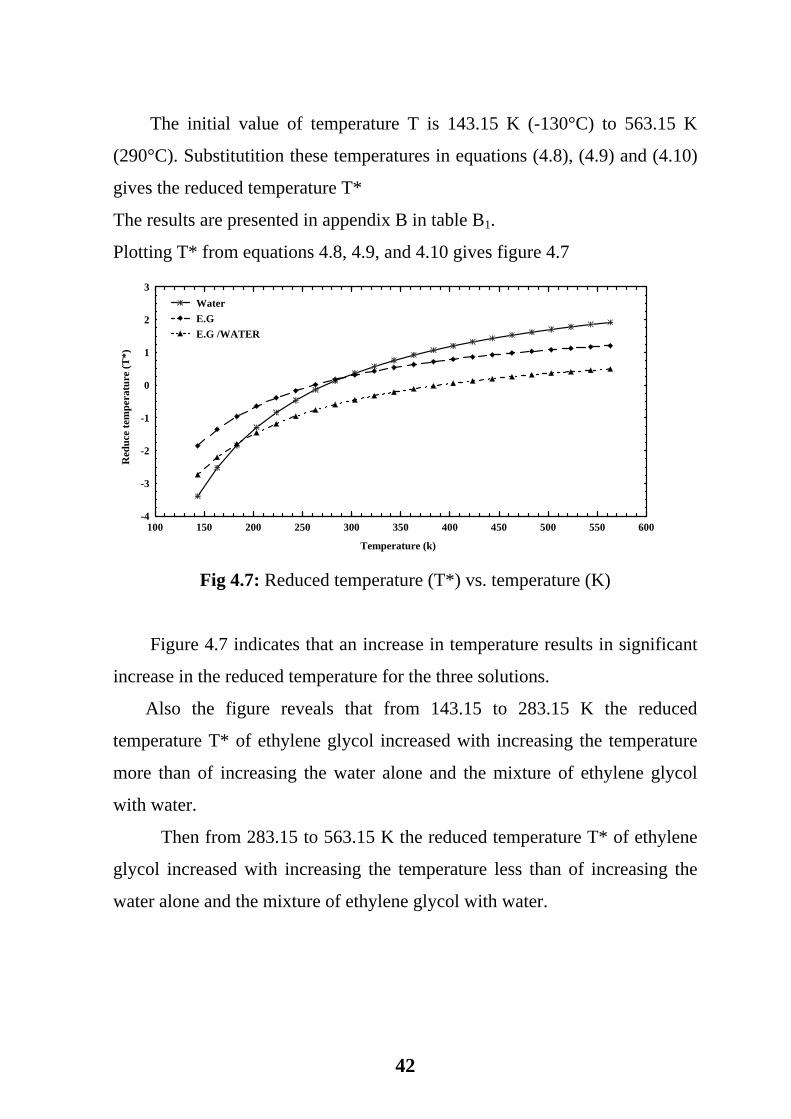
Plotting T* from equations 4.8, 4.9, and 4.10 gives figure 4.7
Temperature (k)
Red
uce
tem
pera
ture
(T*)
-4
-3
-2
-1
0
1
2
3
100 150 200 250 300 350 400 450 500 550 600
WaterE.GE.G /WATER
Fig 4.7: Reduced temperature (T*) vs. temperature (K)
Figure 4.7 indicates that an increase in temperature results in significant
increase in the reduced temperature for the three solutions.
Also the figure reveals that from 143.15 to 283.15 K the reduced
temperature T* of ethylene glycol increased with increasing the temperature
more than of increasing the water alone and the mixture of ethylene glycol
with water.
Then from 283.15 to 563.15 K the reduced temperature T* of ethylene
glycol increased with increasing the temperature less than of increasing the
water alone and the mixture of ethylene glycol with water.
42
Page 57
For E.G /water/methanol system
Table 4.2 ethylene glycol /water/ methanol system
The substances TF (K) TB (K)
Water 273.15 373.15
E.G 261.15 470.15
5%methanol/50%E.G/45%water 234.15 386.15
For water the equation (4.7) becomes
7315.312592.1019* +×−=T
T … (4.8)
For E.G the equation (4.7) becomes
2495.214625.587* +×−=T
T … (4.9)
For 5%methanol/50% of E.G/ 45%water mixture the equation (4.7) becomes
5405.218488.594* +×−=T
T … (4.11)
The initial value of temperature (T) is 143.15 K (-130°C) to 563.15 K
(290°C). Substitutition of these temperatures in these equations (4.8), (4.9)
and (4.11) gives the reduced temperature (T*)
The results are listed in table B2 in appendix B.
Figure (4.8) shows the variation of T* with solution temperature for the three
solution
43
Page 58
Temperature (K)
Red
uce
tem
pera
ture
(T*)
-4
-3
-2
-1
0
1
2
3
100 200 300 400 500 600
WaterE.GE.G/water/methanol
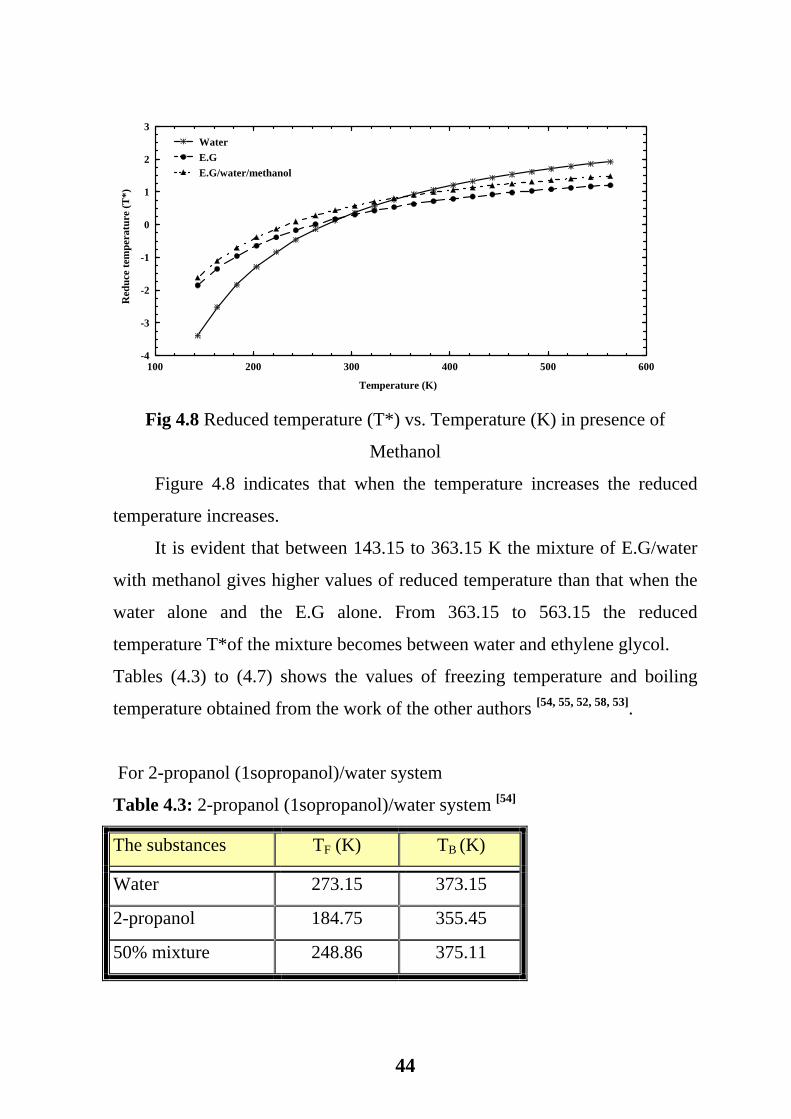
Fig 4.8 Reduced temperature (T*) vs. Temperature (K) in presence of
Methanol
Figure 4.8 indicates that when the temperature increases the reduced
temperature increases.
It is evident that between 143.15 to 363.15 K the mixture of E.G/water
with methanol gives higher values of reduced temperature than that when the
water alone and the E.G alone. From 363.15 to 563.15 the reduced
temperature T*of the mixture becomes between water and ethylene glycol.
Tables (4.3) to (4.7) shows the values of freezing temperature and boiling
temperature obtained from the work of the other authors [54, 55, 52, 58, 53].
For 2-propanol (1sopropanol)/water system
Table 4.3: 2-propanol (1sopropanol)/water system [54]
The substances TF (K) TB (K)
Water 273.15 373.15
2-propanol 184.75 355.45
50% mixture 248.86 375.11
44
Page 59
For water the equation (4.7) becomes
7315.312592.1019* +×−=T
T … (4.8)
For 2-propanol the equation (4.7) becomes
0823.217064.384* +×−=T
T … (4.12)
For 50% of 2-propanol mixture the equation (4.7) becomes
9712.214049.739* +×−=T
T … (4.13)
The initial value of temperature (T) is 143.15 K (-130°C) to 563.15 K
(290°C). Substitutition of these temperatures in these equations (4.8), (4.12)
and (4.13) gives the reduced temperature (T*)
The results are presented in appendix B in table B3.
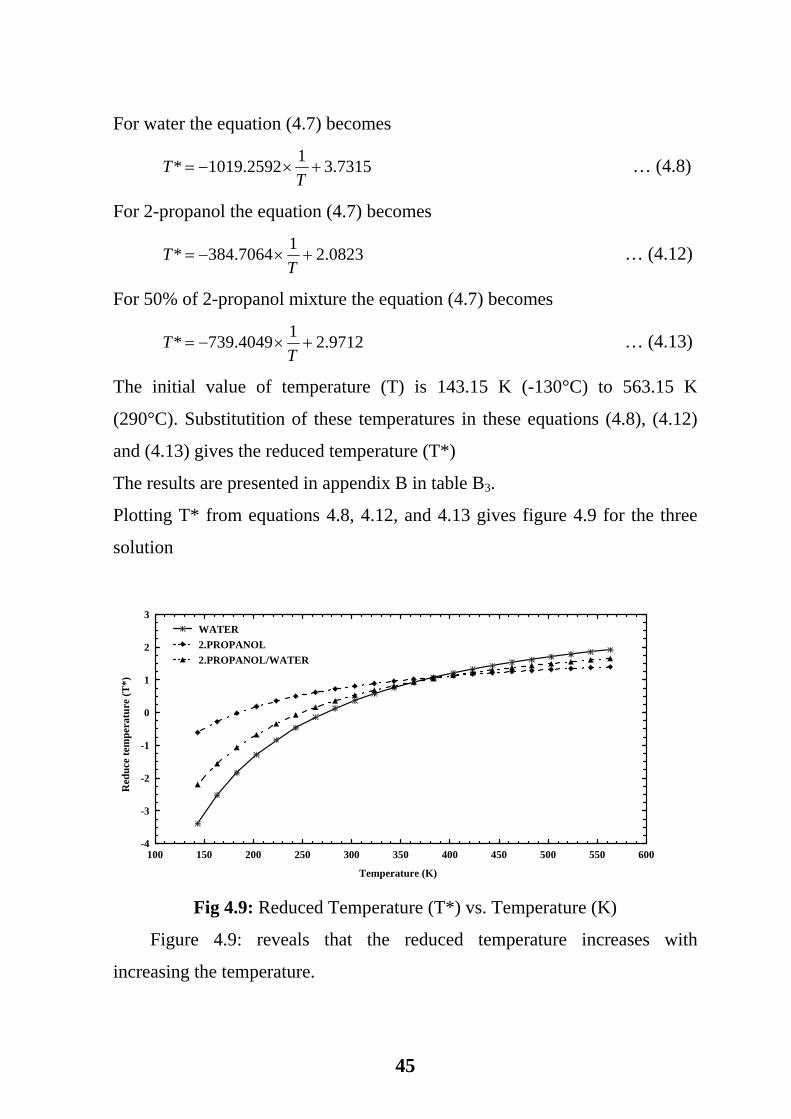
Plotting T* from equations 4.8, 4.12, and 4.13 gives figure 4.9 for the three
solution
Temperature (K)
Red
uce
tem
pera
ture
(T*)
-4
-3
-2
-1
0
1
2
3
100 150 200 250 300 350 400 450 500 550 600
WATER2.PROPANOL2.PROPANOL/WATER
Fig 4.9: Reduced Temperature (T*) vs. Temperature (K)
Figure 4.9: reveals that the reduced temperature increases with
increasing the temperature.
45
Page 60
Also the figure reveals that in low temperatures the reduced temperature
T* of 2-propanol is higher than of water and the mixture. In high temperatures
the reduced temperature T* of 2-propanol is lower than of water and the
mixture.
For Diethylene glycol/water system
Table 4.4 Diethylene glycol /water system [55]
The substances TF (K) TB (K)
Water 273.15 373.15
Diethylene glycol 264.85 517.98
50% mixture 253.55 374.73
For water the equation (4.7) becomes
7315.312592.1019* +×−=T
T … (4.8)
For Diethylene glycol the equation (4.7) becomes
0464.219955.541* +×−=T
T … (4.14)
For 50% of Diethylene glycol mixture the equation (4.7) becomes
0923.310633.784* +×−=T
T … (4.15)
The initial value of temperature (T) that is 143.15 K (-130°C) to 563.15
K (290°C). Substitutition of these temperatures in these equations (4.8),
(4.14) and (4.15) gives the reduced temperature (T*)
The results are listed in table B4 in appendix B.
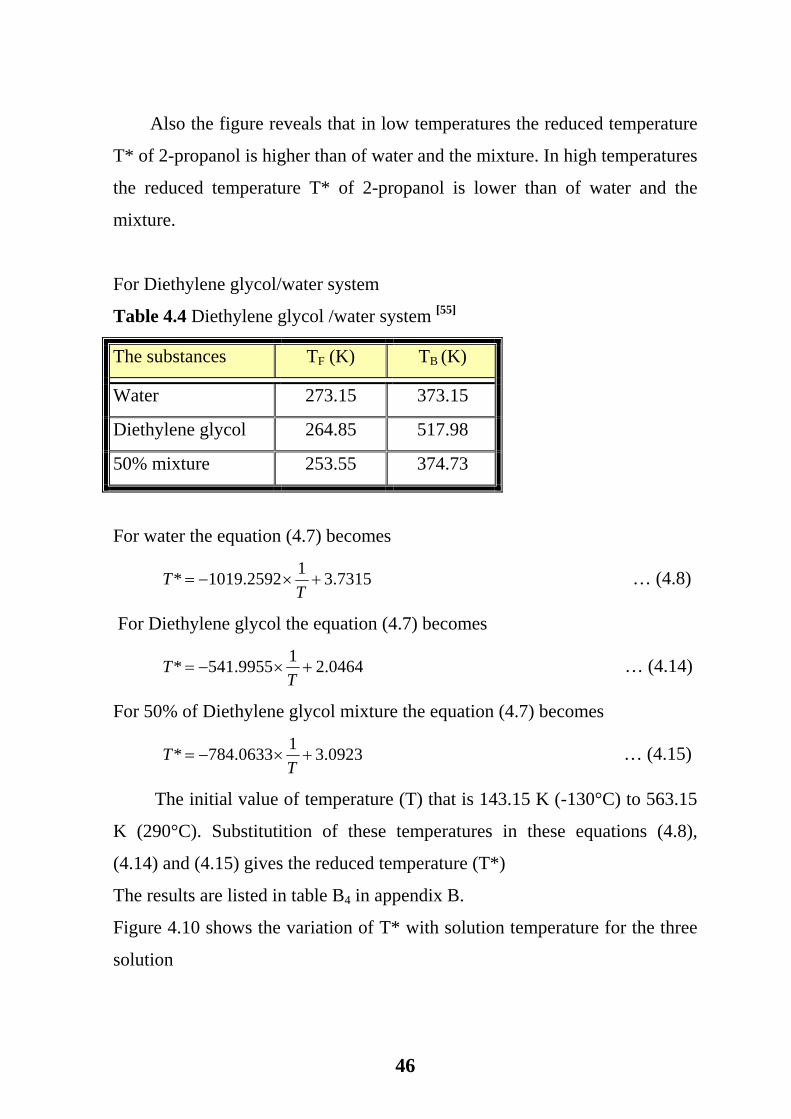
Figure 4.10 shows the variation of T* with solution temperature for the three
solution
46
Page 61
Temperature (K)
Red
uce
tem
pera
ture
(T*)
-4
-3
-2
-1
0
1
2
3
100 150 200 250 300 350 400 450 500 550 600
WATERDIEETHYLENE GLYCOLDIEE.G/WATER
Fig 4.10: Reduced Temperature (T*) vs. Temperature (K)
Figure 4.10: indicates that when the temperature increases the reduced
temperature increased.
It is evident that the mixture of Diethylene with water from 143.15 to 203.15
K leads to an increase in the reduced temperature T* over than that of water
and less than of diethylene glycol. From 363.15 to 563.15 K the reduced
temperature T* of the mixture is below than that when every one alone.
For Ethanol/water system
Table 4.5 Ethanol /water system [52]
The substances TF (K) TB (K)
Water 273.15 373.15
Ethanol 155.85 351.55
50/50% mixture 242.55 355.45
For water the equation (4.7) becomes
47
Page 62
7315.312592.1019* +×−=T
T … (4.8)
For Ethanol the equation (4.7) becomes
7964.119646.279* +×−=T
T … (4.16)
For 50% of Ethanol mixture the equation (4.7) becomes
2252.312794.782* +×−=T
T … (4.17)
The initial value of temperature (T) is 143.15 K (-130°C) to 563.15 K
(290°C). Substitutition of these temperatures in these equations (4.8), (4.16)
and (4.17) gives the reduced temperature (T*)
The results are presented in appendix B in table B5.
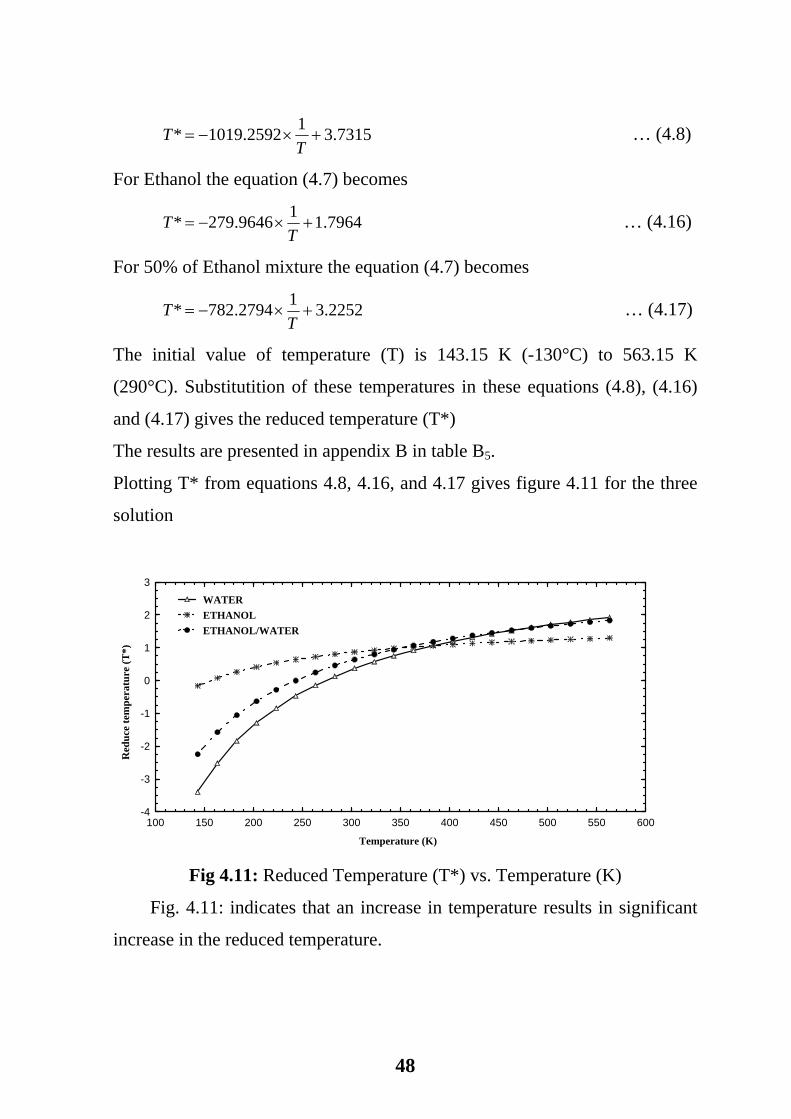
Plotting T* from equations 4.8, 4.16, and 4.17 gives figure 4.11 for the three
solution
Temperature (K)
Red
uce
tem
pera
ture
(T*)
-4
-3
-2
-1
0
1
2
3
100 150 200 250 300 350 400 450 500 550 600
WATERETHANOLETHANOL/WATER
Fig 4.11: Reduced Temperature (T*) vs. Temperature (K)
Fig. 4.11: indicates that an increase in temperature results in significant
increase in the reduced temperature.
48
Page 63
Also the figure reveals that from 143.15 to 343.15 K the reduced
temperature T* of the mixture increases with increasing the temperature more
than of water alone and less than of ethanol alone and from 343.15 to 563.15
K the reduced temperature of the mixture increased higher than that of the
ethanol.
For Glycerol/water system
Table 4.6 Glycerol /water system [58]
The substances TF (K) TB (K)
Water 273.15 373.15
Glycerol 290.15 563.15
50% mixture 247.69 375.72
For water the equation (4.7) becomes
7315.312592.1019* +×−=T
T … (4.8)
For Glycerol the equation (4.7) becomes
0628.215274.598* +×−=T
T … (4.18)
For 50% of Glycerol mixture the equation (4.7) becomes
9346.218772.726* +×−=T
T … (4.19)
The initial value of temperature (T) is 143.15 K (-130°C) to 563.15 K
(290°C). Substitutition of these temperatures in these equations (4.4.8), (4.18)
and (4.19) gives the reduced temperature (T*)
The results are listed in table B6 in appendix B.
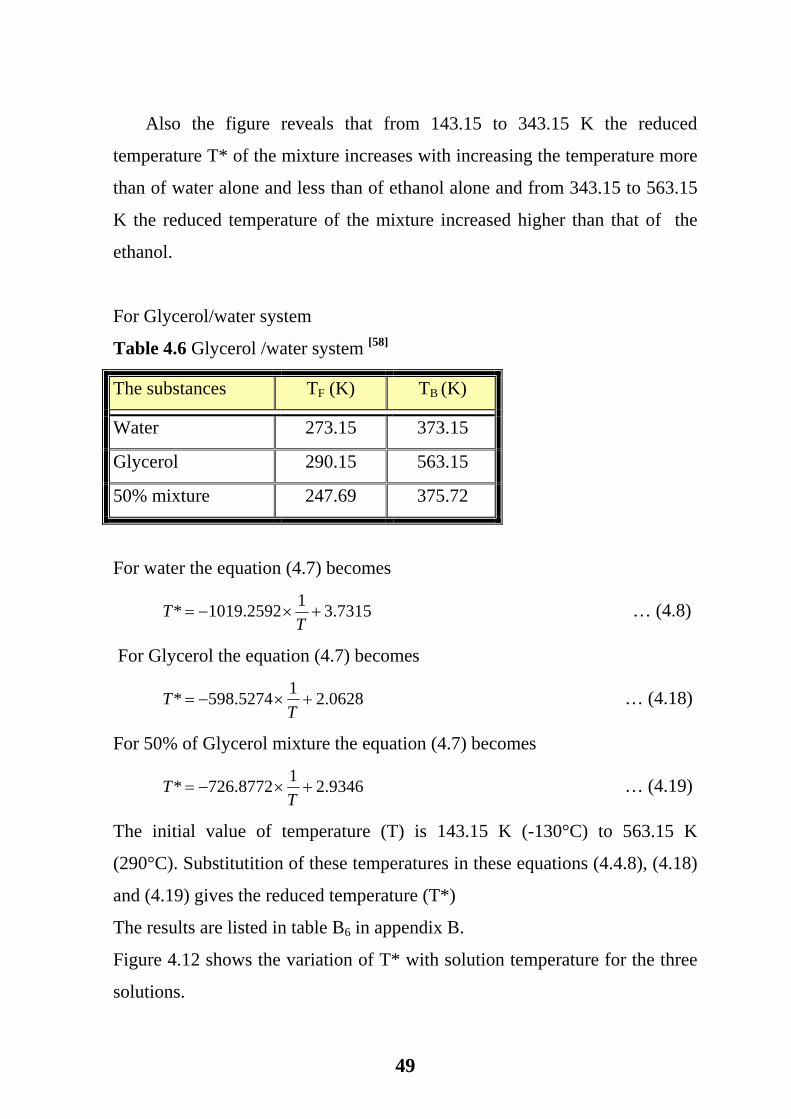
Figure 4.12 shows the variation of T* with solution temperature for the three
solutions.
49
Page 64
Temperature (K)
Red
uce
tem
pera
ture
(T*)
-4
-3
-2
-1
0
1
2
3
100 150 200 250 300 350 400 450 500 550 600
WATERGLYCEROLGLYCEROL/WATER
Fig 4.12: Reduced Temperature (T*) vs. Temperature (K)
Figure 4.12: reveals that the reduced temperature increases with
increasing the temperature.
It is evident that the temperature of the mixture glycerol with water from
143.15 to 363.15 K leads to an increase is the reduced temperature T*over
than that when every one is alone and from 363.15 to 563.15 K the reduced
temperature T*of the mixture is below than of water and higher than of
glycerol.
For Methanol/water system
Table 4.7 Methanol /water system [53]
The substances TF (K) TB (K)
Water 273.15 373.15
Methanol 175.45 337.65
50% mixture 227.15 376.86
For water the equation (4.7) becomes
50
Page 65
7315.312592.1019* +×−=T
T … (4.8)
For Methanol the equation (4.7) becomes
0817.212324.365* +×−=T
T … (4.20)
For 50% of Methanol mixture the equation (4.7) becomes
5176.219239.571* +×−=T
T … (4.21)
The initial value of temperature (T) is 143.15 K (-130°C) to 563.15 K
(290°C). Substitutition of these temperatures in these equations (4.8), (4.20)
and (4.21) gives the reduced temperature (T*)
The results are presented in appendix B in table B7.
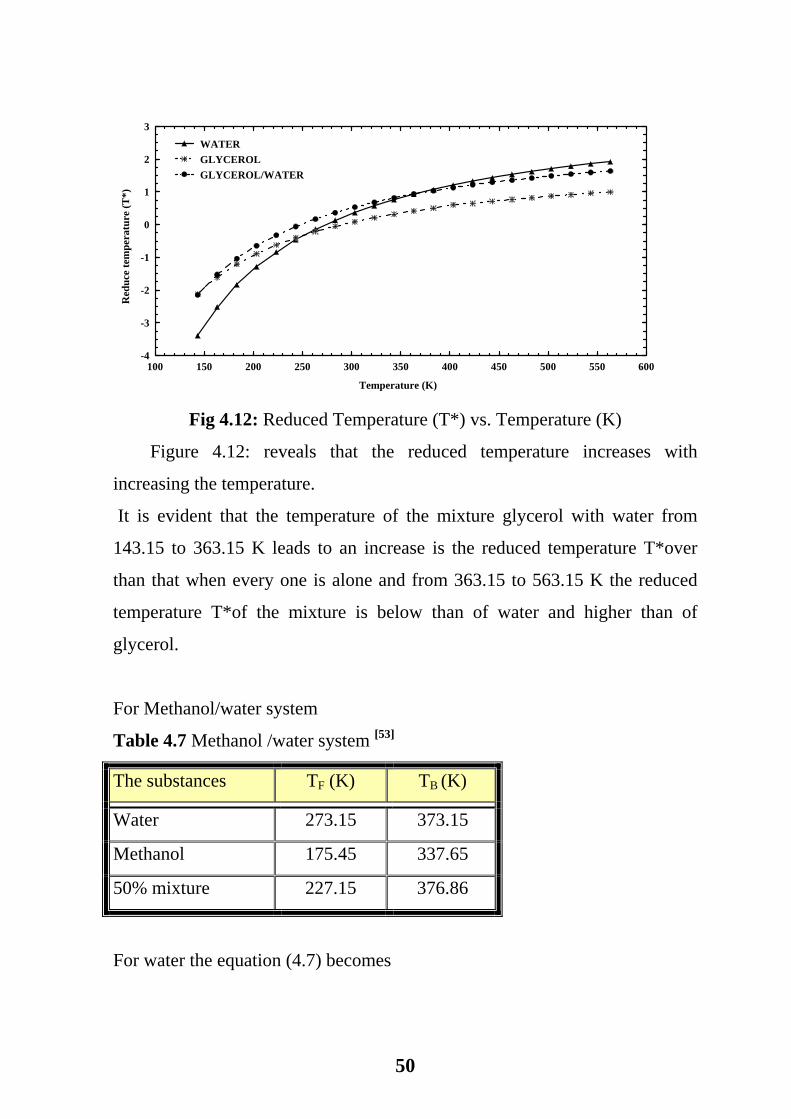
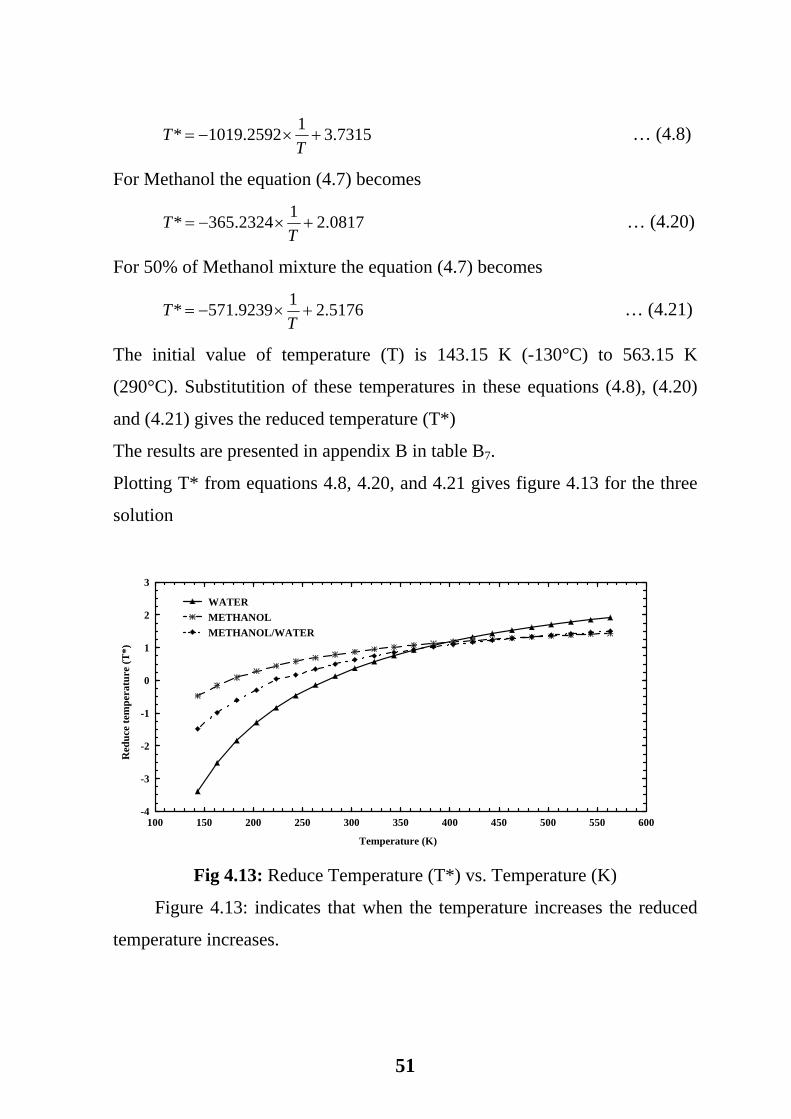
Plotting T* from equations 4.8, 4.20, and 4.21 gives figure 4.13 for the three
solution
Temperature (K)
Red
uce
tem
pera
ture
(T*)
-4
-3
-2
-1
0
1
2
3
100 150 200 250 300 350 400 450 500 550 600
WATERMETHANOLMETHANOL/WATER
Fig 4.13: Reduce Temperature (T*) vs. Temperature (K)
Figure 4.13: indicates that when the temperature increases the reduced
temperature increases.
51
Page 66
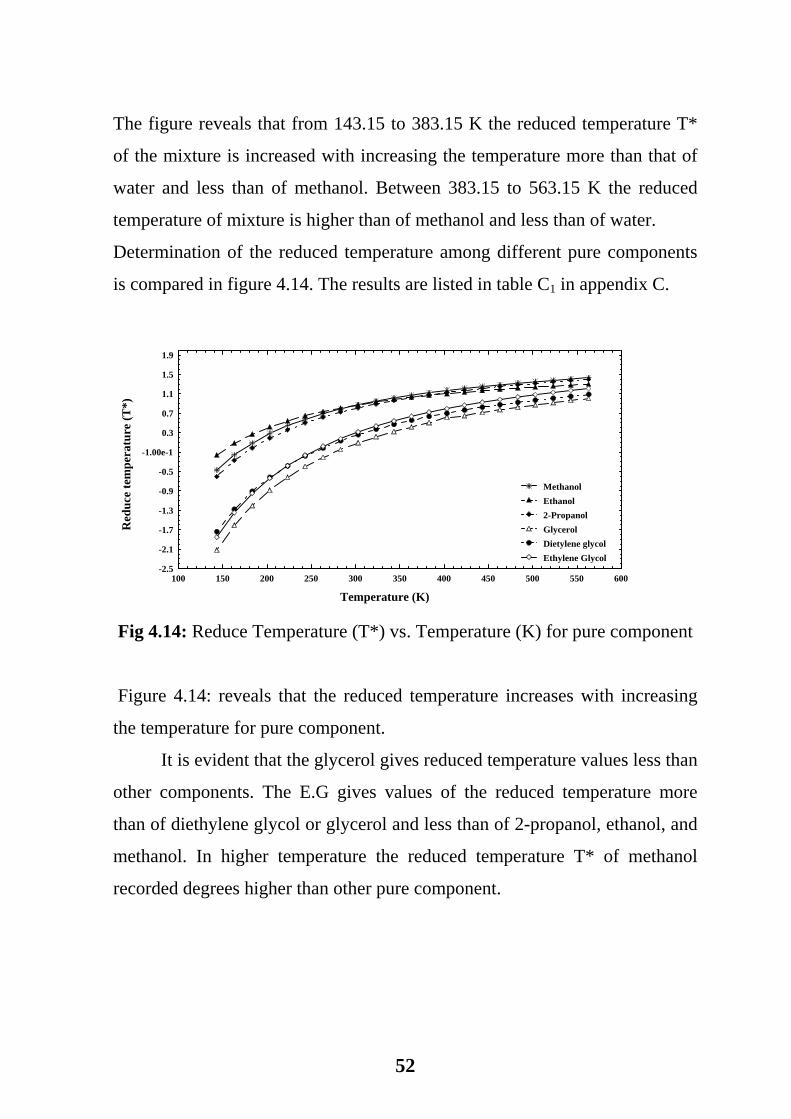
The figure reveals that from 143.15 to 383.15 K the reduced temperature T*
of the mixture is increased with increasing the temperature more than that of
water and less than of methanol. Between 383.15 to 563.15 K the reduced
temperature of mixture is higher than of methanol and less than of water.
Determination of the reduced temperature among different pure components
is compared in figure 4.14. The results are listed in table C1 in appendix C.
Temperature (K)
Red
uce
tem
pera
ture
(T*)
-2.5
-2.1
-1.7
-1.3
-0.9
-0.5
-1.00e-1
0.3
0.7
1.1
1.5
1.9
100 150 200 250 300 350 400 450 500 550 600
MethanolEthanol2-PropanolGlycerolDietylene glycolEthylene Glycol
Fig 4.14: Reduce Temperature (T*) vs. Temperature (K) for pure component
Figure 4.14: reveals that the reduced temperature increases with increasing
the temperature for pure component.
It is evident that the glycerol gives reduced temperature values less than
other components. The E.G gives values of the reduced temperature more
than of diethylene glycol or glycerol and less than of 2-propanol, ethanol, and
methanol. In higher temperature the reduced temperature T* of methanol
recorded degrees higher than other pure component.
52
Page 67
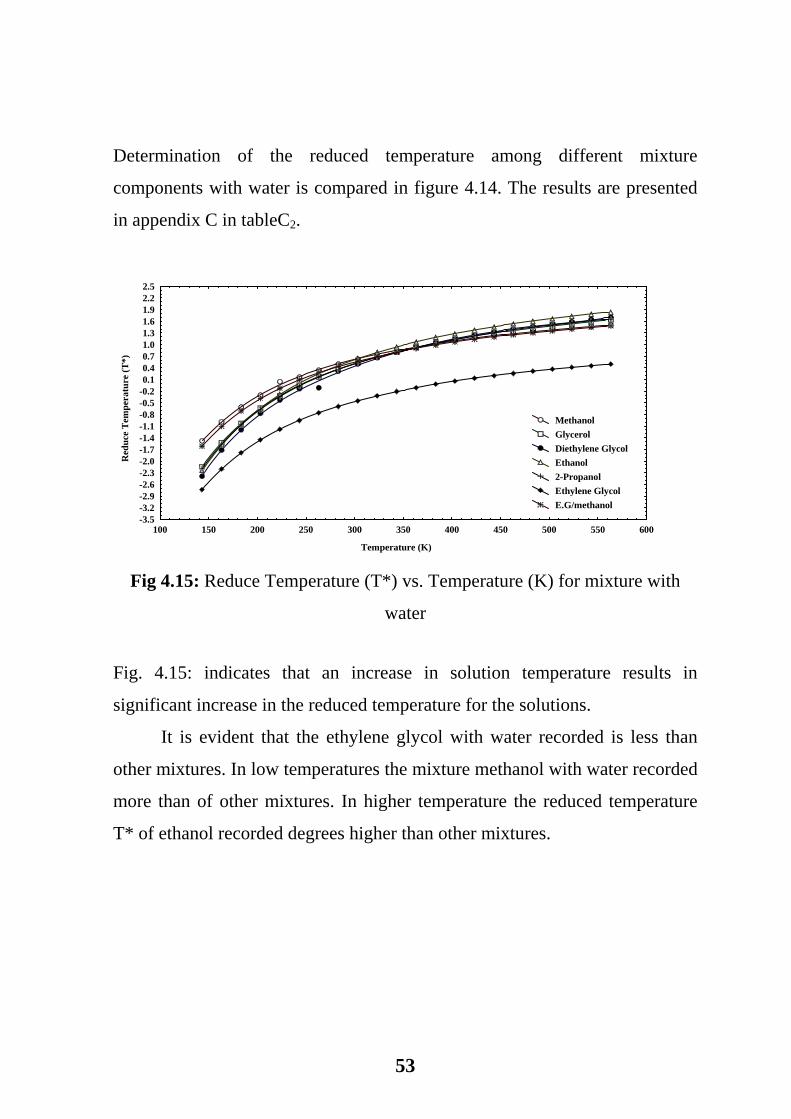
Determination of the reduced temperature among different mixture
components with water is compared in figure 4.14. The results are presented
in appendix C in tableC2.
Temperature (K)
Red
uce
Tem
pera
ture
(T*)
-3.5-3.2-2.9-2.6-2.3-2.0-1.7-1.4-1.1-0.8-0.5-0.20.10.40.71.01.31.61.92.22.5
100 150 200 250 300 350 400 450 500 550 600
MethanolGlycerolDiethylene GlycolEthanol2-PropanolEthylene GlycolE.G/methanol
Fig 4.15: Reduce Temperature (T*) vs. Temperature (K) for mixture with
water
Fig. 4.15: indicates that an increase in solution temperature results in
significant increase in the reduced temperature for the solutions.
It is evident that the ethylene glycol with water recorded is less than
other mixtures. In low temperatures the mixture methanol with water recorded
more than of other mixtures. In higher temperature the reduced temperature
T* of ethanol recorded degrees higher than other mixtures.
53
Page 68
4.5 Correlation
In this work the statistica computer program was used to obtain the
correlations describing the system.
In addition these correlations can be used without performing the
experiments. It was noticed that the freezing temperature TF is affected by
weight percent of Ethylene Glycol C. This relation can be expressed as
follows:
… (4.22) )( bF CfT =
Statistical analysis of experimented results using Rosenbrok and Quasi-
Newton method gives the following relation to predict the freezing
temperature for water – ethylene glycol solution at 25°C.
652
43
34
25
1 )05(^10)08(^10 ACACACACACATF +×+×+×+×−×+×−×=
… (4.23)
Where: TF is the freezing temperature (°C), and C is the weight percent of
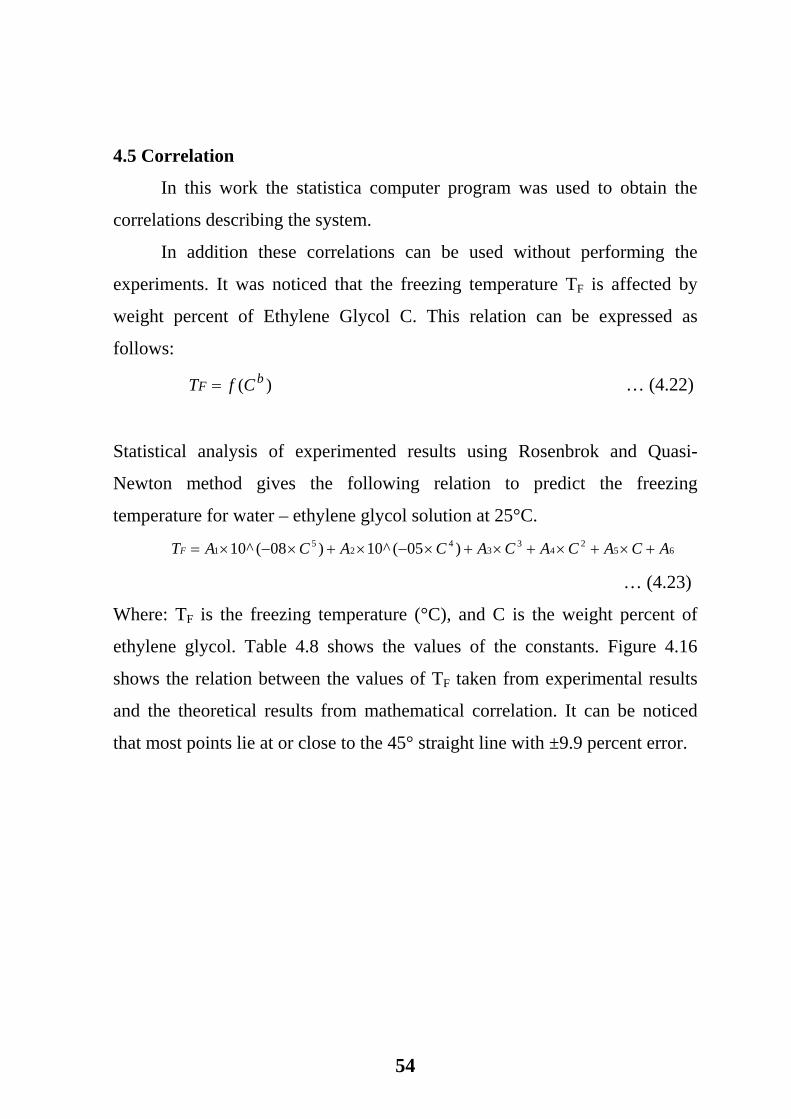
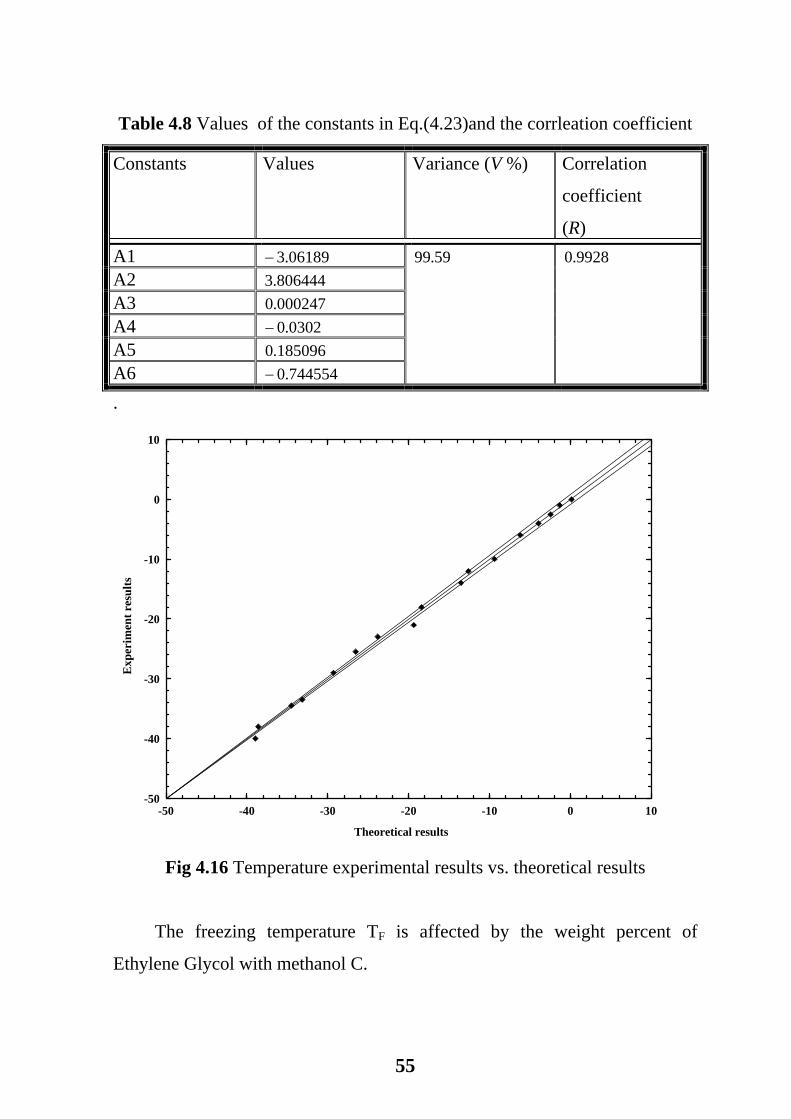
ethylene glycol. Table 4.8 shows the values of the constants. Figure 4.16
shows the relation between the values of TF taken from experimental results
and the theoretical results from mathematical correlation. It can be noticed
that most points lie at or close to the 45° straight line with ±9.9 percent error.
54
Page 69
Table 4.8 Values of the constants in Eq.(4.23)and the corrleation coefficient
Constants Values Variance (V %) Correlation
coefficient
(R) A1 06189.3− A2 806444.3 A3 000247.0 A4 0302.0− A5 185096.0 A6 744554.0−
59.99 9928.0
.
Theoretical results
Exp
erim
ent r
esul
ts
-50
-40
-30
-20
-10
0
10
-50 -40 -30 -20 -10 0 10
Fig 4.16 Temperature experimental results vs. theoretical results
The freezing temperature TF is affected by the weight percent of
Ethylene Glycol with methanol C.
55
Page 70
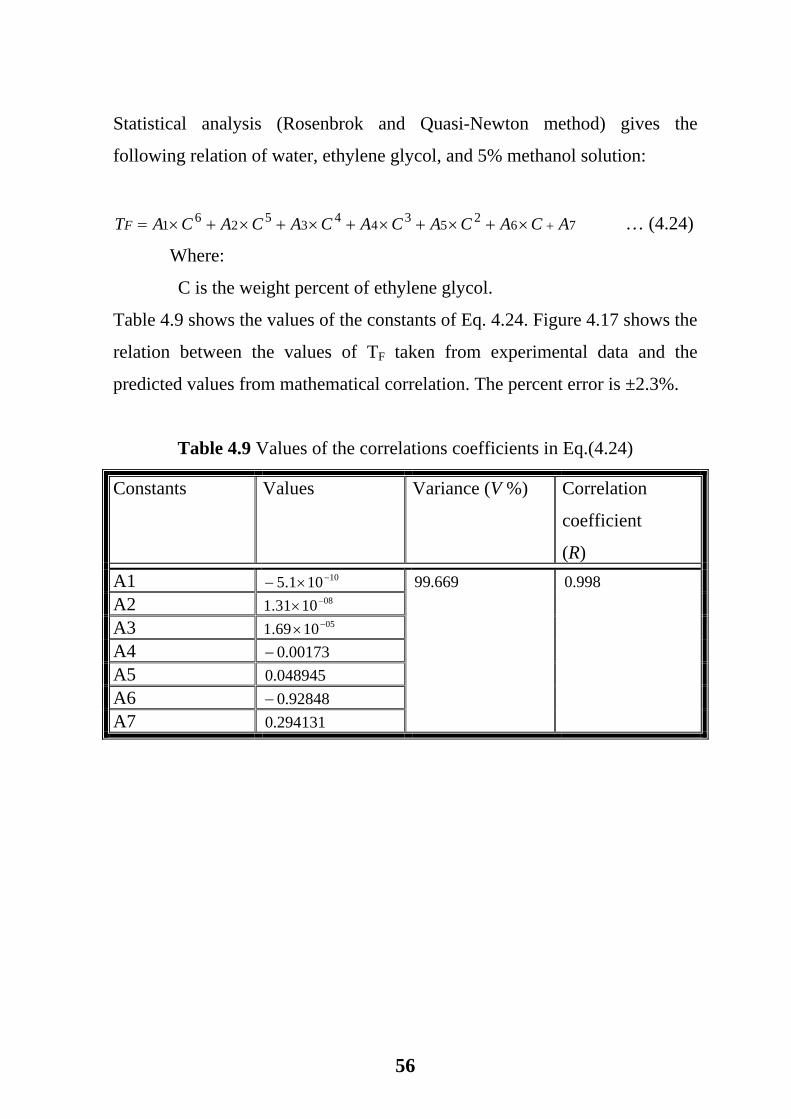
Statistical analysis (Rosenbrok and Quasi-Newton method) gives the
following relation of water, ethylene glycol, and 5% methanol solution:
762534435261 ACACACACACACATF +×+×+×+×+×+×= … (4.24)
Where:
C is the weight percent of ethylene glycol.
Table 4.9 shows the values of the constants of Eq. 4.24. Figure 4.17 shows the
relation between the values of TF taken from experimental data and the
predicted values from mathematical correlation. The percent error is ±2.3%.
Table 4.9 Values of the correlations coefficients in Eq.(4.24)
Constants Values Variance (V %) Correlation
coefficient
(R) A1 10101.5 −×− A2 081031.1 −× A3 051069.1 −× A4 00173.0− A5 048945.0 A6 92848.0− A7 294131.0
669.99 998.0
56
Page 71
Theoretical results
Exp
erim
ent r
esul
ts
-50
-40
-30
-20
-10
0
10
-50 -40 -30 -20 -10 0 10
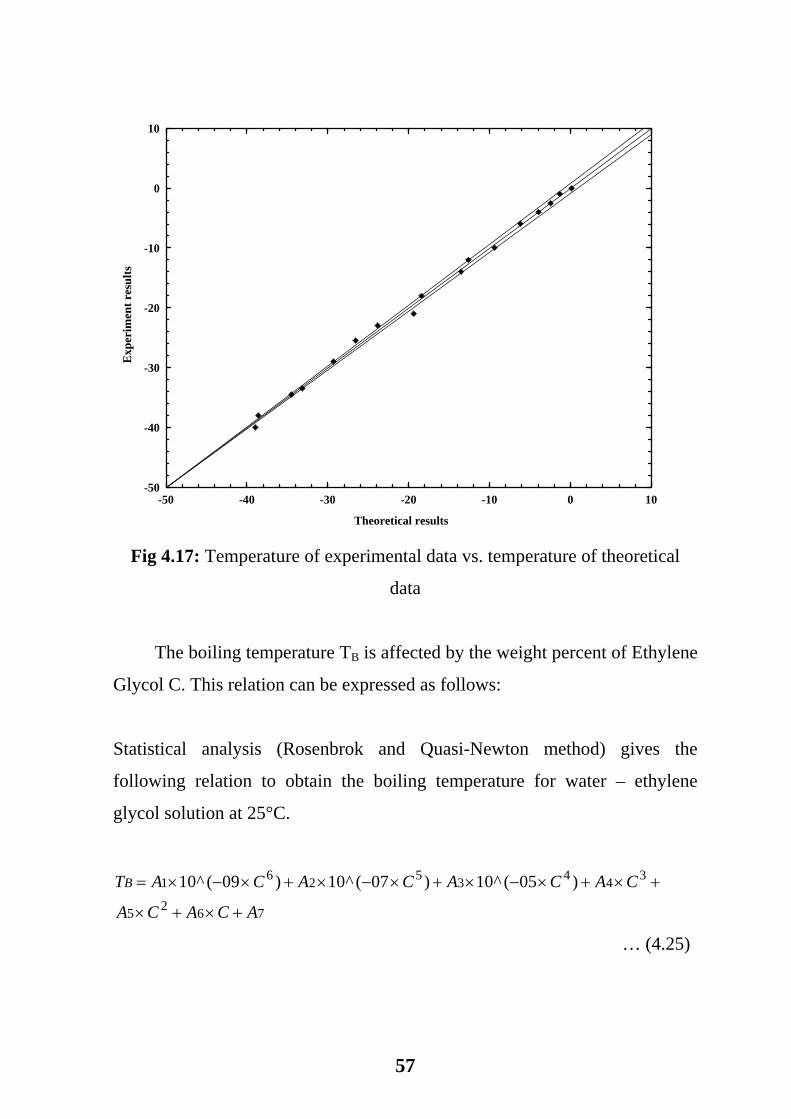
Fig 4.17: Temperature of experimental data vs. temperature of theoretical
data
The boiling temperature TB is affected by the weight percent of Ethylene
Glycol C. This relation can be expressed as follows:
Statistical analysis (Rosenbrok and Quasi-Newton method) gives the
following relation to obtain the boiling temperature for water – ethylene
glycol solution at 25°C.
7625
34435261 )05(^10)07(^10)09(^10
ACACA
CACACACATB
+×+×
+×+×−×+×−×+×−×=
… (4.25)
57
Page 72
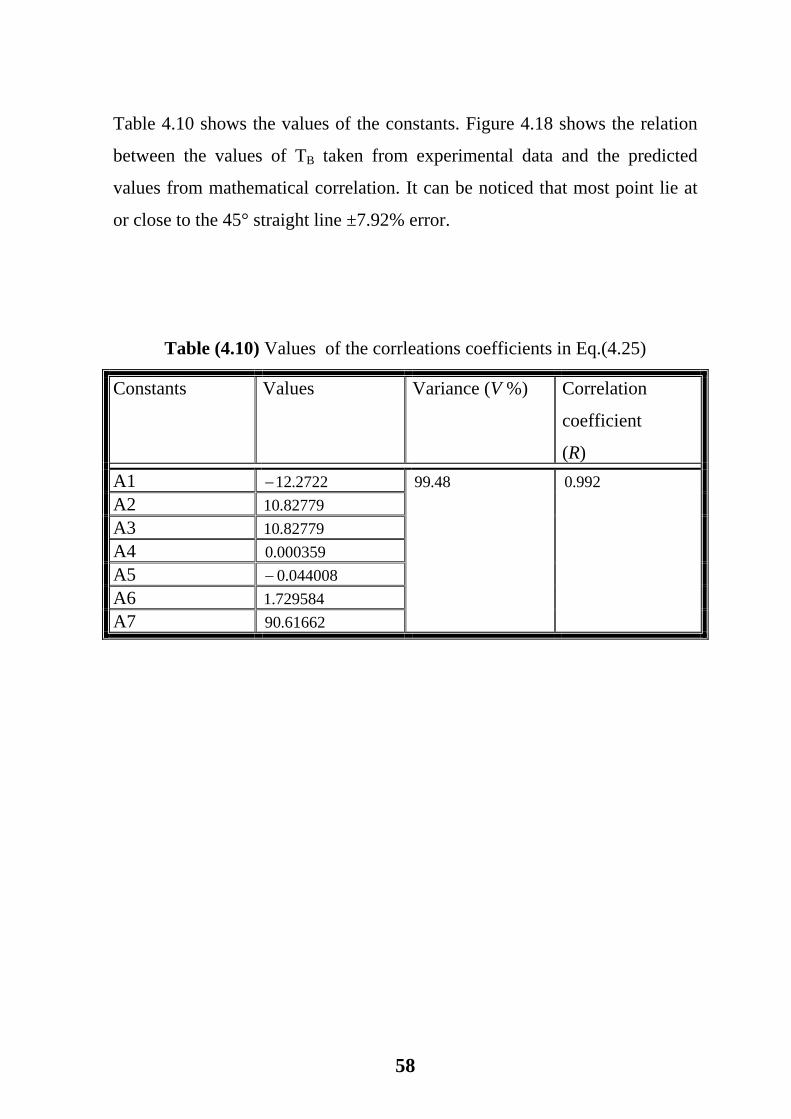
Table 4.10 shows the values of the constants. Figure 4.18 shows the relation
between the values of TB taken from experimental data and the predicted
values from mathematical correlation. It can be noticed that most point lie at
or close to the 45° straight line ±7.92% error.
Table (4.10) Values of the corrleations coefficients in Eq.(4.25)
Constants Values Variance (V %) Correlation
coefficient
(R) A1 2722.12− A2 82779.10 A3 82779.10 A4 000359.0 A5 044008.0− A6 729584.1 A7 61662.90
48.99 992.0
58
Page 73
Theoretical results
Exp
erim
enta
l res
ults
90
110
130
150
170
190
210
90 110 130 150 170 190 210
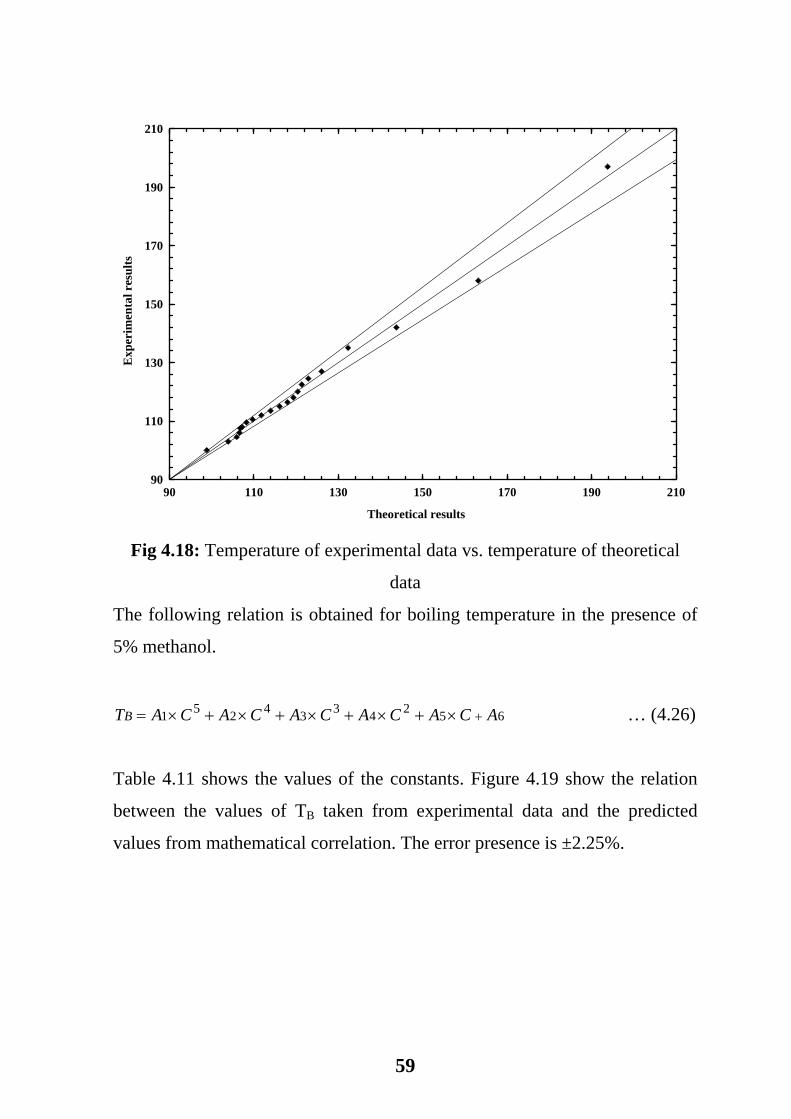
Fig 4.18: Temperature of experimental data vs. temperature of theoretical
data
The following relation is obtained for boiling temperature in the presence of
5% methanol.
6524334251 ACACACACACATB +×+×+×+×+×= … (4.26)
Table 4.11 shows the values of the constants. Figure 4.19 show the relation
between the values of TB taken from experimental data and the predicted
values from mathematical correlation. The error presence is ±2.25%.
59
Page 74
Table 4.11 Values of the correlations coefficients in Eq. (4.26)
Constants Values Variance (V %) Correlation
coefficient
(R) A1 071017.2 −× A2 05105.4 −×− A3 003288.0 A4 09532.0− A5 160554.1 A6 53581.98
366.99 9968.0
Theoretical results
Exp
erim
enta
l res
ults
90
110
130
150
170
190
210
90 110 130 150 170 190 210
Fig 4.19: Temperature of experimental data vs. temperature of theoretical
data
60
Page 75
Chapter Five
Conclusions and Recommendations
5.1 Conclusions
From the experimental work the following conclusions are obtained:
1. Addition of Ethylene Glycol to water in percents 0 – 55% leads to decrease
gradually in the freezing temperature. Addition of 5% methanol to Ethylene
Glycol – Water lead to further decrease gradually of freezing point at different
concentrations of ethylene glycol.
2. Addition of 5% methanol to Ethylene Glycol – Water decreases the boiling
point at different concentrations of mixture.
3. The minimum freezing point is found at 50% of Ethylene Glycol with 5%
methanol where it reads -43°C
4. The boiling point is found at 50% of E.G with 5% methanol where it reads
114.5°C
5. The Leimezs model is found to fairly fit the experimental results then to
determine reduced temperature T* from experimental boiling temperature and
freezing temperature.
61
Page 76
5.2 Recommendations
Further studies could be conducted to:
1. Investigation of the effect of addition of other antifreeze components
on the freezing temperature and boiling temperature of water.
2. Investigation of the addition of methanol on corrosion rate of engines
and on the physical properties as viscosity and specific gravity of
solution.
3. Investigation the effect of environmental conditions such as solution
velocity agitation and shear stress on the freezing point.
4. Investigation the parameter a from Redlich-Kwong equation, the
enthalpy, and entropy by reduced temperature (T*).
62
Page 77
References
1. Texaco Ing., in 2006, Antifreeze and Coolant, http://www.megarock
.com/neaefialtis/cog %209.htm.
2. SCI Technologies, Inc., in 2003, Colligative Chemistry of Antifreeze,
Montana State University, http://www.owlnet.rice.edu/~chem122/Lab122
/ColligProp/index.html.
3. Utah Department of Environmental Quality, in 2000, Antifreeze Recycling
Factsheet, http://www.hazardouswaste.utah.gov/SWBranch/Adobe/ P2 Fact
sheets/AntifreezeRecyclingFactSheet.pdf.
4. Baseem H. EsSebbagh, in 2002, Corrosion and Corrosion Inhibition of AI
in 50% (v/v) Ethylene Glycol Solution Using a Computer-Assisted
Potentiostat, M. Sc., Thesis, University of Baghdad, Baghdad.
5. Zink, D. G., US Industrial Chemical Inc., Antifreezes, ECT, 1st ed., vol. 2,
pp. 37-50.
6. Tnrcc Reguatory Guidance, in 1997, Used Antifreeze (Used Coolant),
http://www.p2pays.org/ref/03/02579.pdf.
7. Michael Pollick, in 2006, what is Antifreeze? http://www.wisegeek.
com/what-is-antifreeze.htm.
8. Mallinckrodt Baker Inc., in 1999, Ethylene Glycol, MSDS No. E5125,
http://www.soilchem.ag.ohio-state.edu/webdoug /msds2/ethyleneglycol.pdf,
9. Fay, R. H., in 1978, The Dow Chemical Co., Antifreezes and Deicing Fluid
ECT, 3rd ed., Vol. 3, pp. 79-95.
10. Curme, G. O., and Johenston, F., in 1952, Glycols, Reinhold Chemical
Corp., NY, p.170.
11. Miller, Samuel Aaraor, in 1969, "Ethylene and its Industrial Derivatives"
London, Benn Co., pp. 589-615.
12. Kirk-Othmer. Glycols, Ethylene Glycol, ECT, 2nd ed., Vol.10, pp 638-646.
63
Page 78
13. Olsen, J. C., Brunjes, A. S., and Olson, J. W., in 1930, Ind. Eng. Chem.,
Vol. 22, 1315-1317.
14. Duus, H.C., Keller, E. H., and Cadot, H. M., in 1938, Ind. Eng. Chem.,
Vol. 30, pp. 143-145.
15. Extol of Ohio Ind., http://www.extolohio.com/insulation/ charts.htm1
16. Kallgren, R. W., The Dow Chemical Co., Antifreeze and Deicing Fluids,
ECT, 2nd ed., Vol. 2, pp. 540-561.
17. David Albrecht, 01 Nov. 1995, Glycol Application, http://www.osmonics
.com/products/page735.htm.
18. Union Carbide Corp., in 2005, Union Carbide Products,
http://www.union carbide.com.
19. Messing, R. F., Chem. Inds., in 1950, vol. 67, pp 41.
20. Antifreeze and Coolant, in 2005, http://www.wisegeek.com/s/antifreeze-
and-coolant
21. Jenpen... Antifreeze, in 2007, http://en.wikipedia.org/w/index.php?
Title=Antifreeze&oldid=94166258.
22. Alcohol, in 2007, http://www.geo.utexas.edu/courses/387E/PDF/alcohol
.pdf.
23. Linda., in 1991, Spill Response, Cleanup and Environmental Issues
Associated With a Methanol Spill in Alaska. http://www.netl.doe.gov
/technologies/coalpower/cctc/cctdp/bibliography/demonstration/pdfs/estmn/0
0000128.pdf.
24. Franklin., in 2000, Cold weather and submersibles, Vol. 18, No. 1,
http://www.franklin-electric.com/aid/vol18no1.htm
25. Agnew, R. J., Truitt, J. K., and Robertsion, W. D., in 1958, Corrosion of
Metals in Ethylene Glycol Solutions, Ind. Eng.Chem., 50,pp. 649-656.
26. Cool, I. M. in 2000, Premature Failure of New Aluminum Radiators,
http://www.imcool.com.
64
Page 79
27. Bregman, J. I., in 1963, Corrosion Inhibitors, The Macmillan Co., NY.
28. Joseph Ciparick, in 2005, Additional Information about the Articles.
http://collingswood.k12.nj.us/schools/colls_hs/chs_teacher/chem/Volumes/96
/october/Oct96_tg.pdf.
29. Union Carbide Corp, in 1971, Glycols, Chemicals and Plastics, Tarry-
town, NY.
31. Duus H. C., Kellner E. H., and Cadot H. M., in 1938, Ind. Eng. Chem.,
Vol.30, pp143.
32. Horvath A. L., in 1974, Chem. Engng. Sci., vol. 29, pp 1334.
33. Chao K. C. and Robinsion L. R. (Eds), in 1979, Equation of State in
Engineering and Research, ACS Adv. In Chem. No. 128.
34. Soave G., in 1980, Chem. Eng Sci., vol. 35, pp 1725.
35. Soave G., in 1972, Chem. Eng Sci., vol. 27, pp 1197.
36. Peng D.,-Y. and Robinson D. B., in 1976, Ind. Eng Chem. Fundls, Vol.15,
pp 183.
37. Peng D.-Y. and Robinson D. B. in 1977, AIChEJ., vol. 23, pp 137.
38. Usdin E and McAuliffe J., in 1976, Chem. Eng Sci., vol. 31, pp 1077.
39. Raimondi L., in 1980, Chem. Eng Sci., vol. 35, pp 1269.
40. Redlich O. and Kwong J. N.S., in 1949, Chem. Rev., vol. 44, pp 233.
41. Lielmezs. S. K. Howell and H. D. Campbli, in 1982, Chem. Eng Sci., Vol.
38, pp 1293.
42. Epstein L. F., in 1976, Chem. Eng. Sci., vol. 31, pp 87.
43. Lielmezs, J., Astley K. G. and McEvoy J. A., in 1982, Thermochemica
Acta, vol. 52, pp 9.
44. Santrach D. and Lielmezs J., in 1978, Ind. Eng. Chem. Fundls, vol. 17, pp
93.
45. Fish L. W. and Lielmezs J., in 1975, Ind. Eng. Chem. Fundls, vol. 14, pp
248.
65
Page 80
46. Lielmezs J., Z., in 1974, Phys. Chem. NF (Frankfurt am Main), vol. 91, pp
288.
47. Annual Book of ASTM Standards, Part 30, American Society for Testing
and Materials, Philadelphia, Pa.
48. National Lubricating Grease Institute (NLGI), in 2006, Lubrication &
Maintenance, http://www.p2pays.org/ref/18/17249.pdf
49. Debye P., and Hückel E., in 2007, Solutions http://www.usm.maine.edu
/chy/pltl/pdf/12.solutions.pdf.
50. Heather, Sheri, Antonio, & Mark, in 1998, Ethylene Glycol,
http://159.121.82.250/CR2K/CR2K_Reports/Historical_Listing071304.pdf.
51. Union Carbide Corporation, in 2000, Ethylene Glycol, http://www.
dow.com/ethyleneglycol/app/antifreeze.htm.
52. Richmond, Va – Radco, in 2005, Ethanol based water, http://www.
engineeringtoolbox.com/ethanol-water-d_989.html.
53. Richmond, Va – Radco, in 2005, Methanol, http://www.engineeringtool
box .com/methanol-water-d_987.html.
54. Richmond, Va – Radco, in 2005, isopropanol, http://www.engineeringtool
box.com/ispropanol-water-d_988.html.
55. Union Carbide Corporation, in 2000, diethylene glycol, http://www.
dow.com/diethyleneglycol/prod/deg.htm.
56. Johnston Services, Inc., in 2005, Anti-Freeze in Hydronic Systems,
http://www.johnstonservicesinc.com/Technical/Glycol.htm#.
57. Cecilia Hägg, in 2005, Ice Slurry as Secondary Fluid in Refrigeration
Systems, http://scanref.com/fileadmin/previous_issues/2003/ScanRef_6_
2003.pdf.
58. Isidoro Martinez, in 2007, Properties of some particular solutions,
http://imartinez.etsin.upm.es/bk3/c07sol/Solution%20properties.htm
66
Page 81
Appendix A
Table A1: Freezing Temperature of aqueous solution of E.G./water and
E.G/Water/Methanol
Wt.% T(°C) (E.G/WATER)
T(°C) (E.G/WATER/METHAMOL)
0 0 0 5 -1 -3
10 -2.5 -5 15 -4 -8 20 -6 -10 25 -10 -13.5 30 -14 -17 35 -18 -20.5 40 -23 -24.5 45 -29 -32 50 -34.5 -39 55 -40 -43 80 -38 -40 85 -33.5 -35 90 -25.5 -27 95 -21 -18.5 100 -12 -12
A-1
Page 82
Table A2: Boiling Temperature of aqueous solution of E.G./water and
E.G/Water/Methanol
Wt% T(C) (E.G/WATER)
T(C) (E.G/WATER/METHANOL)
0 100 100 5 103 101
10 104.5 102 15 106 102.5 20 107.5 104.5 25 108 105 30 109.5 106.5 35 110.5 107.5 40 112 109.5 45 113.5 111 50 115 113.5 55 116.5 114.5 60 118 116 65 120 118.5 70 122.5 120.5 75 124.5 122 80 127 123.5 85 135 130 90 142 139 95 158 156 100 197 197
A-2
Page 83
Appendix B
Table B1: The Reduced Temperature of E.G, Water, and Mixture at Different
Temperature
T(°C) T(K) T* (water)
T* (E.G)
T* (E.G/water)
290 563.15 1.9216 1.2063 0.496 270 543.15 1.8549 1.1679 0.4555 250 523.15 1.7832 1.1266 0.4119 230 503.15 1.7057 1.0819 0.3648 210 483.15 1.6219 1.0336 0.3139 190 463.15 1.5308 0.9811 0.2585 170 443.15 1.4315 0.9238 0.1981 150 423.15 1.3228 0.8612 0.132 130 403.15 1.2033 0.7923 0.0594 110 383.15 1.0713 0.7163 -0.0209 90 363.15 0.9248 0.6318 -0.1099 70 343.15 0.7612 0.5375 -0.2094 50 323.15 0.5774 0.4316 -0.3211 30 303.15 0.3693 0.3116 -0.4476 10 283.15 0.1318 0.1748 -0.592 -10 263.15 -0.1418 0.0171 -0.7583 -30 243.15 -0.4604 -0.1665 -0.952 -50 223.15 -0.8361 -0.3831 -1.1804 -70 203.15 -1.2858 -0.6423 -1.4537 -90 183.15 -1.8337 -0.958 -1.7868 -110 163.15 -2.5159 -1.3513 -2.2015 -130 143.15 -3.3887 -1.8543 -2.7321
B-1
Page 84
Table B2: The Reduced Temperature of E.G, Water, and Mixture with 5%
Methanol at Different Temperature
T(°C) T(K) T* (water)
T* (E.G)
T* (E.G/water/5%methanol)
290 563.15 1.9216 1.2063 1.4842 270 543.15 1.8549 1.1679 1.4453 250 523.15 1.7832 1.1266 1.4034 230 503.15 1.7057 1.0819 1.3583 210 483.15 1.6219 1.0336 1.3093 190 463.15 1.5308 0.9811 1.2561 170 443.15 1.4315 0.9238 1.1982 150 423.15 1.3228 0.8612 1.1347 130 403.15 1.2033 0.7923 1.065 110 383.15 1.0713 0.7163 0.988 90 363.15 0.9248 0.6318 0.9025 70 343.15 0.7612 0.5375 0.807 50 323.15 0.5774 0.4316 0.700 30 303.15 0.3693 0.3116 0.5783 10 283.15 0.1318 0.1748 0.4397 -10 263.15 -0.1418 0.0171 0.280 -30 243.15 -0.4604 -0.1665 0.0941 -50 223.15 -0.8361 -0.3831 -0.1252 -70 203.15 -1.2858 -0.6423 -0.3876 -90 183.15 -1.8337 -0.958 -0.7074 -110 163.15 -2.5159 -1.3513 -1.1055 -130 143.15 -3.3887 -1.8543 -1.6149
B-2
Page 85
Table B3: The Reduced Temperature of 2-Propanol, Water, and Mixture at
Different Temperature
T(°C) T(K) T* (water)
T* (2-propanol)
T* (2-propanol/water)
290 563.15 1.9216 1.3992 1.6582 270 543.15 1.8549 1.374 1.6099 250 523.15 1.7832 1.3469 1.5578 230 503.15 1.7057 1.3177 1.5016 210 483.15 1.6219 1.2861 1.4408 190 463.15 1.5308 1.2517 1.3747 170 443.15 1.4315 1.2142 1.3027 150 423.15 1.3228 1.1732 1.2238 130 403.15 1.2033 1.128 1.1371 110 383.15 1.0713 1.0782 1.0414 90 363.15 0.9248 1.0229 0.9351 70 343.15 0.7612 0.9612 0.8164 50 323.15 0.5774 0.8918 0.6831 30 303.15 0.3693 0.8133 0.5321 10 283.15 0.1318 0.7236 0.3598 -10 263.15 -0.1418 0.6204 0.1614 -30 243.15 -0.4604 0.5001 -0.0697 -50 223.15 -0.8361 0.3583 -0.3422 -70 203.15 -1.2858 0.1886 -0.6685 -90 183.15 -1.8337 -0.0182 -1.065 -110 163.15 -2.5159 -0.2757 -1.5609 -130 143.15 -3.3887 -0.6051 -2.194
B-3
Page 86
Table B4: The Reduced Temperature of Diethylene glycol, Water, and
Mixture at Different Temperature
T(°C) T(K) T* (water)
T* (Diethylene
glycol)
T* (Diethylene
glycol/water) 290 563.15 1.9216 1.084 1.7 270 543.15 1.8549 1.0485 1.6488 250 523.15 1.7832 1.0104 1.5936 230 503.15 1.7057 0.9692 1.534 210 483.15 1.6219 0.9246 1.4695 190 463.15 1.5308 0.8761 1.3994 170 443.15 1.4315 0.8233 1.323 150 423.15 1.3228 0.7655 1.2394 130 403.15 1.2033 0.702 1.1475 110 383.15 1.0713 0.6318 1.0459 90 363.15 0.9248 0.5539 0.9332 70 343.15 0.7612 0.4669 0.8074 50 323.15 0.5774 0.3692 0.666 30 303.15 0.3693 0.2585 0.506 10 283.15 0.1318 0.1322 0.3232 -10 263.15 -0.1418 -0.0132 -0.1128 -30 243.15 -0.4604 -0.1827 -0.1323 -50 223.15 -0.8361 -0.3824 -0.4213 -70 203.15 -1.2858 -0.6216 -0.7672 -90 183.15 -1.8337 -0.9129 -1.1887 -110 163.15 -2.5159 -1.2757 -1.7135 -130 143.15 -3.3887 -1.7398 -2.3849
B-4
Page 87
Table B5: The Reduced Temperature of Ethanol, Water, and Mixture at
Different Temperature
T(°C) T(K) T* (water)
T* (Ethanol)
T* (Ethanol/water)
290 563.15 1.9216 1.2993 1.8361 270 543.15 1.8549 1.281 1.7849 250 523.15 1.7832 1.2612 1.7299 230 503.15 1.7057 1.24 1.6704 210 483.15 1.6219 1.2169 1.6061 190 463.15 1.5308 1.1919 1.5362 170 443.15 1.4315 1.1646 1.4599 150 423.15 1.3228 1.1348 1.3765 130 403.15 1.2033 1.102 1.2848 110 383.15 1.0713 1.0657 1.1835 90 363.15 0.9248 1.0255 1.0711 70 343.15 0.7612 0.9805 0.9455 50 323.15 0.5774 0.93 0.8044 30 303.15 0.3693 0.8729 0.6447 10 283.15 0.1318 0.8076 0.4624 -10 263.15 -0.1418 0.7325 0.2524 -30 243.15 -0.4604 0.645 0.0008 -50 223.15 -0.8361 0.5418 -0.2804 -70 203.15 -1.2858 0.4183 -0.6255 -90 183.15 -1.8337 0.2678 -1.046
-110 163.15 -2.5159 0.0804 -1.5696 -130 143.15 -3.3887 -0.1593 -2.2396
B-5
Page 88
Table B6: The Reduced Temperature of Glycerol, Water, and Mixture at
Different Temperature
T(°C) T(K) T* (water)
T* (Glycerol)
T* (Glycerol/water)
290 563.15 1.9216 1 1.6439 270 543.15 1.8549 0.9608 1.5963 250 523.15 1.7832 0.9187 1.5452 230 503.15 1.7057 0.8732 1.4899 210 483.15 1.6219 0.824 1.4301 190 463.15 1.5308 0.7705 1.3652 170 443.15 1.4315 0.7121 1.2943 150 423.15 1.3228 0.6483 1.2168 130 403.15 1.2033 0.6141 1.1316 110 383.15 1.0713 0.5007 1.0375 90 363.15 0.9248 0.4146 0.9374 70 343.15 0.7612 0.3186 0.8164 50 323.15 0.5774 0.2106 0.6853 30 303.15 0.3693 0.0884 0.5369 10 283.15 0.1318 -0.051 0.3675 -10 263.15 -0.1418 -0.2117 0.1724 -30 243.15 -0.4604 -0.3988 -0.0548 -50 223.15 -0.8361 -0.6194 -0.3227 -70 203.15 -1.2858 -0.8834 -0.6434 -90 183.15 -1.8337 -1.2052 -1.0342 -110 163.15 -2.5159 -1.6058 -1.5207 -130 143.15 -3.3887 -2.1183 -2.1431
B-6
Page 89
Table B7: The Reduced Temperature of Methanol, Water, and Mixture at
Different Temperature
T(°C) T(K) T* (water)
T* (Methanol)
T* (Methanol/water)
290 563.15 1.9216 1.4331 1.502 270 543.15 1.8549 1.4093 1.4646 250 523.15 1.7832 1.3836 1.4244 230 503.15 1.7057 1.3558 1.3809 210 483.15 1.6219 1.3258 1.3339 190 463.15 1.5308 1.2931 1.2827 170 443.15 1.4315 1.2575 1.227 150 423.15 1.3228 1.2186 1.166 130 403.15 1.2033 1.1758 1.099 110 383.15 1.0713 1.1285 1.0249 90 363.15 0.9248 1.076 0.9427 70 343.15 0.7612 1.0173 0.8509 50 323.15 0.5774 0.9515 0.7478 30 303.15 0.3693 0.8769 0.631 10 283.15 0.1318 0.7918 0.4977 -10 263.15 -0.1418 0.6938 0.3442 -30 243.15 -0.4604 0.5796 0.1655 -50 223.15 -0.8361 0.445 0.0454 -70 203.15 -1.2858 0.2839 -0.2977 -90 183.15 -1.8337 0.0875 -0.6051 -110 163.15 -2.5159 -0.1569 -0.9879 -130 143.15 -3.3887 -0.4697 -1.4777
B-7
Page 90
Appendix C
Table C1: The Reduced Temperature of Pure Components at Different
Temperature
T(K) T* (Methanol)
T* (Glycerol)
T* (Diethylene
glycol))
T* (Ethanol)
T* (2-
propanol)
T* (E.G)
563.15 1.4331 1 1.084 1.2993 1.3992 1.2063 543.15 1.4093 0.9608 1.0485 1.281 1.374 1.1679 523.15 1.3836 0.9187 1.0104 1.2612 1.3469 1.1266 503.15 1.3558 0.8732 0.9692 1.24 1.3177 1.0819 483.15 1.3258 0.824 0.9246 1.2169 1.2861 1.0336 463.15 1.2931 0.7705 0.8761 1.1919 1.2517 0.9811 443.15 1.2575 0.7121 0.8233 1.1646 1.2142 0.9238 423.15 1.2186 0.6483 0.7655 1.1348 1.1732 0.8612 403.15 1.1758 0.6141 0.702 1.102 1.128 0.7923 383.15 1.1285 0.5007 0.6318 1.0657 1.0782 0.7163 363.15 1.076 0.4146 0.5539 1.0255 1.0229 0.6318 343.15 1.0173 0.3186 0.4669 0.9805 0.9612 0.5375 323.15 0.9515 0.2106 0.3692 0.93 0.8918 0.4316 303.15 0.8769 0.0884 0.2585 0.8729 0.8133 0.3116 283.15 0.7918 -0.051 0.1322 0.8076 0.7236 0.1748 263.15 0.6938 -0.2117 -0.0132 0.7325 0.6204 0.0171 243.15 0.5796 -0.3988 -0.1827 0.645 0.5001 -0.1665 223.15 0.445 -0.6194 -0.3824 0.5418 0.3583 -0.3831 203.15 0.2839 -0.8834 -0.6216 0.4183 0.1886 -0.6423 183.15 0.0875 -1.2052 -0.9129 0.2678 -0.0182 -0.958 163.15 -0.1569 -1.6058 -1.2757 0.0804 -0.2757 -1.3513 143.15 -0.4697 -2.1183 -1.7398 -0.1593 -0.6051 -1.8543
C-1
Page 91
Table C2: The Reduced Temperature of Solutions at Different Temperature
T(K) T*
(Methanol)T*
(Glycerol) T*
(Diethylene glycol)
T* (Ethanol)
T* (2-
propanol)
T* (E.G)
T* E.G+M
563.15 1.502 1.6439 1.7 1.8361 1.6582 0.496 0.4975 543.15 1.4646 1.5963 1.6488 1.7849 1.6099 0.4555 0.4575 523.15 1.4244 1.5452 1.5936 1.7299 1.5578 0.4119 0.4145 503.15 1.3809 1.4899 1.534 1.6704 1.5016 0.3648 0.368 483.15 1.3339 1.4301 1.4695 1.6061 1.4408 0.3139 0.3178 463.15 1.2827 1.3652 1.3994 1.5362 1.3747 0.2585 0.2631 443.15 1.227 1.2943 1.323 1.4599 1.3027 0.1981 0.2036 423.15 1.166 1.2168 1.2394 1.3765 1.2238 0.132 0.1384 403.15 1.099 1.1316 1.1475 1.2848 1.1371 0.0594 0.0667 383.15 1.0249 1.0375 1.0459 1.1835 1.0414 -0.0209 -0.0124363.15 0.9427 0.9374 0.9332 1.0711 0.9351 -0.1099 -0.1003343.15 0.8509 0.8164 0.8074 0.9455 0.8164 -0.2094 -0.1984323.15 0.7478 0.6853 0.666 0.8044 0.6831 -0.3211 -0.3086303.15 0.631 0.5369 0.506 0.6447 0.5321 -0.4476 -0.4334283.15 0.4977 0.3675 0.3232 0.4624 0.3598 -0.592 -0.5759263.15 0.3442 0.1724 -0.1128 0.2524 0.1614 -0.7583 -0.7399243.15 0.1655 -0.0548 -0.1323 0.0008 -0.0697 -0.952 -0.931 223.15 0.0454 -0.3227 -0.4213 -0.2804 -0.3422 -1.1804 -1.1563203.15 -0.2977 -0.6434 -0.7672 -0.6255 -0.6685 -1.4537 -1.426 183.15 -0.6051 -1.0342 -1.1887 -1.046 -1.065 -1.7868 -1.7545163.15 -0.9879 -1.5207 -1.7135 -1.5696 -1.5609 -2.2015 -2.1637143.15 -1.4777 -2.1431 -2.3849 -2.2396 -2.194 -2.7321 -2.6871
C-2
Page 92
Appendix D
Table D1: Freezing point of aqueous solution of P.G. – water
Reported by Union Carbide Corp [29]
Wt% (P.G) TF(°C) 0.000 0.000 10.000 -3.000 20.000 -7.500 30.000 -13.000 40.000 -22.000 50.000 -33.000 60.000 -62.000
Table D2: Boiling point of aqueous solution of P.G. – water
Reported by Union Carbide Corp [29]
Wt% (P.G) TB(°C) 0.000 100.000 10.000 100.500 20.000 101.500 30.000 102.000 40.000 104.000 50.000 106.500 60.000 109.500 70.000 113.500 80.000 119.000 90.000 132.000 100.000 187.000
D-1
Page 93
الخلاصة
يتضمن هذا البحث إيجاد اقل نقطة انجماد يمكن الوصول لها من خلال خلط الماء مع الاثلـين كلايكـول
انه ووجدخليط الماء مع الاثلـين كلايكـول ميثانول إلى% 5ولغرض خفض درجة الانجماد أكثر تم إضافة نسبة
.خفض درجة الانجماديؤدي الى
بـين ح مختلفة تتراو بلغليان لمحلول اثلين كلايكول مع الماء بنس التجارب تضمنت ايضا ايجاد درجات ا
الميثانولول إلى المحلول وقد دلت التجارب العملية على ان هذه المـواد تـؤدي الـى % 5مع إضافة )% 0-100(
وقد أجريت التجارب العملية بضغط واحـد جـو .خفض درجة الانجماد عن درجة انجماد الماء وهي الصفر المئوي
. م°20جة حرارة وبدر
وفـوق ادى الى زيادة انخفاض درجة الانجماد % 55-0النتائج اثبتت ان زيادة نسبة الاثلين كلايكول من
.كذلك باضافة الميثانول الى المحلول يؤدي الى انخفاض درجة الانجماد اكثر .درجة الانجماد تبدا بالزيادة% 80
تم تعويض درجات الانجماد ودرجات الغليان المقاسة عمليا في المعادلـة الموضـحة لإيجـاد الحـرارة
:المختزلة
1
1*
−
−=
BTTTT
F
F
T
إلى -130وآذلك استخدمت هذه المعادلة لإيجاد الحرارة المختزلة لمواد أخرى عند درجات حرارة تراوحت بين
.مئوي290°
التجريبية لحساب درجة الانجماد ودرجة الغليان للمحلول موضحة مـع نـسبة خطـا المعادلات
.النتائج قورينت مع باحثين اخرين استخدموا مواد اخرى% . 2.25 -% 9.9يتراوح بين
:المعادلة التي تم الحصول عليها نظريا لحساب درجة لانجماد لمحلول اثلين كلايكول مع الماء
Page 94
744554.0185096.00302.0
000274.0)05(^10806444.3)08(^1006189.32
345
−×+×−
×+×−×+×−×−=
CC
CCCTF
294131.092848.0048945.0
00173.0^1069.1^1031.1^101.52
3405508610
+×−×+
×−××+××+××−=
:ومع اضافة الميثانول الى محلول اثلين كلايكول مع الماء
−−−
CC
CCCCFT
:المعادلة التي تم الحصول عليها نظريا لحساب درجة الغليان لمحلول اثلين كلايكول مع الماء
61662.90729584.1044008.0000359.0
)05(^1082779.10)07(^1082779.10)09(^102722.1223
456
+×+×−×+
×−×+×−×+×−×−=
CCC
CCCTB
:ومع اضافة الميثانول الى محلول اثلين كلايكول مع الماء
53581.98160554.109532.0003288.0^105.4^1017.2 23405507
+×+×−×+××−××= −− CCCCCTB
Page 95
شكر و تقدير
أتوجه بالشكر الله على هنيء عطائه ومحمود بلائه وتوالي سبوغ نعمائه الذي مكننـي مـن
. التغلب على جميع الصعوبات التي واجهتني خلال البحث
والـدكتور الدكتور ضياء الدين محمد أساتذتي إلى اعبر عن امتناني وتقديري أنأود كذلك
.ل فترة البحثاتوجيهي ومساعدتي ومساندتي طو والدكتور باسم عبيد لطالب كشمولة
فـي جامعـة النهـرين الكيمياوية وموظفي قسم الهندسة أساتذة اشكر جميع أن أيضا أود
. البحثأثناء ةاللازم المساعدة لإبدائهم
وأقدم شكري وتقديري إلى منشاة الباسل وخاصة قسم بحوث الكيمياء لأبـداهم المـساعدة
. لإتمام بحثيةاللازم
وأخواتي علـى دعمهـم وتـشجيعهم وأخي لا أنسى أن أتوجه بالشكر إلى أحبائي والدي
.ودعواتهم المستمرة
شيماء فاضل الزبيدي
2007
Page 96
ظاهرة مزج اثلين كلايكول مع الماء دراسة
لقياس درجة الانجماد
رسالة
مقدمة الى كلية الهندسة في جامعة النهرين وهي جزء من متطلبات نيل
درجة ماجستير علوم في الهندسة الكيمياوية
من قبل
شيماء فاضل مجيد الزبيدي
2004 في الهندسة الكيمياوية علومبكالوريوس
ه 1428 الثاني جمادي
م2007 حزيران