Chem. Senses 23: 385-395, 1998 (y® Pheromone Deactivation Catalyzed by Receptor Molecules: a Quantitative Kinetic Model Karl-Ernst Kaissling Max-Planck-lnstitut fur Verhaltensphysiologie Seewiesen, 82319 Starnberg, Germany Correspondence to be sent to: Dr Karl-Ernst Kaissling, apl. Prof., Max-Planck-lnstitut fur Verhaltensphysiologie Seewiesen, Postfach 1564, D-82305 Starnberg, Germany, e-mail: [email protected]Abstract A quantitative model of pheromone-receptor interaction and pheromone deactivation, the supposed rate-limiting processes underlying the receptor potential kinetics, is worked out for the moth Antheraea polyphemus. In this model, the pheromone interacts with the receptor molecule while bound to the reduced form of the pheromone binding protein. The receptor molecules—besides their receptor function—catalyze the observed shift of the pheromone-binding protein from the reduced to the oxidized form (Ziegelberger, G., Eur. J. Biochem., 232, 706-711, 1995), which deactivates the pheromone bound to pheromone binding protein. With the following parameters, the model fits morphological, radiometric, electrophysiological and biochemical data: a maximum estimate of 1.7 x 10 7 receptor molecules/cell (with 40 000 units/^m 2 of receptor cell membrane), rate constants k^ = 0.2/(s • ^M) for the association, ki = 10/s for the dissociation of the ternary complex of binding protein, pheromone and receptor, and /C3 = 10/s for the deactivation via the redox shift. With these parameters, the duration of elementary receptor potentials elicited by single pheromone molecules (—50 ms) reflects the lifetime of the ternary complex, i = 1/(/c2 + fo). The receptor occupancy produced by the model for threshold stimuli fits the sensitivity of the receptor cell to single pheromone molecules. Introduction Insect olfactory hairs (sensilla trichodea) that adsorb pheromone molecules are chemoreceptor organs of the flux detector type, as opposed to concentration detectors (Kaissling, 1998). In the latter, the receptor cells are exposed to a stimulus concentration which is equal or proportional to the external stimulus concentration. Flux detectors such as sensilla trichodea of moth antennae accumulate stimulus molecules in a perireceptor compartment (Steinbrecht, 1992), and deactivate them after they have excited the recep- tor cell inside the hair. For moths, the postulate of a rapid stimulus deactivation in contrast to the slow enzymatic degradation detected by Kasang and co-workers (Kasang, 1971; Kasang et al, 1988) was derived from the kinetics of the receptor potential (Kaissling, 1972). Evidence has since accumulated that the kinetics of the receptor potential mainly reflects the kinetics of extracellular processes (Kaissling, 1998) rather than the kinetics of cellular trans- duction processes (Breer et al, 1994). The concept of flux detectors has been discussed by means of kinetic models, including the association and dissociation of stimulus molecules and receptor molecules, and the stimulus deactivation (Kaissling, 1998). One version of these models used here corresponds to a simple enzymatic reaction scheme with the receptor molecules catalyzing the stimulus deactivation. The goal of the study is to apply this model to pheromone receptors of the moth Antheraea polyphemus and to determine a set of rate constants for the various processes which fit electrophysiological (Zack, 1979; Meng et al., 1989), radiometric (Kanaujia and Kaissling, 1985; Kasang et al., 1988; Kaissling, 1995b), biochemical (Vogt et al., 1985; Ziegelberger, 1995) and morphometric data (Gnatzy et al., 1984; Keil, 1984). It seems possible to determine rate constants, although none of these processes can be measured directly, and phero- mone receptor molecules have not yet been identified in insects. Most likely, however, specific receptor molecules are located within the dendritic plasma membrane. Since each of several receptor cells innervating a sensillum is tuned to a different pheromone component, specificity must be associated with the receptor cell. Several specific properties of flux detectors facilitate their analysis (Kaissling, 1998). The rate of adsorption of stimulus molecules (stimulus uptake rate) is proportional to the external stimulus flux, the product of the external stimulus concentration and the relative velocity of the medium. At constant stimulus flux, a flow equilibrium can be reached, at which the rate of stimulus deactivation equals the uptake rate. Furthermore, at flow equilibrium, the number of receptor molecules occupied by stimulus molecules (receptor occupancy) is linearly proportional to i Oxford University Press Downloaded from https://academic.oup.com/chemse/article/23/4/385/341850 by guest on 15 January 2022
Transcript
Chem. Senses 23: 385-395, 1998 (y®
Pheromone Deactivation Catalyzed by Receptor Molecules: a QuantitativeKinetic Model
Correspondence to be sent to: Dr Karl-Ernst Kaissling, apl. Prof., Max-Planck-lnstitut fur Verhaltensphysiologie Seewiesen, Postfach1564, D-82305 Starnberg, Germany, e-mail: [email protected]
AbstractA quantitative model of pheromone-receptor interaction and pheromone deactivation, the supposed rate-limiting processesunderlying the receptor potential kinetics, is worked out for the moth Antheraea polyphemus. In this model, the pheromoneinteracts with the receptor molecule while bound to the reduced form of the pheromone binding protein. The receptormolecules—besides their receptor function—catalyze the observed shift of the pheromone-binding protein from the reducedto the oxidized form (Ziegelberger, G., Eur. J. Biochem., 232, 706-711, 1995), which deactivates the pheromone bound topheromone binding protein. With the following parameters, the model fits morphological, radiometric, electrophysiologicaland biochemical data: a maximum estimate of 1.7 x 10⁷ receptor molecules/cell (with 40 000 units/^m2 of receptor cellmembrane), rate constants k^ = 0.2/(s • ̂ M) for the association, ki = 10/s for the dissociation of the ternary complex ofbinding protein, pheromone and receptor, and /C3 = 10/s for the deactivation via the redox shift. With these parameters, theduration of elementary receptor potentials elicited by single pheromone molecules (—50 ms) reflects the lifetime of the ternarycomplex, i = 1/(/c2 + fo). The receptor occupancy produced by the model for threshold stimuli fits the sensitivity of thereceptor cell to single pheromone molecules.
IntroductionInsect olfactory hairs (sensilla trichodea) that adsorbpheromone molecules are chemoreceptor organs of the fluxdetector type, as opposed to concentration detectors(Kaissling, 1998). In the latter, the receptor cells are exposedto a stimulus concentration which is equal or proportionalto the external stimulus concentration. Flux detectors suchas sensilla trichodea of moth antennae accumulate stimulusmolecules in a perireceptor compartment (Steinbrecht,1992), and deactivate them after they have excited the recep-tor cell inside the hair. For moths, the postulate of a rapidstimulus deactivation in contrast to the slow enzymaticdegradation detected by Kasang and co-workers (Kasang,1971; Kasang et al, 1988) was derived from the kinetics ofthe receptor potential (Kaissling, 1972). Evidence has sinceaccumulated that the kinetics of the receptor potentialmainly reflects the kinetics of extracellular processes(Kaissling, 1998) rather than the kinetics of cellular trans-duction processes (Breer et al, 1994).
The concept of flux detectors has been discussed bymeans of kinetic models, including the association anddissociation of stimulus molecules and receptor molecules,and the stimulus deactivation (Kaissling, 1998). One versionof these models used here corresponds to a simple enzymaticreaction scheme with the receptor molecules catalyzing thestimulus deactivation. The goal of the study is to apply this
model to pheromone receptors of the moth Antheraeapolyphemus and to determine a set of rate constants for thevarious processes which fit electrophysiological (Zack, 1979;Meng et al., 1989), radiometric (Kanaujia and Kaissling,1985; Kasang et al., 1988; Kaissling, 1995b), biochemical(Vogt et al., 1985; Ziegelberger, 1995) and morphometricdata (Gnatzy et al., 1984; Keil, 1984).
It seems possible to determine rate constants, althoughnone of these processes can be measured directly, and phero-mone receptor molecules have not yet been identified ininsects. Most likely, however, specific receptor molecules arelocated within the dendritic plasma membrane. Since eachof several receptor cells innervating a sensillum is tunedto a different pheromone component, specificity must beassociated with the receptor cell.
Several specific properties of flux detectors facilitate theiranalysis (Kaissling, 1998). The rate of adsorption ofstimulus molecules (stimulus uptake rate) is proportional tothe external stimulus flux, the product of the externalstimulus concentration and the relative velocity of themedium. At constant stimulus flux, a flow equilibriumcan be reached, at which the rate of stimulus deactivationequals the uptake rate. Furthermore, at flow equilibrium,the number of receptor molecules occupied by stimulusmolecules (receptor occupancy) is linearly proportional to
i Oxford University Press
Dow
nloaded from https://academ
ic.oup.com/chem
se/article/23/4/385/341850 by guest on 15 January 2022
386 K.-E. Kaissling
the uptake rate. The latter was determined using 3H-labeledpheromone, here (E,Z)-6,11-hexadecadienyl acetate, themajor pheromone component of A. polyphemus (Kaissling,1987).
For the flow equilibrium, the relationship betweenreceptor occupancy and receptor potential is given by thedose-response curve, in which the equilibrium amplitude ofthe receptor potential is plotted against the stimulus uptake.On the assumption that the receptor potential at anymoment reflects the receptor occupancy, the decline of theoccupancy after the end of stimulation and the rate ofstimulus deactivation can be estimated.
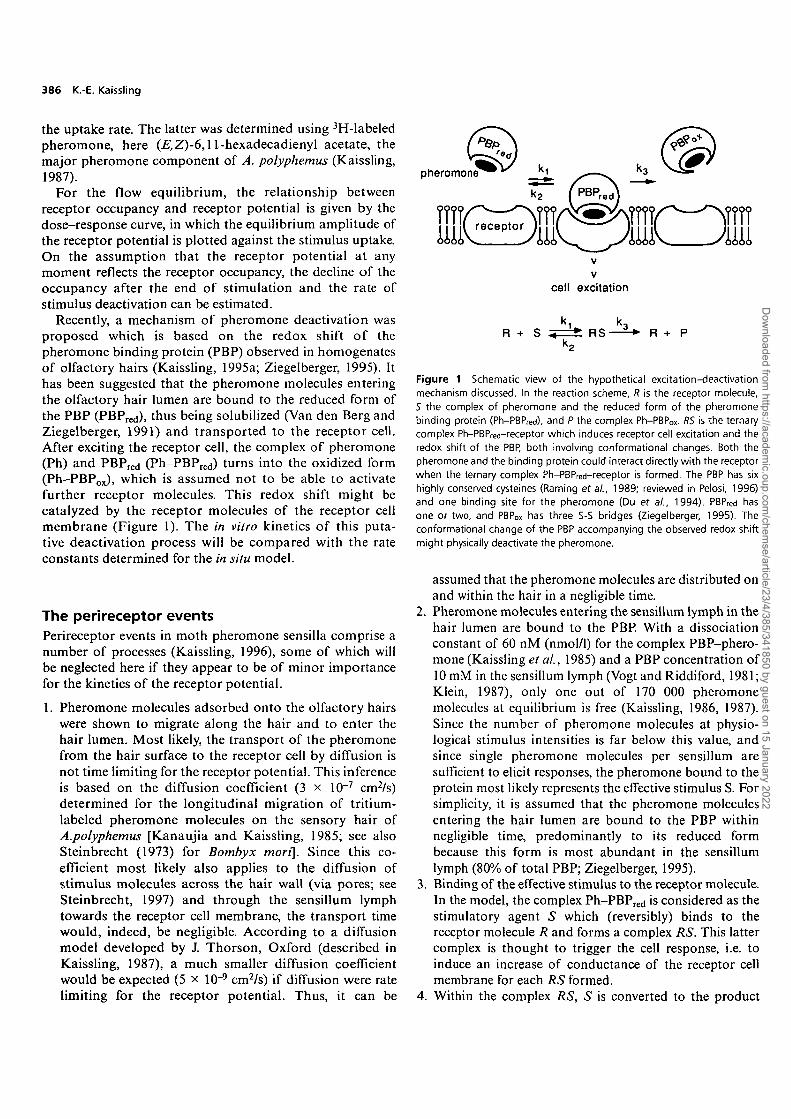
Recently, a mechanism of pheromone deactivation wasproposed which is based on the redox shift of thepheromone binding protein (PBP) observed in homogenatesof olfactory hairs (Kaissling, 1995a; Ziegelberger, 1995). Ithas been suggested that the pheromone molecules enteringthe olfactory hair lumen are bound to the reduced form ofthe PBP (PBPred), thus being solubilized (Van den Berg andZiegelberger, 1991) and transported to the receptor cell.After exciting the receptor cell, the complex of pheromone(Ph) and PBPred (Ph-PBPred) turns into the oxidized form(Ph-PBPOX), which is assumed not to be able to activatefurther receptor molecules. This redox shift might becatalyzed by the receptor molecules of the receptor cellmembrane (Figure 1). The in vitro kinetics of this puta-tive deactivation process will be compared with the rateconstants determined for the in situ model.
The perireceptor eventsPerireceptor events in moth pheromone sensilla comprise anumber of processes (Kaissling, 1996), some of which willbe neglected here if they appear to be of minor importancefor the kinetics of the receptor potential.
1. Pheromone molecules adsorbed onto the olfactory hairswere shown to migrate along the hair and to enter thehair lumen. Most likely, the transport of the pheromonefrom the hair surface to the receptor cell by diffusion isnot time limiting for the receptor potential. This inferenceis based on the diffusion coefficient (3 x 10~7 cm2/s)determined for the longitudinal migration of tritium-labeled pheromone molecules on the sensory hair ofA.polyphemus [Kanaujia and Kaissling, 1985; see alsoSteinbrecht (1973) for Bombyx mori\. Since this co-efficient most likely also applies to the diffusion ofstimulus molecules across the hair wall (via pores; seeSteinbrecht, 1997) and through the sensillum lymphtowards the receptor cell membrane, the transport timewould, indeed, be negligible. According to a diffusionmodel developed by J. Thorson, Oxford (described inKaissling, 1987), a much smaller diffusion coefficientwould be expected (5 x 10~9 cm2/s) if diffusion were ratelimiting for the receptor potential. Thus, it can be
pheromone
cell excitation
R + S R + P
Figure 1 Schematic view of the hypothetical excitation-deactivationmechanism discussed. In the reaction scheme, R is the receptor molecule,S the complex of pheromone and the reduced form of the pheromonebinding protein (Ph-PBPred), and P the complex Ph-PBPOX. RS is the ternarycomplex Ph-PBPred-receptor which induces receptor cell excitation and theredox shift of the PBP, both involving conformational changes. Both thepheromone and the binding protein could interact directly with the receptorwhen the ternary complex Ph-PBPred-receptor is formed. The PBP has sixhighly conserved cysteines (Raming era/., 1989; reviewed in Pelosi, 1996)and one binding site for the pheromone (Du ef a/., 1994). PBPred hasone or two, and PBPox has three S-S bridges (Ziegelberger, 1995). Theconformational change of the PBP accompanying the observed redox shiftmight physically deactivate the pheromone.
assumed that the pheromone molecules are distributed onand within the hair in a negligible time.
2. Pheromone molecules entering the sensillum lymph in thehair lumen are bound to the PBP. With a dissociationconstant of 60 nM (nmol/1) for the complex PBP-phero-mone (Kaissling et ai, 1985) and a PBP concentration of10 mM in the sensillum lymph (Vogt and Riddiford, 1981;Klein, 1987), only one out of 170 000 pheromonemolecules at equilibrium is free (Kaissling, 1986, 1987).Since the number of pheromone molecules at physio-logical stimulus intensities is far below this value, andsince single pheromone molecules per sensillum aresufficient to elicit responses, the pheromone bound to theprotein most likely represents the effective stimulus S. Forsimplicity, it is assumed that the pheromone moleculesentering the hair lumen are bound to the PBP withinnegligible time, predominantly to its reduced formbecause this form is most abundant in the sensillumlymph (80% of total PBP; Ziegelberger, 1995).
3. Binding of the effective stimulus to the receptor molecule.In the model, the complex Ph-PBPred is considered as thestimulatory agent S which (reversibly) binds to thereceptor molecule R and forms a complex RS. This lattercomplex is thought to trigger the cell response, i.e. toinduce an increase of conductance of the receptor cellmembrane for each RS formed.
4. Within the complex RS, S is converted to the product
Dow
nloaded from https://academ
ic.oup.com/chem
se/article/23/4/385/341850 by guest on 15 January 2022
Pheremone Deactivation Catalyzed by Receptor Molecules 387
P, the deactivated stimulus complex Ph-PBP0X, whichdissociates from R.
5. The complex Ph-PBP0X may in turn dissociate, freeingthe pheromone molecule, which may rebind to a PBPred
molecule and stimulate again. This effect could be re-sponsible for the tailing of the receptor potential and,especially, of the nerve impulse response (Figure 5b; seealso Kaissling, 1987, figure 37). Since the fraction of freepheromone molecules is very small compared withpheromone bound to PBP, dissociation and rebinding willbe neglected here.
6. Finally, the free pheromone molecule may be enzym-atically degraded by the sensillar esterase in the sensillumlymph. Although the purified esterase has a very rapidturnover (Vogt et al, 1985), the pheromone degradationin situ takes minutes (Kasang et al, 1988) and willbe neglected here. The discrepancy is resolved if oneassumes that the large proportion of pheromone boundto PBP (both forms) is protected from enzymatic de-gradation. This can be inferred from the study of Vogtand Riddiford (1986; see Kaissling, 1986).
The minor importance of enzymatic degradation for therapid kinetics of the cell response was confirmed experi-mentally. Thus, the decline of the receptor potential withinthe first few seconds was practically unchanged in antennae,which, for unknown reasons, contained PBP but lacked>99% of the sensillar esterase (Maida et al, 1995). Furthersupport was given by experiments with inhibitors of thesensillar esterase which do not inhibit the decline of thereceptor potential (B. Pophof, personal communication).
In conclusion, this paper is restricted to the processesinvolving the receptor molecules (3 and 4). An extendedmodel including all of the processes listed above will bepublished elsewhere.
The model reaction systemThe following reaction system of receptor occupancy andstimulus deactivation is discussed; it includes the adsorptionof stimulus molecules on the olfactory hair (Kaissling,1998).
°ext ~* ° o T / \ v— J\o —> I\. T r
Sext represents the external pheromone concentration. Thefactor a (Is) depends on the velocity of the external mediumrelative to the receptor organ, and on the geometry of theadsorptive structures and their adsorptive properties.
The product a • Sen is equal to the adsorptive stimulusuptake rate U (concentration/s), which is defined here as thenumber of pheromone molecules adsorbed per second by asensory hair, divided by the volume of the hair (2.6 pi). Thenumber of adsorbed molecules per hair and per second hasbeen calculated from measurements using 3H-labeledpheromone molecules (Kanaujia and Kaissling, 1985;
Kaissling, 1987, 1995b, 1996). At least half of the adsorbedmolecules have been shown to enter the sensillum lymphspace (Kanaujia and Kaissling, 1985); its volume is abouthalf of the total hair volume.
5 represents the effective stimulus concentration, i.e. theconcentration of the complex Ph-PBPred. For simplicity, Sand all other reaction partners are assumed to be distributedover the entire volume of the hair. This seems adequate ifdiffusion of the pheromone within the hair is not a rate-limiting factor.
R represents, again for simplicity, a fictive concentrationof (free) receptor molecules, i.e. their number (on the plasmamembrane of the receptor cell dendrite) divided by the hairvolume.
RS is the ternary complex Ph-PBPred-receptor molecule,which induces the receptor cell response. Again, RS isconsidered as a concentration related to the hair volume. Itis assumed that the electrical conductance of the receptorcell membrane increases in proportion to RS (Kaissling,1974, 1977; Kodadova and Kaissling, 1996).
P denotes the deactivated pheromone, i.e. the inactivecomplex Ph-PBP0X.
Note that the sum S + RS + P is equal to the integral ofadsorbed molecules during stimulation. The total number ofreceptors corresponds with
/?,„. = R + RS (1)
The terms k\ [/(s uM)], ki (Is) and £3 (/s) are rate constantsof association, dissociation and deactivation, respectively, asin the reaction scheme of a simple enzymatic process(Figure 1), with
(2)
At a constant rate of stimulus uptake U, and if U < C/sat, theconcentrations of S and RS approach constant values (flowequilibrium, Figure 2).
Determination of model parameters: /?tot and k$For a flux detector, the product ky • Rtol can be determinedfrom the dose-response relationship for receptor occupancy(Kaissling, 1998). For the equilibrium and with RS < Rtot,the rate of stimulus deactivation £3 • RS equals the stimulusuptake rate U
RS= U (3)
Considering the relative receptor occupancy, this relation-ship can be written as
RS/Rl0X = U/(k3 • Rlot) (4)
According to this equation, the receptor occupancy
Dow
nloaded from https://academ
ic.oup.com/chem
se/article/23/4/385/341850 by guest on 15 January 2022
Figure 2 Time course of concentrations generated by a computer model (developed by J. Thorson, Oxford) of the reaction scheme discussed, (a)Concentrations of S, RS, P and their sum, which is equal to the total concentration of adsorbed stimulus molecules, (b) Concentrations of S and RS, same asin (a), but expanded ordinate scale. Constant rate of stimulus uptake U between 0 and 5 s. The following parameters were used: U = 1 uM/s, fftot = 10 |aM,Km = 100 u.M, <C3 = 10/s, k2 = 10/s, k-\ = 0.2/QiM • s) (see Figure 7, parameter set 1a). The model produced a half-time of 0.79 s for the decline of RSfollowing stimulation, a value within the lower range of values derived from experimental data (0.5-2 s; Figures 4 and 5).
RS/Rtot increases linearly until the rate of uptake equals themaximum velocity of deactivation /c3 • Rm. The 'just-saturating' uptake rate is
£/sa, = k-i • R, (5)
At uptake rates above U^, the receptor occupancy ismaximal, but no equilibrium concentration of S can beobtained.
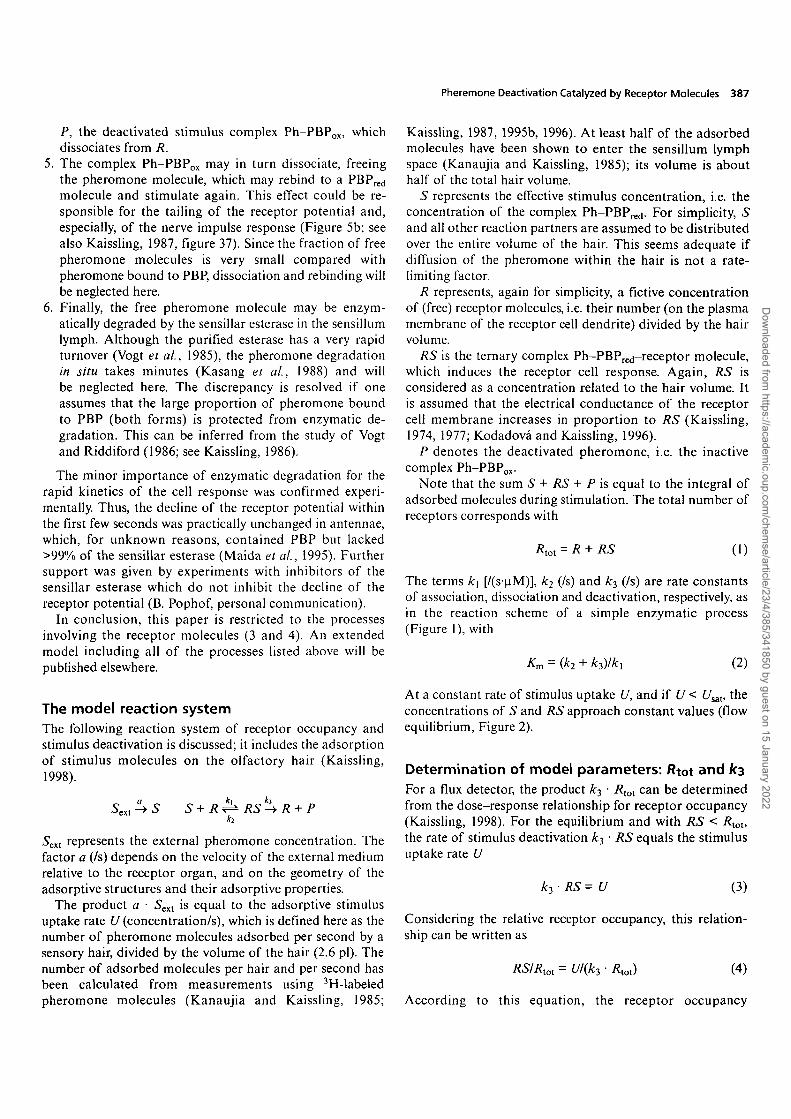
A minimum value of C/sat may be determined assumingthat the receptors cannot be fully occupied before thereceptor potential saturates. According to this considera-tion, the curve of receptor occupancy versus stimulusuptake rate is placed with C/sat just above the stimulus uptakefor the highest receptor potential amplitude (Figure 3).The uptake was calibrated using 3H-labeled (E,Z)-6,ll-hexadecadienyl acetate (Kaissling, 1987, 1995). For theaveraged dose-response curve of the receptor potentialamplitudes measured in A.polyphemus (Zack, 1979), £7,̂
must be >40 uM/s, the highest uptake rate tested in theelectrophysiological experiment. The dose-response curveof the receptor potential has a slope covering many decadesof stimulus uptake and does not reach full saturation at thehighest stimulus intensities applied. Therefore, for all furthercalculations, the just-saturating uptake rate C/sat is setsomewhat higher, to 100 uM/s, which means that theminimum value of A:3 • i?tot = 100 uM/s (equation 5).
For RXoU one can calculate a maximum value based onthe assumption that the receptor molecules are about astightly packed in the dendritic receptor cell membrane asthe rhodopsin molecules in the disk membrane of visualcells (Dratz and Hargrave, 1983). With a maximum estimateof 40 000 units/um2 and an area of the outer segmentof receptor cell dendrite of 426 um2 (Keil, 1984; foridentification of the cell, see Kumar and Keil, 1996), weobtain 1.7 x 10⁷ receptor molecules/dendrite; this reveals afictive concentration of i?tot = 10.9 uM in the hair volume of2.6 pi. In the following, Rtot is rounded to 10 uM. With this
Dow
nloaded from https://academ
ic.oup.com/chem
se/article/23/4/385/341850 by guest on 15 January 2022
Pheremone Deactivation Catalyzed by Receptor Molecules 389
Antheraea polyphemus
30
25-
> 20'
J151Q_E 10eg
5
o-
receptor potential
mV
- 10
co
3crCD
- 5 -4
one RS complex/cell
-3 - 2 - 1 0
log (U -s/jiM)
1 2
tUsat
Figure 3 Dose-response relationships of receptor potential and receptor occupancy. The abscissa gives the log stimulus uptake U of 3H-labeled(£,Z)-6,11-hexadecadienyl acetate by the sensilla trichodea (molecules adsorbed per second and per total hair volume, given in u.M/s) (Kaissling era/., 1987).Dots: receptor potential amplitudes (mV ± SD, left ordinate) measured after 2 s of stimulation and averaged from 1 5 hair sensilla (Zack, 1979). Triangles:theoretical equilibrium concentrations of the stimulus-receptor complex RS (in |jM, right ordinate), which are linearly related to U (equation 3). This curvewas placed such that the just-saturating stimulus uptake rate (Aat (arrow, right hand) was above the highest rate used for measuring the receptor potential.The maximum value of RS (/?tot = 10 nM) corresponds to a maximum number of 1.7 x 10⁷ receptor molecules/receptor cell (see Figure 7). The theoreticalequilibrium value of one RS complex per cell would be reached at an uptake rate = I W 0 . 7 x 1 0 7 ) , indicated by the left-hand arrow. This rate of uptakecorresponds to an adsorption rate of 10 molecules/(hair • s).
figure and according to equation (5), the rate constant ofthe stimulus deactivation would be A:3 = Usal/Rlol - 100uM/(s- 10u.M) = 10/s.
Determination of model parameters: Km
Considering the model of pheromone-receptor interactionas a simple enzymatic system, its Km = (k2 + k$lk\ can bedetermined from C/sat = k3 • RtoX (equation 6) and from kRS,the rate constant of the decline of RS after the end ofstimulus exposure, i.e. when Sex, is set to zero (Figure 2).After weak stimuli with S « Km and given 7?tot << Km, theconcentration RS declines as an exponential process with anapproximate rate constant kR$ (from Kaissling, 1998)
kRS = -dRSI(dt Rxol/Kn (6)
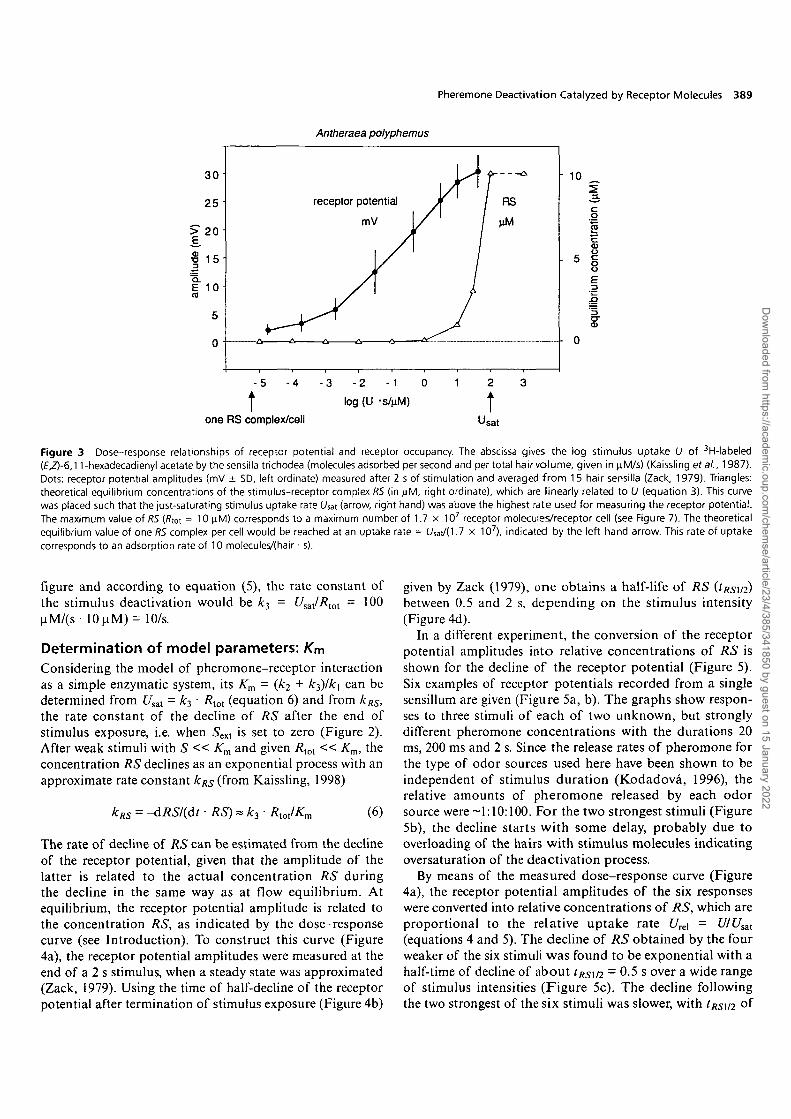
The rate of decline of RS can be estimated from the declineof the receptor potential, given that the amplitude of thelatter is related to the actual concentration RS duringthe decline in the same way as at flow equilibrium. Atequilibrium, the receptor potential amplitude is related tothe concentration RS, as indicated by the dose-responsecurve (see Introduction). To construct this curve (Figure4a), the receptor potential amplitudes were measured at theend of a 2 s stimulus, when a steady state was approximated(Zack, 1979). Using the time of half-decline of the receptorpotential after termination of stimulus exposure (Figure 4b)
given by Zack (1979), one obtains a half-life of RS (tRSil2)between 0.5 and 2 s, depending on the stimulus intensity(Figure 4d).
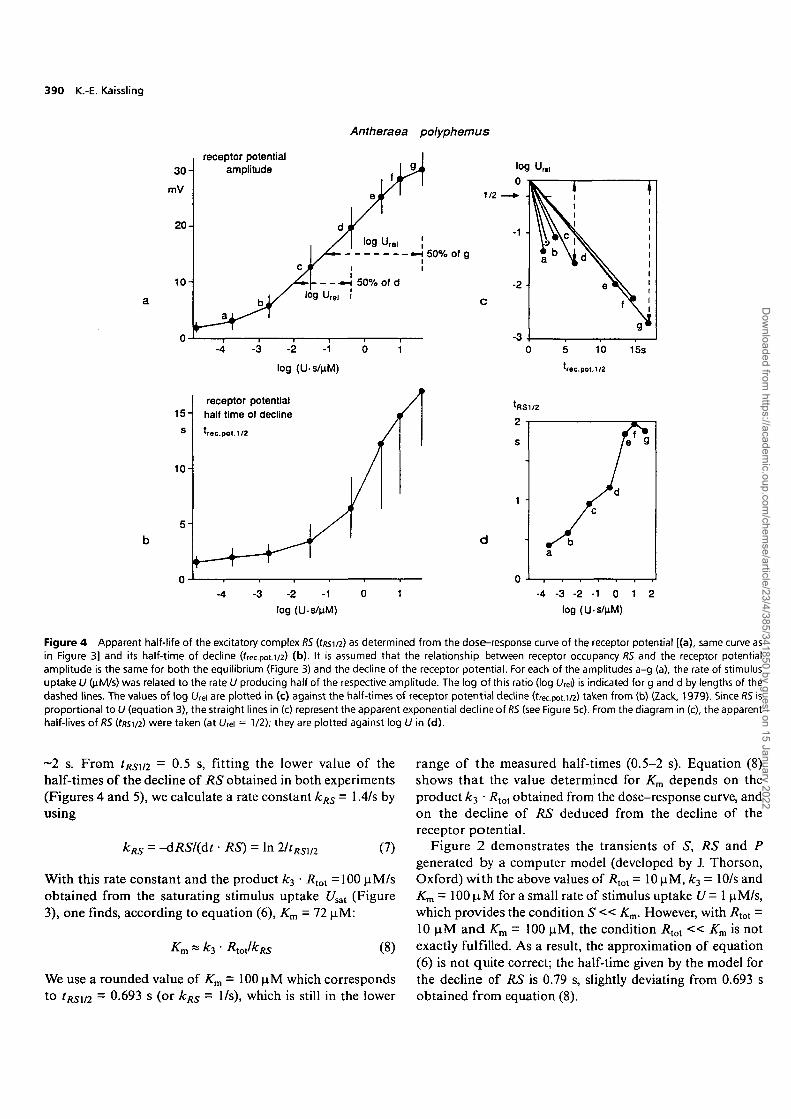
In a different experiment, the conversion of the receptorpotential amplitudes into relative concentrations of RS isshown for the decline of the receptor potential (Figure 5).Six examples of receptor potentials recorded from a singlesensillum are given (Figure 5a, b). The graphs show respon-ses to three stimuli of each of two unknown, but stronglydifferent pheromone concentrations with the durations 20ms, 200 ms and 2 s. Since the release rates of pheromone forthe type of odor sources used here have been shown to beindependent of stimulus duration (Kodadova, 1996), therelative amounts of pheromone released by each odorsource were ~1:10:100. For the two strongest stimuli (Figure5b), the decline starts with some delay, probably due tooverloading of the hairs with stimulus molecules indicatingoversaturation of the deactivation process.
By means of the measured dose-response curve (Figure4a), the receptor potential amplitudes of the six responseswere converted into relative concentrations of RS, which areproportional to the relative uptake rate UTei = t//t/sat
(equations 4 and 5). The decline of RS obtained by the fourweaker of the six stimuli was found to be exponential with ahalf-time of decline of about ^51/2 = 0.5 s over a wide rangeof stimulus intensities (Figure 5c). The decline followingthe two strongest of the six stimuli was slower, with tRS\n of
Dow
nloaded from https://academ
ic.oup.com/chem
se/article/23/4/385/341850 by guest on 15 January 2022
390 K.-E. Kaissling
Antheraea polyphemus
30-
mV
20-
10-
15-
10-
5-
receptor potentialamplitude
1/2
log ure l |50% of g
—i 50% of d'ogUr B l !
-4 -3 - 2 - 1 0 1
log (U-s/nM)
receptor potentialhalf time of decline
troc.pot.i/2
-3 -2 -1log (U-s/nM)
-30 5 10 15s
vec.pot.i/2
-4 - 3 - 2 - 1 0 1 2log (U-s/nM)
Figure 4 Apparent half-life of the excitatory complex RS (f/?si/2) as determined from the dose-response curve of the receptor potential [(a), same curve asin Figure 3] and its half-time of decline (frec.pot.1/2) (b). It is assumed that the relationship between receptor occupancy RS and the receptor potentialamplitude is the same for both the equilibrium (Figure 3) and the decline of the receptor potential. For each of the amplitudes a-g (a), the rate of stimulusuptake U (nlvi/s) was related to the rate U producing half of the respective amplitude. The log of this ratio (log U,e\) is indicated for g and d by lengths of thedashed lines. The values of log U,e\ are plotted in (c) against the half-times of receptor potential decline (frec.pou/2) taken from (b) (Zack, 1979). Since RS isproportional to U (equation 3), the straight lines in (c) represent the apparent exponential declineof RS (see Figure 5c). From the diagram in (c), the apparenthalf-lives of RS (fssi/2) were taken (at lAei = 1/2); they are plotted against log U in (d).
~2 s. From tRSm = 0.5 s, fitting the lower value of thehalf-times of the decline of RS obtained in both experiments(Figures 4 and 5), we calculate a rate constant kRS = 1.4/s byusing
kRS = -dRSI(dt • RS) = In 2/tRSm (7)
With this rate constant and the product A:3 • Rtol =100 uM/sobtained from the saturating stimulus uptake Usal (Figure3), one finds, according to equation (6), Km - 72 \iM:
~ ^3 (8)
We use a rounded value of Km = 100 uM which correspondsto tRSl/2 - 0.693 s (or kRS = 1/s), which is still in the lower
range of the measured half-times (0.5-2 s). Equation (8)shows that the value determined for Km depends on theproduct ky • /?tot obtained from the dose-response curve, andon the decline of RS deduced from the decline of thereceptor potential.
Figure 2 demonstrates the transients of S, RS and Pgenerated by a computer model (developed by J. Thorson,Oxford) with the above values of Rtot - 10 uM, k3 - 10/s andKm = 100 |aM for a small rate of stimulus uptake U - 1 uM/s,which provides the condition S « Km. However, with Rtot =10 JJM and Km = 100 uM, the condition Rtot « Km is notexactly fulfilled. As a result, the approximation of equation(6) is not quite correct; the half-time given by the model forthe decline of RS is 0.79 s, slightly deviating from 0.693 sobtained from equation (8).
Dow
nloaded from https://academ
ic.oup.com/chem
se/article/23/4/385/341850 by guest on 15 January 2022
Pheremone Deactivation Catalyzed by Receptor Molecules 391
Antheraea polyphemus, single hair
0 5 10s
100
10mV
_= 20 ms - 2 s stimuli, low intensityof E,Z-6,11-hexadecadienyl acetate
15s
_= 20 ms - 2 s stimuli, high intensity
- 7 J r15s
Figure 5 Decline of U,e\ (here = U/Umax) as determined from the declineof six receptor potentials (c). The receptor potentials (a, b) were producedwith a medium stimulus intensity (a) and a very strong stimulus intensity (b),with stimulus durations of 20 ms, 200 ms and 2 s. The two strongest of thesix responses show an initial plateau suggesting oversaturation (possibly dueto U > <;3 • R tot)- Time zero is the end of stimulation for all recordings, sametime scale for (a-c). The receptor potential amplitudes were converted intovalues of Urei using the (averaged) dose-response curve shown in Figure 3.Umax corresponds to the uptake for the highest response amplitude of thedose-response curve. Crei declines with an exponential time course (withtRStn of -0.5 s) for the four weaker of the six responses (c). According toequation (3), RS is proportional to U and consequently also declinesexponentially (tssi/2 of —0.5 s). The slower decline observed in the twostrongest of the six responses (f/?si/2 of —2 s) is not expected from thepresent model of stimulus deactivation.
50 100 150 200
durations of ERPs
250 ms
Figure 6 Frequency of occurrence (ordinate) of durations (abscissa) of n =384 elementary receptor potentials (ERPs) produced by a bombykal receptorcell of Bombyx mori upon weak stimulation by bombykal (single-sensillumrecording). Examples of ERPs (most of them followed by one or a fewnerve impulses) and calibration are given. ERPs of relatively long durationfluctuate in amplitude. The distribution of ERP durations was fitted (by A.Redkozubov, Cernogolovka) to the sum of two exponentials with TI = 18.7ms (92%) and x2 = 158 ms (8%).
Determination of model parameters: fa and k-[Further experimental data have been used in order toestimate the rate constants k2 and k\. Tentatively, it isassumed that the lifetime t of the RS complex
T = \l(k2 + k3) (9)
is reflected in the duration of the elementary receptorpotentials (ERP). These transient potential changes can beelicited by a single pheromone molecule (see Kaissling andThorson, 1980; Kaissling, 1994) and might be generated byan activation of a single receptor molecule. The durations of~90% of these events follow a single exponential distri-bution, shown here for ERPs recorded from a pheromonereceptor cell of the male silkmoth B.mori (Figure 6).
The ERPs were measured during stimulation with a lowconcentration of pheromone (bombykal), chosen such thatthe mean ERP duration was - 1 % of the mean intervals ofquiet baseline between ERPs. The ERPs of longer durationusually appear as bursts of irregular fluctuations (Figure 6,insets). Their duration was taken as the time interval fromthe beginning to the end of the burst. The distributionshown in Figure 6 is consistent with the sum of twoexponentials. The shorter time constant determined for mostof the events was x = 20 ms. For our consideration of thereaction scheme for A.polyphemus, we use a preliminaryvalue of T = 50 ms (K.-E. Kaissling, unpublished measure-ments). With k3 = 10/s, we obtain k2 = 10/s [equation (9)].
Dow
nloaded from https://academ
ic.oup.com/chem
se/article/23/4/385/341850 by guest on 15 January 2022
392 K.-E. Kaissling
Using equation (2), one can now calculate kx - 0.2/(s • uM)(Figure 7, parameter set la). The values of kx and k2
calculated for x = 20 ms and x = 90 ms are given in Figure 7,sets lb and lc, respectively.
Discussion
Diffusion does not control the stimulus-receptor
association
The value of kx indicates whether the stimulus-receptorassociation is controlled by diffusion or by other processes.The values of kx expected for a diffusion-controlled processcan be estimated using the equation given by vonSmoluchowsky (1916; see Adam et ai, 1988):
k, k3
R + S « »• FtS *• R + Pk2
km = L4nrAB(DA + DB) (10)
L is the Loschmidt number (6.023 x 10²³ molecules/mol),rAB is the reaction distance (0.5 nm), and DA + DB are thediffusion coefficients of the reaction partners. As a diffusioncoefficient of the pheromone, we use 3 x 10~7 cm2/s, thevalue determined for the longitudinal transport along thesensillum (Kanaujia and Kaissling, 1985). With respect tothe size of the PBP (15 kDa), this value is compatible withdiffusion of the complex Ph-PBP in the sensillum lymph(Adam et al, 1988). The diffusion coefficient of the secondpartner, the receptor molecules at the cell membrane, isthought to be much smaller and, thus, neglected. Usingthese numbers, one obtains a theoretical value of kx of~200/(s • uM) for a diffusion-controlled formation of RS.
The values of kx determined here are far below those for adiffusion-controlled process. For a given Km, the value of kx
depends on x. For the x values between 20 and 90 ms, thecorresponding values of k\ are between 0.5/(s • uM) and0.1/(s • u.M) (Figure 7, parameter sets lb and lc). Thesevalues of kx are much smaller than k&K, which suggests thatslower processes than diffusion are rate limiting for theinteraction of S and R. Whether the binding of the complexPh-PBPred to the receptor is the time-consuming process orwhether other so far neglected processes are limiting, forinstance the binding of the pheromone to the PBP, needsfurther analysis.
The significance of the rate constants for the cell response
Interestingly, in the present model of a flux detector, at flowequilibrium, the rate constants kx and k2 have no influenceon the receptor occupancy (and consequently on theresponse amplitude) which depends on k3 and RS only[equation (3)]. Furthermore, according to equation (6), validfor S « Km and .Rtot « Km, the rate constants k2 and k3 donot influence kRS if k3 » k2. In this case, kRS, governing thedecline of the receptor potential, depends on the productk\ • Rtot only. However, if k3 « k2, we find
parameter
Usat
^tot
k3
kRS
Km
T
k2
ki
Kd
set 1a
100
10
10
1
100
50.
10
0.2
50
1b
20
40
0.5
80
1c
91
1
0.11
9
2
5
20
100
48
1
0.21
4.8
uM/s
\iM
/S
/ S
jiM
ms
/s
/(S -uM)
kRS = kx • Rtol • k3/k2 (H)
Figure 7 Sets of model parameters obtained from the dose-responsecurve of the receptor potential (Usat = k3 • R tot), from its decline(I<RS = ^3 • /?tot/Km) and from the duration of elementary receptor potentials[x = 1/(/f2 + ^3)] (underlined values derived from electrophysiologicalmeasurements). The value of /?tot = 10 uM (parameter sets 1a-c)corresponds to a maximum density of receptor molecules similar to the thatof rhodopsin in the disk membrane (40 000 units/nm2), a dendriticmembrane area of 426 (irn2 and a hair volume of 2.6 pi. The maximumnumber of receptor molecules per cell is 40 000 x 426 = 1.7 x 10⁷.Parameter sets 1a-c demonstrate the dependence of ki, kiandKa (= faAi)on the value of x, when Rtot, £3 and Km are unchanged. Parameter set 2 hasa smaller/?tot compared with set 1a, but fits the data (Usat, kits and T) as well.
which means that, in this case, all three of the rate constantsinfluence the receptor potential decline (Kaissling, 1998).
The latter condition applies for parameter set lb only(Figure 7). In the other cases, we have k-s, - k2 (set la) or k3 >k2 (sets lc, 2) which means that changes in the decline timemust be due to changes in kx. Pheromone derivatives pro-duce smaller receptor potentials than the pheromone, withcharacteristic compound-specific decline times (Kaissling,1977, 1998). As observed within several species of moths,these decline times are mostly shorter than those of thepheromone responses, possibly due to higher kx or, inthe case k3 « k2, also due to higher k3 or smaller k2
(equation 11). However, definite conclusions about the rateconstants of interactions with pheromone derivativescannot yet be drawn.
The total number of receptor molecules
Since Rlol is derived from a maximum assumption, analternative set of parameters (Figure 7, parameter set 2)with the same Km but a 2-fold smaller Rioi is given. In orderto keep the maximum deactivation rate k3 • Rlot equal to 100uM/s, the value of k3 had to be doubled. Correspondingly,the value of k2 was decreased in order to keep the lifetime ofthe complex RS near to 50 ms. Both sets of parameters (laand 2) fit the data obtained from dose dependence of the
Dow
nloaded from https://academ
ic.oup.com/chem
se/article/23/4/385/341850 by guest on 15 January 2022
Pheremone Deactivation Catalyzed by Receptor Molecules 393
receptor potential, its decline and the duration of ERPs.However, if Rlol were >2-fold smaller, &3 would have to beincreased even further, in order to keep k-$ • Rlol = 100 (iM/s.This means that the lifetime 1/T of the ternary complexPh-PBP-receptor (RS) would become shorter than theduration of the elementary receptor potentials.
Threshold considerations
The model parameters proposed (Figure 7, set la) are basedon Usat, on the decline of the receptor potential, on theduration of ERPs and on a maximum density of receptormolecules. It can be asked whether this model shows reason-able responses for stimulus intensities near threshold. At anuptake rate of 10 pheromone molecules per second and percell (Figure 3, arrow, left-hand side) the model produces an(average) equilibrium occupancy of one RS complex perreceptor cell (as can be deduced using equation 3). Thecomplexes (with a lifetime of 50 ms) are formed at a rate of~20 times per second and per cell. The above uptake rate isobtained at a stimulus intensity ~3-fold below the lowestintensity used in the electrophysiological recordings (Figure3); according to extrapolation of the data of Zack (1979), itelicits ~10 nerve impulses per second and per cell. At thislow impulse frequency each nerve impulse is preceded byan ERP, the first response of the receptor cell to a singlepheromone molecule (Kaissling, 1994), which means that
~10 ERPs are formed per second and per cell. Thus, theERPs compared with the RS complexes of the model areformed at a somewhat slower rate. In conclusion, satis-factory agreement between model and data is obtained; themodel covers the entire working range of the receptor cellwith respect to stimulus intensities. For a more appropriateanalysis of the threshold situation the stochastic nature ofweak stimuli needs to be considered.
Dissociation constants of pheromone-PBP binding and ofstimulus-receptor interaction
It seems noteworthy that the binding affinity of pheromoneand PBP is much higher (dissociation constant = 60 nM,Kaissling et al., 1985; = 640 nM, Du and Prestwich, 1995)than the proposed affinity of the stimulus (Ph—PBP) and thereceptor (A^ = 50 (iM; Figure 7, data set la). This showsthat high sensitivity of a chemoreceptor organ to singlepheromone molecules does not necessarily involve highbinding affinity between stimulus and receptor molecules. Asimilar situation applies for the reception of maltose inEscherichia coli. The maltose-binding protein (MBP) occursin a high concentration (1 mM) in the periplasmic space;maltose is bound to the MBP with a Kd of 3 (iM; thecomplex of MBP and maltose is bound to the receptor atthe cell membrane less strongly, with a Kd of 250(Manson et al., 1985; Bohl et al., 1995).
Antheraea polyphemus
% ox/(red + ox)60
cpm (red + ox)
60000
50000 -
40000 -
0 10 20 30 40 50 60 70min
0 10 20 30 40 50 60 70min
isolated hairs-o -
purilied PBP
Figure 8 (a) Redox shift of pheromone-binding protein (PBP) in vitro followed by binding of 3H-labeled (£,Z)-6,11-hexadecadienyl acetate to the oxidized(ox) and reduced (red) form of the PBP. The percentage of oxidized PBP increases with incubation time in isolated hair homogenates (filled symbols), but doesnot increase with purified PBP in buffer solution (open symbols), (b) The total amount of [3H]pheromone bound to PBP increased with incubation time, dueto a gradual release of the pheromone from the glass wall (from Ziegelberger, 1995). Large circles in (a) and (b) show the averaged transients used in thecomputer simulation.
Dow
nloaded from https://academ
ic.oup.com/chem
se/article/23/4/385/341850 by guest on 15 January 2022
394 K.-E. Kaissling
Deactivation in situ and redox shift in vitro
We now consider whether the redox shift of the PBPobserved in vitro (Ziegelberger, 1995) can serve as a de-activation mechanism although its velocity measured in thehair homogenate is much lower than that estimated from thereceptor potential decline (Figure 8a). Since our reactionscheme represents an enzymatic process, an ~200-fold lowervelocity is expected in vitro because the enzyme (= receptor)concentration in the homogenate is lower than in the hair bythis factor. This extrapolation is possible if Rxot « Km,under which condition the rate of the enzymatic degrada-tion (kRs) depends on the concentration of the enzyme(Kaissling, 1998). This condition is approximately fulfilledin situ, and even more so in vitro due to the high dilu-tion factor. For the computer modeling of the in vitroexperiment, it has also been taken into account that thepheromone concentration in the homogenate increasedduring incubation due to the gradual release of the phero-mone from the glass wall (Figure 8b).
However, if the dilution factor of 200 is taken intoaccount, the redox shift of the PBP observed in vitroproceeds more slowly than estimated from the modelparameters. To simulate the redox shift in vitro, the enzymeconcentration has to be lowered to 0.0038 u.M, which is 7.6%of the value expected from the 200-fold dilution. Possibly, inthe homogenate >90% of the receptor molecules had losttheir catalytic ability.
Final remarksCertainly, the model parameters have to be consideredas preliminary. They might, for instance, change afterincluding in the model other extracellular processes such asdiffusional transport of the pheromone, its binding to thePBP and its enzymatic degradation. Furthermore, theparameters determined so far depend on the assumptionthat the relationship between receptor occupancy andamplitude of the receptor potential is the same duringequilibrium and transients of the receptor potential. Thisfirst approach allowed hypotheses to be suggested aboutthe number of receptor molecules, their possible catalyticfunction, the strength of binding to the receptor and therelationship between the duration of the elementaryreceptor potentials and the lifetime of the stimulus-receptorcomplex.
Although the model of stimulus deactivation discussedhere is compatible with morphological, electrophysiological,radiometric and biochemical data, alternative models mightbe found. One alternative model could employ a separateenzyme to catalyze deactivation (Kaissling, 1998). However,the advantage of a mechanism in which receptor moleculesserve as deactivating enzymes would be its one-waycharacter: the pheromone molecules are not deactivatedbefore they interact with a receptor molecule. This wouldguarantee maximum sensitivity of the receptor cells on
the moth antennae, which obviously are designed foroptimal molecule capture in view of their construction andenormous size (Kanaujia and Kaissling, 1985; Kaissling,1987).
Many chemoreceptor organs which adsorb and do notdesorb stimulus molecules during stimulus exposure (fluxdetectors; see Kaissling, 1998) might have a mechanism forrapid stimulus deactivation or removal. One of these organsmay well be the vertebrate nose. Odor-degrading or odor-modifying enzymes have been found in the olfactory mucus(for references, see Pelosi, 1996), but it remains to be shownwhether they deactivate the odor molecules rapidly enoughor whether other processes serve this function. Whetherodorant binding proteins (containing two cysteines only) areinvolved in stimulus deactivation in vertebrates is anotherchallenging question.
AcknowledgementsI thank J. Thorson and A. Biederman-Thorson, Oxford, forprogramming a computer model of the reaction system, forhelpful discussions and for linguistic help. I am very grate-ful to A. Redkozubov, Chernogolovka, Russia, for help indata evaluation and to A. Minor, Moscow, J.P. Rospars,Versailles, G. Stange, Canberra, A. Vermeulen, Versailles, B.Pophof, R.A. Steinbrecht, G. Ziegelberger and J. Ziesmann,Seewiesen, for valuable suggestions and comments onthe manuscript. For technical help, I thank A. Giinzel,U. Lauterfeld and C. Schmid.
References
Adam, G., Lauger, P. and Stark, G. (1988) Physikalische Chemie undBiophysik. 2. Aufl. Springer Verlag, Berlin, p. 399.
Bohl, E., Shuman, H.A. and Boos, W. (1995) Mathematical treatment ofthe kinetics of binding protein dependent transport systems reveals thatboth the substrate loaded and unloaded binding proteins interact withthe membrane components. J. Theor. Biol., 172, 83-94.
Breer, H., Raming, K. and Krieger, J. (1994) Signal recognition andtransduction in olfactory neurons. Biochim. Biophys. Acta: Mol. Cell Res.,1224,277-287.
Dratz, E.A. and Hargrave, P.A. (1993) The stoicture of rhodopsin and therod outer segment disk membrane. Trends Biochem. Sci., 8, 128.
Du, G.H. and Prestwich, G.D. (1995) Protein structure encodes the ligandbinding specificity in pheromone binding proteins. Biochemistry, 34,8726-8732.
Du, G.H., Ng, Ch.-Sh. and Prestwich, G.D. (1994) Odorant binding by apheromone binding protein: active site mapping by photoaffinitylabeling. Biochemistry, 33, 4812-4819.
Gnatzy, W., Mohren, W. and Steinbrecht, R.A. (1984) Pheromonereceptors in Bombyx mori and Antheraea pernyi. //. Morphometricanalysis. Cell Tissue Res., 235, 35-42.
Kaissling, K.E. (1972) Kinetic studies of transduction in olfactory receptorsof Bombyx mori. In Schneider, D. (ed.), International Symposium onOlfaction and Taste IV. Wiss. Verlagsgesellschaft, Stuttgart, pp. 207-213.
Kaissling, K.E. (1974) Sensory transduction in insect olfactory receptors. In
Dow
nloaded from https://academ
ic.oup.com/chem
se/article/23/4/385/341850 by guest on 15 January 2022
Pheremone Deactivation Catalyzed by Receptor Molecules 395
Jaenicke, L. (ed.), Biochemistry of Sensory Functions. 25. MosbacherColl.Ges. Biolog. Chemie, Springer Verlag, Berlin, pp. 243-273.
Kaissling, K.E. (1977) Structures of odour molecules and multiple activitiesof receptor cells. In Le Magnen J. and MacLeod P. (eds), InternationalSymposium on Olfaction and Taste VI. Information Retrieval, London,pp. 9-16.
Kaissling, K.E. (1987) R.H. Wright Lectures on Insect Olfaction. Colbow, K.(ed.), Simon Fraser University, Burnaby, B.C., Canada, pp. 1-190.
Kaissling, K.E. (1994) Elementary receptor potentials of insect olfactorycells. In Kurihara K., Suzuki N. and Ogawa H. (eds), XI InternationalSymposium on Olfaction and Taste. Springer Verlag, Tokyo, pp.812-815.
Kaissling, K.E. (1995a) Receptor mediated change of pheromone bindingprotein in Antheraea polyphemus. ECRO XI. Chem. Senses, 20, 110.
Kaissling, K.-E. (1995b) Single unit and electroantennogram recordingsin insect olfactory organs. In Spielman, A.I. and Brand, J.G. (eds),Experimental Cell Biology of Taste and Olfaction: Current Techniques andProtocols. CRC Press, Boca Raton, FL, pp. 361-386.
Kaissling, K.E. (1998) Flux detectors versus concentration detectors: twotypes of chemoreceptors. Chem. Senses, 23, 99-111.
Kaissling, K.E. and Thorson, J. (1980) Insect olfactory sensilla: structural,chemical and electrical aspects of the functional organisation. InSattelle, D.B., Hall, LM. and Hildebrand, J.G. (eds), Receptors forNeurotransmitters, Hormones and Pheromones in Insects. Elsevier/North-Holland Biomedical Press, Amsterdam, pp. 261-282.
Kaissling, K.E., Klein, U., de Kramer, J.J., Keil, T.A., Kanaujia, S. andHemberger J. (1985) Insect olfactory cells: electrophysiological andbiochemical studies. In Changeux, J.P. and Hucho, F. (eds), MolecularBasis of Nerve Activity. Proceedings of the International Symposium inMemory of D. Nachmansohn (Oct. 1984), Berlin, New York, pp.173-183.
Kanaujia, S. and Kaissling, K.E. (1985) Interactions of pheromone withmoth antennae: adsorption, desorption and transport, J. Insect Physiol.,31,71-81.
Kasang, G. (1971) Bombykol reception and metabolism on the antennaeof the silkmoth Bombyx mori. In Ohloff, G. and Thomas, A.F. (eds),Gustation and Olfaction. Academic Press, London, pp. 245-250.
Kasang, G., von Proff, L. and Nicholls, M. (1988) Enzymatic conversionand degradation of sex pheromones in antennae of the male silkwormmoth Antheraea polyphemus. Z. Naturforsch., 43c, 275-284.
Keil, T.A. (1984) Reconstruction and morphometry of silkmoth olfactoryhairs: a comparative study of sensilla trichodea on the antennae of maleAntheraea polyphemus and Antheraea pernyi (Insecta, Lepidoptera).Zoomorphology, 104, 147-156.
Klein, U. (1987) Sensillum-lymph proteins from antennal olfactory hairs ofthe moth Antheraea polyphemus (Saturniidae). J. Insect Biochem., 17,1193-1204.
Kodadova, B. (1996) Resolution of pheromone pulses in receptor cells ofAntheraea polyphemus at different temperatures. J. Comp. Physiol. A,179, 301-310.
Kumar, G. and Keil, T.A. (1996) Pheromone stimulation induces cyto-skeletal changes in olfactory dendrites of male silkmoths (Lepidoptera,Saturniidae, Bombycidae). Naturwissenschaften, 83, 476-478.
Maida, R., Ziegelberger, G. and Kaissling, K.E. (1995) Esterase activityin the olfactory sensilla of the silkmoth Antheraea polyphemus.NeuroReport, 6, 822-824.
Manson, M.D., Boos, W., Bassford, P.J., Jrand Rasmussen, B.A. (1985)Dependence of maltose transport and chemotaxis on the amount ofmaltose-binding protein. J. Biol. Chem., 260, 9727-9733.
Meng, L.Z., Wu, C.H., Wicklein, M. and Kaissling, K.E. (1989) Numberand sensitivity of three types of pheromone receptor cells in Antheraeapernyi and A. polyphemus. J. Comp. Physiol. A, 165, 139-146.
Pelosi, P. (1996) Perireceptor events in olfaction. J. Neurobiol., 30, 3-19.
Raming, K., Krieger, J. and Breer, H. (1989) Molecular cloning of aninsectpheromone-binding protein. FEBS Lett., 356, 215-218.
Steinbrecht, R.A. (1992) Stimulus transport and inactivation in insectolfactory sensilla-functional morphology, tracer experiments, andimmunocytochemistry. In Singh, R.N. (ed.), Neurobiology: Principles ofDesign and Function. Wiley Eastern, New Dehli, pp. 417-436.
Steinbrecht, R.A. (1997) Pore structures in insect olfactory sensilla: areview of data and concepts. J. Insect Morphol. Embryol., 26, 229-245.
Van den Berg, M.J. and Ziegelberger, G. (1991) On the function of thepheromone binding protein in the olfactory hairs of Antheraeapolyphemus. J. Insect Physiol., 37, 79-85.
Vogt, R.G., Riddiford, L.M. and Prestwich, G.D. (1985) Kineticproperties of a pheromone degrading enzyme: the sensillar esterase ofAntheraea polyphemus. Proc. Natl Acad. Sci. USA, 82, 8827-8831.
Vogt, R.G. and Riddiford, L.M. (1981) Pheromone binding andinactivation by moth antennae. Nature, 293, 161-163.
Vogt, R.G. and Riddiford, L.M. (1986) Pheromone reception: a kineticequilibrium. In Payne, T.L., Birch, M.C. and Kennedy, C.E.J. (eds), Mech-anisms in Insect Olfaction. Clarendon Press, Oxford, pp. 201-208.
Zack, C. (1979) Sensory adaptation in the sex pheromone receptor cells ofsaturniid moths. Diss. Fak. Biol. LMU Munchen, pp. 1-99.
Ziegelberger, G. (1995) Redox-shift of the pheromone-binding protein inthe silkmoth Antheraea polyphemus. Eur. J. Biochem., 232, 706-711.
Accepted on March 17, 1998
Dow
nloaded from https://academ
ic.oup.com/chem
se/article/23/4/385/341850 by guest on 15 January 2022
Dow
nloaded from https://academ
ic.oup.com/chem
se/article/23/4/385/341850 by guest on 15 January 2022


![[ pheromone ] 01](https://static.documents.pub/doc/80x56/568caab71a28ab186da2ad9b/-pheromone-01.jpg)
