1 Public Health & Intelligence DEPRIVATION GUIDANCE FOR ANALYSTS Document Control Version Version 3.2 Date Issued February 2019 Author GPD Team Comments to [email protected]Version Date Comment Author Version 1.0 Nov 2012 1 st version of paper (ISD version) GAS Team Version 2.0 Sep 2014 Draft - paper updated following recommendations made at PHI Statistical Advisory Group meeting. • Change from ISD to PHI guidance • Added in some worked examples • Clearer step-by-step guide to help analysts GPD Team Version 2.1 Dec 2014 Draft - paper updated following recommendations made at PHI Statistical Advisory Group meeting & feedback from colleagues. • Several formatting changes • Update to Scotland vs. HB/CHP level SIMD section • Updated worked examples • Carstairs section updated to take account of the release of Carstairs 2011 • Changes to advice for when to use SIMD or Carstairs • Updated checklist GPD Team Version 2.2 Dec 2014 Paper finalised and signed off at Statistical Advisory Group Meeting, and includes feedback from Scottish Government GPD Team Version 3.0 May 2017 Include updates for SIMD 2016 and to remove CHP guidance GPD Team Version 3.1 Sep 2018 Includes minor updates to choose level of SIMD deprivation category GPD Team Version 3.2 Feb 2019 Added a paragraph about which SIMD version to use for years 2012 and 2013 due to population estimates correction GPD Team
1. Choice of Deprivation Index PHI uses two area-based measures of deprivation for Scotland – the Carstairs and Morris Index (Carstairs)
and the Scottish Index of Multiple Deprivation (SIMD).
SIMD and Carstairs indices should not be combined in one analysis – they are completely different.
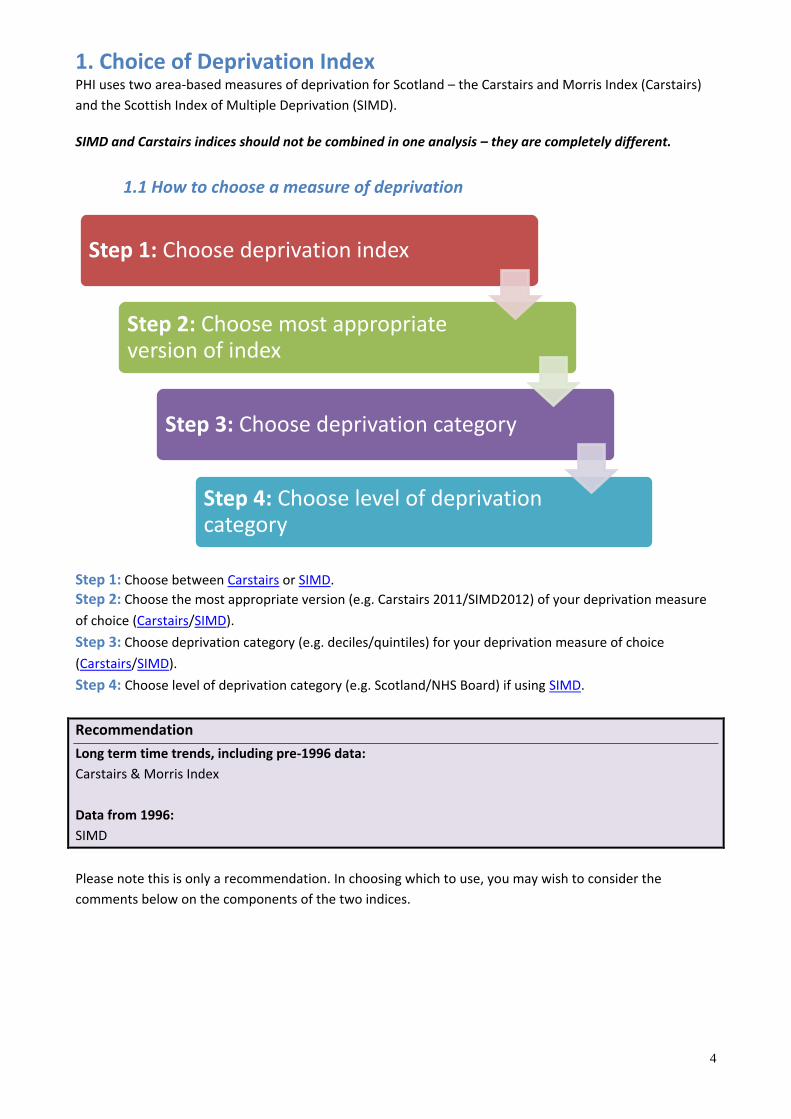
1.1 How to choose a measure of deprivation
Step 1: Choose between Carstairs or SIMD.
Step 2: Choose the most appropriate version (e.g. Carstairs 2011/SIMD2012) of your deprivation measure
of choice (Carstairs/SIMD).
Step 3: Choose deprivation category (e.g. deciles/quintiles) for your deprivation measure of choice
(Carstairs/SIMD).
Step 4: Choose level of deprivation category (e.g. Scotland/NHS Board) if using SIMD.
Recommendation
Long term time trends, including pre-1996 data:
Carstairs & Morris Index
Data from 1996:
SIMD
Please note this is only a recommendation. In choosing which to use, you may wish to consider the
comments below on the components of the two indices.
Step 1: Choose deprivation index
Step 2: Choose most appropriate version of index
Step 3: Choose deprivation category
Step 4: Choose level of deprivation category
5
2. Carstairs and Morris Index The Carstairs and Morris index (also called the Carstairs index), was originally developed in the 1980s using
1981 Census data at postcode sector level. It comprises four indicators judged to represent material
disadvantage in the population (lack of car ownership, low occupational social class [4 & 5], overcrowded
households and male unemployment). The index has also been produced based on 1991, 2001 and 2011
Census data.
The Carstairs index has the advantage of being relatively simple and of not including any health indicators
(a theoretical advantage when analysing health data). Its main disadvantage is that it is not considered a
good reflection of rural deprivation (owning a car may be essential for living in a rural area however poor
you are). Further information on the index can be found in this document [opens PDF] published by
MRC/CSO Social and Public Health Sciences Unit at University of Glasgow.
2.1 Notes on the use of the Carstairs Index Calculation of the Carstairs Index The Carstairs index is calculated at several geographies, with the following two used in PHI:
Postcode Sectors
A postcode sector is identified by omitting the last 2 characters of the full postcode (e.g. KA23 9, FK8 3, G2
9). There are 978 postcode sectors in Scotland (based on the 2011 Census). Previously, there were 1,138
postcode Sectors in Scotland (based on the 2001 Census). The mean population at the time of the 2011
Census was 6,252, but it ranged from 1,050 in the smallest sector to 21,159 in the largest. Note that
postcodes are owned by the Royal Mail and are geographically unstable. Postcode sector boundaries can
change over time as buildings are demolished or constructed. Postcode sector population estimates are
available for years 1999 and 2000, as well as for Census years.
National Records of Scotland (NRS) create all census output geographies using the Output Area (OA) as the
building brick. Output Areas combine multiple full postcodes that might or might not have the same first
letters and/or numbers. Since postcode sectors are created from Output Areas then it is possible that one
postcode sector includes multiple postcodes with different first number and letter combinations. In short,
the postcode sectors produced by census are not “true” postcode sectors. For example, the postcode AB11
8QX falls in the postcode sector AB11 9 and not into AB11 8. The postcode AB11 9DU is in the postcode
sector AB11 8 and not in AB11 9. For more information see the National Records of Scotland (NRS,
previously GRO) website.
Consistent Areas Through Time (CATTs)
To overcome the problems of geographies in Scotland changing between the 1981, 1991 and 2001
Censuses, 10,058 small areas with consistent boundaries over time were developed by researchers at St
Andrews University. CATTs were formed from 1981 Census enumeration districts and 1991 and 2001
Census output areas, using a merging strategy. In 2001, CATTs had a mean population size of 503 (range 50
to 18,510). CATTs are sometimes used in long time trend analyses based on the Carstairs index but should
Population Weighting The Scottish Government (SG) publish SIMD deprivation categories which are NOT population weighted. The SG rank Data Zones from most to least deprived and then split this into:
• 20 deprivation vigintiles with 5% of the Data Zones in each vigintile
• 10 deprivation deciles with 10% of the Data Zones in each decile
• 5 deprivation quintiles with 20% of the Data Zones in each quintile
PHI rank Data Zones from most to least deprived using the Scottish Government’s un-weighted SIMD and
by using the National Records of Scotland population estimates, split this into:
• 20 deprivation vigintiles with approximately 5% of the population in each vigintile
• 10 deprivation deciles with approximately 10% of the population in each decile
• 5 deprivation quintiles with approximately 20% of the population in each quintile
PHI analyses use population-weighted quintiles and deciles for both numerators and denominators in all
PHI lookup files and datamarts such as ACaDMe. The reason for this can be found here. The Scottish
Government and National Records of Scotland analyses generally use the un-weighted deprivation
categories.
It is important not to mix population-weighted deprivation categories with the un-weighted deprivation
categories in the same analysis.
Recommendation
• As the default, SIMD analyses should be calculated using population-weighted deprivation
categories.
• There will be exceptions to the rule, such as HEAT Targets and Scotland Performs national
indicators, where the customer/user will specify the use of the un-weighted method.
• Always stipulate in your results whether your categories are population-weighted or un-weighted.
• As Data Zone populations can increase or decrease over time, it is best to use rates or percentages
rather than numbers of events to compare data for deprivation quintiles or other categories.
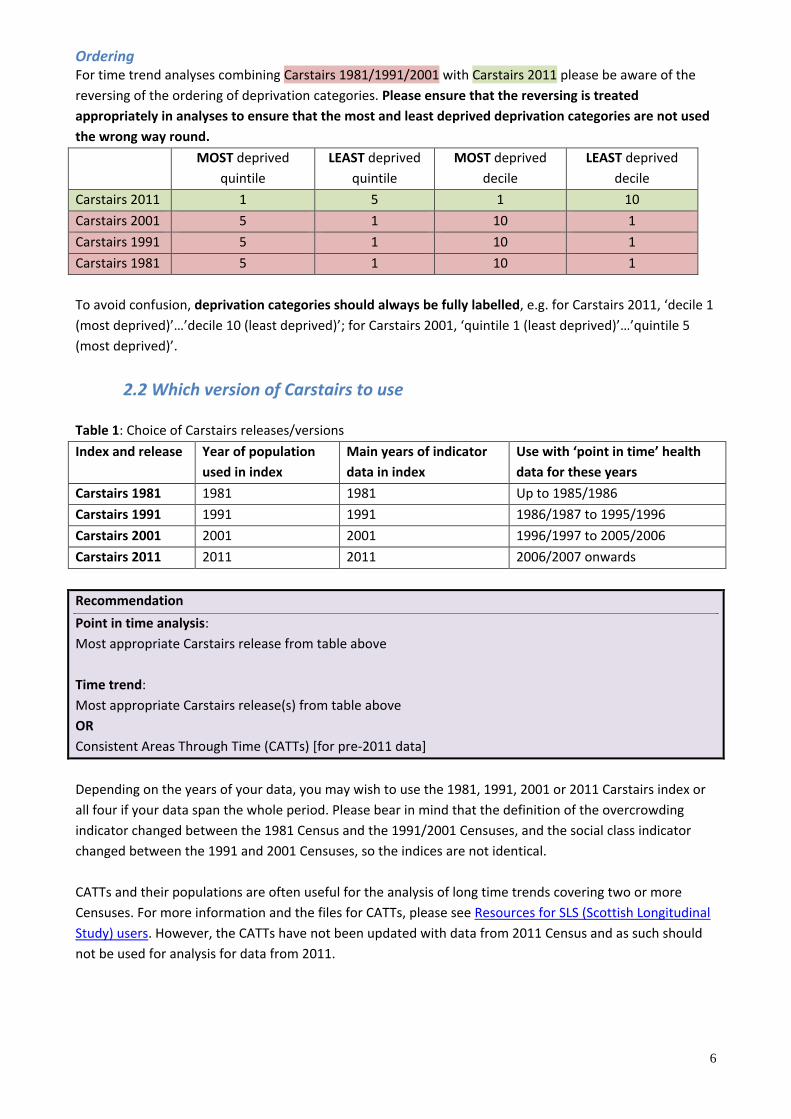
Ordering For time trend analyses combining SIMD 2004/2006 with SIMD 2009v2/2012/2016 please be aware of the
reversing of the ordering of deprivation categories. Please ensure that the reversing is treated
appropriately in analyses to ensure that the most and least deprived deprivation categories are not used
the wrong way round.
MOST deprived
quintile
LEAST deprived
quintile
MOST deprived
decile
LEAST deprived
decile
SIMD 2016 1 5 1 10
SIMD 2012 1 5 1 10
SIMD 2009 v2 1 5 1 10
SIMD 2006 5 1 10 1
SIMD 2004 5 1 10 1
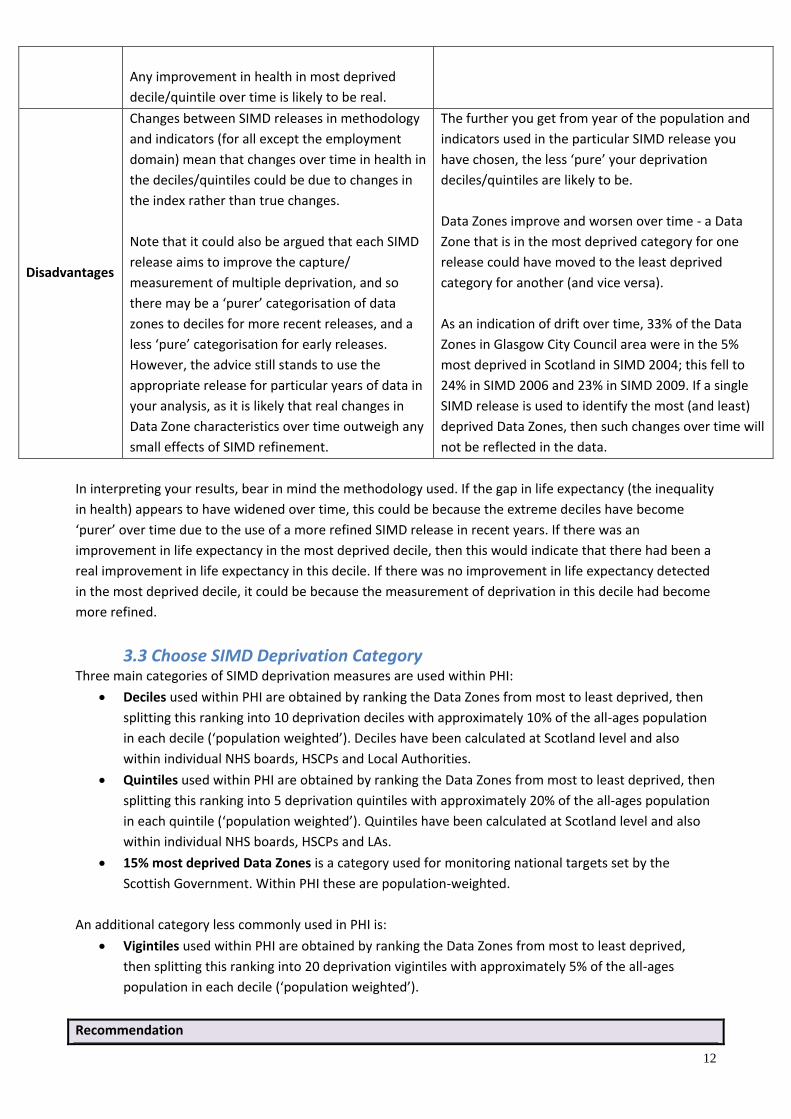
To avoid confusion, deprivation categories should always be fully labelled, e.g. for SIMD 2016, ‘decile 1
appropriate release for particular years of data in
your analysis, as it is likely that real changes in
Data Zone characteristics over time outweigh any
small effects of SIMD refinement.
The further you get from year of the population and
indicators used in the particular SIMD release you
have chosen, the less ‘pure’ your deprivation
deciles/quintiles are likely to be.
Data Zones improve and worsen over time - a Data
Zone that is in the most deprived category for one
release could have moved to the least deprived
category for another (and vice versa).
As an indication of drift over time, 33% of the Data
Zones in Glasgow City Council area were in the 5%
most deprived in Scotland in SIMD 2004; this fell to
24% in SIMD 2006 and 23% in SIMD 2009. If a single
SIMD release is used to identify the most (and least)
deprived Data Zones, then such changes over time will
not be reflected in the data.
In interpreting your results, bear in mind the methodology used. If the gap in life expectancy (the inequality
in health) appears to have widened over time, this could be because the extreme deciles have become
‘purer’ over time due to the use of a more refined SIMD release in recent years. If there was an
improvement in life expectancy in the most deprived decile, then this would indicate that there had been a
real improvement in life expectancy in this decile. If there was no improvement in life expectancy detected
in the most deprived decile, it could be because the measurement of deprivation in this decile had become
more refined.
3.3 Choose SIMD Deprivation Category Three main categories of SIMD deprivation measures are used within PHI:
• Deciles used within PHI are obtained by ranking the Data Zones from most to least deprived, then
splitting this ranking into 10 deprivation deciles with approximately 10% of the all-ages population
in each decile (‘population weighted’). Deciles have been calculated at Scotland level and also
within individual NHS boards, HSCPs and Local Authorities.
• Quintiles used within PHI are obtained by ranking the Data Zones from most to least deprived, then
splitting this ranking into 5 deprivation quintiles with approximately 20% of the all-ages population
in each quintile (‘population weighted’). Quintiles have been calculated at Scotland level and also
within individual NHS boards, HSCPs and LAs.
• 15% most deprived Data Zones is a category used for monitoring national targets set by the
Scottish Government. Within PHI these are population-weighted.
An additional category less commonly used in PHI is:
• Vigintiles used within PHI are obtained by ranking the Data Zones from most to least deprived,
then splitting this ranking into 20 deprivation vigintiles with approximately 5% of the all-ages
population in each decile (‘population weighted’).
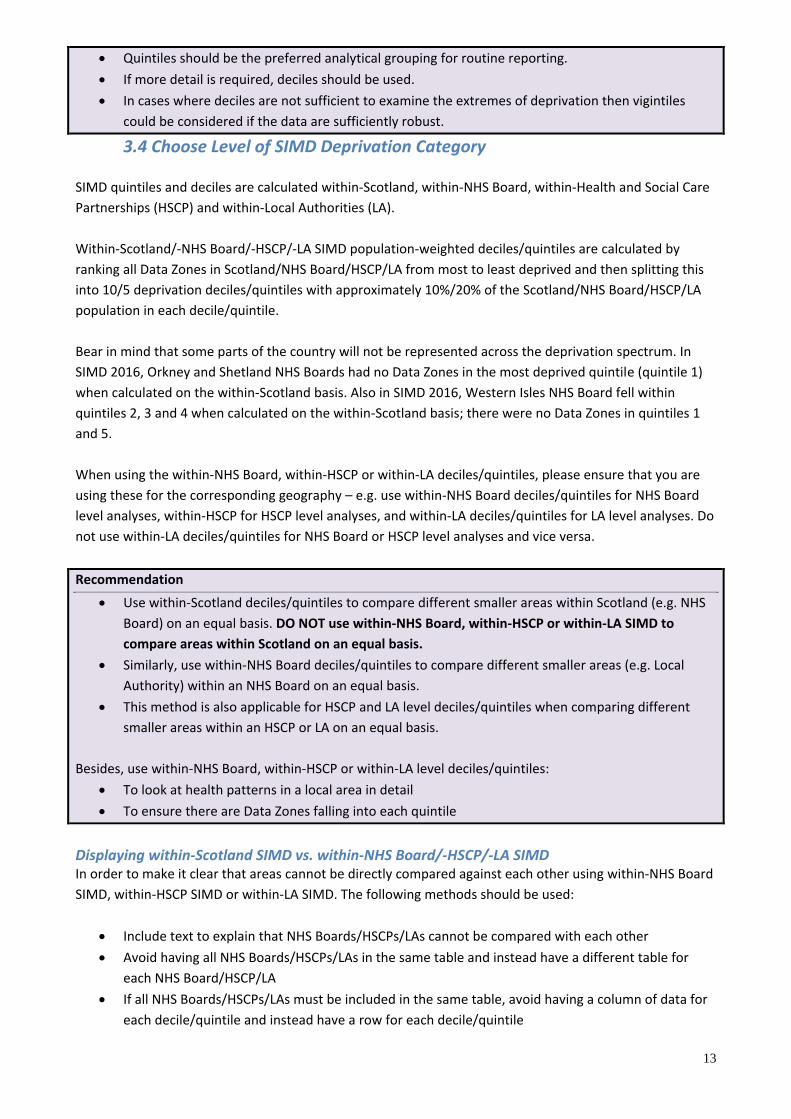
Recommendation
13
• Quintiles should be the preferred analytical grouping for routine reporting.
• If more detail is required, deciles should be used.
• In cases where deciles are not sufficient to examine the extremes of deprivation then vigintiles
could be considered if the data are sufficiently robust.
3.4 Choose Level of SIMD Deprivation Category
SIMD quintiles and deciles are calculated within-Scotland, within-NHS Board, within-Health and Social Care
Partnerships (HSCP) and within-Local Authorities (LA).
Within-Scotland/-NHS Board/-HSCP/-LA SIMD population-weighted deciles/quintiles are calculated by
ranking all Data Zones in Scotland/NHS Board/HSCP/LA from most to least deprived and then splitting this
into 10/5 deprivation deciles/quintiles with approximately 10%/20% of the Scotland/NHS Board/HSCP/LA
population in each decile/quintile.
Bear in mind that some parts of the country will not be represented across the deprivation spectrum. In
SIMD 2016, Orkney and Shetland NHS Boards had no Data Zones in the most deprived quintile (quintile 1)
when calculated on the within-Scotland basis. Also in SIMD 2016, Western Isles NHS Board fell within
quintiles 2, 3 and 4 when calculated on the within-Scotland basis; there were no Data Zones in quintiles 1
and 5.
When using the within-NHS Board, within-HSCP or within-LA deciles/quintiles, please ensure that you are
using these for the corresponding geography – e.g. use within-NHS Board deciles/quintiles for NHS Board
level analyses, within-HSCP for HSCP level analyses, and within-LA deciles/quintiles for LA level analyses. Do
not use within-LA deciles/quintiles for NHS Board or HSCP level analyses and vice versa.
Recommendation
• Use within-Scotland deciles/quintiles to compare different smaller areas within Scotland (e.g. NHS
Board) on an equal basis. DO NOT use within-NHS Board, within-HSCP or within-LA SIMD to
compare areas within Scotland on an equal basis.
• Similarly, use within-NHS Board deciles/quintiles to compare different smaller areas (e.g. Local
Authority) within an NHS Board on an equal basis.
• This method is also applicable for HSCP and LA level deciles/quintiles when comparing different
smaller areas within an HSCP or LA on an equal basis.
Besides, use within-NHS Board, within-HSCP or within-LA level deciles/quintiles:
• To look at health patterns in a local area in detail
• To ensure there are Data Zones falling into each quintile
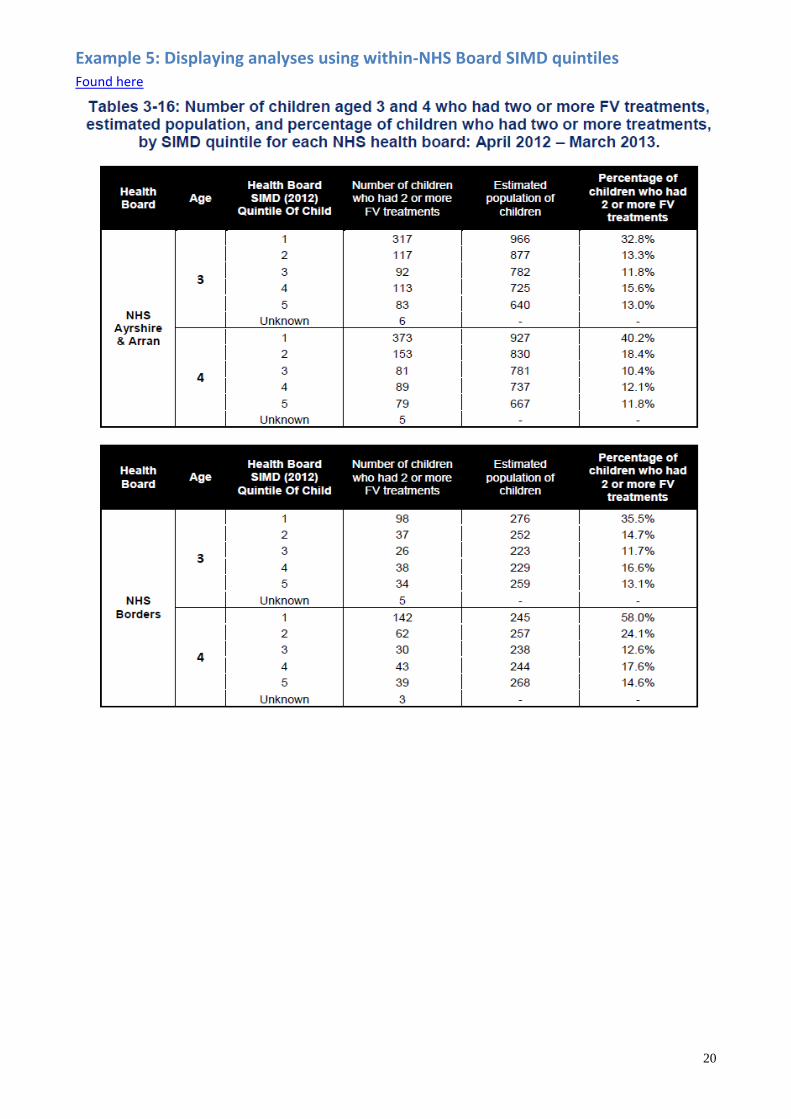
Displaying within-Scotland SIMD vs. within-NHS Board/-HSCP/-LA SIMD In order to make it clear that areas cannot be directly compared against each other using within-NHS Board
SIMD, within-HSCP SIMD or within-LA SIMD. The following methods should be used:
• Include text to explain that NHS Boards/HSCPs/LAs cannot be compared with each other
• Avoid having all NHS Boards/HSCPs/LAs in the same table and instead have a different table for
each NHS Board/HSCP/LA
• If all NHS Boards/HSCPs/LAs must be included in the same table, avoid having a column of data for
each decile/quintile and instead have a row for each decile/quintile
14
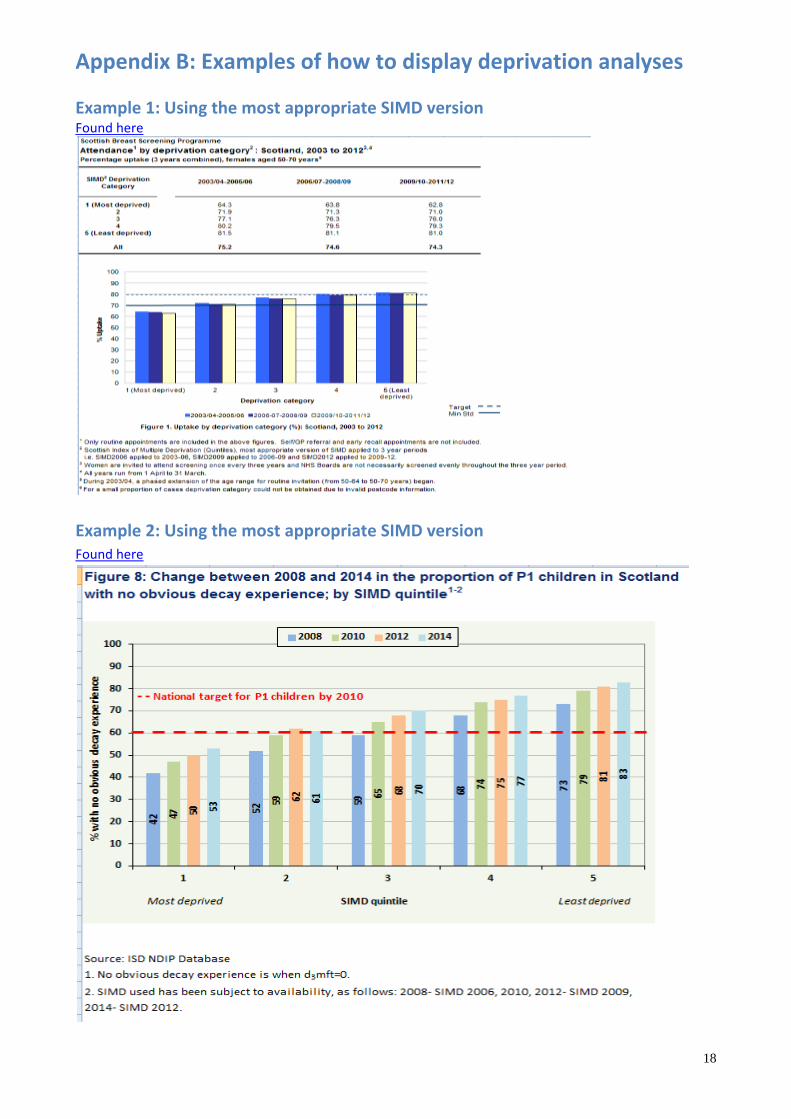
Please see Appendix B for the different ways to display analyses using the within-Scotland deciles/quintiles
(example 4) compared with the within-NHS Board or within-LA level deciles/quintiles (examples 5 and 6).
The process for using within-HSCP deciles/quintiles would be the same as with within-NHS Board or within-
LA deprivation analysis.
Recommendation
• Within-Scotland SIMD quintile/decile analyses should be displayed in a different way from within-
NHS Board, within-HSCP and within-LA SIMD quintile/decile analyses, using the methods and
examples included in this paper.
• The method used should be clearly stated in results.
• If within-NHS Board, within-HSCP or within-LA quintiles/deciles have been used, please ensure that
there is an explanation that NHS Board/HSCPs/LAs cannot be compared against each other, and use
the appropriate table layout.
4. Checklist
The following must be stated in analyses:
✓ Deprivation index used
✓ Version used and for which year(s) of data
✓ Whether population-weighted deciles/quintiles were used or not
✓ Which deciles/quintile is most and least deprived
✓ Whether within-Scotland, -NHS Board, -HSCP or -LA quintiles/deciles have been used
✓ If within-NHS Board, within-HSCP or within-LA quintiles/deciles have been used, please ensure that
there is an explanation that NHS Board/HSCPs/LAs cannot be compared against each other, and use
the appropriate table layout
Include in tables and charts as appropriate, such as in footnotes, titles, and/or headings.
This will vary for different analyses; therefore it is the responsibility of teams to ensure they include the
correct wording appropriate for their analysis and in the most appropriate place.
Please refer to Appendix B for some examples.
15
5. Further Information The SIMD team at the Scottish Government has written the following briefing papers on SIMD in relation to
time trends:
• SIMD analysis over time
• Analysis of the changing concentrations of deprived individuals in deprived areas
• Analysis of concentrations of deprivation
There is an alternative to the full SIMD, which may be considered for research requiring absolute
independence between the health data and the deprivation groupings; the income-employment index. This
is based on only the income and employment domains of SIMD, and has been used by the Scottish
Government in looking at time trends in health inequalities (see for example Long-Term Monitoring of
Health Inequalities: Headline Indicators - October 2012). Annual updates to the income and employment
domains were published in 2010 and 2011, so the income-employment index is available for those years, in
addition to other SIMD years.
In comparing the Carstairs index and SIMD, it is worth noting that the paper Why is mortality higher in
Scotland than in England and Wales? (Hanlon et al, 2005) found a strong positive correlation (0.92)
between Carstairs 2001 scores and the Scottish Index of Deprivation 2003 (a pre-cursor of SIMD) at ward
level.
Please note that if you want to compare deprivation levels in Scotland and England, the SIMD is not directly
comparable with the Index of Multiple Deprivation used in England. Comparisons have, however, been
made using 1981, 1991 and 2001 Carstairs scores calculated for postcode sectors in Scotland and wards in
England and Wales (see Why is mortality higher in Scotland than in England and Wales?, Hanlon et al,
2005). An alternative would be to compare Carstairs scores for Data Zones in Scotland and lower super
output areas (LSOAs) in England and Wales, as these areas are conceptually similar apart from size.
The paper “Exploring the impact of selective migration on the deprivation-mortality gap within Greater
Glasgow” by Popham et al uses CATTs and compares approaches using deprivation quintiles based on the
1991 Census, 2001 Census, or both. You can access this paper via the Social and Public Health Sciences Unit.
6. Acknowledgements This document was prepared by the Geography, Population and Deprivation (GPD) Team both from
knowledge within PHI of the topic and a wide range of reference material. It was circulated to a range of
individuals in PHI and the Scottish Government for comment, and we are very grateful for their input. Any
error or lack of clarity that remains is, however, our responsibility.
7. Contact Information If after reading this document you have any unanswered queries on deprivation, or would like to discuss
any aspects further, please contact the Geography, Population and Deprivation (GPD) Team, via