19
PHILIPPINE MANUFACTURING INDUSTRY ROADMAP and GLOBAL VALUE CHAINS Rafaelita M. Aldaba Ateneo de Manila University Professional Schools, Rockwell, Makati City November 12, 2014 1
| Date post: | 21-Dec-2015 |
| Category: |
Documents |
| Upload: | merilyn-gallagher |
| View: | 219 times |
| Download: | 1 times |

PHILIPPINE MANUFACTURING INDUSTRY ROADMAP and
GLOBAL VALUE CHAINS Rafaelita M. Aldaba
Ateneo de Manila UniversityProfessional Schools, Rockwell, Makati City
November 12, 2014
1

Outline
Objective: implications of GVCs on the growth & development of PH manufacturing • Global Value Chains• Manufacturing Performance• Philippine Manufacturing Industry Roadmap• Services Vision and Strategy• Future Implications
2

Part 1: GVCsSTAN SHIH’S SMILE CURVE
• Opportunities for upgrading & diversification in both upstream & downstream in goods & services
• Strategic positioning in the GVC
HIGHER
VALUE ADDED
LOWER
MANUFACTURE
MARKETINGBRANDING
DESIGN DISTRIBUTION
TIME
SALES, AFTER SERVICECONCEPT, R&D
3

Distribution of value for Iphone
• GVCs require high quality services embodied in production & increasingly outsourced
• US (Apple) captures 58.5% of Iphone sales price• Korea: 5%• Japan: 0.5%; China: 1.8%• Most value: product design, software development, product management,
marketing & other high wage functions kept by Apple• Trend: dispersion of functions
Source: Kraemer et al 2011Apple profits
58%
Non-Apple
US profits
2%
EU profits
1%
Tai-wan
profits0%
Japan profits
0%
S. Ko-rea
profits5%
Unidentified profits
5%
Cost of in-puts ma-teri-als
22%
Cost of inputs China labor2%
Cost of inputs non-China labor
3%
4

Distribution of Value for Ipad
• For Ipad, US: 30% & 15% distribution & retail• Korea: 7%, Taiwan: 2%, China: 2%
Source: Kraemer et al 2011
Apple profits30%
Distribution & retail
15%
Non-Apple US profits2%
Taiwan profits2%
Japan profits1%
S. Korea profits7%
Unidentified profits
5%
Cost of in-puts mate-
rials31%
Cost of inputs China labor
2%
Cost of inputs non-China labor
5%
5

Auto Global Value ChainFUNCTION R&D &
DESIGNMATERIAL SUPPLY
PARTS SOURCING
PARTS INTEGRATION
ASSEMBLY MARKETING & SERVICES
COST FOR AUTOMAKERS
Low to medium: 10%
Low: <10% High: 40-70% Low: <10% Medium to high: 20%
(R&D, model design-Toyota, Honda, etc.)Standardizers
Material suppliers
Component specialists
Integrators 1st tier
Assemblers
Distributor
ExporterGlass, rubber, plastic, steel, textile, electronics
Body panels, mechanical & electrical Wheels, tires, seats,engines, transmission
6

Global auto production network
• Toyota’s IMV Project: transmission (Phils. & India), diesel engine (Thai), gas engine (Indonesia)
Source: Toyota Motor Corporation
7

Electronics GVC
8

Part 2: Impressive Growth PerformancePH as ASIA’S NEW ECONOMIC TIGER
• PH growth rate: 6.8 (‘12), 7.2% (’13, 2nd to China 7.7%)• H1 (’14): PRC 7.45%, MAL: 6.3%, PH 6%, INO 3.8%, TH -
0.1%
2000 2001 2002 2003 2004 2005 2006 2007 2008 2009 2010 2011 2012 2013
-4.0
-2.0
0.0
2.0
4.0
6.0
8.0
10.0
12.0
14.0
16.0
GDP Growth
PHTHINOVNPRCMAL
9

Manufacturing Resurgence
• Industry growth: 7.3% (‘12); 9.3% (’13, highest)• Manufacturing resurgence: 5.4% (‘12); 10.3% (‘13); 8.8%
(H1’14)
20002001
20022003
20042005
20062007
20082009
20102011
20122013
-10.0
-5.0
0.0
5.0
10.0
15.0
20.0Industry Growth
PHTHINOVNPRC
Year
in %
10

WHAT MAKES PH DIFFERENTMarket Opportunities• Growing market & middle class: demographic sweet spot Labor• Young, English speaking, highly trainable workforce• Moderate wage increasesOperating Environment• Strong macroeconomic fundamentals• Political stability, business/consumer confidencePolicy Focus• New Industrial Policy & a more pro-active Government• Industry programs to support manufacturing resurgence• Philippine Economic Zone Authority, Board of Investments, Subic,
Clark: investment facilitation, investor careImproved competitiveness ranking (World Economic Forum)• Rank #52 in 2014-15 from rank #59 11

Part 3: Roadmap for Structural Transformation
Vision: globally competitive manufacturing
-Rebuild capacity existing industries, strengthen emerging industries, maintain competitiveness of comparative advantage industries
-Participate as hubs in regional & global production networks for auto, electronics, machinery, garments, food
-Shift to high value added activities,investments in upstream industries -Link & integrate industries-SMEs & large enterprises
Phase I 2014-2017
Phase II 2018-2021
Phase III 2022-2025
12

Strategic Actions, Complementary Measures
30% value added; 15% employment
Horizontal measures
Coordination mechanism
Vertical measures
• Close supply chain gaps• Expand domestic market &
exports• HRD & skills• SME development• Technology upgrading,
innovation, green growth
• Investment promotion
• Power, smuggling, logistics & infrastructure
• Competitive exchange rate
open trade regime, sustainable macro policies, sound tax policies & administration, efficient bureaucracy, secure property rights, institutions that promote adaptive research & patent regime, access to finance & technology for SMEs
Required Components• Materials• Skills• Energy• Capital• Digital
technology
13
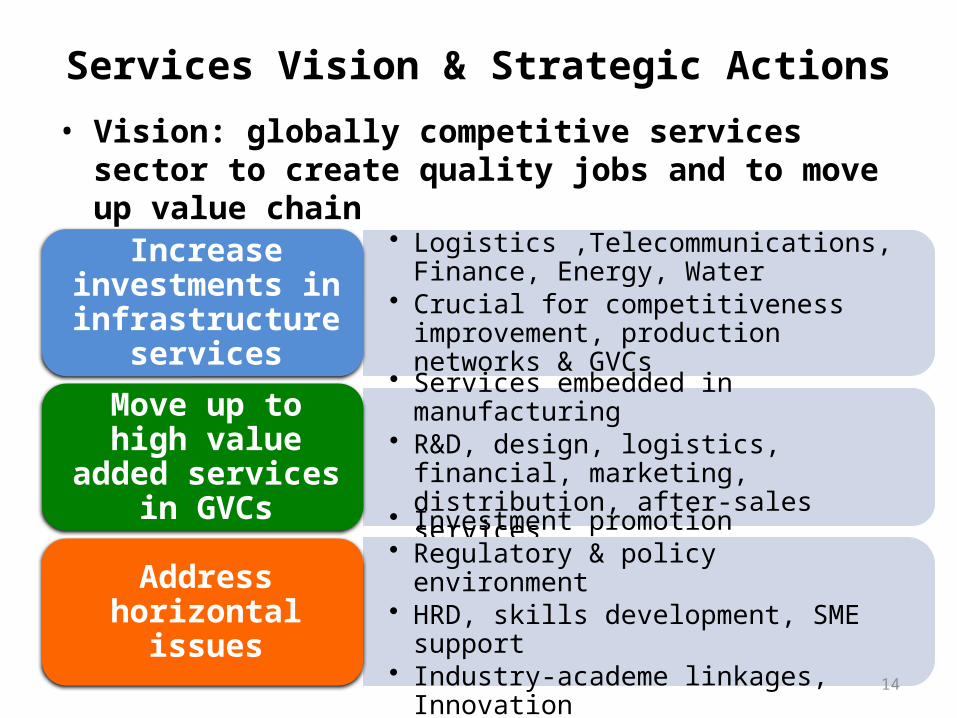
Services Vision & Strategic Actions• Vision: globally competitive services sector to create quality
jobs and to move up value chain
• Logistics ,Telecommunications, Finance, Energy, Water
• Crucial for competitiveness improvement, production networks & GVCs
Increase investments in infrastructure
services
• Services embedded in manufacturing• R&D, design, logistics, financial, marketing,
distribution, after-sales services
Move up to high value added services
in GVCs
• Investment promotion• Regulatory & policy environment• HRD, skills development, SME support • Industry-academe linkages, Innovation
Address horizontal issues
14

Manufacturing: Comparative Advantage• Motor vehicle• Engineered Products
– Motor vehicle: body panel stamping, engines, transmissions, transaxle, large injection molded parts
– E-vehicles: controller assembly, motor, battery, charging stations– Shipbuilding & Aerospace: parts & components
• Chemicals: oleochemicals, petrochemicals & derivatives, chlor-alkali • Auto electronics, LED, solar, office equipment, communication radar,
Electronic Data Processing, office equipment, consumer electronics• Virgin pulp paper• Copper wires & copper wire rods• Basic iron & steel products, long steel products, flat hot/cold rolled
products• Tool & die: simple, compound, & progressive dies for metal stamping
& forging; molds for die casting, plastic injection or blow molding; jigs & fixtures for metal cutting & forging
• Food Processing/Manufacturing15

Services: Comparative Advantage • Pool of skilled workers: main source of strength• Current comparative advantage : IT-BPM• Potential comparative advantage
Creative/knowledge-based services Services embedded in manufacturing Medical tourism, Tourism & travel related Educational, recreational, cultural & sporting Aircraft maintenance, repair, &overhaul Ship repair Distribution (retail, franchising) Construction & engineering Transport support
Energy, Public infrastructure & logistics, Public Private Partnership projects
16

IT-BPM Services from PHIT Application services Business Process services Engineering services
App dev’t & maintenance Application development AD integration & testing Application maintenanceSystem integration Analysis, Design Development Integration & testing Package implementationIT Infrastructure Services Help desk, Desktop support Data centre services Mainframe Network operations IT consultingSoftware product development New product development System testing Localization/Support Gaming
Horizontal processes Contact centers Human resources Finance & accounting Supply chain: procurement
logistics managementIndustry/vertical processes Banking & insurance Telecom Public sector, Utilities Health care, High-tech Oil & Gas, Consumer prodsKnowledge Process Outsourcing Business research, financial
research Animation Data analytics Legal process & patent
research Other high-end processes
Manufacturing engineering Upstream product
engineering- Concept design- Simulation- Design engineering Downstream product
engineering- CAD/CAM/CAE- Embedded software- Localization Plan & process
engineeringArchitecture design Design process Building
Management models
17

How to move up the GVC• Competitiveness: technology & human capital upgrading• Types of Upgrading: process, product, functional, chain• GVCs deepened globalization by affecting both
manufacturing & serviceso Services embedded in manufacturing
• Required components for manufacturing: Materials, Skills, Energy, Capital, Technologyo Human resource development & skills trainingso Power issueo Investment promotion o Manufacturing innovation ecosystem, link R&D to business, new
product development (3D printing could boost innovation)• GVC-oriented industrial policy
18

With or without AEC, we need to pursue a new industrial policy to make our industries
competitive and create an environment conducive to private sector development.
This could lead to more investments, increased competition, more innovation,
increased productivity, sustainable & inclusive growth, & more & better jobs!
THANK YOU!
19


![[Makati Urban Redevlopment Presentation : Makati City, Philipines]](https://static.documents.pub/doc/80x56/558624b4d8b42ac54a8b45f1/makati-urban-redevlopment-presentation-makati-city-philipines.jpg)