The South China Sea is found in the East Asian Seas (EAS) region (Fig. 1) that occupies a significant portion in world fisheries production greater than 12%, and found in the world’s highest diversity region (Talaue- McManus 2000). In this East Asian Seas region is often associated with those circumscribed by those referred to under the United Nations Environmental Programme regional seas context. Countries which border the region are China, the Democratic Republic of Korea, the Republic of Korea, Japan, the Philippines, Brunei, Malaysia, Singapore, Thailand, Cambodia and Vietnam. This region is composed of a diverse people with varied cultures experiencing various social and economic developmental stages (Fig. 2). The EAS region has been observed to have a high population growth (Fig 3). Around 1.9 billion people have been estimated for this region if one considers that around 77% live within 100 km of the coast Figure 1. The South China Sea. (Source: Pauly and Christensen 1993) The South China Sea- Revisiting The Large Marine Ecosystem Approach PORFIRIO M. ALIÑO The Marine Science Institute University of the Philippines Diliman 1101 Quezon City PHILIPPINES
Transcript
The South China Sea is found in the East Asian Seas(EAS) region (Fig. 1) that occupies a significantportion in world fisheries production greater than12%, and found in the world’s highest diversity region(Talaue- McManus 2000). In this East Asian Seasregion is often associated with those circumscribedby those referred to under the United NationsEnvironmental Programme regional seas context.Countries which border the region are China, theDemocratic Republic of Korea, the Republic of
Korea, Japan, the Philippines, Brunei, Malaysia,Singapore, Thailand, Cambodia and Vietnam. Thisregion is composed of a diverse people with variedcultures experiencing various social and economicdevelopmental stages (Fig. 2).
The EAS region has been observed to have a highpopulation growth (Fig 3). Around 1.9 billion peoplehave been estimated for this region if one considersthat around 77% live within 100 km of the coast
Figure 1. The South China Sea. (Source: Pauly and Christensen 1993)
The South China Sea-Revisiting The Large
Marine EcosystemApproach
PORFIRIO M. ALIÑOThe Marine Science InstituteUniversity of the PhilippinesDiliman 1101 Quezon City
PHILIPPINES
(Burke et al. 2001). Despite the diversity of culturesin the region many of its people share many commoncultural heritage both mundane and sublime. It hasbeen observed to have the highest regional economicgrowth as per change in real Gross Domestic Product(GDP) (Fig. 4). In this context, of the six trans-borderregions (TBR) of economic growth seen in the EAS,four of which are situated within the South ChinaSea rim (Fig. 5).
Though it may seem that an arbitrary boundary exists,around 5 large marine ecosystems (LMEs) have beenidentified with two significant riverine systems (Fig.
Figure 3. Population structure of East Asia. (Source: PEMSEA 2001)
Figure 4. World growth summary (1974-1994). (Source: PEMSEA 2001)
Figure 2. The people of East Asia. (Source: PEMSEA2001)
The People of East AsiaThe People of East AsiaDiverse culture
• Ethnic composition• Religion• Political affiliation• Socioeconomic conditions
P o p u la t io nS tr u c tu r eo f E a s t A s ia
P o p u la t io nP o p u la t io nS tr u c tu r eS tr u c tu r eo f E a s t A s iao f E a s t A s ia
C ity P o p u la t io n (2 0 0 0 ) R a n k
(m ill io n s )
T o k y o 2 8 .0 1S h a n g h a i 1 4 .2 6S e o u l 1 2 .2 1 1B e ijin g 1 2 .0 1 2M a n ila 1 0 .8 1 6O s a k a 1 0 .6 1 8T ia n j in 1 0 .2 2 0J a k a r ta 9 .8 2 1
World Growth Summary, 1974-1994World Growth Summary, 1974-1994
World Bank, 1998
0
2
4
6
8
10
1974-80 1981-90 1991-94
chan
ge in
real
GD
P
OECD East Asia South Asia Latin America Sub-Sahara Africa
6) (PEMSEA 2001). Despite the seemingly arbitrarynature in delineating the LME subregions, variouspathways of connectivity occur across the boundaries.Some of these pathways are seen for example throughhydrographic - meteorological - oceanographic -linkages that mediate dynamics of nature of the
ecosystems’ productivity and movement of its bio-physical resources (Table 1).
Indeed, the seas and oceans offer more of a linkagethan a barrier to its people and its ecosystems.
Figure 5. Urbanization and emerging economic growth centers in East Asia. (Source: PEMSEA 2001)
Figure 6. The seas of East Asia. (Source: PEMSEA 2001)
0 - 1%
1 - 2%
2 - 3%3 - 4%4 - 5%
% Urbanization growth/year (1994-2025)
Eastern Growth Triangle: Mindanao,North Sulawesi, Brunei, Sabah
Mekong TBR:Vietnam, Laos,Cambodia,Thailand
Taiwan-Fujian TBR
Northeast Asia TBR: includes Tumen River Basin, Russia, China, N. Korea,South Korea, Japan
U rbanization andem erg ing econom icgrow th centers inEast A sia
E xisting /P roposedTransborder R eg ions NE Asia TBR : Tum en R iver Basin ,R ussia ,C hina, DP R Korea, R O Korea,Japan
Ta iwan-Fujian TBR
M ekong TBR: V ietnam , Laos, Cam bodia, Thailand
Eastern G row th T riangle:M indanao,North Sulawesi, B runei,Sabah
N orthern G row th T riangle: Sum atra (M edan), M alays ia (P enang), southern Thailand (Songkhla, Hatya i)
S ijori G row th T riangle: S ingapore, Johor Bahru, R iau
Five semi-enclosed seas /large marine ecosystems
• Yellow Sea• East China Sea• South China Sea• Sulu-Sulawesi Sea• Indonesian seas
Riverine systems• Mekong River• Yangtze River• Yellow River
Major ocean currents
The Seas of East Asia
MARINE ECOSYSTEM VALUES
Though much of the global coastal and marineecosystems goods and services have often beenundervalued (Fig. 7) (Costanza et al. 1977) some ofthe estimates highlight the unique significance of thisregion. In this region is found the highest marine
biodiversity of the world (Fig. 8). Consider forexample that in this area of highest marine diversity,around 2,500 fish species are found (e.g. thePhilippines) while in Australia around 1,500 isestimated and only a third in the Carribean (Thresher1992; PEMSEA 2001). This is consistently seen inother taxa such as for the scleractinian corals with
Table 1. Selected statistics relevant to fisheries development in Southeast Asia. (Source: Pauly and Chua 1988)
Figure 7. Estimated mean value of some marine biomes. (Source: PEMSEA 2001)
Suisan Avia tion Scientific American Presents TheOceans 9(3) :1998
Estuarie s22,832
Seagrass/algal beds19,004
Mangrove/tidal marsh9,99 0
Coral reef6,07 5
Con tinental shelf80 4
Open ocean25 2
Estimated mean value of some marine biomesEstimated mean value of some marine biomesSo urce: Costanza et al 1997
over 400 species while in the GBR would be around400 species and only half as much in the Carribean(only 100-200 species; Veron 1995). Though thesignificance of the high biodiversity remains to befully appreciated, the diverse ecosystems of SoutheastAsia such as its coral reefs have been estimated ataround $112.5 billion a year (Ruitenbeek 1999).
THREATS TO THE MARINEENVIRONMENT AND RESOURCES
The marine ecosystem values provide an importantlife support system to the coastal states especiallythrough food from fisheries. Estimates for the South
Figure 8. Biodiversity in Southeast Asia. (Source: PEMSEA 2001)
Table 2. South China Sea countries’ share in world imports of fishery products, in USD 1,000 (data from Ferdouse1994) (Source: Talaue-McManus 2000)
100-200500-600Caribbean
3951,500Great BarrierReef
400-5002,500South EastAsia
Hard CoralSpeciesDiversity
Marine FishSpeciesDiversity
Sources: Chou 1997; Veron, 2001; and Williams, 2001.
BiodiversityBiodiversity
China Sea would be at least 10 million tons per yearand occupies at least 4% (except China) share in theworld imports of fishery products worth at least $45billion (Table 2-3) (ca. 1995, Talaue-McManus 2000).
But perhaps nowhere else in the marine regions ofthe world, considering the rich biodiversity anddependence on the fisheries, that its fisheries are in a
severe state of overexploitation (GIWA 2001). Boththe Sulu-Celebes Sea and the South China Sea haverated overfishing and destructive fishing as its priorityconcerns. Considering the rate of population growthand the rate of fisheries exploitation in these twoLMEs it has been projected that conditions will notimprove in the next 20 years and may even decline(GIWA 2001). Habitat loss and modification have
Table 3. Marine production in the participating South China Sea. (Source: Talaue-McManus 2000) countries
Figure 9. Mangrove areas have been reduced to as much as half of its original cover since the early 1900s. (Source:WRI, UNEP, UNDP and WB 2000)
MangrovesMangroves
■■ In many countries ofIn many countries ofSE Asia, conversionSE Asia, conversionto shrimp andto shrimp andfishponds used to befishponds used to beone of the majorone of the majorthreats to mangrovesthreats to mangroves
Mangrove loss in theMangrove loss in theASEAN region rangeASEAN region rangefrom 20 - 75 % of itsfrom 20 - 75 % of itsoriginal coveroriginal coverSource: WRI, UNEP, UNDP and WB 2000Source: WRI, UNEP, UNDP and WB 2000
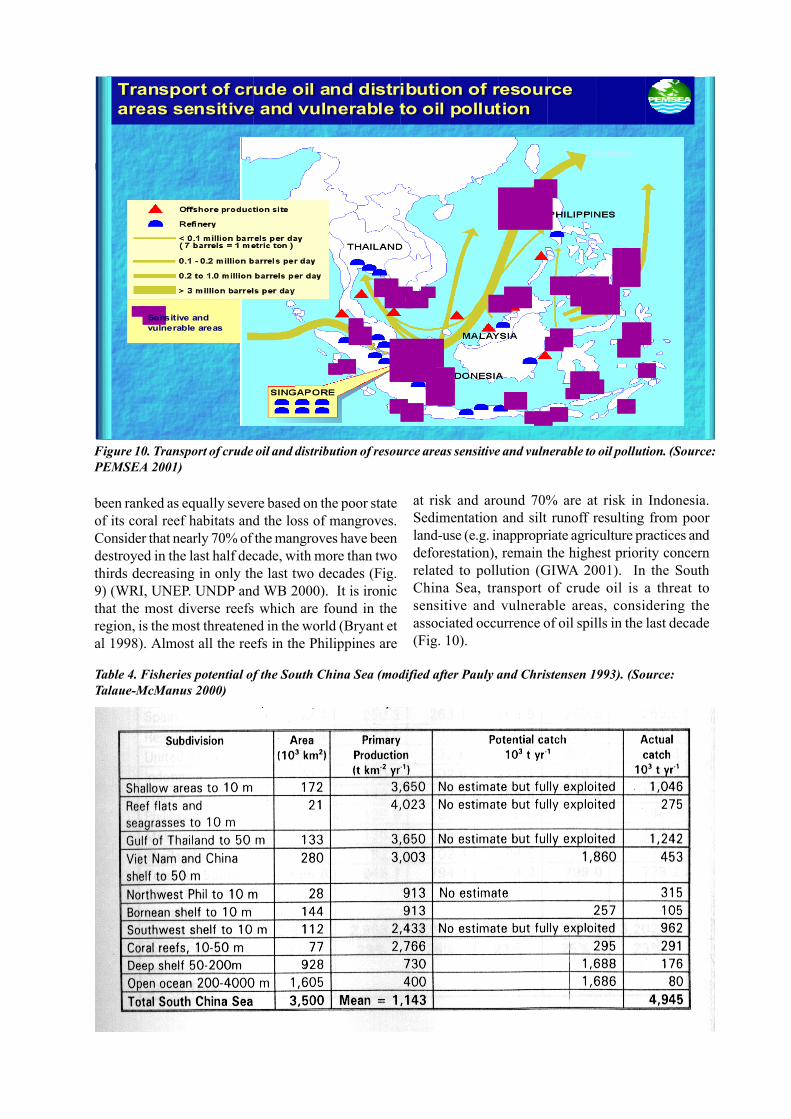
been ranked as equally severe based on the poor stateof its coral reef habitats and the loss of mangroves.Consider that nearly 70% of the mangroves have beendestroyed in the last half decade, with more than twothirds decreasing in only the last two decades (Fig.9) (WRI, UNEP. UNDP and WB 2000). It is ironicthat the most diverse reefs which are found in theregion, is the most threatened in the world (Bryant etal 1998). Almost all the reefs in the Philippines are
at risk and around 70% are at risk in Indonesia.Sedimentation and silt runoff resulting from poorland-use (e.g. inappropriate agriculture practices anddeforestation), remain the highest priority concernrelated to pollution (GIWA 2001). In the SouthChina Sea, transport of crude oil is a threat tosensitive and vulnerable areas, considering theassociated occurrence of oil spills in the last decade(Fig. 10).
Figure 10. Transport of crude oil and distribution of resource areas sensitive and vulnerable to oil pollution. (Source:PEMSEA 2001)
Table 4. Fisheries potential of the South China Sea (modified after Pauly and Christensen 1993). (Source:Talaue-McManus 2000)
Transport of crude oil and distribution of resourceareas sensitive and vulnerable to oil pollutionTransport of crude oil and distribution of resourceareas sensitive and vulnerable to oil pollution
Sensitive and vulnerable areas
to Japan
Estimates of the fisheries potential in the South ChinaSea have been gauged based on the reported catchstatistics and evaluation of primary production valuesfrom its’ various habitats (Table 4, Fig. 11) (Paulyand Christensen 1993; Talaue-McManus 2000). Itshigh potential is seen by its significant contributionto the world’s production (i.e. greater than 20%) of
major tuna species by principal fishing nations (Table5) (Talaue-McManus 2000). Unfortunately, basedon these reports much of the capture fisheriespotential is already fully exploited (Table 4) (Paulyand Christensen 1993; Aliño et al. 1998; Talaue-McManus 2000).
Figure 11. Mean annual distribution of primary production in the SCS. Map A, adapted from Lieth (1975), suggestsa primary production of 3.36 x 10⁹ tonnes carbon per year for the entire SCS. Map B, adapted from FAO (1981),suggests a total primary production of 4.2 x 10⁹ tonnes carbon per year if one assumes, as in Leith (1975), an upperlimit of 2,000 tonnes km-2 year -1 for the Gulf of Thailand and adjacent areas. Map C presents our depth-basedstratification; the correponding estimate of total production is 4.0 x 10⁹ tonnes, within eange of the other twoestimates. (Source: Pauly and Christensen 1993)
Table 5. World production of major tuna species by principal fishing nations (1988-1993) (data from Peckham1995). (Source: Talaue-McManus 2000)
SOCIAL AND ECONOMIC CONSEQUENCES:THEIR PROBABLE CAUSES
The reduction of the value of the marine ecosystemsredound to lowered food security in the region whichmay lead to reduced supply of cheap protein(Bernaseck 1996). Consequently these could lead toa greater incidence of malnutrition. Deficits infisheries productivity have been suggested to resultin transmigration and eventually leading to socialconflicts. Much of these consequences have been
considered to be driven by the overcapitalization ofthe fishery and an undervalued ecosystem goods andservices. One of the important quotes cited inhumankind’s folly as seen in fisheries is “the tragedyof the commons” Hardin (1968). This tragedy isexacerbated both by the dire economic deprivationof the majority of the developing states in this regionand the high population growth (around 2-4%). Thewide disparity in income distribution in the coastalzone further contributes to conflicts of interests dueto their inequitable access to the commons these has
Table 6a. Selected statistics for tropical developing in Asia. (Sources: ADB 1995, 1996; WRI 1995 in Silvestre andPauly 1997)
Table 6b. Selected 1994 fisheries statistics for tropical developing countries in Asia. (Sources: FAO 1994; Hotta1996 in Silvestre and Pauly 1997)
also led to the disenfranchisement of the poor in thepolitical economy of the mainstream of society. Theinability of fishers and other stakeholders to get outof the loop of poverty and deprivation is also relatedto weak ecosystem governance due to the weak state’scapabilities. Poor institutional arrangements needsto be addressed such as in lack of an effectivemonitoring, control and systems. In addition, distortedinteractions of the public and private sector relationsto the market forces further leads to the deteriorationof ecosystem governance. In future, the unevenplaying field for sustenance fishers can be of greatconcern with further globalization thrust in the region.
INITIAL OPTIONS AND RESPONSES FORTHE FUTURE
Considering the issues and concerns for the EastAsian Seas Region, urgent and effective action hasbeen the call from governments and civil society(Dight et.al 1998). Some regional programs areunderway to address these concerns by formulatingvarious Strategic Action Programs (SAP) [UNEP2001, PEMSEA 2001 and GIWA 2001). These havebeen laudable efforts and are achieving someheadway. Yet there seems to be a prevailingpessimism in the prospects of achieving someconcrete gains to actually reverse the projecteddecline in the degradation of marine ecosystems andoverexploitation cycle (GIWA 2001). A silver lining
seems to be noted, despite the apparent decline thatmay be projected by the year 2020 the generallygrowing positive movements in the realm ofenvironmental management albeit requiring moretime to achieve the desired outcomes (i.e. around2050, GIWA 2001). Aside from the proposedstrategies mentioned earlier, some supplementarythoughts may be germane to the issues raised. Someof the constraints in the suggested strategic actionprograms are the following: 1) its main emphasis onthe environmental sphere with less active aspects onthe political economic dimensions; 2) equity concernshave also been poorly addressed; and 3) thedevelopment trajectory of coastal societies have tobe well integrated into the strategic ecosystemgovernance agenda.
TESTING THE WATERS AND APPLYING THELESSONS LEARNED
An area of overlapping claims among six coastalstates (Brunei, China, Malaysia, Philippines, Taiwanand Vietnam) in the region is the Spratly’s, found inbosom of the South China Sea (Fig. 12). It is in thisarea where the combined learnings from the lessonslearned from each of these claimants are put to a test.Pauly and Christensen (1993) estimates show thatthe fisheries in the area are on the verge of beingoverexploited.
Figure 12. Conflicting claims in the South China Sea. (Source: Schadwick 1999)
Its global value as reef complex is perhapscomparable to the Great Barrier Reef in Australiatogether with its crucial lifesupport system infisheries, trade and navigation have been wellrecognized (McManus 1994, Aliño et al. 1998).Though much of the ecosystem threats have relativelybeen less pronounced in this area (e.g. habitat
deterioration, destructive fishing andoverexploitation) the transboundary concerns bothin the living and non-living resources make it aparamount global hotspot in the future. These humaninduced threats have been suggested to interact withnatural threats (e.g. ENSO and storms) (Figs. 13-14)This can be observed by the differential recovery of
Figure 13. El Niño Southern Oscillation (ENSO) and surface temperature anomalies. (Sources: ERS-AMI andADEOS-NSCAT in Salamante and Villanoy 2000)
Figure 14 Moonthly wind stress field for weak ENSO (1992), Non-ENSO (1996) and strong ENSO (1998) (Source:Salamante and Villanoy 2000)
-18 -15 -12 -9 -6 -3 0 3 6 9 12
Weak ENSO
Normal
Strong ENSO
Jan_'92
Aug_'92
Jan_'96
Aug_'96
Jan_'98
Aug_'98
reefs after the bleaching event and the effects ofENSO in the upwelling regions in the South ChinaSea (e.g. off the coast of Vietnam and NWPhilippines) (Fig 14-15).
The Spratly’s has been identified as crucial source
of larvae of the coastal states in this region and thushas been proposed as world heritage site (McManus1994, WCPA 2000). Recent scientific informationbased on some fish species indicate that indeed sharedgenetic affinities between the Kalayaan Islands (partof the disputed areas) and those of the Philippines
Figure 15. Sea surface currents, upwelling and downwelling areas in Viet Nam. (Source: Thuoc and Long 1997)
Figure 16. Inferred migratory route of some tuna species passing through the Philippines. (Source: Morgan andValencia 1983)
(Ochavillo et al. 2000). Figs 16-17 show shared stocksand migration route of tuna.
Initial seeds of hope have been planted by the jointcooperative expeditions undertaken by thePhilippines and Vietnam (JOMSRE 1996 and 2000).The world heritage proposal can be a goldenopportunity to establish stewardship arrangementsthrough international linkages. Learning from theunderstanding of the marine biodiversity shows howimperative we should cooperate and share ourresponsibilities to this common heritage and ourfuture together. Initiating adaptive managementefforts at each of the national fisheries managementcouncils, by improving monitoring, control andsurveillance systems based on an ecosystemframework for management could be a good start. Itis with hope and perseverance that the actions at thelocal levels translate to the broader understanding andshared stewardship of the larger marine ecosystemof the South China Sea. Maybe in this light we canmake the many Strategic Environmental Plans and
Scientific Action Programs being formulated in theregion be undertaken urgently and a reality ofsustainable development. Perhaps we can emulatesome regional cooperation models such as theAntarctic Treaty as proposed by McManus (1994) orhave annual joint regional scientific, management,trade and management councils akin to that of theInternational Council of Exploration of the Sea(ICES).
REFERENCES
Aliño PM, Nañola CL, Ochavillo DG and Rañola MC(1998) The fisheries potential of the KalayaanIsland Group, South China Sea. In Morton B (ed)Proc 3rd Int Conf Marine Biology of the SouthChina Sea, Hong Kong, 28 October - 1 November1996, pp 219-226. Hong Kong University Press,Hong Kong
Bernaseck G (1996) Principal fisheries
Figure 17. Some shared pelagic stocks around the Philippines espaecially in the South China Sea. (Source: Morganand Valencia 1983)
development policy issues for the five-yeardevelopment plan of the Philippines. Paperpresented at the National Fisheries PolicyWorkshop, 16-20 Mar 1987, Baguio City
Bryant D, Burke L, McManus J, Spalding M (1998)Reefs at risk, a map based indicator of threats tothe world’s coral reefs. WRI, ICLARM, WCMC,UNEP, Washington DC, 55 p
Burke L, Selig E, Spalding M (2001) Reefs at risk inSoutheast Asia (1st review draft will be updated),83 p + 2 tables, 2 appendices, 17 maps, 1 fig
Costanza R, D’Arge R, De Groot R, Farber S, GrassoM, Hannon B, Limburg K, Maeema S, O’Neill RV,Parvelo J, Raskin RG, Sutton P, Ven den Belt M(1997) The value of the world’s ecosystemservices and natural capital. Nature 387(6630):253-260
Dight I, Kenchington R, Baldwin J (eds) (1988)International Tropical Marine EcosystemsManagement Symposium (ITMEMS)Proceedings, Great Barrier Reef Marine ParkAuthority, Townsville, 451 p
GEF/UNDP/IMO Regional Programme onPartnerships in Environmental Management forthe Seas of East Asia (PEMSEA) (2001)Environmental strategy for the seas of East Asia,draft report, 91 p
Global International Waters Assessment (GIWA)(2001) Preliminary results for the scoping andassessment of the South China Sea and Sulu-Celebes Seas. Draft discussion paper in theRegional GIWA Workshop, November 5-8, 2001,Bangkok, Thailand
Hardin G (1968) The tragedy of the commons.Science 162:3859: 1243-1248
Joint Oceanographic Marine S R Expedition (1996)Proc Scientific Conf on RP-VN JOMSRE-SCS’96, Hanoi, Vietnam
McManus JW (1994) The Spratly Islands: a marinepark? Ambio 23: 181-186
Morgan JR, Valencia MJ (1983) Atlas for marinepolicy in Southeast Asian Seas. University ofCalifornia Press, Berkeley
Ochavillo DG, Bakus GJ, Aliño PM (2000)
Identification of tropical coral reef fish larvae:MtDNA markers, morphometrics and multivariateanalysis. Abstracts, 9th Int Coral Reef Symp, 23-27 Oct 2000, Bali, Indonesia, p 233
Pauly D, Chua TE (1988) The overfishing of marineresources: socioeconomic background in SoutheastAsia AMBIO 17: 200-206
Pauly D, Christensen V (1993) Stratified models oflarge marine ecosystems: a general approach andan application to the South China Sea. In Shermanet al.(eds) Large marine ecosystems: stress,mitigation and sustainability, pp.148-174. AAASPublication, USA
Ruitenbeek HJ (1999) Blue pricing of underseatreasures - needs and opportunities forenvironmental economics research on coral reefmanagement in Southeast Asia. Paper presentedto the 12th Biannual Worksop of theEnvironmental Economics Program for SoutheastAsia, Singapore, 11-14 May. IDRC, Singapore
Salamante EE, Villanoy CL (2000). Sea surfacetemperature variability in the seas surrounding thePhilippines in relation to ENSO events. InProceedings of the 21st Asian Conference onRemote Sensing.2, pp 767-771
Schadwick DH (1999) Coral in peril. NationalGeographic, 195:1:30-37
Talaue-McManus L (2000) Transboundary diagnosticanalysis for the South China Sea. EAS/RCU TechRep Ser No 14, 107 p
Thuoc P, Long N (1997) Overview of the coastalfisheries of Vietnam. In G T Silvestre and D Pauly(eds). Status and management of tropical coastalfisheries in Asia. 96-106. ICLARM Conf Proc 53,208 p
Thresher RE (1992) Geographic variability in theecology of coral reef fishes: evidence, evolutionand possible implications. In Sale PF (ed), Theecology of fishes on coral reefs, pp 401-436.Academic Press Inc, San Diego, California, USA
Veron JEN (1995) Corals in space and time: thebiogeography and evolution of the Scleractinia.JEN Veron, Australian Inst Marine Sci,Townsville, 321 p
World Commission on Protected Areas (WCPA)(2000) Protected areas: benefits beyond
boundaries. IUCN, Gland, Switzerland, 17 p
World Resources Institute (WRI), United NationsEnvironment Programme (UNEP), United NationsDevelopment Programme (UNDP), World Bank(WB) (2000) World Resources 2000 - 2001 -People and ecosystems: the fraying web of life.Washington DC, USA