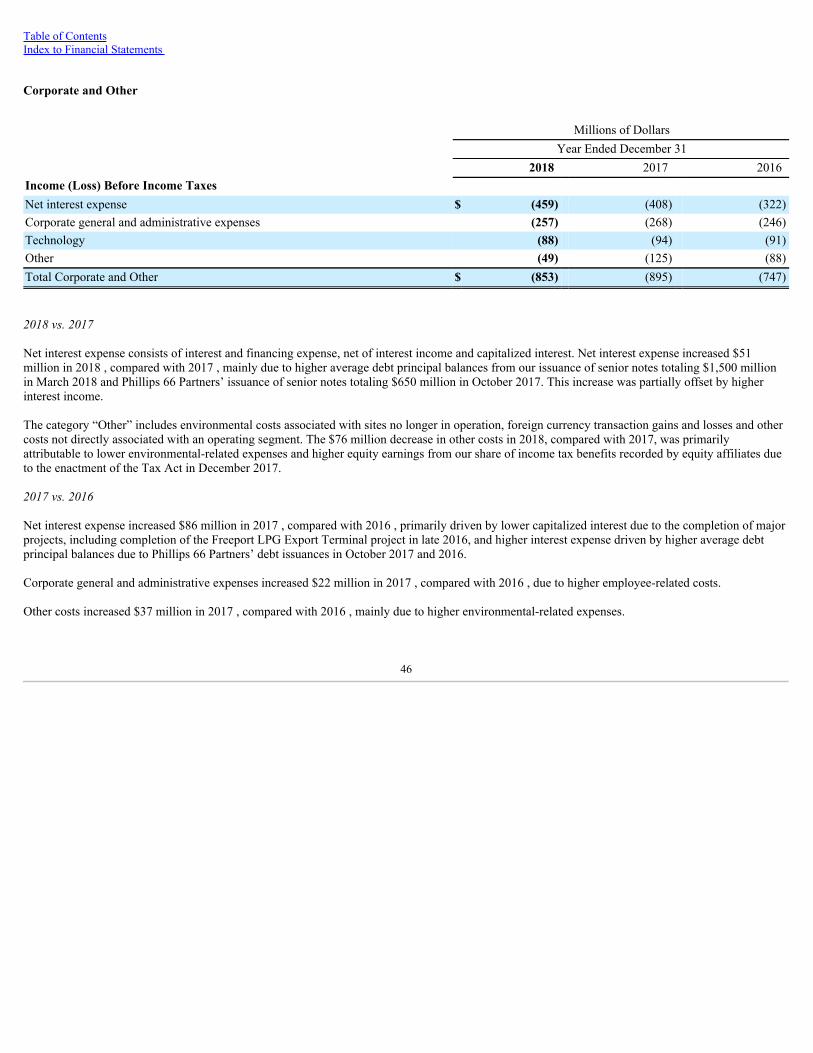
Table of Contents Index to Financial Statements 2018 UNITED STATES SECURITIES AND EXCHANGE COMMISSION Washington, D.C. 20549 FORM 10-K (Mark One) [X] ANNUAL REPORT PURSUANT TO SECTION 13 OR 15(d) OF THE SECURITIES EXCHANGE ACT OF 1934 For the fiscal year ended December 31, 2018 OR [ ] TRANSITION REPORT PURSUANT TO SECTION 13 OR 15(d) OF THE SECURITIES EXCHANGE ACT OF 1934 For the transition period from to Commission file number: 001-35349 Phillips 66 (Exact name of registrant as specified in its charter) Delaware 45-3779385 (State or other jurisdiction of incorporation or organization) (I.R.S. Employer Identification No.) 2331 CityWest Blvd., Houston, Texas 77042 (Address of principal executive offices) (Zip Code) Registrant’s telephone number, including area code: 281-293-6600 Securities registered pursuant to Section 12(b) of the Act: Title of each class Name of each exchange on which registered Common Stock, $0.01 Par Value New York Stock Exchange Securities registered pursuant to Section 12(g) of the Act: None Indicate by check mark if the registrant is a well-known seasoned issuer, as defined in Rule 405 of the Securities Act. [X] Yes [ ] No Indicate by check mark if the registrant is not required to file reports pursuant to Section 13 or Section 15(d) of the Act. [ ] Yes [X] No Indicate by check mark whether the registrant (1) has filed all reports required to be filed by Section 13 or 15(d) of the Securities Exchange Act of 1934 during the preceding 12 months (or for such shorter period that the registrant was required to file such reports), and (2) has been subject to such filing requirements for the past 90 days. [X] Yes [ ] No Indicate by check mark whether the registrant has submitted electronically every Interactive Data File required to be submitted pursuant to Rule 405 of Regulation S-T during the preceding 12 months (or for such shorter period that the registrant was required to submit such files). [X] Yes [ ] No Indicate by check mark if disclosure of delinquent filers pursuant to Item 405 of Regulation S-K is not contained herein, and will not be contained, to the best of the registrant’s knowledge, in definitive proxy or information statements incorporated by reference in Part III of this Form 10-K or any amendment to this Form 10-K. [ ] Indicate by check mark whether the registrant is a large accelerated filer, an accelerated filer, a non-accelerated filer, a smaller reporting company, or an emerging growth company. See the definitions of “large accelerated filer,” “accelerated filer,” “smaller reporting company” and “emerging growth company” in Rule 12b-2 of the Exchange Act. Large accelerated filer [X] Accelerated filer [ ] Non-accelerated filer [ ] Smaller reporting company [ ] Emerging growth company [ ] If an emerging growth company, indicate by check mark if the registrant has elected not to use the extended transition period for complying with any new or revised financial accounting standards provided pursuant to Section 13(a) of the Exchange Act. [ ] Indicate by check mark whether the registrant is a shell company (as defined in Rule 12b-2 of the Act). [ ] Yes [X] No The aggregate market value of common stock held by non-affiliates of the registrant on June 29, 2018 , the last business day of the registrant’s most recently completed second fiscal quarter, based on the closing price on that date of $112.31 , was $52.1 billion . The registrant, solely for the purpose of this required presentation, had deemed its Board of Directors and executive officers to be affiliates, and deducted their stockholdings in determining the aggregate market value. The registrant had 454,913,087 shares of common stock outstanding at January 31, 2019 . Documents incorporated by reference: Portions of the Proxy Statement for the Annual Meeting of Stockholders to be held on May 8, 2019 (Part III).
Transcript
Table of ContentsIndex to Financial Statements
2018
UNITED STATES SECURITIES AND EXCHANGE COMMISSION Washington, D.C. 20549
FORM 10-K
(Mark One) [X] ANNUAL REPORT PURSUANT TO SECTION 13 OR 15(d) OF THE SECURITIES EXCHANGE ACT OF 1934 For the fiscal year ended December 31, 2018 OR [ ] TRANSITION REPORT PURSUANT TO SECTION 13 OR 15(d) OF THE SECURITIES EXCHANGE ACT OF 1934
For the transition period from to Commission file number: 001-35349
Phillips 66 (Exact name of registrant as specified in its charter)
Delaware 45-3779385
(State or other jurisdiction of
incorporation or organization) (I.R.S. Employer
Identification No.)
2331 CityWest Blvd., Houston, Texas 77042 (Address of principal executive offices) (Zip Code) Registrant’s telephone number, including area code: 281-293-6600
Securities registered pursuant to Section 12(b) of the Act: Title of each class Name of each exchange on which registered Common Stock, $0.01 Par Value New York Stock Exchange
Securities registered pursuant to Section 12(g) of the Act: None
Indicate by check mark if the registrant is a well-known seasoned issuer, as defined in Rule 405 of the Securities Act. [X] Yes [ ] NoIndicate by check mark if the registrant is not required to file reports pursuant to Section 13 or Section 15(d) of the Act. [ ] Yes [X] NoIndicate by check mark whether the registrant (1) has filed all reports required to be filed by Section 13 or 15(d) of the Securities Exchange Act of 1934 during thepreceding 12 months (or for such shorter period that the registrant was required to file such reports), and (2) has been subject to such filing requirements for the past 90days. [X] Yes [ ] NoIndicate by check mark whether the registrant has submitted electronically every Interactive Data File required to be submitted pursuant to Rule 405 of Regulation S-Tduring the preceding 12 months (or for such shorter period that the registrant was required to submit such files). [X] Yes [ ] NoIndicate by check mark if disclosure of delinquent filers pursuant to Item 405 of Regulation S-K is not contained herein, and will not be contained, to the best of theregistrant’s knowledge, in definitive proxy or information statements incorporated by reference in Part III of this Form 10-K or any amendment to this Form 10-K. [ ]Indicate by check mark whether the registrant is a large accelerated filer, an accelerated filer, a non-accelerated filer, a smaller reporting company, or an emerginggrowth company. See the definitions of “large accelerated filer,” “accelerated filer,” “smaller reporting company” and “emerging growth company” in Rule 12b-2 ofthe Exchange Act.
Large accelerated filer [X] Accelerated filer [ ] Non-accelerated filer [ ] Smaller reporting company [ ]
Emerging growth company [ ] If an emerging growth company, indicate by check mark if the registrant has elected not to use the extended transition period for complying with any new or revisedfinancial accounting standards provided pursuant to Section 13(a) of the Exchange Act. [ ]Indicate by check mark whether the registrant is a shell company (as defined in Rule 12b-2 of the Act). [ ] Yes [X] NoThe aggregate market value of common stock held by non-affiliates of the registrant on June 29, 2018 , the last business day of the registrant’s most recently completed second fiscal quarter,based on the closing price on that date of $112.31 , was $52.1 billion . The registrant, solely for the purpose of this required presentation, had deemed its Board of Directors and executiveofficers to be affiliates, and deducted their stockholdings in determining the aggregate market value.The registrant had 454,913,087 shares of common stock outstanding at January 31, 2019 .
Documents incorporated by reference:Portions of the Proxy Statement for the Annual Meeting of Stockholders to be held on May 8, 2019 (Part III).
Table of ContentsIndex to Financial Statements
TABLE OF CONTENTSItem Page
PART I
1 and 2. Business and Properties 1Corporate Structure 1Segment and Geographic Information 2
Midstream 2Chemicals 10Refining 12Marketing and Specialties 16Technology Development 17
5. Market for Registrant's Common Equity, Related Stockholder Matters and Issuer Purchases of Equity Securities 296. Selected Financial Data 317. Management's Discussion and Analysis of Financial Condition and Results of Operations 32
7A. Quantitative and Qualitative Disclosures About Market Risk 68Cautionary Statement for the Purposes of the “Safe Harbor” Provisions of the Private Securities Litigation Reform
Act of 1995 708. Financial Statements and Supplementary Data 719. Changes in and Disagreements with Accountants on Accounting and Financial Disclosure 139
9A. Controls and Procedures 1399B. Other Information 139
PART III
10. Directors, Executive Officers and Corporate Governance 14011. Executive Compensation 14012. Security Ownership of Certain Beneficial Owners and Management and Related Stockholder Matters 14013. Certain Relationships and Related Transactions, and Director Independence 14014. Principal Accounting Fees and Services 140
PART IV
15. Exhibits, Financial Statement Schedules 14116. Form 10-K Summary 141
Signatures 146
Table of ContentsIndex to Financial Statements
Unless otherwise indicated, “the company,” “we,” “our,” “us” and “Phillips 66” are used in this report to refer to the businesses of Phillips 66 and itsconsolidated subsidiaries.
This Annual Report on Form 10-K contains forward-looking statements including, without limitation, statements relating to our plans, strategies,objectives, expectations and intentions that are made pursuant to the “safe harbor” provisions of the Private Securities Litigation Reform Act of 1995.The words “anticipate,” “estimate,” “believe,” “budget,” “continue,” “could,” “intend,” “may,” “plan,” “potential,” “predict,” “seek,” “should,” “will,”“would,” “expect,” “objective,” “projection,” “forecast,” “goal,” “guidance,” “outlook,” “effort,” “target” and similar expressions identify forward-looking statements. The company does not undertake to update, revise or correct any forward-looking information unless required to do so under thefederal securities laws. Readers are cautioned that such forward-looking statements should be read in conjunction with the company’s disclosures underthe heading “CAUTIONARY STATEMENT FOR THE PURPOSES OF THE ‘SAFE HARBOR’ PROVISIONS OF THE PRIVATE SECURITIESLITIGATION REFORM ACT OF 1995.”
PART I
Items 1 and 2. BUSINESS AND PROPERTIES
CORPORATE STRUCTURE
Phillips 66, headquartered in Houston, Texas, was incorporated in Delaware in 2011 in connection with, and in anticipation of, a restructuring ofConocoPhillips that separated its downstream businesses into an independent, publicly traded company named Phillips 66. The two companies wereseparated by ConocoPhillips distributing to its stockholders all the shares of common stock of Phillips 66 after the market closed on April 30, 2012 (theSeparation). Phillips 66 stock trades on the New York Stock Exchange under the “PSX” stock symbol.
Our business is organized into four operating segments:
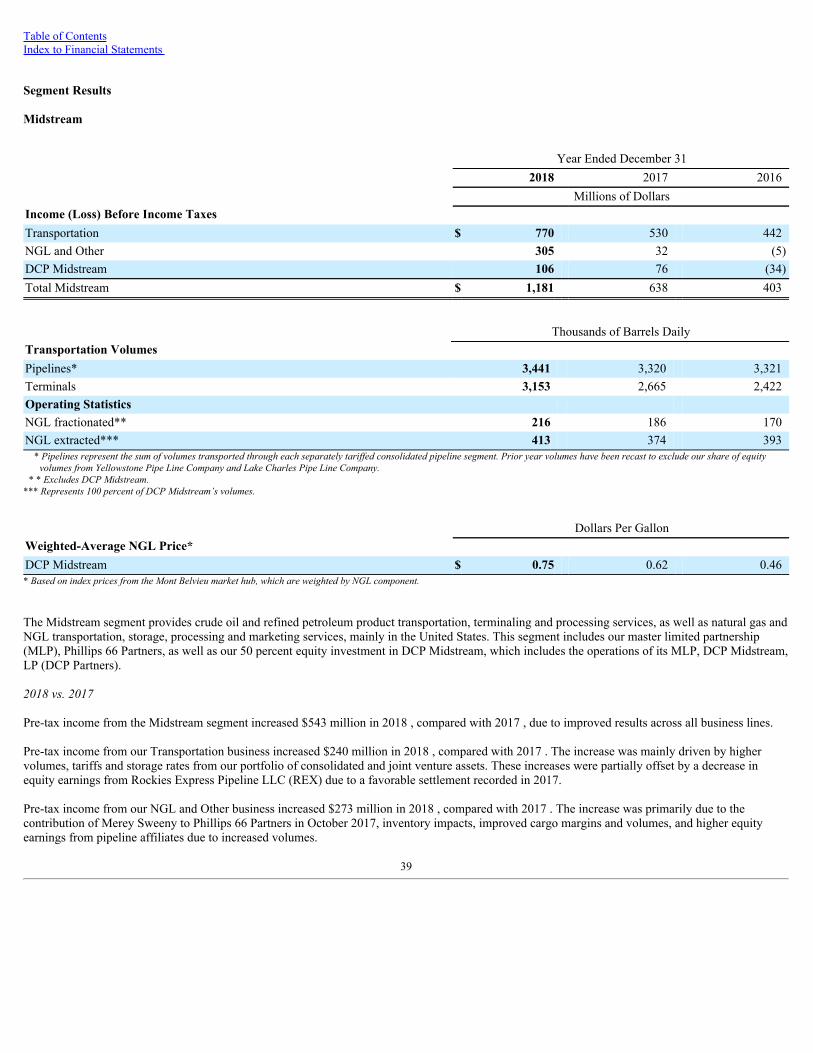
1) Midstream— Provides crude oil and refined petroleum product transportation, terminaling and processing services, as well as natural gas andnatural gas liquids (NGL) transportation, storage, processing and marketing services, mainly in the United States. This segment includes ourmaster limited partnership (MLP), Phillips 66 Partners LP (Phillips 66 Partners), as well as our 50 percent equity investment in DCPMidstream, LLC (DCP Midstream).
2) Chemicals— Consists of our 50 percent equity investment in Chevron Phillips Chemical Company LLC (CPChem), which manufactures andmarkets petrochemicals and plastics on a worldwide basis.
3) Refining— Refines crude oil and other feedstocks into petroleum products (such as gasoline, distillates and aviation fuels) at 13 refineries inthe United States and Europe.
4) Marketing and Specialties (M&S)— Purchases for resale and markets refined petroleum products, mainly in the United States and Europe. Inaddition, this segment includes the manufacturing and marketing of specialty products (such as base oils and lubricants), as well as powergeneration operations.
Corporate and Other includes general corporate overhead, interest expense, our investment in new technologies and various other corporate activities.Corporate assets include all cash, cash equivalents and income tax-related assets.
At December 31, 2018 , Phillips 66 had approximately 14,200 employees.
1
Table of ContentsIndex to Financial Statements
SEGMENT AND GEOGRAPHIC INFORMATION
MIDSTREAM
The Midstream segment consists of three business lines:
• Transportation —Transports crude oil and other feedstocks to our refineries and other locations, delivers refined petroleum products to market,and provides terminaling and storage services for crude oil and refined petroleum products.
• NGL and Other —Transports, stores, fractionates, exports and markets NGL and provides other fee-based processing services.
• DCP Midstream —Gathers, processes, transports and markets natural gas and transports, fractionates and markets NGL.
Phillips 66 PartnersPhillips 66 Partners, headquartered in Houston, Texas, is an MLP we formed in 2013 to own, operate, develop and acquire primarily fee-basedmidstream assets. At December 31, 2018 , we owned a 54 percent limited partner interest and a 2 percent general partner interest in Phillips 66 Partners,while the public owned a 44 percent limited partner interest and 13.8 million perpetual convertible preferred units.
Phillips 66 Partners’ operations currently consist of crude oil, refined petroleum product and NGL transportation, processing, terminaling and storageassets that are geographically dispersed throughout the United States. The majority of Phillips 66 Partners’ assets are integral to Phillips 66-operatedrefineries.
The results of operations of Phillips 66 Partners are included in Midstream’s Transportation and NGL and Other business lines, based on the nature ofthe activity within the partnership.
Transportation
We own or lease various assets to provide transportation, terminaling and storage services. These assets include crude oil, refined petroleum product,NGL, and natural gas pipeline systems; crude oil, refined petroleum product and NGL terminals; a petroleum coke handling facility; marine vessels;railcars and trucks.
Pipelines and TerminalsAt December 31, 2018 , our Transportation business was comprised of over 21,000 miles of crude oil, refined petroleum product, NGL and natural gaspipeline systems in the United States, including those partially owned or operated by our affiliates. We owned or operated 39 refined petroleum productterminals, 20 crude oil terminals, 4 NGL terminals, a petroleum coke exporting facility and various other storage and loading locations.
The Beaumont Terminal in Nederland, Texas, is the largest terminal in the Phillips 66 portfolio. During 2018, we continued to invest in the terminal byadding 3.5 million barrels of crude oil storage capacity. At December 31, 2018 , the terminal storage capacity was 14.6 million barrels, which included10.9 million barrels of storage capacity for crude oil and 3.7 million barrels of storage capacity for refined petroleum products. A further expansion of2.2 million barrels of crude oil capacity is planned for completion in the first quarter of 2020.
The Bayou Bridge Pipeline joint venture delivers crude oil from Nederland, Texas, to Lake Charles, Louisiana. Phillips 66 Partners has a 40 percentinterest in the joint venture, and our co-venturer serves as the operator. An extension of the pipeline from Lake Charles to St. James, Louisiana, isexpected to be in service in March 2019. The pipeline has a capacity of approximately 480,000 barrels per day (BPD).
2
Table of ContentsIndex to Financial Statements
The Gray Oak Pipeline system will provide crude oil transportation from the Permian Basin and Eagle Ford to destinations in the Corpus Christi andFreeport markets on the Texas Gulf Coast, including the Sweeny Refinery. The planned capacity of the pipeline is 900,000 BPD. At December 31,2018, Phillips 66 Partners had an effective ownership interest in the pipeline system of 48.75 percent. In February 2019, another party exercised itsoption to acquire an interest in the pipeline system that reduced Phillips 66 Partners’ effective ownership interest to 42.25 percent. The pipeline systemis expected to be in service by the end of 2019.
Phillips 66 Partners owns a 25 percent interest in the South Texas Gateway Terminal, which will connect to the Gray Oak Pipeline in Corpus Christi,Texas. The marine terminal, under development by a co-venturer, will have two deepwater docks and an initial storage capacity of 6.5 to 7 millionbarrels. The terminal is expected to start-up by mid-2020.
An open season commenced for the Red Oak Pipeline system on November 12, 2018. As proposed, this pipeline system would provide shippers theopportunity to transport crude oil from Cushing, Oklahoma, to Corpus Christi, Houston, and Beaumont, Texas. The initial throughput capacity on thepipeline is expected to be 400,000 BPD, with potential for further expansion. The pipeline system is anticipated to be placed in service in the fourthquarter of 2020.
An open season also commenced on the Liberty Pipeline system on November 12, 2018. As proposed, this pipeline system would provide shippers theopportunity to transport crude oil from the Rockies and Bakken production areas to Corpus Christi, Texas. The initial throughput capacity on thepipeline is expected to be 350,000 BPD, with potential for further expansion. The pipeline system is anticipated to be placed in service in the fourthquarter of 2020.
3
Table of ContentsIndex to Financial Statements
The following table depicts our ownership interest in major pipeline systems at December 31, 2018 :
Name State of
Origination/Terminus Interest Length(Miles)
Gross Capacity(MBD)
Crude Oil Bakken Pipeline † North Dakota/Texas 25% 1,915 525Bayou Bridge † Texas/Louisiana 40 49 480Clifton Ridge † Louisiana 100 10 260CushPo † Oklahoma 100 62 130Eagle Ford Gathering † Texas 100 28 54Glacier † Montana 79 865 126Line 100 California 100 79 54Line 200 California 100 228 93Line 300 California 100 61 48Line 400 California 100 153 40Line O † Oklahoma/Texas 100 276 37Louisiana Crude Gathering Louisiana 100 80 25New Mexico Crude † New Mexico/Texas 100 227 106North Texas Crude † Texas 100 224 28Oklahoma Crude † Texas/Oklahoma 100 217 100Sacagawea † North Dakota 50 95 175STACK PL † Oklahoma 50 149 250Sweeny Crude Texas 100 56 265West Texas Crude † Texas 100 1,064 156Refined Petroleum Products ATA Line † Texas/New Mexico 50 293 34Borger to Amarillo † Texas 100 93 76Borger-Denver Texas/Colorado 70 397 38Cherokee East † Oklahoma/Missouri 100 287 55Cherokee North † Oklahoma/Kansas 100 29 57Cherokee South † Oklahoma 100 98 46Cross Channel Connector † Texas 100 5 180Explorer † Texas/Indiana 22 1,830 660Gold Line † Texas/Illinois 100 686 120Harbor New Jersey 33 80 171Heartland* Kansas/Iowa 50 49 30LAX Jet Line California 50 19 50Los Angeles Products California 100 22 112Paola Products † Kansas 100 106 96Pioneer Wyoming/Utah 50 562 63Richmond California 100 14 26SAAL † Texas 33 102 33SAAL † Texas 54 19 30Seminoe † Montana/Wyoming 100 342 33Standish † Oklahoma/Kansas 100 92 72Sweeny to Pasadena † Texas 100 120 294Torrance Products California 100 8 161Watson Products California 100 9 238Yellowstone Montana/Washington 46 710 66
4
Table of ContentsIndex to Financial Statements
Name State of
Origination/Terminus Interest Length(Miles)
Gross Capacity(MBD)
NGL Blue Line Texas/Illinois 100% 688 29Brown Line † Oklahoma/Kansas 100 76 26Chisholm Oklahoma/Kansas 50 202 42Conway to Wichita Kansas 100 55 38Medford † Oklahoma 100 42 10Powder River Wyoming/Texas 100 705 14River Parish NGL† Louisiana 100 510 133Sand Hills † Texas 33 1,466 485Skelly-Belvieu Texas 50 571 45Southern Hills † Kansas/Texas 33 941 192Sweeny LPG Texas 100 232 942Sweeny NGL Texas 100 18 204TX Panhandle Y1/Y2 Texas 100 289 61Natural Gas Rockies Express** East to West Ohio/Illinois 25 670 2.6 Bcf/dWest to East Colorado/Ohio 25 1,712 1.8 Bcf/d
† Owned by Phillips 66 Partners; Phillips 66 held a 56 percent ownership interest in Phillips 66 Partners at December 31, 2018 .* Total pipeline system is 419 miles. Phillips 66 has an ownership interest in multiple segments totaling 49 miles.
** Total pipeline system consists of three zones for a total of 1,712 miles. The third zone of the pipeline is bi-directional and can transport 2.6 Bcf/d of natural gas from east to west.
5
Table of ContentsIndex to Financial Statements
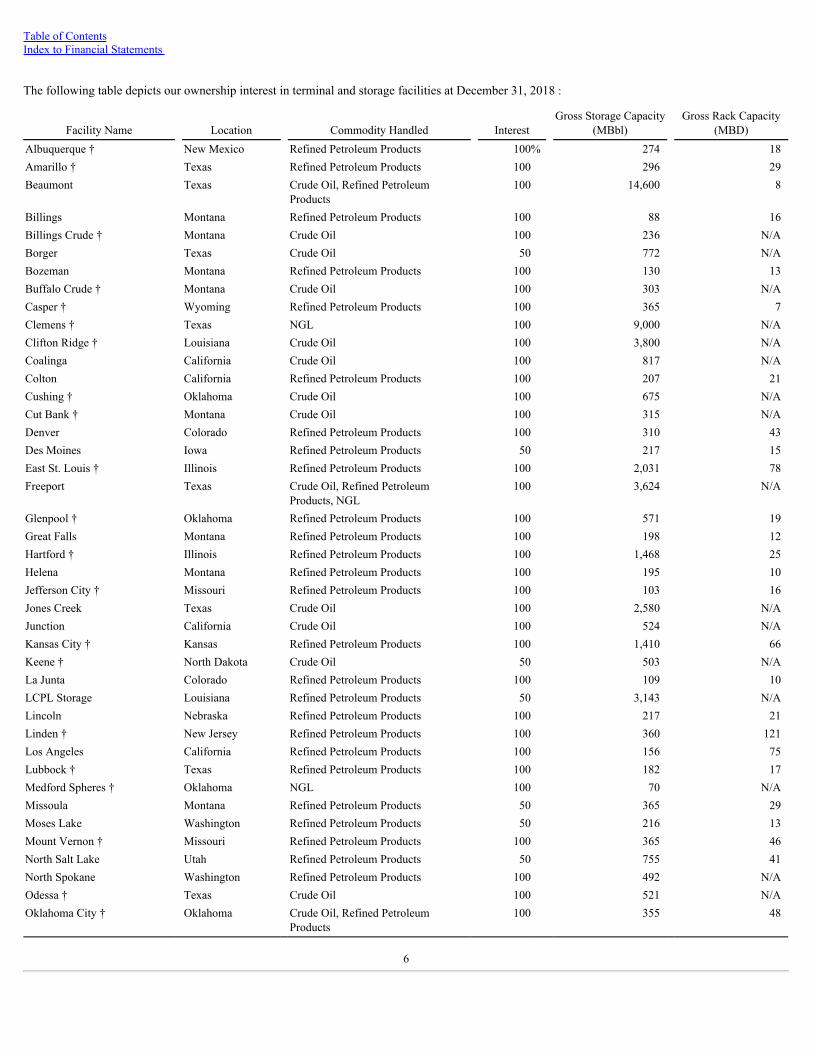
The following table depicts our ownership interest in terminal and storage facilities at December 31, 2018 :
Facility Name Location Commodity Handled Interest Gross Storage Capacity
Tremley Point † New Jersey Refined Petroleum Products 100 1,701 25Westlake Louisiana Refined Petroleum Products 100 128 16Wichita Falls † Texas Crude Oil 100 225 N/AWichita North † Kansas Refined Petroleum Products 100 769 19Wichita South † Kansas Refined Petroleum Products 100 272 N/A† Owned by Phillips 66 Partners; Phillips 66 held a 56 percent ownership interest in Phillips 66 Partners at December 31, 2018 .
The following table depicts our ownership interest in marine, rail and petroleum coke loading and offloading facilities at December 31, 2018 :
Facility Name Location Commodity Handled Interest Gross Loading
Capacity*Marine Beaumont Texas Crude Oil, Refined Petroleum Products 100% 60Clifton Ridge † Louisiana Crude Oil 100 48Freeport Texas Crude Oil, Refined Petroleum Products, NGL 100 46Hartford † Illinois Refined Petroleum Products 100 3Pecan Grove † Louisiana Crude Oil 100 6Portland Oregon Crude Oil 100 10Richmond California Crude Oil 100 3San Bernard Texas Refined Petroleum Products 100 2Tacoma Washington Crude Oil 100 12Tremley Point † New Jersey Refined Petroleum Products 100 7Rail Bayway † New Jersey Crude Oil 100 75Beaumont Texas Crude Oil 100 20Ferndale † Washington Crude Oil 100 30Missoula Montana Refined Petroleum Products 50 41Palermo † North Dakota Crude Oil 70 100Thompson Falls Montana Refined Petroleum Products 50 41Petroleum Coke Lake Charles Louisiana Petroleum Coke 50 N/A† Owned by Phillips 66 Partners; Phillips 66 held a 56 percent ownership interest in Phillips 66 Partners at December 31, 2018 .
* Marine facilities in thousands of barrels per hour; Rail in thousands of barrels daily (MBD).
7
Table of ContentsIndex to Financial Statements
Marine VesselsAt December 31, 2018 , we had 13 international-flagged crude oil, refined petroleum product and NGL tankers and two Jones Act-compliant tankersunder time charter contracts, with capacities ranging in size from 300,000 to 1,100,000 barrels. Additionally, we had a variety of inland and offshoretug/barge units. These vessels are used primarily to transport crude oil and other feedstocks and refined petroleum products for certain of ourrefineries. In addition, the NGL tankers are used to export propane and butane from our fractionation, transportation and storage infrastructure. Truck and RailOur truck and rail fleets support our feedstock and distribution operations. Rail movements are provided via a fleet of more than 10,000 owned andleased railcars. Truck movements are provided through numerous third-party trucking companies, as well as through our wholly owned subsidiary,Sentinel Transportation LLC.
NGL and Other
Our NGL and Other business includes the following:
• A U.S. Gulf Coast NGL market hub comprised of the Freeport LPG Export Terminal and Phillips 66 Partners’ 100,000-BPD SweenyFractionator. These assets are supported by 9 million barrels of gross capacity at Phillips 66 Partners’ Clemens Caverns storage facility. We referto these facilities as the “Sweeny Hub.”
• A 22.5 percent interest in Gulf Coast Fractionators, which owns an NGL fractionation plant in Mont Belvieu, Texas. We operate the facility, andour net share of its capacity is 32,625 BPD.
• A 12.5 percent undivided interest in a fractionation plant in Mont Belvieu, Texas. Our net share of its capacity is 30,250 BPD.
• A 40 percent undivided interest in a fractionation plant in Conway, Kansas. Our net share of its capacity is 43,200 BPD.
• Phillips 66 Partners owns the River Parish NGL logistics system in southeast Louisiana, comprising approximately 500 miles of pipeline and astorage cavern connecting multiple fractionation facilities, refineries and a petrochemical facility.
• Phillips 66 Partners owns a direct one-third interest in both the DCP Sand Hills Pipeline, LLC (Sand Hills) and DCP Southern Hills Pipeline,LLC, which own NGL pipeline systems that connect the Eagle Ford, Permian Basin and Midcontinent production areas to the Mont Belvieu,Texas, market hub.
• Phillips 66 Partners, through its ownership of Merey Sweeny LLC, successor to Merey Sweeny, L.P. (both referred to herein as Merey Sweeny),owns a vacuum distillation unit with a capacity of 125,000 BPD and a delayed coker unit with a capacity of 70,000 BPD located at our SweenyRefinery in Old Ocean, Texas.
Phillips 66 Partners’ Sweeny Fractionator is located adjacent to our Sweeny Refinery in Old Ocean, Texas, and supplies purity ethane to thepetrochemical industry and purity NGL to domestic and global markets. Raw NGL supply to the fractionator is delivered from nearby major pipelines,including the Sand Hills Pipeline. The fractionator is supported by significant infrastructure including connectivity to two NGL supply pipelines, apipeline connecting to the Mont Belvieu market center and the Clemens Caverns storage facility with access to our liquefied petroleum gas (LPG)export terminal in Freeport, Texas.
The Freeport LPG Export Terminal leverages our fractionation, transportation and storage infrastructure to supply petrochemical, heating andtransportation markets globally. The terminal can simultaneously load two ships with refrigerated propane and butane at a combined rate ofapproximately 36,000 barrels per hour. In support of the terminal, we have a 100,000-BPD unit near the Sweeny Fractionator to upgrade domesticpropane for export. In addition, the terminal exports 10,000 to 15,000 BPD of natural gasoline (C5+) produced at the Sweeny Fractionator.
8
Table of ContentsIndex to Financial Statements
At the Sweeny Hub, we are constructing two 150,000-BPD NGL fractionators and associated pipeline infrastructure, and Phillips 66 Partners is adding6 million barrels of storage capacity at Clemens Caverns. DCP Midstream has committed to supply the fractionators with raw NGL and has an option toacquire up to a 30 percent ownership interest in the fractionators. Upon completion of the expansion, expected in late 2020, the Sweeny Hub will have400,000 BPD of NGL fractionation capability and 15 million barrels of storage capacity at Clemens Caverns.
During 2018, Phillips 66 Partners continued development of a new 25,000-BPD isomerization unit at our Lake Charles Refinery to increase productionof higher octane gasoline blend components. The project is expected to be completed in the third quarter of 2019. DCP Midstream
Our Midstream segment includes our 50 percent equity investment in DCP Midstream, which is headquartered in Denver, Colorado. At December 31,2018 , DCP Midstream owned or operated 49 active natural gas processing facilities, with a net processing capacity of approximately 6.7 billion cubicfeet per day (Bcf/d). DCP Midstream’s owned or operated natural gas pipeline systems included gathering services for these facilities, as well as naturalgas transmission, and totaled approximately 62,000 miles of pipeline. DCP Midstream also owned or operated 12 NGL fractionation plants, along withnatural gas and NGL storage facilities, and NGL pipelines.
The residual natural gas, primarily methane, which results from processing raw natural gas, is sold by DCP Midstream at market-based prices tomarketers and end users, including large industrial companies, natural gas distribution companies and electric utilities. DCP Midstream purchases ortakes custody of substantially all of its raw natural gas from producers, principally under contractual arrangements that expose DCP Midstream to theprices of NGL, natural gas and condensate. DCP Midstream also has fee-based arrangements with producers to provide midstream services such asgathering and processing. In addition, DCP Midstream markets a portion of its NGL to us and our equity affiliates under existing contracts.
During 2018, DCP Midstream completed or advanced the following growth projects:
• Construction of the 200-million-cubic-feet-per-day (MMcf/d) Mewbourn 3 natural gas processing plant located in the Denver-Julesburg (DJ)Basin was completed in the third quarter of 2018.
• Continued construction of the 300-MMcf/d O'Connor 2 natural gas processing facility and associated gathering infrastructure in the DJ Basin.The O’Connor 2 facility will have 200 MMcf/d of processing capacity and up to 100 MMcf/d of bypass capacity, which are expected to beplaced into service in the second and third quarters of 2019, respectively.
• Development of the Gulf Coast Express pipeline project (GCX project), in which DCP Midstream owns a 25 percent interest. The GCX projectis designed to transport up to approximately 2 Bcf/d of natural gas to the Gulf Coast markets. The mostly 42-inch pipeline would traverseapproximately 500 miles and be placed in service in the fourth quarter of 2019.
• The Cheyenne Connector pipeline will provide takeaway solutions with capacity of at least 600 MMcf/d for DCP Midstream's DJ Basin assets,connecting natural gas to Rockies Express Pipeline LLC’s Cheyenne Hub, where it can then be delivered to numerous markets across thecountry. DCP Midstream holds an option to invest in this pipeline at a later date.
• Expansion of the Sand Hills Pipeline to 485,000 BPD was completed in the fourth quarter of 2018. This expansion included a partial looping ofthe pipeline and the addition of new pump stations.
9
Table of ContentsIndex to Financial Statements
CHEMICALS
The Chemicals segment consists of our 50 percent equity investment in CPChem, which is headquartered in The Woodlands, Texas. At December 31,2018 , CPChem owned or had joint venture interests in 28 manufacturing facilities located in Belgium, Colombia, Qatar, Saudi Arabia, Singapore andthe United States. Additionally, CPChem has two research and development centers in the United States.
We structure our reporting of CPChem’s operations around two primary business lines: Olefins and Polyolefins (O&P) and Specialties, Aromatics andStyrenics (SA&S). The O&P business line produces and markets ethylene and other olefin products. The ethylene produced is primarily used byCPChem to produce polyethylene, normal alpha olefins (NAO) and polyethylene pipe. The SA&S business line manufactures and markets aromaticsand styrenics products, such as benzene, cyclohexane, styrene and polystyrene. SA&S also manufactures and/or markets a variety of specialty chemicalproducts including organosulfur chemicals, solvents, catalysts, and chemicals used in drilling and mining.
The manufacturing of petrochemicals and plastics involves the conversion of hydrocarbon-based raw material feedstocks into higher-value products,often through a thermal process referred to in the industry as “cracking.” For example, ethylene can be produced by cracking ethane, propane, butane,natural gasoline or certain refinery liquids, such as naphtha and gas oil. Ethylene primarily is used as a raw material in the production of plastics, suchas polyethylene and polyvinyl chloride (PVC). Plastic resins, such as polyethylene, are manufactured in a thermal/catalyst process, and the producedoutput is used as a further raw material for various applications, such as packaging and plastic pipe.
The following table reflects CPChem’s petrochemicals and plastics product capacities at December 31, 2018 :
Millions of Pounds per Year* U.S. WorldwideO&P Ethylene** 11,635 14,110Propylene 2,675 3,180High-density polyethylene 5,305 7,470Low-density polyethylene 620 620Linear low-density polyethylene 1,590 1,590Polypropylene — 310Normal alpha olefins 2,335 2,850Polyalphaolefins 125 255Polyethylene pipe 500 500Total O&P 24,785 30,885 SA&S Benzene 1,600 2,530Cyclohexane 1,060 1,455Styrene 1,050 1,875Polystyrene 835 1,070Specialty chemicals 440 575Total SA&S 4,985 7,505Total O&P and SA&S 29,770 38,390* Capacities include CPChem’s share in equity affiliates and excludes CPChem’s NGL fractionation capacity.
** Effective January 1, 2019, the U.S. and Worldwide ethylene capacities increased to 11,935 million pounds per year and 14,410 million pounds per year, respectively.
10
Table of ContentsIndex to Financial Statements
During 2018, CPChem completed its U.S. Gulf Coast (USGC) Petrochemicals Project. The ethane cracker at CPChem’s Cedar Bayou facility inBaytown, Texas, commenced operations in the second quarter of 2018. Along with the two polyethylene units that started up in the third quarter of2017, the USGC project increased CPChem’s global ethylene and polyethylene capacity by 31 percent from January 1, 2017. Effective January 1, 2019,the capacity of the ethane cracker increased to 3.8 billion pounds per year.
In the fourth quarter of 2018, CPChem permanently shutdown its paraxylene operations in Pascagoula, Mississippi.
11
Table of ContentsIndex to Financial Statements
REFINING
Our Refining segment refines crude oil and other feedstocks into petroleum products (such as gasoline, distillates and aviation fuels) at 13 refineries inthe United States and Europe.
The table below depicts information for each of our owned and joint venture refineries at December 31, 2018 :
** Clean product capacities are maximum rates for each clean product category, independent of each other. They are not additive when calculating the clean product yield capability for eachrefinery.
12
Table of ContentsIndex to Financial Statements
Primary crude oil characteristics and sources of crude oil for our owned and joint venture refineries are as follows:
Characteristics Sources
SweetMedium
SourHeavySour
HighTAN *
UnitedStates Canada
SouthAmerica Europe
Middle East& Africa
Bayway l l l l lHumber l l l l l lMiRO l l l l lAlliance l l l Lake Charles l l l l l l l lSweeny l l l l l l l Wood River l l l l l l Borger l l l l l Ponca City l l l l Billings l l l l Ferndale l l l l Los Angeles l l l l l l lSan Francisco l l l l l l l l* High TAN (Total Acid Number): acid content greater than or equal to 1.0 milligram of potassium hydroxide (KOH) per gram.
Atlantic Basin/Europe Region
Bayway RefineryThe Bayway Refinery is located on the New York Harbor in Linden, New Jersey. Bayway’s facilities include crude distilling, naphtha reforming, fluidcatalytic cracking, solvent deasphalting, hydrodesulfurization and alkylation units. The complex also includes a polypropylene plant with the capacity toproduce up to 775 million pounds per year. The refinery produces a high percentage of transportation fuels, as well as petrochemical feedstocks,residual fuel oil and home heating oil. Refined petroleum products are distributed to East Coast customers by pipeline, barge, railcar and truck.
Humber RefineryThe Humber Refinery is located on the east coast of England in North Lincolnshire, United Kingdom, approximately 180 miles north of London.Humber’s facilities include crude distilling, naphtha reforming, fluid catalytic cracking, hydrodesulfurization, thermal cracking and delayed cokingunits. The refinery has two coking units with associated calcining plants. Humber is the only coking refinery in the United Kingdom, and a producer ofhigh-quality specialty graphite and anode-grade petroleum cokes. The refinery also produces a high percentage of transportation fuels. The majority ofthe light oils produced by the refinery are distributed to customers in the United Kingdom by pipeline, railcar and truck, while the other refinedpetroleum products are exported to the rest of Europe, West Africa and the United States by waterborne cargo.
MiRO RefineryThe MiRO Refinery is located on the Rhine River in Karlsruhe, Germany, approximately 95 miles south of Frankfurt, Germany. MiRO is a jointventure in which we own an 18.75 percent interest. Facilities include crude distilling, naphtha reforming, fluid catalytic cracking, petroleum coking andcalcining, hydrodesulfurization, isomerization, ethyl tert-butyl ether and alkylation units. MiRO produces a high percentage of transportation fuels.Other products produced include petrochemical feedstocks, home heating oil, bitumen, and anode- and fuel-grade petroleum cokes. Refined petroleumproducts are distributed to customers in Germany, Switzerland and Austria by truck, railcar and barge.
13
Table of ContentsIndex to Financial Statements
Gulf Coast Region
Alliance RefineryThe Alliance Refinery is located on the Mississippi River in Belle Chasse, Louisiana, approximately 25 miles southeast of New Orleans, Louisiana. Thesingle-train facility includes crude distilling, naphtha reforming, fluid catalytic cracking, alkylation, hydrodesulfurization, aromatics and delayed cokingunits. Alliance produces a high percentage of transportation fuels. Other products produced include petrochemical feedstocks, home heating oil andanode-grade petroleum coke. A majority of the refined petroleum products are distributed to customers in the southeastern and eastern United Statesthrough major common-carrier pipeline systems and by barge. Additionally, refined petroleum products are exported to customers primarily in LatinAmerica by waterborne cargo.
Lake Charles RefineryThe Lake Charles Refinery is located in Westlake, Louisiana, approximately 150 miles east of Houston, Texas. Refinery facilities include crudedistilling, naphtha reforming, fluid catalytic cracking, alkylation, hydrocracking, hydrodesulfurization and delayed coking units. Refinery facilities alsoinclude a specialty coker and calciner. The refinery produces a high percentage of transportation fuels. Other products produced include off-road diesel,home heating oil, feedstock for our Excel Paralubes joint venture in our M&S segment, and specialty graphite and fuel-grade petroleum cokes. Amajority of the refined petroleum products are distributed to customers in the southeastern and eastern United States by truck, railcar, barge or majorcommon carrier pipelines. Additionally, refined petroleum products are exported to customers primarily in Latin America and West Africa bywaterborne cargo.
Sweeny RefineryThe Sweeny Refinery is located in Old Ocean, Texas, approximately 65 miles southwest of Houston, Texas. Refinery facilities include crude distilling,naphtha reforming, fluid catalytic cracking, alkylation, hydrodesulfurization, aromatics units, and a Phillips 66 Partners owned delayed coking unit. Therefinery produces a high percentage of transportation fuels. Other products include petrochemical feedstocks, home heating oil and fuel-gradepetroleum coke. A majority of the refined petroleum products are distributed to customers throughout the Midcontinent region, southeastern and easternUnited States by pipeline, barge and railcar. Additionally, refined petroleum products are exported to customers primarily in Latin America bywaterborne cargo.
Central Corridor Region
WRB Refining LP (WRB)We are the operator and managing partner of WRB, a 50-percent-owned joint venture that owns the Wood River and Borger refineries.
• Wood River RefineryThe Wood River Refinery is located in Roxana, Illinois, about 15 miles northeast of St. Louis, Missouri, at the confluence of the Mississippi andMissouri rivers. Refinery facilities include crude distilling, naphtha reforming, fluid catalytic cracking, alkylation, hydrocracking,hydrodesulfurization and delayed coking units. The refinery produces a high percentage of transportation fuels. Other products produced includepetrochemical feedstocks, asphalt and fuel-grade petroleum coke. Refined petroleum products are distributed to customers throughout theMidcontinent region by pipeline, railcar, barge and truck.
• Borger Refinery
The Borger Refinery is located in Borger, Texas, in the Texas Panhandle, approximately 50 miles north of Amarillo, Texas. Refinery facilitiesinclude crude distilling, naphtha reforming, fluid catalytic cracking, alkylation, hydrodesulfurization, and delayed coking units, as well as anNGL fractionation facility. The refinery produces a high percentage of transportation fuels, as well as fuel-grade petroleum coke, NGL andsolvents. Refined petroleum products are distributed to customers in West Texas, New Mexico, Colorado and the Midcontinent region bypipeline.
14
Table of ContentsIndex to Financial Statements
Ponca City RefineryThe Ponca City Refinery is located in Ponca City, Oklahoma, approximately 95 miles northwest of Tulsa, Oklahoma. Refinery facilities include crudedistilling, naphtha reforming, fluid catalytic cracking, alkylation, hydrodesulfurization, and delayed coking units. The refinery produces a highpercentage of transportation fuels and anode-grade petroleum coke. Refined petroleum products are primarily distributed to customers throughout theMidcontinent region by company-owned and common-carrier pipelines.
Billings RefineryThe Billings Refinery is located in Billings, Montana. Refinery facilities include crude distilling, naphtha reforming, fluid catalytic cracking, alkylation,hydrodesulfurization and delayed coking units. The refinery produces a high percentage of transportation fuels and fuel-grade petroleum coke. Refinedpetroleum products are distributed to customers in Montana, Wyoming, Idaho, Utah, Colorado and Washington by pipeline, railcar and truck.
West Coast Region
Ferndale RefineryThe Ferndale Refinery is located on Puget Sound in Ferndale, Washington, approximately 20 miles south of the U.S.-Canada border. Facilities includecrude distillation, naphtha reforming, fluid catalytic cracking, alkylation and hydrodesulfurization units. The refinery produces a high percentage oftransportation fuels. Other products produced include residual fuel oil, which is supplied to the northwest marine bunker fuel market. Most of therefined petroleum products are distributed to customers in the northwest United States by pipeline and barge.
Los Angeles RefineryThe Los Angeles Refinery consists of two facilities linked by pipeline located five miles apart in Carson and Wilmington, California, approximately 15miles southeast of Los Angeles. The Carson facility serves as the front end of the refinery by processing crude oil, and the Wilmington facility serves asthe back end of the refinery by upgrading the intermediate products to finished products. Refinery facilities include crude distillation, naphthareforming, fluid catalytic cracking, alkylation, hydrocracking, and delayed coking units. The refinery produces a high percentage of transportation fuels.The refinery produces California Air Resources Board (CARB)-grade gasoline. Other products produced include fuel-grade petroleum coke. Refinedpetroleum products are distributed to customers in California, Nevada and Arizona by pipeline and truck.
San Francisco RefineryThe San Francisco Refinery consists of two facilities linked by a 200-mile pipeline. The Santa Maria facility is located in Arroyo Grande, California,200 miles south of San Francisco, California, while the Rodeo facility is located in the San Francisco Bay Area. Intermediate refined products from theSanta Maria facility are shipped by pipeline to the Rodeo facility for upgrading into finished petroleum products. Refinery facilities include crudedistillation, naphtha reforming, hydrocracking, hydrodesulfurization and delayed coking units, as well as a calciner. The refinery produces a highpercentage of transportation fuels, including CARB-grade gasoline. Other products produced include fuel-grade petroleum coke. The majority of therefined petroleum products are distributed to customers in California by pipeline and barge. Additionally, refined petroleum products are exported tocustomers primarily in Latin America by waterborne cargo.
15
Table of ContentsIndex to Financial Statements
MARKETING AND SPECIALTIES
Our M&S segment purchases for resale and markets refined petroleum products (such as gasolines, distillates and aviation fuels), mainly in the UnitedStates and Europe. In addition, this segment includes the manufacturing and marketing of specialty products (such as base oils and lubricants), as wellas power generation operations.
Marketing
Marketing—United StatesWe market gasoline, diesel and aviation fuel through independently owned outlets that utilize the Phillips 66 , Conoco or 76 brands. At December 31,2018 , we had approximately 7,520 independently owned marketing outlets in 48 states.
Our wholesale operations utilized a network of marketers operating approximately 5,600 outlets. We place a strong emphasis on the wholesale channelof trade because of its lower capital requirements. In addition, we held brand-licensing agreements covering approximately 1,120 sites. Our refinedpetroleum products are marketed on both a branded and unbranded basis. A high percentage of our branded marketing sales are made in theMidcontinent, Rockies and West Coast regions, where our wholesale marketing operations provide efficient off-take from our refineries. We continueto utilize consignment fuel arrangements with several marketers whereby we own the fuel inventory and pay the marketers a fixed monthly fee.
In the Gulf Coast and East Coast regions, most sales are conducted via the unbranded channel of trade, which does not require a highly integratedmarketing and distribution infrastructure to secure product placement for refinery pull through. We are expanding our export capability at our U.S.coastal refineries to meet growing international demand and increase flexibility to provide product to the highest-value markets.
In addition to automotive gasoline and diesel, we produce and market aviation gasoline and jet fuel. Aviation gasoline and jet fuel were sold throughdealers and independent marketers at approximately 800 Phillips 66 -branded locations.
Marketing—InternationalWe have marketing operations in four European countries. Our European marketing strategy is to sell primarily through owned, leased or joint ventureretail sites using a low-cost, high-volume approach. We use the JET brand name to market retail and wholesale products in Austria, Germany and theUnited Kingdom. In addition, we have an equity interest in a joint venture that markets refined petroleum products in Switzerland under the COOPbrand name.
We also market aviation fuels, LPG, heating oils, transportation fuels, marine bunker fuels, bitumen and fuel-grade petroleum coke specialty products tocommercial customers and into the bulk or spot markets in the above countries.
At December 31, 2018 , we had 1,310 marketing outlets in Europe, of which 985 were company owned and 325 were dealer owned. In addition, we hadinterests in 320 additional sites through our COOP joint venture operations in Switzerland.
Specialties
We manufacture lubricants and sell a variety of specialty products, including petroleum coke products, waxes, solvents and polypropylene.
LubricantsWe manufacture and sell automotive, commercial, industrial and specialty lubricants which are marketed worldwide under the Phillips 66, Kendall, RedLine and other private label brands. We also market Group III Ultra-S base oils through an agreement with South Korea’s S-Oil Corporation.
In addition, we own a 50 percent interest in Excel Paralubes LLC (Excel), an operated joint venture that owns a hydrocracked lubricant base oilmanufacturing plant located adjacent to the Lake Charles Refinery. The facility has a nameplate capacity to produce 22,200 BPD of high-quality GroupII clear hydrocracked base oils. Excel markets the produced base oil under the Pure Performance brand. The facility’s feedstock is sourced primarilyfrom our Lake Charles Refinery.
16
Table of ContentsIndex to Financial Statements
Other Specialty ProductsWe market high-quality specialty graphite and anode-grade petroleum cokes in the United States, Europe and Asia for use in a variety of industries thatinclude steel, aluminum, titanium dioxide and battery manufacturing. We also market polypropylene in North America under the COPYLENE brandname for use in consumer products, and market specialty solvents that include pentane, iso-pentane, hexane, heptane and odorless mineral spirits for usein the petrochemical, agriculture and consumer markets. In addition, we market sulfur for use in agricultural and chemical applications, and fuel-gradepetroleum coke for use in the making of cement, glass and power.
Other
Power GenerationWe own a cogeneration power plant located adjacent to the Sweeny Refinery. The plant generates electricity and provides process steam to the refinery,as well as merchant power into the Texas market. The plant has a net electrical output of 440 megawatts and is capable of generating up to 3.6 millionpounds per hour of process steam.
TECHNOLOGY DEVELOPMENT
Our Technology organization conducts applied and fundamental research to support our current business, provide new environmental solutions toaddress governmental regulations, and position us for future growth. Technology programs include evaluating advantaged crudes; and modeling toreduce energy consumption, increase product yield and increase reliability. Our sustainability group is focusing efforts on organic photovoltaicpolymers, solid oxide fuel cells, atmospheric modeling and air chemistry, water use and reuse and renewable fuels. Additionally, we monitor foremerging technologies that could impact our business.
COMPETITION
The Midstream segment, through our equity investment in DCP Midstream and our other operations, competes with numerous integrated petroleumcompanies, as well as natural gas transmission and distribution companies, to deliver components of natural gas to end users in commodity natural gasmarkets. DCP Midstream is one of the leading natural gas gatherers and processors in the United States based on wellhead volumes, and one of thelargest U.S. producers and marketers of NGL, based on published industry sources. Principal methods of competing include economically securing theright to purchase raw natural gas for gathering systems, managing the pressure of those systems, operating efficient NGL processing plants and securingmarkets for the products produced.
In the Chemicals segment, CPChem is ranked among the top 10 producers in many of its major product lines according to published industry sources,based on average 2018 production capacity. Petroleum products, petrochemicals and plastics are typically delivered into the worldwide commoditymarkets. Our Refining and M&S segments compete primarily in the United States and Europe. We are one of the largest refiners of petroleum productsin the United States based on published industry sources. Elements of competition for both our Chemicals and Refining segments include productimprovement, new product development, low-cost structures, ability to run advantaged feedstocks, and efficient manufacturing and distributionsystems. In the marketing portion of the business, competitive factors include product properties and processibility, reliability of supply, customerservice, price and credit terms, advertising and sales promotion, and development of customer loyalty to branded products.
17
Table of ContentsIndex to Financial Statements
GENERAL
At December 31, 2018 , we held a total of 382 active patents in 20 countries worldwide, including 298 active U.S. patents. The overall profitability ofany business segment is not dependent on any single patent, trademark, license or franchise.
In support of our goal to attain zero incidents, we have implemented a comprehensive Health, Safety and Environmental (HSE) management system tosupport consistent management of HSE risks across our enterprise. The management system is designed to ensure that personal safety, process safety,and environmental impact risks are identified, and mitigation steps are taken to reduce the risk. The management system requires periodic audits toensure compliance with government regulations, as well as our internal requirements. Our commitment to continuous improvement is reflected inannual goal setting and performance measurement.
See the environmental information contained in “Management’s Discussion and Analysis of Financial Condition and Results of Operations—CapitalResources and Liquidity—Contingencies” under the captions “Environmental” and “Climate Change.” It includes information on expensed andcapitalized environmental costs for 2018 and those expected for 2019 and 2020 .
Website Access to SEC Reports
Our Internet website address is http://www.phillips66.com . Information contained on our Internet website is not part of this Annual Report on Form 10-K.
Our Annual Reports on Form 10-K, Quarterly Reports on Form 10-Q, Current Reports on Form 8-K and any amendments to these reports filed orfurnished pursuant to Section 13(a) or 15(d) of the Securities Exchange Act of 1934 are available on our website, free of charge, as soon as reasonablypracticable after such reports are filed with, or furnished to, the U.S. Securities and Exchange Commission (SEC). Alternatively, you may access thesereports at the SEC’s website at http://www.sec.gov .
18
Table of ContentsIndex to Financial Statements
Item 1A. RISK FACTORS
You should carefully consider the following risk factors in addition to the other information included in this Annual Report on Form 10-K. Each ofthese risk factors could adversely affect our business, operating results and financial condition, as well as the value of an investment in our commonstock.
Our revenues, operating results and future rate of growth are highly dependent on a number of factors, including fixed and variable expenses (includingthe cost of crude oil, NGL, and other refining and petrochemical feedstocks) and the margin we can derive from selling refined petroleum,petrochemical and plastics products. The prices of feedstocks and our products fluctuate substantially. These prices depend on numerous factors beyondour control, including the global supply and demand for feedstocks and our products, which are subject to, among other things:
• Changes in the global economy and the level of foreign and domestic production of crude oil, natural gas and NGL and refined petroleum,petrochemical and plastics products.
• Availability of feedstocks and refined petroleum products and the infrastructure to transport them.• Local factors, including market conditions, the level of operations of other facilities in our markets, and the volume of products imported and
exported.• Threatened or actual terrorist incidents, acts of war and other global political conditions.• Government regulations.• Weather conditions, hurricanes or other natural disasters.
The price of crude oil influences prices for refined petroleum products. We do not produce crude oil and must purchase all of the crude oil we process.Many crude oils available on the world market will not meet the quality restrictions for use in our refineries. Others are not economical to use due tohigh transportation costs or for other reasons. The prices for crude oil and refined petroleum products can fluctuate differently based on global, regionaland local market conditions, as well as by type and class of products, which can reduce refining margins and could have a significant impact on ourrefining, wholesale marketing and retail operations, revenues, operating income and cash flows. Also, crude oil supply contracts generally have market-responsive pricing provisions. We normally purchase our refinery feedstocks weeks before manufacturing and selling the refined petroleum products.Changes in prices that occur between when we purchase feedstocks and when we sell the refined petroleum products produced from these feedstockscould have a significant effect on our financial results. We also purchase refined petroleum products produced by others for sale to our customers. Pricechanges that occur between when we purchase and sell these refined petroleum products also could have a material adverse effect on our business,financial condition and results of operations.
The price of feedstocks also influences prices for petrochemical and plastics products. Although our Chemicals segment transports and fractionatesfeedstocks to meet a portion of their demand and has certain long-term feedstock supply contracts with others, it is still subject to volatile feedstockprices. In addition, the petrochemicals industry is both cyclical and volatile. Cyclicality occurs when periods of tight supply, resulting in increasedprices and profit margins, are followed by periods of capacity expansion, resulting in oversupply and declining prices and profit margins. Volatilityoccurs as a result of changes in supply and demand for products, changes in energy prices, and changes in various other economic conditions around theworld.
Our ability to obtain credit and capital depends in large measure on the state of the credit and capital markets, which is beyond our control. Our abilityto access credit and capital markets may be restricted at a time when we would like, or need, access to those markets, which could constrain ourflexibility to react to changing economic and business conditions. In addition, the cost and availability of debt and equity financing may be adverselyimpacted by unstable or illiquid market conditions. Protracted uncertainty and illiquidity in these markets also could have an adverse impact on ourlenders, commodity hedging counterparties, or our customers, preventing them from meeting their obligations to us.
19
Table of ContentsIndex to Financial Statements
From time to time, our cash needs may exceed our internally generated cash flow, and our business could be materially and adversely affected if we areunable to obtain necessary funds from financing activities. From time to time, we may need to supplement cash generated from operations withproceeds from financing activities. Uncertainty and illiquidity in financial markets may materially impact the ability of the participating financialinstitutions to fund their commitments to us under our liquidity facilities. Accordingly, we may not be able to obtain the full amount of the fundsavailable under our liquidity facilities to satisfy our cash requirements, and our failure to do so could have a material adverse effect on our operationsand financial position.
Our or Phillips 66 Partners’ credit ratings could be lowered or withdrawn entirely by a rating agency if, in its judgment, the circumstances warrant. If arating agency were to downgrade our rating below investment grade, our or Phillips 66 Partners’ borrowing costs would increase, and our fundingsources could decrease. In addition, a failure by us to maintain an investment grade rating could affect our business relationships with suppliers andoperating partners. For example, our agreement with Chevron regarding CPChem permits Chevron to buy our 50 percent interest in CPChem for fairmarket value if we experience a change in control or if both Standard & Poor’s Financial Services LLC and Moody’s Investors Service, Inc. lower ourcredit ratings below investment grade and the credit rating from either rating agency remains below investment grade for 365 days thereafter, with fairmarket value determined by agreement or by nationally recognized investment banks. As a result of these factors, a downgrade of credit ratings couldhave a materially adverse impact on our future operations and financial position.
Our business is subject to numerous laws and regulations relating to the protection of the environment. These laws and regulations continue to increasein both number and complexity and affect our operations with respect to, among other things:
• The discharge of pollutants into the environment.• Emissions into the atmosphere (such as nitrogen oxides, sulfur dioxide and mercury emissions, and greenhouse gas emissions as they are, or may
become, regulated).• The quantity of renewable fuels that must be blended into motor fuels.• The handling, use, storage, transportation, disposal and cleanup of hazardous materials and hazardous and nonhazardous wastes.• The dismantlement and abandonment of our facilities and restoration of our properties at the end of their useful lives.
We have incurred and will continue to incur substantial capital, operating and maintenance, and remediation expenditures as a result of these laws andregulations. To the extent these expenditures, as with all costs, are not ultimately reflected in the prices of our products and services, our business,financial condition, results of operations and cash flows in future periods could be materially adversely affected.
The U.S. Environmental Protection Agency (EPA) has implemented a Renewable Fuel Standard (RFS) pursuant to the Energy Policy Act of 2005 andthe Energy Independence and Security Act of 2007. The RFS program sets annual quotas for the quantity of renewable fuels (such as ethanol) that mustbe blended into motor fuels consumed in the United States. To provide certain flexibility in compliance options available to the industry, a RenewableIdentification Number (RIN) is assigned to each gallon of renewable fuel produced in, or imported into, the United States. As a producer of petroleum-based motor fuels, we are obligated to blend renewable fuels into the products we produce at a rate that is at least commensurate to the EPA’s quotaand, to the extent we do not, we must purchase RINs in the open market to satisfy our obligation under the RFS program. To the extent the EPAmandates a blending quantity of renewable fuel that exceeds the amount that is commercially feasible to blend into motor fuel (a situation commonlyreferred to as “the blend wall”), our operations could be materially adversely impacted, up to and including a reduction in produced motor fuel.
The U.S. government, including the EPA, as well as several state and international governments, have either considered or adopted legislation orregulations in an effort to reduce greenhouse gas (GHG) emissions. These proposed or promulgated laws apply or could apply in states and/or countrieswhere we have interests or may have interests in the future. In addition, various groups suggest that additional laws may be needed in an effort toaddress climate change, as illustrated by the Paris Agreement negotiated at the 2015 United Nations Conference on Climate Change, referred to as COP21, which entered into force on November 4, 2016. We cannot predict the extent to which any such legislation or regulation will be enacted and, if so,what its provisions would be. To the extent we incur additional costs required to comply with the adoption of new laws and regulations that are notultimately recovered in the prices of our products and services, our business, financial condition, results of operations and cash flows in future periodscould be materially adversely affected. In addition, demand for the refined petroleum products we produce could be adversely affected.
The potential physical effects of climate change on our operations are highly uncertain and depend upon the unique geographic and environmentalfactors present. Examples of such effects include rising sea levels at our coastal facilities, changing storm patterns and intensities, and changingtemperature levels. As many of our facilities are located near coastal areas, rising sea levels may disrupt our ability to operate those facilities ortransport crude oil and refined petroleum products. Extended periods of such disruption could have an adverse effect on our results of operation. Wecould also incur substantial costs to prevent or repair damage to these facilities.
Actions of federal, state, local and international governments through legislation or regulation, executive order, permit or other review of infrastructureor facility development, and commercial restrictions could delay projects, increase costs, limit development, or otherwise reduce our operatingprofitability both in the United States and abroad. Any such actions may affect many aspects of our operations, including:
• Requiring permits or other approvals that may impose unforeseen or unduly burdensome conditions or potentially cause delays in our operations.• Further limiting or prohibiting construction or other activities in environmentally sensitive or other areas.• Requiring increased capital costs to construct, maintain or upgrade equipment or facilities.• Restricting the locations where we may construct facilities or requiring the relocation of facilities.
In addition, the U.S. government can prevent or restrict us from doing business in foreign countries and from doing business with entities affiliated withforeign governments, which can include state oil companies and U.S. subsidiaries of those companies. The Office of Foreign Assets Control (OFAC) ofthe U.S. Department of the Treasury administers and enforces economic and trade sanctions based on U.S. foreign policy and national security matters. For example, sanctions are currently in effect against Venezuela and certain entities affiliated with it. The effect of any such OFAC sanctions coulddisrupt transactions with or operations involving entities affiliated with sanctioned countries, and could limit our ability to obtain optimum crude slatesand other refinery feedstocks and effectively distribute refined petroleum products.
Other risks inherent in doing business internationally include global financial market turmoil; economic volatility and global economic slowdown;currency exchange rate fluctuations and inflationary pressures; import or export restrictions and changes in trade regulations; acts of terrorism, war,civil unrest and other political risks; difficulties in developing, staffing and managing foreign operations; and potentially adverse tax developments. Ifany of these events occur, our businesses and those of our joint ventures may be adversely affected.
Additionally, renewable fuels, alternative energy mandates and energy conservation efforts could reduce demand for refined petroleum products. Taxincentives and other subsidies can make renewable fuels and alternative energy more competitive with refined petroleum products than they otherwisemight be, which may reduce refined petroleum product margins and hinder the ability of refined petroleum products to compete with renewable fuels.
Our basis for approving a large-scale capital project is the expectation that it will deliver an acceptable level of return on the capital invested. We basethese forecasted project economics on our best estimate of future market conditions. Most large-scale projects take several years to complete. Duringthis multi-year period, market conditions can change from those we forecast, and these changes could be significant. Accordingly, we may not be ableto realize our expected returns from a large investment in a capital project, and this could negatively impact our results of operations, cash flows and ourreturn on capital employed.
Certain of our planned expenditures are based upon the assumption that societal sentiment will continue to enable, and existing regulations will remainintact to allow for, the future development, transportation and use of carbon-based fuels. A portion of our growth strategy is dependent on our ability toexpand existing assets and to construct additional assets. Policy decisions relating to the production, refining, transportation and marketing of carbon-based fuels are subject to political pressures and the influence and protests of environmental and other special interest groups. For example, ourMidstream segment’s growth plans include the construction or expansion of pipelines, which can involve numerous regulatory, environmental, political,and legal uncertainties, many of which are beyond our control. Our growth projects may not be completed on schedule or at the budgeted cost. Inaddition, our revenues may not increase immediately upon the expenditure of funds on a particular project. Delays or cost increases related to capitalspending programs could negatively impact our results of operations, cash flows and our return on capital employed.
Our operations are subject to business interruptions due to scheduled refinery turnarounds, unplanned maintenance or unplanned events such asexplosions, fires, refinery or pipeline releases or other incidents, power outages, severe weather, labor disputes, or other natural or man-made disasters,such as acts of terrorism, including cyber-intrusion. The inability to operate one or more of our facilities due to any of these events could significantlyimpair our ability to manufacture our products. Additionally, our manufacturing equipment is becoming increasingly dependent on our informationtechnology systems. A disruption in our information technology systems due to a catastrophic event or security breach could interrupt or damage ouroperations.
Explosions, fires, refinery or pipeline releases or other incidents involving our assets or operations could result in serious personal injury or loss ofhuman life, significant damage to property and equipment, environmental pollution, impairment of operations and substantial losses to us. For assetslocated near populated areas, including residential areas, commercial business centers, industrial sites and other public gathering areas, the level ofdamage resulting from these risks could be greater. Damages resulting from an incident involving any of our assets or operations may result in ourbeing named as a defendant in one or more lawsuits asserting potentially substantial claims or in our being assessed potentially substantial fines bygovernmental authorities. Should any of these risks materialize at any of our equity affiliates, it could have a material adverse effect on the business andfinancial condition of the equity affiliate and negatively impact their ability to make future distributions to us.
The operation of refineries, power plants, fractionators, pipelines, terminals and vessels is inherently subject to the risks of spills, discharges or otherinadvertent releases of petroleum or hazardous substances. If any of these events had previously occurred or occurs in the future in connection with anyof our refineries, pipelines or refined petroleum products terminals, or in connection with any facilities that receive our wastes or by-products fortreatment or disposal, other than events for which we are indemnified, we could be liable for all costs and penalties associated with their remediationunder federal, state, local and international environmental laws or common law, and could be liable for property damage to third parties caused bycontamination from releases and spills.
We maintain insurance coverage in amounts we believe to be prudent against many, but not all, potential liabilities arising from operating hazards.Uninsured liabilities arising from operating hazards, including but not limited to, explosions, fires, refinery or pipeline releases or other incidentsinvolving our assets or operations, could reduce the funds available to us for capital and investment spending and could have a material adverse effecton our business, financial condition, results of operations and cash flows.
We conduct some of our operations, including parts of our Midstream, Refining and M&S segments, and our entire Chemicals segment, through jointventures in which we share control with our joint venture participants. Our joint venture participants may have economic, business or legal interests orgoals that are inconsistent with ours or those of the joint venture, or our joint venture participants may be unable to meet their economic or otherobligations, and we may be required to fulfill those obligations alone. Failure by us, or an entity in which we have a joint venture interest, to adequatelymanage the risks associated with any acquisitions or joint ventures could have a material adverse effect on the financial condition or results ofoperations of our joint ventures and, in turn, our business and operations.
We often utilize the services of third parties to transport crude oil, NGL and refined petroleum products to and from our facilities. In addition to ourown operational risks discussed above, we could experience interruptions of supply or increases in costs to deliver refined petroleum products to marketif the ability of the pipelines or vessels to transport crude oil or refined petroleum products is disrupted because of weather events, accidents,governmental regulations or third-party actions. A prolonged disruption of the ability of a pipeline or vessel to transport crude oil, NGL or refinedpetroleum products to or from one or more of our refineries or other facilities could have a material adverse effect on our business, financial condition,results of operations and cash flows.
An increasing percentage of crude oil supplied to our refineries and the crude oil and gas production of our Midstream segment’s customers is beingproduced from unconventional oil shale reservoirs. These reservoirs require hydraulic fracturing completion processes to release the hydrocarbons fromthe rock so they can flow through casing to the surface. Hydraulic fracturing involves the injection of water, sand and chemicals under pressure into aformation to stimulate hydrocarbon production. The EPA, as well as several state agencies, have commenced studies and/or convened hearingsregarding the potential environmental impacts of hydraulic fracturing activities. At the same time, certain environmental groups have suggested thatadditional laws may be needed to more closely and uniformly regulate the hydraulic fracturing process, and legislation has been proposed to provide forsuch regulation. In addition, some communities have adopted measures to ban hydraulic fracturing in their communities. We cannot predict whether anysuch legislation will ever be enacted and, if so, what its provisions would be. Any additional levels of regulation and permits required with the adoptionof new laws and regulations at the federal or state level could result in our having to rely on higher priced crude oil for our refineries. This could lead todelays, increased operating costs and process prohibitions that could reduce
23
Table of ContentsIndex to Financial Statements
the volumes of natural gas that move through DCP Midstream’s gathering systems and could reduce supplies and increase costs of NGL feedstocks toCPChem’s facilities. This could materially adversely affect our results of operations and the ability of DCP Midstream and CPChem to make cashdistributions to us.
DCP Midstream’s gathering and transportation pipeline systems are connected to or dependent on the level of production from natural gas wells, whichnaturally declines over time. As a result, its cash flows associated with these wells will also decline over time. In order to maintain or increasethroughput levels on its gathering and transportation pipeline systems and NGL pipelines and the asset utilization rates at its natural gas processingplants, DCP Midstream must continually obtain new supplies. The primary factors affecting DCP Midstream’s ability to obtain new supplies of naturalgas and NGL, and to attract new customers to its assets, include the level of successful drilling activity near these assets, prices of, and the demand for,natural gas and crude oil, producers’ desire and ability to obtain necessary permits in an efficient manner, natural gas field characteristics andproduction performance, surface access and infrastructure issues, and its ability to compete for volumes from successful new wells. If DCP Midstreamis not able to obtain new supplies of natural gas to replace the natural decline in volumes from existing wells or because of competition, throughput onits pipelines and the utilization rates of its treating and processing facilities would decline. This could have a material adverse effect on its business,results of operations, financial position and cash flows, and its ability to make cash distributions to us.
The refining and marketing industry is highly competitive with respect to both feedstock supply and refined petroleum product markets. We competewith many companies for available supplies of crude oil and other feedstocks and for outlets for our refined petroleum products. We do not produce anyof our crude oil feedstocks. Some of our competitors, however, obtain a portion of their feedstocks from their own production and some have moreextensive retail outlets than we have. Competitors that have their own production or extensive retail outlets (and greater brand-name recognition) are attimes able to offset losses from refining operations with profits from producing or retailing operations, and may be better positioned to withstandperiods of depressed refining margins or feedstock shortages.
Some of our competitors also have materially greater financial and other resources than we have. Such competitors have a greater ability to bear theeconomic risks inherent in all phases of our business. In addition, we compete with other industries that provide alternative means to satisfy the energyand fuel requirements of our industrial, commercial and individual customers.
We currently use commodity derivative instruments, and we expect to use them in the future. If the instruments we utilize to hedge our exposure tovarious types of risk are not effective, we may incur losses. Derivative transactions involve the risk that counterparties may be unable to satisfy theirobligations to us. The risk of counterparty default is heightened in a poor economic environment.
One of our subsidiaries acts as the general partner of Phillips 66 Partners, a publicly traded master limited partnership. Our control of the generalpartner of Phillips 66 Partners may increase the possibility that we could be subject to claims of breach of fiduciary duties, including claims of conflictsof interest, related to Phillips 66 Partners. Any liability resulting from such claims could have a material adverse effect on our future business, financialcondition, results of operations and cash flows.
In the ordinary course of our business, we collect sensitive data, including personally identifiable information of our customers and employees. Despiteour security measures, our information technology and infrastructure , or information technology and infrastructure of our third-party service providers(e.g., cloud-based service providers), may be vulnerable to attacks by malicious actors or breached due to human error, malfeasance or otherdisruptions. Although we have experienced occasional, actual or attempted breaches of our cybersecurity, none of these breaches has had a materialeffect on our business, operations or reputation (or compromised any customer data). Any such breaches could compromise our networks and theinformation stored there could be accessed, publicly disclosed, lost or stolen. Any such access, disclosure or other loss of information could result inlegal claims or proceedings, liability under laws that protect the privacy of customer information, including the European Union’s General DataProtection Regulation, disrupt the services we provide to customers, and damage our reputation, any of which could adversely affect our business.
Assumptions used in determining projected benefit obligations and the expected return on plan assets for our pension plans and other postretirementbenefit plans are evaluated by us based on a variety of independent sources of market information and in consultation with outside actuaries. If wedetermine that changes are warranted in the assumptions used, such as the discount rate, expected long-term rate of return, or health care cost trend rate,our future pension and postretirement benefit expenses and funding requirements could increase. In addition, several factors could cause actual resultsto differ significantly from the actuarial assumptions that we use. Funding obligations are determined based on the value of assets and liabilities on aspecific date as required under relevant regulations. Future pension funding requirements, and the timing of funding payments, could be affected bylegislation enacted by governmental authorities.
Pursuant to the Indemnification and Release Agreement and certain other agreements with ConocoPhillips entered into in connection with theSeparation, ConocoPhillips agreed to indemnify us for certain liabilities, and we agreed to indemnify ConocoPhillips for certain liabilities. Indemnitiesthat we may be required to provide ConocoPhillips are not subject to any cap, may be significant and could negatively impact our business, particularlyindemnities relating to our actions that could impact the tax-free nature of the distribution of Phillips 66 stock. Third parties could also seek to hold usresponsible for any of the liabilities that ConocoPhillips has agreed to retain. Further, the indemnity from ConocoPhillips may not be sufficient toprotect us against the full amount of such liabilities, and ConocoPhillips may not be able to fully satisfy its indemnification obligations. Moreover, evenif we ultimately succeed in recovering from ConocoPhillips any amounts for which we are held liable, we may be temporarily required to bear theselosses ourselves. Each of these risks could negatively affect our business, results of operations and financial condition.
Notwithstanding the Separation, there are several significant areas where the liabilities of ConocoPhillips may become our obligations. For example,under the Internal Revenue Code and the related rules and regulations, each corporation that was a member of the ConocoPhillips consolidated U.S.federal income tax reporting group during any taxable period or portion of any taxable period ending on or before the effective time of the Separation isjointly and severally liable for the U.S. federal income tax liability of the entire ConocoPhillips consolidated tax reporting group for that taxable period.In connection with the Separation, we entered into the Tax Sharing Agreement with ConocoPhillips that allocates the responsibility for prior periodtaxes of the ConocoPhillips consolidated tax reporting group between us and ConocoPhillips. ConocoPhillips may be unable to pay any prior periodtaxes for which it is responsible, and we could be required to pay the entire amount of such taxes. Other provisions of federal law establish similarliability for other matters, including laws governing tax-qualified pension plans as well as other contingent liabilities.
ConocoPhillips received a private letter ruling from the Internal Revenue Service (IRS) substantially to the effect that, among other things, thedistribution, together with certain related transactions, qualified as a transaction that is generally tax-free for U.S. federal income tax purposes underSections 355 and 368(a)(1)(D) of the Internal Revenue Code. The private letter ruling and the tax opinion that ConocoPhillips received relied on certainrepresentations, assumptions and undertakings, including those relating to the past and future conduct of our business, and neither the private letterruling nor the opinion would be valid if such representations, assumptions and undertakings were incorrect. Moreover, the private letter ruling does notaddress all the issues that are relevant to determining whether the distribution qualified for tax-free treatment. Notwithstanding the private letter rulingand the tax opinion, the IRS could determine the distribution should be treated as a taxable transaction for U.S. federal income tax purposes if itdetermines any of the representations, assumptions or undertakings that were included in the request for the private letter ruling are false or have beenviolated or if it disagrees with the conclusions in the opinion that are not covered by the IRS ruling.
If the IRS were to determine that the distribution failed to qualify for tax-free treatment, in general, ConocoPhillips would be subject to tax as if it hadsold the Phillips 66 common stock in a taxable sale for its fair market value, and ConocoPhillips stockholders who received shares of Phillips 66common stock in the distribution would be subject to tax as if they had received a taxable distribution equal to the fair market value of such shares.
Under the Tax Sharing Agreement, we would generally be required to indemnify ConocoPhillips against any tax resulting from the distribution to theextent that such tax resulted from (i) any of our representations or undertakings being incorrect or violated, or (ii) other actions or failures to act by us.Our indemnification obligations to ConocoPhillips and its subsidiaries, officers and directors are not limited by any maximum amount. If we arerequired to indemnify ConocoPhillips or such other persons under the circumstances set forth in the Tax Sharing Agreement, we may be subject tosubstantial liabilities.
Item 1B. UNRESOLVED STAFF COMMENTS
None.
26
Table of ContentsIndex to Financial Statements
Item 3. LEGAL PROCEEDINGS
The following is a description of reportable legal proceedings, including those involving governmental authorities under federal, state and local lawsregulating the discharge of materials into the environment. While it is not possible to accurately predict the final outcome of these pending proceedings,if any one or more of such proceedings were decided adversely to Phillips 66, we expect there would be no material effect on our consolidated financialposition. Nevertheless, such proceedings are reported pursuant to Securities and Exchange Commission (SEC) regulations.
Our U.S. refineries are implementing two separate consent decrees, regarding alleged violations of the Federal Clean Air Act, with the U.S.Environmental Protection Agency (EPA), five states and one local air pollution agency. Some of the requirements and limitations contained in thedecrees provide for stipulated penalties for violations. Stipulated penalties under the decrees are not automatic, but must be requested by one of theagency signatories. As part of periodic reports under the decrees or other reports required by permits or regulations, we occasionally report matters thatcould be subject to a request for stipulated penalties. If a specific request for stipulated penalties meeting the reporting threshold set forth in SEC rules ismade pursuant to these decrees based on a given reported exceedance, we will separately report that matter and the amount of the proposed penalty.
New MattersIn November 2018, the California Air Resources Board (CARB) demanded penalties to resolve a Notice of Violation (NOV) alleging that initial fuelcertifications submitted by the company in November and December 2016 with respect to eight batches of gasoline were non-compliant with CARBregulations. We agreed to resolve the NOV with a penalty payment of $150,000.
In late 2018, Phillips 66 and the EPA agreed to resolve certain flaring violations alleged to have occurred at our Billings Refinery between May 2010and September 2018. EPA's proposed resolution includes payments of a $150,000 penalty and approximately $220,000 for supplemental environmentalprojects. We are working with the EPA to finalize settlement terms to resolve this matter.
Matters Previously Reported (unresolved or resolved since the quarterly report on Form 10-Q for the quarterly period ended September 30, 2018 )In September 2018, the South Coast Air Quality Management District (District) demanded penalties to resolve nine NOVs issued in 2016 and 2017.The NOVs pertain to alleged violations of air permit requirements or other air pollution regulatory requirements at our Los Angeles Refinery andColton Terminal. This matter was resolved with a settlement payment of $93,500 to the District on December 6, 2018.
In May 2012, the Illinois Attorney General’s office filed and notified us of a complaint with respect to operations at the Wood River Refinery allegingviolations of the Illinois groundwater standards and a third-party’s hazardous waste permit. The complaint seeks as relief remediation of areagroundwater; compliance with the hazardous waste permit; enhanced pipeline and tank integrity measures; additional spill reporting; and fines andpenalties exceeding $100,000. We are working with the Illinois Environmental Protection Agency and Attorney General’s office to resolve theseallegations.
Item 4. MINE SAFETY DISCLOSURES
Not applicable.
27
Table of ContentsIndex to Financial Statements
EXECUTIVE OFFICERS OF THE REGISTRANT
Name Position Held Age* Greg C. Garland Chairman and Chief Executive Officer 61Robert A. Herman Executive Vice President, Refining 59Paula A. Johnson Executive Vice President, Legal and Government Affairs, General Counsel and Corporate
Secretary55
Brian M. Mandell Senior Vice President, Marketing and Commercial 55Kevin J. Mitchell Executive Vice President, Finance and Chief Financial Officer 52Chukwuemeka A. Oyolu Vice President and Controller 49Timothy D. Roberts Executive Vice President, Midstream 57* On February 22, 2019 .
There are no family relationships among any of the officers named above. The Board of Directors annually elects the officers to serve until a successoris elected and qualified or as otherwise provided in our By-Laws. Set forth below is information about the executive officers identified above.
Greg C. Garland is the Chairman and Chief Executive Officer of Phillips 66, a position he has held since June 2014. Previously, Mr. Garland served asPhillips 66’s Chairman, President and Chief Executive Officer from April 2012 to June 2014. Mr. Garland previously served as ConocoPhillips’ SeniorVice President, Exploration and Production—Americas from October 2010 to April 2012, and as President and Chief Executive Officer of CPChemfrom 2008 to 2010.
Robert A. Herman is Executive Vice President, Refining of Phillips 66, a position he has held since September 2017. Previously, Mr. Herman servedPhillips 66 as Executive Vice President, Midstream from June 2014 to September 2017, Senior Vice President, HSE, Projects and Procurement fromFebruary 2014 to June 2014, and Senior Vice President, Health, Safety, and Environment from April 2012 to February 2014.
Paula A. Johnson is Executive Vice President, Legal and Government Affairs, General Counsel and Corporate Secretary of Phillips 66, a position shehas held since October 2016. Previously, Ms. Johnson served as Executive Vice President, Legal, General Counsel and Corporate Secretary of Phillips66 from May 2013 to October 2016.
Brian M. Mandell is Senior Vice President, Marketing and Commercial of Phillips 66, a position he has held since August 2018. Previously, Mr.Mandell served as Senior Vice President, Commercial from November 2016 to August 2018, President, Global Marketing from March 2015 toNovember 2016, and Global Trading Lead, Clean Products, Commercial from May 2012 to March 2015.
Kevin J. Mitchell is Executive Vice President, Finance and Chief Financial Officer of Phillips 66, a position he has held since January 2016.Previously, Mr. Mitchell served as Phillips 66’s Vice President, Investor Relations from September 2014, when he joined the company, to January2016. Prior to joining the company, he served as the General Auditor of ConocoPhillips from May 2010 until September 2014.
Chukwuemeka A. Oyolu is Vice President and Controller of Phillips 66, a position he has held since December 2014. Mr. Oyolu was Phillips 66’sGeneral Manager, Finance for Refining, Marketing and Transportation from May 2012 to February 2014 when he became General Manager, Planningand Optimization.
Timothy D. Roberts is Executive Vice President, Midstream of Phillips 66, a position he has held since August 2018. Previously, Mr. Roberts servedas Executive Vice President, Marketing and Commercial, from January 2017 to August 2018 and as Executive Vice President Strategy and BusinessDevelopment from April 2016 to January 2017. Before joining Phillips 66, Mr. Roberts served in a number of executive roles at LyondellBasellIndustries N.V. since 2011, most recently as Executive Vice President, Global Olefins and Polyolefins from October 2013 to March 2016.
28
Table of ContentsIndex to Financial Statements
PART II
Item 5. MARKET FOR REGISTRANT’S COMMON EQUITY, RELATED STOCKHOLDER MATTERS AND ISSUER PURCHASES OFEQUITY SECURITIES
Phillips 66’s common stock is traded on the New York Stock Exchange under the symbol “PSX.” At January 31, 2019 , our number of stockholders ofrecord was 36,550 .
Performance Graph
The performance graph above includes a peer index (the “Peer Group”) composed of Celanese Corporation; Delek US Holdings, Inc.; EastmanChemical Co.; Enterprise Products Partners, LP; HollyFrontier Corporation; Huntsman Corporation; LyondellBasell Industries N.V.; MarathonPetroleum Corporation; Oneok, Inc.; PBF Energy Inc.; Targa Resources Corp.; Valero Energy Corporation; and Westlake Chemical Corp. Additionally,Andeavor is included as a peer for periods prior to its acquisition by Marathon Petroleum Corporation.
29
Table of ContentsIndex to Financial Statements
Issuer Purchases of Equity Securities
Millions of Dollars
PeriodTotal Number of
Shares Purchased* Average Price Paid
per Share
Total Number of SharesPurchased
as Part of PubliclyAnnounced Plans
or Programs**
Approximate Dollar Value ofShares
that May Yet Be PurchasedUnder the Plans or Programs
* Includes repurchase of shares of common stock from company employees in connection with the company’s broad-based employee incentive plans, when applicable.** As of December 31, 2018 , our Board of Directors has authorized repurchases totaling up to $12 billion of our outstanding common stock. The authorizations from the Board of Directors
do not have expiration dates. The share repurchases are expected to be funded primarily through available cash. The authorized shares will be repurchased from time to time in the openmarket at the company’s discretion, subject to market conditions and other factors, and in accordance with applicable regulatory requirements. We are not obligated to acquire anyparticular amount of common stock and may commence, suspend or discontinue purchases at any time or from time to time without prior notice. Shares of stock repurchased are held astreasury shares.
30
Table of ContentsIndex to Financial Statements
Item 6. SELECTED FINANCIAL DATA
Millions of Dollars Except Per Share Amounts 2018 2017 2016 2015 2014
Sales and other operating revenues* $ 111,461 102,354 84,279 98,975 161,212Income from continuing operations 5,873 5,248 1,644 4,280 4,091Income from continuing operations attributable to
Phillips 66 5,595 5,106 1,555 4,227 4,056Per common share
Net income 5,873 5,248 1,644 4,280 4,797Net income attributable to Phillips 66 5,595 5,106 1,555 4,227 4,762
Per common share Basic 11.87 9.90 2.94 7.78 8.40Diluted 11.80 9.85 2.92 7.73 8.33
Total assets 54,302 54,371 51,653 48,580 48,692Long-term debt 11,093 10,069 9,588 8,843 7,793Cash dividends declared per common share 3.10 2.73 2.45 2.18 1.89* Sales and other operating revenues for the years ended December 31, 2014 through 2017, are presented in accordance with accounting standards in effect prior to our adoption of ASU No.
2014-09 on January 1, 2018. See Note 2—Changes in Accounting Principles, in the Notes to Consolidated Financial Statements, for further discussion regarding our adoption of ASU No.2014-09.
In December 2013, we entered into an agreement to exchange the stock of Phillips Specialty Products Inc. (PSPI), a flow improver business, which wasincluded in our Marketing and Specialties segment, for shares of Phillips 66 common stock owned by the other party. The PSPI share exchange wascompleted in February 2014. Accordingly, the selected income from continuing operations data above for the year ended December 31, 2014, excludesincome from PSPI’s discontinued operations of $706 million.
To ensure full understanding, you should read the selected financial data presented above in conjunction with “Management’s Discussion and Analysisof Financial Condition and Results of Operations” and the consolidated financial statements and accompanying notes included elsewhere in this AnnualReport on Form 10-K.
31
Table of ContentsIndex to Financial Statements
Item 7. MANAGEMENT’S DISCUSSION AND ANALYSIS OF FINANCIAL CONDITION AND RESULTS OF OPERATIONS
Unless otherwise indicated, “the company,” “we,” “our,” “us” and “Phillips 66” are used in this report to refer to the businesses of Phillips 66 andits consolidated subsidiaries.
Management’s Discussion and Analysis is the company’s analysis of its financial performance, financial condition, and significant trends that mayaffect future performance. It should be read in conjunction with the consolidated financial statements and notes thereto included elsewhere in thisAnnual Report on Form 10-K. It contains forward-looking statements including, without limitation, statements relating to the company’s plans,strategies, objectives, expectations and intentions that are made pursuant to the “safe harbor” provisions of the Private Securities Litigation ReformAct of 1995. The words “anticipate,” “estimate,” “believe,” “budget,” “continue,” “could,” “intend,” “may,” “plan,” “potential,” “predict,”“seek,” “should,” “will,” “would,” “expect,” “objective,” “projection,” “forecast,” “goal,” “guidance,” “outlook,” “effort,” “target” and similarexpressions identify forward-looking statements. The company does not undertake to update, revise or correct any of the forward-looking informationunless required to do so under the federal securities laws. Readers are cautioned that such forward-looking statements should be read in conjunctionwith the company’s disclosures under the heading: “CAUTIONARY STATEMENT FOR THE PURPOSES OF THE ‘SAFE HARBOR’ PROVISIONSOF THE PRIVATE SECURITIES LITIGATION REFORM ACT OF 1995.”
The terms “earnings” and “loss” as used in Management’s Discussion and Analysis refer to net income (loss) attributable to Phillips 66. The terms“pre-tax income” or “pre-tax loss” as used in Management’s Discussion and Analysis refer to income (loss) before income taxes.
EXECUTIVE OVERVIEW AND BUSINESS ENVIRONMENT
Phillips 66 is an energy manufacturing and logistics company with midstream, chemicals, refining, and marketing and specialties businesses. AtDecember 31, 2018 , we had total assets of $54.3 billion .
Executive Overview
In 2018 , we reported earnings of $5.6 billion , generated $7.6 billion in cash from operating activities and raised net proceeds of $1.5 billion from theissuance of senior notes. We used available cash primarily for repurchases of our common stock of $4.6 billion , capital expenditures and investmentsof $2.6 billion , dividend payments on our common stock of $1.4 billion and the early repayment of $550 million of debt. We ended 2018 with $3.0billion of cash and cash equivalents and approximately $5.6 billion of total committed capacity available under our credit facilities.
We continue to focus on the following strategic priorities:
• Operating Excellence. Our commitment to operating excellence guides everything we do. We are committed to protecting the health and safetyof everyone who has a role in our operations and the communities in which we operate. Continuous improvement in safety, environmentalstewardship, reliability and cost efficiency is a fundamental requirement for our company and employees. We employ rigorous training andaudit programs to drive ongoing improvement in both personal and process safety as we strive for zero incidents. Since we cannot controlcommodity prices, controlling operating expenses and overhead costs, within the context of our commitment to safety and environmentalstewardship, is a high priority. Senior management actively monitors these costs. We are committed to protecting the environment and strive toreduce our environmental footprint throughout our operations. Optimizing utilization rates at our refineries through reliable and safe operationsenables us to capture the value available in the market in terms of prices and margins. During 2018 , our worldwide refining crude oil capacityutilization rate was 95 percent .
32
Table of ContentsIndex to Financial Statements
• Growth. We have budgeted $3.2 billion in capital expenditures and investments in 2019, including $0.9 billion for Phillips 66 Partners LP(Phillips 66 Partners). The Phillips 66 Partners’ capital budget includes $0.3 billion of capital expected to be cash funded by noncontrollinginterests. Additionally, our share of expected self-funded capital spending by joint ventures DCP Midstream, LLC (DCP Midstream), ChevronPhillips Chemical Company LLC (CPChem) and WRB Refining LP (WRB) in 2019 is $1.2 billion . In Midstream, we will continue buildingout our integrated logistics infrastructure network, including pipelines, storage, export and fractionation facilities. In Chemicals, CPChem’sgrowth capital will fund continuing development of a second U.S. Gulf Coast petrochemicals project and debottlenecking opportunities onexisting assets. Growth capital in Refining will be directed toward high-return projects to enhance the yield of higher-value products, as well asother low-capital, quick-payout projects, while in Marketing and Specialties (M&S) it will be to further grow and enhance retail sites inEurope.
• Returns. We plan to improve refining returns by increasing throughput of advantaged feedstocks, disciplined capital allocation and portfoliooptimization. A disciplined capital allocation process ensures we focus investments in projects that generate competitive returns throughout thebusiness cycle. In 2018 , our Midstream segment benefited from higher equity earnings and cash distributions from our investments in jointventure pipelines. Our Refining segment maintained a strong clean product yield and a high advantaged crude oil throughput rate at our U.S.refineries. Additionally, our M&S segment continued to enhance our network and brand by re-imaging sites in the United States.
• Distributions. We believe shareholder value is enhanced through, among other things, consistent growth of regular dividends, complementedby share repurchases. We increased our quarterly dividend rate by 14 percent during 2018 , and have increased it every year since thecompany’s inception in 2012. Regular dividends demonstrate the confidence our Board of Directors and management have in our capitalstructure and operations’ capability to generate free cash flow throughout the business cycle. In 2018 , we repurchased $4.6 billion , orapproximately 48 million shares, of our common stock. At the discretion of our Board of Directors, we plan to increase dividends annually andfund our share repurchase program while continuing to invest in the growth of our business.
• High-Performing Organization. We strive to attract, develop and retain individuals with the knowledge and skills to implement our businessstrategy and who support our values and culture. Throughout the company, we focus on getting results in the right way and believe success isboth what we do and how we do it. We encourage collaboration throughout our company, while valuing differences, respecting diversity, andcreating a great place to work. We foster an environment of learning and development through structured programs focused on enhancingfunctional and technical skills where employees are engaged in our business and committed to their own, as well as the company’s, success.
33
Table of ContentsIndex to Financial Statements
Business Environment
The price of U.S. benchmark crude oil, West Texas Intermediate (WTI) at Cushing, Oklahoma, increased to an average of $64.92 per barrel during2018, compared with an average of $50.90 per barrel in 2017. The WTI discount versus the international benchmark Dated Brent widened in 2018 ,compared with 2017, due to growing U.S. crude production. A widening differential generally benefits our results. Over the course of 2018, commodityprices had both favorable and unfavorable impacts on our businesses that vary by segment.
The Midstream segment, which includes our 50 percent equity investment in DCP Midstream, contains fee-based operations that are not directlyexposed to commodity price risk, as well as operations that are directly linked to natural gas liquids (NGL) prices, natural gas prices and crude oilprices. Natural gas prices were relatively flat in 2018, compared with 2017, while NGL prices were higher in 2018 due to higher global crude oil pricesand increased domestic demand for ethane. The Chemicals segment consists of our 50 percent equity investment in CPChem. The chemicals and plastics industry is mainly a commodity-basedindustry where the margins for key products are based on supply and demand, as well as cost factors. During 2018, the high-density polyethylene chainmargin contracted mainly due to rapidly expanding North American supply. In addition, lower naptha-based feedstock costs internationally narrowedthe difference between naptha-based and ethane-based margins. However, North American ethane-based crackers integrated through ethylenederivatives continue to benefit from a feedstock price advantage associated with abundant domestic supply and continue to capture a higherpolyethylene chain margin than crackers in most other regions of the world.
Our Refining segment results are driven by several factors, including refining margins, cost control, refinery throughput, feedstock costs, product yieldsand turnaround activity. Industry crack spread indicators, the difference between market prices for refined petroleum products and crude oil, are used toestimate refining margins. During 2018 , the U.S. 3:2:1 crack spread (three barrels of crude oil producing two barrels of gasoline and one barrel ofdiesel) decreased compared with 2017, primarily due to lower gasoline crack spreads caused by higher refinery utilization. The average NorthwestEurope crack spread increased slightly in 2018, compared with 2017, due to higher distillate prices.
Results for our M&S segment depend largely on marketing fuel margins, lubricant margins, and other specialty product margins. While M&S marginsare primarily driven by market factors, largely determined by the relationship between supply and demand, marketing fuel margins, in particular, areinfluenced by the trend in spot prices for refined petroleum products. Generally speaking, a downward trend of spot prices has a favorable impact onmarketing fuel margins, while an upward trend of spot prices has an unfavorable impact on marketing fuel margins.
34
Table of ContentsIndex to Financial Statements
RESULTS OF OPERATIONS
Basis of Presentation
During the fourth quarter of 2018, the segment performance measure used by our chief executive officer to assess performance and allocate resourceswas changed from “net income” to “income before income taxes.” Prior-period segment information has been recast to conform to the currentpresentation.
Consolidated Results
A summary of income (loss) before income taxes by business segment with a reconciliation to net income attributable to Phillips 66 follows:
Millions of Dollars Year Ended December 31
2018 2017 2016
Midstream $ 1,181 638 403Chemicals 1,025 716 839Refining 4,535 2,076 435Marketing and Specialties 1,557 1,020 1,261Corporate and Other (853) (895) (747)Income before income taxes 7,445 3,555 2,191Income tax expense (benefit) 1,572 (1,693) 547Net income 5,873 5,248 1,644Less: net income attributable to noncontrolling interests 278 142 89Net income attributable to Phillips 66 $ 5,595 5,106 1,555
2018 vs. 2017
Our earnings increased $489 million , or 10 percent , in 2018 , mainly reflecting:
• Higher realized refining and marketing margins.
• Higher earnings from equity affiliates in our Midstream and Chemicals segments.
• A lower U.S. federal corporate income tax rate beginning January 1, 2018, as a result of the U.S. Tax Cuts and Jobs Act (the Tax Act) enactedin December 2017.
These increases were partially offset by:
• A $2,735 million provisional income tax benefit from the enactment of the Tax Act recognized in December 2017, primarily due to therevaluation of deferred income taxes.
• A $261 million noncash, after-tax gain from the consolidation of Merey Sweeny, L.P., predecessor to Merey Sweeny LLC (both referred toherein as Merey Sweeny), in 2017.
• Higher net income attributable to noncontrolling interests primarily due to the contribution of assets to Phillips 66 Partners in the fourth quarterof 2017.
• Higher interest and debt expense.
35
Table of ContentsIndex to Financial Statements
2017 vs. 2016
Our earnings increased $3,551 million , or 228 percent , in 2017 , primarily resulting from:
• Recognition of the $2,735 million provisional income tax benefit from the enactment of the Tax Act in December 2017.
• Higher realized refining margins.
• Recognition of the $261 million after-tax gain from the consolidation of Merey Sweeny.
• Improved equity earnings from affiliates in our Midstream segment.
These increases were partially offset by:
• Increased costs due to Hurricane Harvey, primarily impacting CPChem in our Chemicals segment.
• Lower realized marketing margins.
• Higher interest and debt expense.
See the “Segment Results” section for additional information on our segment results.
36
Table of ContentsIndex to Financial Statements
Income Statement Analysis
2018 vs. 2017
Sales and other operating revenues and purchased crude oil and products increased 9 percent and 23 percent , respectively, in 2018 . The increases weremainly due to higher prices for refined petroleum products, crude oil and NGL. The increase in sales and other operating revenues was partially offsetby a change in the presentation of excise taxes on sales of refined petroleum products resulting from our adoption of Financial Accounting StandardBoard (FASB) Accounting Standards Update (ASU) No. 2014-09, “Revenue from Contracts with Customers (Topic 606),” on January 1, 2018. As partof our adoption of this ASU, prospectively from January 1, 2018, our presentation of excise taxes on sales of refined petroleum products changed to anet basis from a gross basis. As a result, the “Sales and other operating revenues” and “Taxes other than income taxes” lines on our consolidatedstatement of income for the year ended December 31, 2018 , are not presented on a comparable basis to the years ended December 31, 2017 and 2016 .See Note 1—Summary of Significant Accounting Policies and Note 2—Changes in Accounting Principles , in the Notes to Consolidated FinancialStatements, for further information on our presentation of excise taxes on sales of refined petroleum products and our adoption of this ASU,respectively.
Equity in earnings of affiliates increased 55 percent in 2018 , primarily resulting from higher equity in earnings from WRB, CPChem and affiliates inour Midstream segment.
• Equity in earnings of WRB increased $483 million, primarily due to higher realized margins driven by improved feedstock advantage.
• Equity in earnings of CPChem increased $312 million, primarily due to commencement of full operations at CPChem’s new U.S. Gulf Coastpetrochemicals assets and lower hurricane-related costs and downtime in 2018.
• Equity in earnings for our Midstream segment increased $222 million, primarily due to higher volumes on affiliate pipelines, including theBakken Pipeline, which operated for a full year in 2018.
Other income decreased $460 million in 2018 . We recognized a noncash, pre-tax gain of $423 million in February 2017 related to the consolidation ofMerey Sweeny. See Note 5—Business Combinations , in the Notes to Consolidated Financial Statements, for additional information. Taxes other than income taxes decreased 97 percent in 2018 . The decrease was primarily attributable to the change in our presentation of excise taxeson sales of refined petroleum products resulting from our adoption of ASU No. 2014-09 on January 1, 2018. See the “Sales and other operatingrevenues” section above for further discussion.
Interest and debt expense increased 15 percent in 2018 . The increase was due to higher average debt principal balances resulting from our issuance ofsenior notes totaling $1,500 million in March 2018 and Phillips 66 Partners’ issuance of senior notes totaling $650 million in October 2017.
Income tax expense (benefit) was an expense in 2018, compared with a benefit in 2017. The benefit in 2017 was due to the recognition of a provisionalincome tax benefit of $2,735 million from the enactment of the Tax Act in December 2017. The benefit from the Tax Act was primarily due to therevaluation of deferred income taxes. Excluding this benefit, income tax expense increased in 2018 due to higher income before income taxes, partiallyoffset by the reduction of the U.S. federal corporate income tax rate from 35 percent to 21 percent beginning January 1, 2018, as a result of the Tax Act.See Note 21—Income Taxes , in the Notes to Consolidated Financial Statements, for more information regarding our income taxes.
Net income attributable to noncontrolling interests increased $136 million in 2018 , primarily due to the contribution of assets to Phillips 66 Partners inthe fourth quarter of 2017. See Note 27—Phillips 66 Partners LP , in the Notes to Consolidated Financial Statements, for more information.
37
Table of ContentsIndex to Financial Statements
2017 vs. 2016
Sales and other operating revenues and purchased crude oil and products increased 21 percent and 27 percent , respectively, in 2017 . The increaseswere primarily due to higher prices for refined petroleum products, crude oil and NGL.
Equity in earnings of affiliates increased 22 percent in 2017 , primarily resulting from higher equity in earnings from DCP Midstream and otheraffiliates in our Midstream segment, as well as WRB, partially offset by lower results from CPChem.
• Equity in earnings from our Midstream segment increased $270 million due to improved results from DCP Midstream, primarily driven byimproved margins, as well as higher equity in earnings from our pipeline affiliates, including our joint ventures that own the Bakken Pipeline,which started commercial operations in June 2017.
• Equity in earnings of WRB increased $207 million, primarily due to higher market crack spreads, partially offset by lower feedstock advantage.
• Equity in earnings of CPChem decreased $120 million, primarily due to hurricane-related costs and downtime.
Other income increased $447 million in 2017 . We recognized a noncash, pre-tax gain of $423 million in February 2017 related to the consolidation ofMerey Sweeny. See Note 5—Business Combinations , in the Notes to Consolidated Financial Statements, for additional information.
Operating expenses increased 10 percent in 2017 . This increase was mainly due to the consolidation of a transportation joint venture in December2016, as well as higher refining turnaround expenses and utility costs, pension settlement expense, and costs associated with a full year of operations atthe Freeport LPG Export Terminal. These increases were partially offset by lower costs due to the sale of the Whitegate Refinery in 2016.
Depreciation and amortization increased 13 percent in 2017 due to the Freeport LPG Export Terminal beginning operations in late 2016, as well asother assets placed in service in 2017.
Interest and debt expense increased 30 percent in 2017 . This increase was primarily driven by lower capitalized interest due to the completion of majorprojects, including completion of the Freeport LPG Export Terminal project in late 2016, as well as higher average debt principal balances.
Income tax expense (benefit) was a benefit in 2017 , compared with expense in 2016, primarily due to the $2,735 million provisional income tax benefitfrom the enactment of the Tax Act in December 2017. The benefit from the Tax Act was primarily due to the revaluation of deferred income taxes. Thisbenefit was partially offset by higher income tax expense from increased income before income taxes. See Note 21—Income Taxes , in the Notes toConsolidated Financial Statements, for more information regarding our income taxes.
Net income attributable to noncontrolling interests increased $53 million in 2017 , primarily due to the contributions of assets to Phillips 66 Partnersduring 2017 and late 2016. See Note 27—Phillips 66 Partners LP , in the Notes to Consolidated Financial Statements, for more information.
38
Table of ContentsIndex to Financial Statements
Segment Results
Midstream
Year Ended December 31 2018 2017 2016 Millions of DollarsIncome (Loss) Before Income Taxes Transportation $ 770 530 442NGL and Other 305 32 (5)DCP Midstream 106 76 (34)Total Midstream $ 1,181 638 403
* Pipelines represent the sum of volumes transported through each separately tariffed consolidated pipeline segment. Prior year volumes have been recast to exclude our share of equityvolumes from Yellowstone Pipe Line Company and Lake Charles Pipe Line Company.
Dollars Per GallonWeighted-Average NGL Price* DCP Midstream $ 0.75 0.62 0.46* Based on index prices from the Mont Belvieu market hub, which are weighted by NGL component.
The Midstream segment provides crude oil and refined petroleum product transportation, terminaling and processing services, as well as natural gas andNGL transportation, storage, processing and marketing services, mainly in the United States. This segment includes our master limited partnership(MLP), Phillips 66 Partners, as well as our 50 percent equity investment in DCP Midstream, which includes the operations of its MLP, DCP Midstream,LP (DCP Partners).
2018 vs. 2017
Pre-tax income from the Midstream segment increased $543 million in 2018 , compared with 2017 , due to improved results across all business lines.
Pre-tax income from our Transportation business increased $240 million in 2018 , compared with 2017 . The increase was mainly driven by highervolumes, tariffs and storage rates from our portfolio of consolidated and joint venture assets. These increases were partially offset by a decrease inequity earnings from Rockies Express Pipeline LLC (REX) due to a favorable settlement recorded in 2017.
Pre-tax income from our NGL and Other business increased $273 million in 2018 , compared with 2017 . The increase was primarily due to thecontribution of Merey Sweeny to Phillips 66 Partners in October 2017, inventory impacts, improved cargo margins and volumes, and higher equityearnings from pipeline affiliates due to increased volumes.
39
Table of ContentsIndex to Financial Statements
Pre-tax income from our investment in DCP Midstream increased $30 million in 2018 , compared with 2017 . The increase was primarily due to higherequity earnings from affiliates as a result of increased volumes, timing of incentive distribution income allocations from DCP Partners, and favorablehedging results. These increases were partially offset by higher asset impairments and operating costs in 2018.
See the “Executive Overview and Business Environment” section for information on market factors impacting 2018 results.
2017 vs. 2016
Pre-tax income from the Midstream segment increased $235 million in 2017 , compared with 2016 , due to improved results across all business lines.
Pre-tax income from our Transportation business increased $88 million in 2017 , compared with 2016 . The improvement was mainly driven byincreased equity earnings from affiliates, including our joint ventures that own the Bakken Pipeline, which started commercial operations in June 2017,as well as REX due to our share of a favorable breach of contract settlement claim. These increases were partially offset by higher operating costs.
Pre-tax income from our NGL and Other business increased $37 million in 2017 , compared with 2016 . The increase reflected a full year of operationsat the Freeport LPG Export Terminal, the contribution of Merey Sweeny to Phillips 66 Partners in October 2017, and higher equity earnings from DCPSand Hills Pipeline, LLC (Sand Hills), partially offset by lower realized margins.
Pre-tax income from our investment in DCP Midstream increased $110 million in 2017 , compared with 2016 . The increase was primarily due toimproved margins driven by higher average NGL and natural gas prices, and improved hedging results.
40
Table of ContentsIndex to Financial Statements
Chemicals
Year Ended December 31 2018 2017 2016 Millions of Dollars
Income Before Income Taxes $ 1,025 716 839
Millions of PoundsCPChem Externally Marketed Sales Volumes * Olefins and Polyolefins 18,435 15,870 16,011Specialties, Aromatics and Styrenics 4,931 4,618 4,911 23,366 20,488 20,922* Represents 100 percent of CPChem’s outside sales of produced petrochemical products, as well as commission sales from equity affiliates.
Olefins and Polyolefins Capacity Utilization (percent) 94% 87 91
The Chemicals segment consists of our 50 percent interest in CPChem, which we account for under the equity method. CPChem uses NGL and otherfeedstocks to produce petrochemicals. These products are then marketed and sold or used as feedstocks to produce plastics and other chemicals. Westructure our reporting of CPChem’s operations around two primary business lines: Olefins and Polyolefins (O&P) and Specialties, Aromatics andStyrenics (SA&S). The O&P business line produces and markets ethylene and other olefin products. Ethylene produced is primarily consumed withinCPChem for the production of polyethylene, normal alpha olefins and polyethylene pipe. The SA&S business line manufactures and markets aromaticsand styrenics products, such as benzene, cyclohexane, styrene and polystyrene. SA&S also manufactures and/or markets a variety of specialty chemicalproducts. Unless otherwise noted, amounts referenced below reflect our net 50 percent interest in CPChem.
2018 vs. 2017
Pre-tax income from the Chemicals segment increased $309 million in 2018 , compared with 2017 . The increased results reflected the commencementof full operations at CPChem’s new U.S. Gulf Coast petrochemicals assets in the second quarter of 2018, which resulted in higher production and salesof polyethylene and ethylene, partially offset by lower capitalized interest. Additionally, lower hurricane-related costs and downtime, as well as lowerimpairment charges, contributed to the increased results in 2018.
See the “Executive Overview and Business Environment” section for information on market factors impacting CPChem’s 2018 results.
2017 vs. 2016
Pre-tax income from the Chemicals segment decreased $123 million in 2017 , compared with 2016 . The decrease was primarily driven by higher costsand lower volumes due to Hurricane Harvey, as well as lower margins. These items were partially offset by lower impairment charges, higher equity inearnings from an O&P affiliate due to lower turnaround costs and a gain on the sale of CPChem’s K-Resin ® styrene-butadiene copolymers business.CPChem recognized impairment charges of $127 million and $177 million in 2017 and 2016, respectively, due to lower demand and margin factors. Asa result of these impairments, pre-tax income from the Chemicals segment was reduced by $64 million and $89 million in 2017 and 2016, respectively.
As a result of Hurricane Harvey, CPChem’s Cedar Bayou facility in Baytown, Texas, experienced severe flooding, which caused it to shut downoperations in the third quarter of 2017. This facility restarted in phases during the fourth quarter of 2017. Startup of CPChem’s U.S. Gulf CoastPetrochemicals Project was delayed by the flooding.
41
Table of ContentsIndex to Financial Statements
Refining
Year Ended December 31 2018 2017 2016 Millions of DollarsIncome (Loss) Before Income Taxes Atlantic Basin/Europe $ 567 448 187Gulf Coast 1,040 809 69Central Corridor 2,817 755 367West Coast 111 64 (188)Worldwide $ 4,535 2,076 435 Dollars Per BarrelIncome (Loss) Before Income Taxes Atlantic Basin/Europe $ 3.05 2.25 0.85Gulf Coast 3.55 2.83 0.24Central Corridor 26.50 8.19 3.74West Coast 0.81 0.48 (1.49)Worldwide 6.29 2.92 0.60 Realized Refining Margins* Atlantic Basin/Europe $ 10.32 8.25 6.26Gulf Coast 9.48 7.07 5.49Central Corridor 22.22 12.44 8.70West Coast 11.20 10.49 9.15Worldwide 12.99 9.13 6.99* See the “Non-GAAP Reconciliations” section for a reconciliation of this non-GAAP measure to the most directly comparable GAAP measure, income (loss) before income taxes per barrel.
42
Table of ContentsIndex to Financial Statements
Thousands of Barrels Daily Year Ended December 31 2018 2017 2016Operating Statistics Refining operations*
The Refining segment refines crude oil and other feedstocks into petroleum products (such as gasoline, distillates and aviation fuels) at 13 refineries inthe United States and Europe.
2018 vs. 2017
Pre-tax income for the Refining segment increased $2,459 million in 2018 , compared with 2017 . The increase was primarily due to higher realizedrefining margins, partially offset by a noncash gain of $423 million recognized on the consolidation of Merey Sweeny in February 2017.
The increased realized refining margins were primarily driven by higher feedstock advantage, improved premium coke margins, and increasedoptimization benefits from using our integrated logistics network to capture market opportunities related to widening Bakken, Canadian and otherinland crude differentials. Improved clean product differentials and lower renewable identification number (RIN) costs also benefited margins. Theseitems were partially offset by a decline in market crack spreads.
See the “Executive Overview and Business Environment” section for information on industry crack spreads and other market factors impacting thisyear’s results.
Our worldwide refining crude oil capacity utilization rate was 95 percent in both 2018 and 2017 .
43
Table of ContentsIndex to Financial Statements
2017 vs. 2016
Pre-tax income for the Refining segment increased $1,641 million in 2017 , compared with 2016 . The increase was primarily due to higher realizedrefining margins and West Coast volumes, as well as a noncash gain of $423 million recognized on the consolidation of Merey Sweeny, partially offsetby higher turnaround expenses, utilities costs and pension settlement expense. The higher realized refining margins primarily resulted from improvedmarket crack spreads and secondary product margins, partially offset by lower feedstock advantage.
See Note 5—Business Combinations , in the Notes to Consolidated Financial Statements, for additional information on the consolidation of MereySweeny in February 2017 and the subsequent contribution of our ownership interest in Merey Sweeny to Phillips 66 Partners in October 2017.
Our worldwide refining crude oil capacity utilization rate was 95 percent in 2017 , compared with 96 percent in 2016 . The decrease was primarilyattributable to higher turnaround activities and unplanned downtime, partially offset by improved market conditions.
44
Table of ContentsIndex to Financial Statements
Marketing and Specialties
Year Ended December 31 2018 2017 2016 Millions of DollarsIncome Before Income Taxes Marketing and Other $ 1,306 808 1,044Specialties 251 212 217Total Marketing and Specialties $ 1,557 1,020 1,261 Dollars Per BarrelIncome Before Income Taxes U.S. $ 1.21 0.89 1.15International 5.00 2.23 2.36 Realized Marketing Fuel Margins* U.S. $ 1.62 1.48 1.64International 6.87 4.21 4.05*See the “Non-GAAP Reconciliations” section for a reconciliation of this non-GAAP measure to the most directly comparable GAAP measure, income before income taxes per barrel. Dollars Per GallonU.S. Average Wholesale Prices* Gasoline $ 2.20 1.87 1.62Distillates 2.29 1.85 1.48* On third-party branded refined petroleum product sales, excluding excise taxes. Thousands of Barrels DailyMarketing Refined Petroleum Product Sales Gasoline 1,195 1,246 1,238Distillates 975 931 947Other 18 18 16 2,188 2,195 2,201
The M&S segment purchases for resale and markets refined petroleum products (such as gasoline, distillates and aviation fuels), mainly in the UnitedStates and Europe. In addition, this segment includes the manufacturing and marketing of specialty products (such as base oils and lubricants), as wellas power generation operations.
2018 vs. 2017
Pre-tax income from the M&S segment increased $537 million in 2018 , compared with 2017 . The increase was primarily due to higher realizedmarketing fuel margins, mainly driven by international marketing, benefits from the retroactive extension of the 2017 U.S. biodiesel blender’s taxincentive in early 2018, as well as improved specialty product service margins.
See the “Executive Overview and Business Environment” section for information on marketing fuel margins and other market factors impacting 2018results.
2017 vs. 2016
Pre-tax income from the M&S segment decreased $241 million in 2017 , compared with 2016 . The decrease was primarily due to lower realizedmarketing margins, as well as the absence of U.S. biofuel tax credits recognized in 2016.
45
Table of ContentsIndex to Financial Statements
Corporate and Other
Millions of Dollars Year Ended December 31 2018 2017 2016Income (Loss) Before Income Taxes Net interest expense $ (459) (408) (322)Corporate general and administrative expenses (257) (268) (246)Technology (88) (94) (91)Other (49) (125) (88)Total Corporate and Other $ (853) (895) (747)
2018 vs. 2017
Net interest expense consists of interest and financing expense, net of interest income and capitalized interest. Net interest expense increased $51million in 2018 , compared with 2017 , mainly due to higher average debt principal balances from our issuance of senior notes totaling $1,500 millionin March 2018 and Phillips 66 Partners’ issuance of senior notes totaling $650 million in October 2017. This increase was partially offset by higherinterest income.
The category “Other” includes environmental costs associated with sites no longer in operation, foreign currency transaction gains and losses and othercosts not directly associated with an operating segment. The $76 million decrease in other costs in 2018, compared with 2017, was primarilyattributable to lower environmental-related expenses and higher equity earnings from our share of income tax benefits recorded by equity affiliates dueto the enactment of the Tax Act in December 2017.
2017 vs. 2016
Net interest expense increased $86 million in 2017 , compared with 2016 , primarily driven by lower capitalized interest due to the completion of majorprojects, including completion of the Freeport LPG Export Terminal project in late 2016, and higher interest expense driven by higher average debtprincipal balances due to Phillips 66 Partners’ debt issuances in October 2017 and 2016.
Corporate general and administrative expenses increased $22 million in 2017 , compared with 2016 , due to higher employee-related costs.
Other costs increased $37 million in 2017 , compared with 2016 , mainly due to higher environmental-related expenses.
46
Table of ContentsIndex to Financial Statements
CAPITAL RESOURCES AND LIQUIDITY
Financial Indicators
Millions of Dollars, Except as Indicated 2018 2017 2016
Cash and cash equivalents $ 3,019 3,119 2,711Net cash provided by operating activities 7,573 3,648 2,963Short-term debt 67 41 550Total debt 11,160 10,110 10,138Total equity 27,153 27,428 23,725Percent of total debt to capital* 29% 27 30Percent of floating-rate debt to total debt 11% 11 3* Capital includes total debt and total equity.
To meet our short- and long-term liquidity requirements, we look to a variety of funding sources but rely primarily on cash generated from operatingactivities. Additionally, Phillips 66 Partners has raised funds for its growth activities through debt and equity financings. During 2018 , we generated$7.6 billion in cash from operations and raised net proceeds of $1.5 billion from the issuance of senior notes. We used this available cash primarily forrepurchases of our common stock of $4.6 billion ; capital expenditures and investments of $2.6 billion ; dividend payments on our common stock of$1.4 billion ; and the early repayment of $550 million of debt. During 2018 , cash and cash equivalents decreased by $100 million , to $3.0 billion .
In addition to cash flows from operating activities, we rely on our commercial paper and credit facility programs, asset sales and our ability to issue debtsecurities to support our short- and long-term liquidity requirements. We believe current cash and cash equivalents and cash generated by operations,together with access to external sources of funds as described below under “Significant Sources of Capital,” will be sufficient to meet our fundingrequirements in the near and long term, including our capital spending, dividend payments, defined benefit plan contributions, debt repayment and sharerepurchases.
Significant Sources of Capital
Operating ActivitiesDuring 2018 , cash of $7,573 million was provided by operating activities, a 108 percent increase compared with 2017 . The increase was primarilyattributable to higher realized refining and marketing margins, increased distributions from our equity affiliates and lower employee benefit plancontributions. These increases were partially offset by unfavorable working capital impacts primarily driven by the effects of changes in commodityprices and the timing of payments and collections.
During 2017 , cash of $3,648 million was provided by operating activities, a 23 percent increase compared with 2016 . The increase was primarilyattributable to improved operating results due to higher realized refining margins and increased distributions from our equity affiliates. These increaseswere partially offset by working capital changes, reflecting the negative impact of building inventory at higher commodity prices and timing of refiningpayables payments, as well as lower marketing margins.
Our short- and long-term operating cash flows are highly dependent upon refining and marketing margins, NGL prices and chemicals margins. Pricesand margins in our industry are typically volatile, and are driven by market conditions over which we have little or no control. Absent other mitigatingfactors, as these prices and margins fluctuate, we would expect a corresponding change in our operating cash flows.
47
Table of ContentsIndex to Financial Statements
The level and quality of output from our refineries also impacts our cash flows. Factors such as operating efficiency, maintenance turnarounds, marketconditions, feedstock availability and weather conditions can affect output. We actively manage the operations of our refineries, and any variability intheir operations typically has not been as significant to cash flows as that caused by margins and prices. Our worldwide refining crude oil capacityutilization was 95 percent in both 2018 and 2017 .
Equity AffiliatesOur operating cash flows are also impacted by distribution decisions made by our equity affiliates, including DCP Midstream, CPChem and WRB.Over the three years ended December 31, 2018 , we received aggregate distributions from our equity affiliates of $4,712 million , including $201million from DCP Midstream, $1,603 million from CPChem and $1,124 million from WRB. CPChem resumed distributions to us in the first quarter of2018 following the return to full operations of its Cedar Bayou facility post-Hurricane Harvey and the start-up of its new U.S. Gulf Coastpetrochemicals assets. We cannot control the amount or timing of future distributions from equity affiliates; therefore, future distributions by these andother equity affiliates are not assured.
Phillips 66 PartnersIn 2013, we formed Phillips 66 Partners, a publicly traded MLP, to own, operate, develop and acquire primarily fee-based midstream assets.
OwnershipAt December 31, 2018 , we owned a 54 percent limited partner interest and a 2 percent general partner interest in Phillips 66 Partners, while the publicowned a 44 percent limited partner interest and 13.8 million perpetual convertible preferred units. We consolidate Phillips 66 Partners as a variableinterest entity for financial reporting purposes. See Note 27—Phillips 66 Partners LP , in the Notes to Consolidated Financial Statements, for additionalinformation on why we consolidate the partnership. As a result of this consolidation, the public common and preferred unitholders’ interests in Phillips66 Partners are reflected as noncontrolling interests of $2,469 million in our consolidated balance sheet at December 31, 2018 .
Debt and Equity FinancingsDuring the three years ended December 31, 2018 , Phillips 66 Partners raised net proceeds of approximately $4.1 billion from the following third-partydebt and equity offerings:
• In June 2018, Phillips 66 Partners completed its initial $250 million continuous offering of common units, or at-the-market (ATM) program,and commenced issuing common units under its second $250 million ATM program. Since inception in June 2016 through December 31, 2018,net proceeds of $320 million have been received under these programs.
• In October 2017, Phillips 66 Partners received net proceeds of $643 million from the issuance of $500 million of 3.750% Senior Notes dueMarch 2028 and $150 million of 4.680% Senior Notes due February 2045.
• In October 2017, Phillips 66 Partners received net proceeds of $737 million from a private placement of 13,819,791 perpetual convertiblepreferred units, at a price of $54.27 per unit.
• In October 2017, Phillips 66 Partners received net proceeds of $295 million from a private placement of 6,304,204 common units, at a price of$47.59 per unit.
• In October 2016, Phillips 66 Partners received net proceeds of $1,111 million from the issuance of $500 million of 3.550% Senior Notes dueOctober 2026 and $625 million of 4.900% Senior Notes due October 2046.
• In August 2016, Phillips 66 Partners received net proceeds of $299 million from a public offering of 6,000,000 common units, at a price of$50.22 per unit.
• In May 2016, Phillips 66 Partners received net proceeds of $656 million from a public offering of 12,650,000 common units, at a price of$52.40 per unit.
48
Table of ContentsIndex to Financial Statements
Phillips 66 Partners primarily used these net proceeds to fund the cash portion of acquisitions of assets from Phillips 66 and for capital spending andinvestments. See Note 27—Phillips 66 Partners LP , in the Notes to Consolidated Financial Statements, for additional information on Phillips 66Partners.
Credit Facilities and Commercial PaperPhillips 66 has a $5 billion revolving credit facility that extends until October 2021. This facility may be used for direct bank borrowings, as support forissuances of letters of credit, or as support for our commercial paper program. The facility is with a broad syndicate of financial institutions and containscovenants that are usual and customary for an agreement of this type for comparable commercial borrowers, including a maximum consolidated netdebt-to-capitalization ratio of 60 percent . The agreement has customary events of default, such as nonpayment of principal when due; nonpayment ofinterest, fees or other amounts; violation of covenants; cross-payment default and cross-acceleration (in each case, to indebtedness in excess of athreshold amount); and a change of control. Borrowings under the facility will incur interest at the London Interbank Offered Rate (LIBOR) plus amargin based on the credit rating of our senior unsecured long-term debt as determined from time to time by Standard & Poor’s Financial Services LLC(S&P) and Moody’s Investors Service, Inc. (Moody’s). The facility also provides for customary fees, including administrative agent fees andcommitment fees. At December 31, 2018 , no amount had been drawn under this revolving credit agreement.
Phillips 66 has a $5 billion commercial paper program for short-term working capital needs that is supported by its revolving credit facility.Commercial paper maturities are generally limited to 90 days. At December 31, 2018 , no borrowings were outstanding under the commercial paperprogram.
Phillips 66 Partners has a $750 million revolving credit facility that extends until October 2021. The Phillips 66 Partners facility is with a broadsyndicate of financial institutions and contains covenants that are usual and customary for an agreement of this type for comparable commercialborrowers. At Phillips 66 Partners’ option, outstanding borrowings under this facility bear interest at either i) the Eurodollar rate plus a margin based onits credit rating; or ii) the base rate (as described in the facility agreement) plus a margin based on its credit rating. Eurodollar rate borrowings are dueon the facility’s termination date, while base rate borrowings are due the earlier of the facility’s termination date or the fourteenth business day aftersuch borrowings were made. At December 31, 2018 , Phillips 66 Partners had borrowings of $125 million outstanding under this facility.
Other Debt Issuances and FinancingsOn March 1, 2018, Phillips 66 closed on a public offering of $1,500 million aggregate principal amount of unsecured notes consisting of:
• $500 million of floating-rate Senior Notes due February 2021. Interest on these notes is equal to the three-month LIBOR plus 0.60% per annumand is payable quarterly in arrears on February 26, May 26, August 26 and November 26, beginning on May 29, 2018.
• $800 million of 3.900% Senior Notes due March 2028. Interest on these notes is payable semiannually on March 15 and September 15 of eachyear, beginning on September 15, 2018.
• An additional $200 million of our 4.875% Senior Notes due November 2044. Interest on these notes is payable semiannually on May 15 andNovember 15 of each year, beginning on May 15, 2018.
Phillips 66 used the net proceeds from the issuance of these notes and cash on hand to repay commercial paper borrowings during the first quarter of2018, and for general corporate purposes. The commercial paper borrowings during the first quarter of 2018, were primarily used to repurchase sharesof our common stock. See Note 17—Equity , in the Notes to Consolidated Financial Statements, for additional information.
In addition, we have capital lease obligations related to equipment and transportation assets, and the use of an oil terminal in the United Kingdom.These leases mature within the next fifteen years. The present value of our minimum capital lease payments for these obligations as of December 31,2018 , was $184 million .
49
Table of ContentsIndex to Financial Statements
Availability of Debt and Equity FinancingOur senior unsecured long-term debt has been rated investment grade by S&P (BBB+) and Moody’s (A3). We do not have any ratings triggers on anyof our corporate debt that would cause an automatic default, and thereby impact our access to liquidity, in the event of a downgrade of our credit rating.If our credit rating deteriorated to a level prohibiting us from accessing the commercial paper market, we would expect to be able to access funds underour liquidity facilities mentioned above.
Off-Balance Sheet Arrangements
Under the operating lease agreement on our headquarters facility in Houston, Texas, we have a residual value guarantee with a maximum futureexposure of $554 million at December 31, 2018. The operating lease term ends in June 2021 and provides us the option, at the end of the lease term, torequest to renew the lease, purchase the facility or assist the lessor in marketing it for resale. We also have residual value guarantees associated withrailcar and airplane leases with maximum future exposures totaling $300 million at December 31, 2018, which have remaining terms of up to five years.
In addition, we have guarantees outstanding related to certain joint venture debt and purchase obligations, which have remaining terms of up to sevenyears. The maximum potential amount of future payments to third parties under these guarantees was approximately $304 million at December 31,2018.
See Note 13—Guarantees , in the Notes to Consolidated Financial Statements, for additional information on our guarantees.
Capital Requirements
Capital Expenditures and InvestmentsFor information about our capital expenditures and investments, see the “Capital Spending” section below.
Debt FinancingOur debt balance at December 31, 2018 , was $11.2 billion and our total debt-to-capital ratio was 29 percent .
In 2018, Phillips 66 made early debt repayments totaling $550 million , comprised of $300 million floating-rate notes due April 2019 and $250 millionof the $450 million outstanding under its three -year term loan facility due April 2020.
See Note 12—Debt , in the Notes to Consolidated Financial Statements, for our annual debt maturities over the next five years and more information ondebt repayments.
DividendsOn February 6, 2019, our Board of Directors declared a quarterly cash dividend of $0.80 per common share, payable March 1, 2019, to holders ofrecord at the close of business on February 19, 2019. We are forecasting a double-digit percentage increase in our quarterly dividend rate in 2019.
Share RepurchasesSince July 2012, our Board of Directors has, at various times, authorized repurchases of our outstanding common stock under our share repurchaseprogram, which aggregate to a total authorization of up to $12 billion . The share repurchases are expected to be funded primarily through availablecash. The shares will be repurchased from time to time in the open market at our discretion, subject to market conditions and other factors, and inaccordance with applicable regulatory requirements. Since the inception of our share repurchase program in 2012 through December 31, 2018 , we haverepurchased approximately 137 million shares at an aggregate cost of $10.4 billion . Shares of stock repurchased are held as treasury shares.
50
Table of ContentsIndex to Financial Statements
In February 2018, we entered into a Stock Purchase and Sale Agreement (Purchase Agreement) with Berkshire Hathaway Inc. and National IndemnityCompany, a wholly owned subsidiary of Berkshire Hathaway, to repurchase 35 million shares of Phillips 66 common stock for an aggregate purchaseprice of $3.3 billion . Pursuant to the Purchase Agreement, the purchase price per share of $93.725 was based on the volume-weighted-average price ofour common stock on the New York Stock Exchange on February 13, 2018. The transaction closed in February 2018. We funded the repurchase withcash of $1.9 billion and borrowings of $1.4 billion under our commercial paper program. These borrowings were subsequently refinanced through apublic offering of senior notes. This specific share repurchase transaction was separately authorized by our Board of Directors and therefore did notimpact previously announced authorizations under our share repurchase program, which are discussed above.
Employee Benefit Plan ContributionsFor the year ended December 31, 2018, we contributed $150 million to our U.S. employee benefit plans and $34 million to our international employeebenefit plans. In 2019, we expect to contribute approximately $90 million to those plans.
51
Table of ContentsIndex to Financial Statements
Contractual Obligations
The following table summarizes our aggregate contractual fixed and variable obligations as of December 31, 2018 :
(a) For additional information, see Note 12—Debt , in the Notes to Consolidated Financial Statements.
(b) Represents any agreement to purchase goods or services that is enforceable, legally binding and specifies all significant terms. We expect thesepurchase obligations will be fulfilled with operating cash flows in the applicable maturity period. The majority of the purchase obligations aremarket-based contracts, including exchanges and futures, for the purchase of products such as crude oil and raw NGL. The products are used tosupply our refineries and fractionators and optimize our supply chain. Product purchase commitments with third parties totaled $31,242 million. In addition, $20,642 million are product purchases from CPChem, mostly for fuel gas and natural gasoline over the remaining contractualterm of 81 years, and product purchases of $4,797 million from DCP Midstream entities for NGL over the remaining contractual term of tenyears.
Purchase obligations of $4,832 million are related to agreements to access and utilize the capacity of third-party equipment and facilities,including pipelines and product terminals, to transport, process, treat, and store products. The remainder is primarily our net share of purchasecommitments for materials and services for jointly owned facilities where we are the operator.
(c) Excludes pensions and unrecognized income tax benefits. From 2019 through 2023 , we expect to contribute an average of $120 million peryear to our qualified and nonqualified pension and other postretirement benefit plans in the United States and an average of $25 million peryear to our non-U.S. plans. The U.S. five-year average consists of approximately $60 million for 2019 and $135 million per year for theremaining four years. Our minimum funding in 2019 is expected to be $60 million in the United States and $30 million outside the UnitedStates. Unrecognized income tax benefits of $23 million were also excluded because the ultimate disposition and timing of any payments to bemade with regard to such amounts are not reasonably estimable.
(d) We elected to pay the one-time deemed repatriation income tax on foreign-sourced earnings, recognized as a result of the Tax Act enacted inDecember 2017, in installments over eight years beginning in 2018. The amount represents the remaining income tax liability.
52
Table of ContentsIndex to Financial Statements
Capital Spending
Millions of Dollars
2019
Budget 2018 2017 2016Capital Expenditures and Investments Midstream* $ 1,936 1,548 771 1,453Chemicals — — — —Refining 923 826 853 1,149Marketing and Specialties 161 125 108 98Corporate and Other 177 140 100 144 $ 3,197 2,639 1,832 2,844
Selected Equity Affiliates** DCP Midstream $ 505 484 268 99CPChem 572 339 776 987WRB 165 156 126 164 $ 1,242 979 1,170 1,250* 2019 budget includes $303 million of capital expected to be cash funded by noncontrolling interests.
** Our share of joint venture’s self-funded capital spending.
MidstreamCapital spending in our Midstream segment during the three-year period ended December 31, 2018 , included:
• Construction activities related to additional Gulf Coast fractionation capacity and Freeport LPG Export Terminal projects.
• Construction activities related to increasing storage capacity at our crude oil and refined petroleum products terminal located near Beaumont,Texas.
• Development of the Gray Oak Pipeline system, which will provide crude oil transportation from the Permian Basin and Eagle Ford todestinations in the Corpus Christi and Sweeny/Freeport markets on the Texas Gulf Coast. At December 31, 2018, Phillips 66 Partners had a48.75 percent effective ownership interest in this pipeline system. In February 2019, another party exercised its option to acquire an interest inthe pipeline system that reduced Phillips 66 Partners’ effective ownership interest to 42.25 percent.
• Development of the Bayou Bridge Pipeline by Phillips 66 Partners’ 40-percent-owned joint venture.
• Acquisition by Phillips 66 Partners of certain southeast Louisiana NGL logistics assets comprising approximately 500 miles of pipelines and astorage cavern connecting multiple fractionation facilities, refineries and a petrochemical facility.
• Development of the Bakken Pipeline system project, in which Phillips 66 Partners owns a 25 percent interest.
• Expansion activities on the Phillips 66 Partners’ 33-percent-owned Sand Hills Pipeline including investment in the transportation of NGL fromthe Permian Basin to the Texas Gulf Coast.
• Construction activities related to Phillips 66 Partners’ new isomerization unit at the Lake Charles Refinery.
• Expansion activities on the Phillips 66 Partners’ 50-percent owned STACK Pipeline joint venture.
• Construction activities by joint ventures of Phillips 66 Partners in the Bakken production area of North Dakota, including the Palermo RailTerminal, Sacagawea Crude Pipeline, the New Town injection point, Keene CDP Terminal and Sacagawea Gas Pipeline.
• Spending associated with other return, reliability and maintenance projects in our Transportation and NGL business.
53
Table of ContentsIndex to Financial Statements
During the three-year period ended December 31, 2018 , DCP Midstream’s self-funded capital expenditures and investments were $1.7 billion on a 100percent basis. Capital spending during this period was primarily for expansion of owned and joint venture natural gas processing and pipeline capacity. In 2018 , REX repaid $550 million of its debt, reducing its total debt to approximately $2 billion . REX funded the repayment through member cashcontributions, of which our 25 percent share was approximately $138 million .
ChemicalsDuring the three-year period ended December 31, 2018 , CPChem had a self-funded capital program, and thus required no new capital infusions fromus or our co-venturer. During this period, on a 100 percent basis, CPChem’s capital expenditures and investments were $4.2 billion . Capital spendingduring this period was primarily for the U.S. Gulf Coast Petrochemicals Project.
RefiningCapital spending for the Refining segment during the three-year period ended December 31, 2018 , was $2.8 billion , primarily for air emissionreduction and clean fuels projects to meet new environmental standards, refinery upgrade projects to increase processing of advantaged crudes andimprove product yields, improvements to the operating integrity of key processing units, and safety-related projects. Generally, our equity affiliates inthe Refining segment are expected to have self-funding capital programs. During this three-year period, on a 100 percent basis, WRB’s capitalexpenditures and investments were $892 million .
Key projects completed during the three-year period included:
• Installation of facilities to improve clean product yield at the Sweeny, Lake Charles, Ponca City, and Bayway refineries, as well as the jointlyowned Wood River Refinery.
• Installation of facilities to improve processing of advantaged crudes at the Billings and Lake Charles refineries, as well as the jointly ownedWood River Refinery.
• Installation of facilities to comply with U.S. Environmental Protection Agency (EPA) Tier 3 gasoline regulations at the Alliance, Lake Charles,Bayway and Sweeny refineries, as well as the jointly owned Wood River Refinery.
• Installation of a crude tank to increase accessibility of waterborne crude at the Los Angeles Refinery.
Major construction activities in progress include:
• Installation of facilities to comply with EPA Tier 3 gasoline regulations at the Ferndale Refinery.
• Installation of facilities to improve product value at the Sweeny and Lake Charles refineries, as well as the jointly owned Borger Refinery.
• Installation of facilities for U.K. biofuels compliance at the Humber Refinery.
Marketing and SpecialtiesCapital spending for the M&S segment during the three-year period ended December 31, 2018 , was primarily for the acquisition and furtherdevelopment of new international retail sites. In addition, capital was used for reliability and maintenance projects at our lubricants and powergeneration facilities.
Corporate and OtherCapital spending for Corporate and Other during the three-year period ended December 31, 2018 , was primarily for information technology andfacilities.
54
Table of ContentsIndex to Financial Statements
2019 BudgetOur 2019 capital budget is $3.2 billion including Phillips 66 Partners’ expected capital spending of $0.9 billion . This excludes our portion of plannedcapital spending by joint ventures DCP Midstream, CPChem and WRB totaling $1.2 billion , all of which is expected to be self-funded. Phillips 66Partners’ expected capital spending includes $0.3 billion of capital expected to be cash funded by noncontrolling interests.
The Midstream capital budget of $1.9 billion includes 300,000 barrels per day of additional fractionation capacity at the Sweeny Hub, as well asongoing expansion of the Beaumont Terminal and pipeline investments providing integration across our value chain. The Midstream capital budget alsoincludes growth capital at Phillips 66 Partners to support organic projects, including the Gray Oak Pipeline, South Texas Gateway Terminal, ClemensCaverns expansion, an isomerization unit at the Phillips 66 Lake Charles Refinery, and the Sweeny to Pasadena Pipeline. Refining’s capital budget of$0.9 billion is primarily directed toward reliability, safety and environmental projects, as well as high-return projects to enhance the yield of higher-value products, including an upgrade of the fluid catalytic cracking unit at the Sweeny Refinery, and other low-capital, quick-payout projects. In M&S,we plan to invest approximately $0.2 billion of growth and sustaining capital; the investment will further grow and enhance retail sites in Europe. InCorporate and Other, we plan to fund approximately $0.2 billion in projects primarily related to information technology projects, includingimplementation of a new enterprise resource planning system.
Contingencies
A number of lawsuits involving a variety of claims that arose in the ordinary course of business have been filed against us or are subject toindemnifications provided by us. We also may be required to remove or mitigate the effects on the environment of the placement, storage, disposal orrelease of certain chemical, mineral and petroleum substances at various active and inactive sites. We regularly assess the need for financial recognitionor disclosure of these contingencies. In the case of all known contingencies (other than those related to income taxes), we accrue a liability when theloss is probable and the amount is reasonably estimable. If a range of amounts can be reasonably estimated and no amount within the range is a betterestimate than any other amount, then the minimum of the range is accrued. We do not reduce these liabilities for potential insurance or third-partyrecoveries. If applicable, we accrue receivables for probable insurance or other third-party recoveries. In the case of income-tax-related contingencies,we use a cumulative probability-weighted loss accrual in cases where sustaining a tax position is less than certain.
Based on currently available information, we believe it is remote that future costs related to known contingent liability exposures will exceed currentaccruals by an amount that would have a material adverse impact on our consolidated financial statements. As we learn new facts concerningcontingencies, we reassess our position both with respect to accrued liabilities and other potential exposures. Estimates particularly sensitive to futurechanges include contingent liabilities recorded for environmental remediation, tax and legal matters. Estimated future environmental remediation costsare subject to change due to such factors as the uncertain magnitude of cleanup costs, the unknown time and extent of such remedial actions that may berequired, and the determination of our liability in proportion to that of other potentially responsible parties. Estimated future costs related to tax andlegal matters are subject to change as events evolve and as additional information becomes available during the administrative and litigation processes.
Legal and Tax MattersOur legal and tax matters are handled by our legal and tax organizations. These organizations apply their knowledge, experience and professionaljudgment to the specific characteristics of our cases and uncertain tax positions. We employ a litigation management process to manage and monitor thelegal proceedings against us. Our process facilitates the early evaluation and quantification of potential exposures in individual cases and enables thetracking of those cases that have been scheduled for trial and/or mediation. Based on professional judgment and experience in using these litigationmanagement tools and available information about current developments in all our cases, our legal organization regularly assesses the adequacy ofcurrent accruals and determines if adjustment of existing accruals, or establishment of new accruals, is required. In the case of income-tax-relatedcontingencies, we monitor tax legislation and court decisions, the status of tax audits and the statute of limitations within which a taxing authority canassert a liability. See Note 21—Income Taxes , in the Notes to Consolidated Financial Statements, for additional information about income-tax-relatedcontingencies.
55
Table of ContentsIndex to Financial Statements
EnvironmentalLike other companies in our industry, we are subject to numerous international, federal, state and local environmental laws and regulations. Among themost significant of these international and federal environmental laws and regulations are the:
• U.S. Federal Clean Air Act, which governs air emissions.• U.S. Federal Clean Water Act, which governs discharges into water bodies.• European Union Regulation for Registration, Evaluation, Authorization and Restriction of Chemicals (REACH), which governs the manufacture,
placing on the market or use of chemicals.• U.S. Federal Comprehensive Environmental Response, Compensation and Liability Act (CERCLA), which imposes liability on generators,
transporters and arrangers of hazardous substances at sites where hazardous substance releases have occurred or are threatening to occur.• U.S. Federal Resource Conservation and Recovery Act (RCRA), which governs the treatment, storage and disposal of solid waste.• U.S. Federal Emergency Planning and Community Right-to-Know Act (EPCRA), which requires facilities to report toxic chemical inventories to
local emergency planning committees and response departments.• U.S. Federal Oil Pollution Act of 1990 (OPA90), under which owners and operators of onshore facilities and pipelines as well as owners and
operators of vessels are liable for removal costs and damages that result from a discharge of oil into navigable waters of the United States.• European Union Trading Directive resulting in the European Union Emissions Trading Scheme (EU ETS), which uses a market-based mechanism
to incentivize the reduction of greenhouse gas (GHG) emissions.
These laws and their implementing regulations set limits on emissions and, in the case of discharges to water, establish water quality limits. They also,in most cases, require permits in association with new or modified operations. These permits can require an applicant to collect substantial informationin connection with the application process, which can be expensive and time consuming. In addition, there can be delays associated with notice andcomment periods and the agency’s processing of the application. Many of the delays associated with the permitting process are beyond the control ofthe applicant.
Many states and foreign countries where we operate also have, or are developing, similar environmental laws and regulations governing these sametypes of activities. While similar, in some cases these regulations may impose additional, or more stringent, requirements that can add to the cost anddifficulty of developing infrastructure and marketing and transporting products across state and international borders. For example, in California theSouth Coast Air Quality Management District (SCAQMD) approved amendments to the Regional Clean Air Incentives Market (RECLAIM) thatbecame effective in 2016, which require a phased reduction of nitrogen oxide emissions through 2022 and affect refineries in the Los Angelesmetropolitan area. In 2017, SCAQMD required additional nitrogen dioxide emissions reductions through 2025 and is now promulgating newregulations to replace the RECLAIM program with a traditional command and controls regulatory regime.
The ultimate financial impact arising from environmental laws and regulations is neither clearly known nor easily determinable as new standards, suchas air emission standards, water quality standards and stricter fuel regulations, continue to evolve. However, environmental laws and regulations,including those that may arise to address concerns about global climate change, are expected to continue to have an increasing impact on our operationsin the United States and in other countries in which we operate. Notable areas of potential impacts include air emission compliance and remediationobligations in the United States.
An example of this in the fuels area is the Energy Independence and Security Act of 2007 (EISA). It requires fuel producers and importers to provideadditional renewable fuels for transportation motor fuels and stipulates a mix of various types to be included through 2022. We have met theincreasingly stringent requirements to date while establishing implementation, operating and capital strategies, along with advanced technologydevelopment, to address projected future requirements. It is uncertain how various future requirements contained in EISA, and the regulationspromulgated thereunder, may be implemented and what their full impact may be on our operations. For the 2019 compliance year, the EPA has setvolumes of advanced and total renewable fuel at higher levels than in previous years (the 2019 compliance year volumes are approximately 3 percenthigher than those required for the 2018 and 2017 compliance years); it is uncertain if these increased obligations will be achievable by fuel producersand shippers without
56
Table of ContentsIndex to Financial Statements
drawing on the RIN bank. EISA requires EPA to reset the statutory volumes if EPA waives the volumes by 20 percent or more for two consecutiveyears. The 2019 rulemaking triggered this requirement and EPA is currently working on rulemaking that will set volumes for 2020 through 2022.Additionally, we may experience a decrease in demand for refined petroleum products due to the regulatory program as currently promulgated. Thisprogram continues to be the subject of possible Congressional review and re-promulgation in revised form, and the EPA’s regulations pertaining to the2014 through 2018 compliance years are subject to legal challenge, further creating uncertainty regarding renewable fuel volume requirements andobligations. Additionally, the market for RINs has been the subject of fraudulent third-party activity, and it is reasonably possible that some RINs thatwe have purchased may be determined to be invalid. Should that occur, we could incur costs to replace those fraudulent RINs. Although the cost forreplacing any fraudulently marketed RINs is not reasonably estimable at this time, we would not expect to incur the full financial impact of fraudulentRINs replacement costs in any single interim or annual period, and would not expect such costs to have a material impact on our results of operations orfinancial condition.
We also are subject to certain laws and regulations relating to environmental remediation obligations associated with current and past operations. Suchlaws and regulations include CERCLA and RCRA and their state equivalents. Remediation obligations include cleanup responsibility arising frompetroleum releases from underground storage tanks located at numerous previously and currently owned and/or operated petroleum-marketing outletsthroughout the United States. Federal and state laws require contamination caused by such underground storage tank releases be assessed andremediated to meet applicable standards. In addition to other cleanup standards, many states have adopted cleanup criteria for methyl tertiary-butyl etherfor both soil and groundwater.
At RCRA-permitted facilities, we are required to assess environmental conditions. If conditions warrant, we may be required to remediatecontamination caused by prior operations. In contrast to CERCLA, which is often referred to as “Superfund,” the cost of corrective action activitiesunder RCRA corrective action programs typically is borne solely by us. We anticipate increased expenditures for RCRA remediation activities may berequired, but such annual expenditures for the near term are not expected to vary significantly from the range of such expenditures we have experiencedover the past few years. Longer-term expenditures are subject to considerable uncertainty and may fluctuate significantly.
We occasionally receive requests for information or notices of potential liability from the EPA and state environmental agencies alleging that we are apotentially responsible party under CERCLA or an equivalent state statute. On occasion, we also have been made a party to cost recovery litigation bythose agencies or by private parties. These requests, notices and lawsuits assert potential liability for remediation costs at various sites that typically arenot owned by us, but allegedly contain wastes attributable to our past operations. As of December 31, 2017 , we reported that we had been notified ofpotential liability under CERCLA and comparable state laws at 31 sites within the United States. During 2018 , we were notified of one new site, onepreviously resolved site that was returned to active status, four sites that were deemed resolved and closed, and two sites that were deemed resolved butnot closed, leaving 27 unresolved sites with potential liability at December 31, 2018 .
For most Superfund sites, our potential liability will be significantly less than the total site remediation costs because the percentage of wasteattributable to us, versus that attributable to all other potentially responsible parties, is relatively low. Although liability of those potentially responsibleis generally joint and several for federal sites and frequently so for state sites, other potentially responsible parties at sites where we are a party typicallyhave had the financial strength to meet their obligations, and where they have not, or where potentially responsible parties could not be located, ourshare of liability has not increased materially. Many of the sites for which we are potentially responsible are still under investigation by the EPA or thestate agencies concerned. Prior to actual cleanup, those potentially responsible normally assess site conditions, apportion responsibility and determinethe appropriate remediation. In some instances, we may have no liability or attain a settlement of liability. Actual cleanup costs generally occur after theparties obtain EPA or equivalent state agency approval of a remediation plan. There are relatively few sites where we are a major participant, and giventhe timing and amounts of anticipated expenditures, neither the cost of remediation at those sites nor such costs at all CERCLA sites, in the aggregate, isexpected to have a material adverse effect on our competitive or financial condition.
Expensed environmental costs were $690 million in 2018 and are expected to be approximately $740 million and $700 million in 2019 and 2020 ,respectively. Capitalized environmental costs were $149 million in 2018 and are expected to be approximately $115 million and $125 million , in 2019and 2020 , respectively. This amount does not include capital expenditures made for another purpose that have an indirect benefit on environmentalcompliance.
57
Table of ContentsIndex to Financial Statements
Accrued liabilities for remediation activities are not reduced for potential recoveries from insurers or other third parties and are not discounted (exceptthose assumed in a business combination, which we record on a discounted basis).
Many of these liabilities result from CERCLA, RCRA and similar state laws that require us to undertake certain investigative and remedial activities atsites where we conduct, or once conducted, operations or at sites where our generated waste was disposed. We also have accrued for a number of siteswe identified that may require environmental remediation, but which are not currently the subject of CERCLA, RCRA or state enforcement activities. Ifapplicable, we accrue receivables for probable insurance or other third-party recoveries. In the future, we may incur significant costs under bothCERCLA and RCRA. Remediation activities vary substantially in duration and cost from site to site, depending on the mix of unique sitecharacteristics, evolving remediation technologies, diverse regulatory agencies and enforcement policies, and the presence or absence of potentiallyliable third parties. Therefore, it is difficult to develop reasonable estimates of future site remediation costs.
Notwithstanding any of the foregoing, and as with other companies engaged in similar businesses, environmental costs and liabilities are inherentconcerns in certain of our operations and products, and there can be no assurance that material costs and liabilities will not be incurred. However, wecurrently do not expect any material adverse effect on our results of operations or financial position as a result of compliance with currentenvironmental laws and regulations.
Climate ChangeThere has been a broad range of proposed or promulgated state, national and international laws focusing on GHG emissions reduction, includingvarious regulations proposed or issued by the EPA. These proposed or promulgated laws apply or could apply in states and/or countries where we haveinterests or may have interests in the future. Laws regulating GHG emissions continue to evolve, and while it is not possible to accurately estimateeither a timetable for implementation or our future compliance costs relating to implementation, such laws potentially could have a material impact onour results of operations and financial condition as a result of increasing costs of compliance, lengthening project implementation and agency reviews,or reducing demand for certain hydrocarbon products. Examples of legislation or precursors for possible regulation that do or could affect ouroperations include:
• EU ETS, which is part of the European Union’s policy to combat climate change and is a key tool for reducing industrial GHG emissions. EUETS impacts factories, power stations and other installations across all EU member states.
• California’s Global Warming Solutions Act, which requires the California Air Resources Board to develop regulations and market mechanismsthat will target reduction of California’s GHG emissions by 25 percent by 2020 (as well as SB32, which requires further reduction of California'sGHG emissions to 40 percent below the 1990 emission level by 2030, and AB398, which extends the California GHG emission cap-and-tradeprogram through 2030). Other GHG emissions programs in the western U.S. states have been enacted or are under consideration or development,including amendments to California's Low Carbon Fuel Standard, Oregon's Low Carbon Fuel Standard, and Washington's carbon reductionprograms.
• The U.S. Supreme Court decision in Massachusetts v. EPA , 549 U.S. 497, 127 S. Ct. 1438 (2007), confirming that the EPA has the authority toregulate carbon dioxide as an “air pollutant” under the Federal Clean Air Act.
• The EPA’s announcement on March 29, 2010 (published as “Interpretation of Regulations that Determine Pollutants Covered by Clean Air ActPermitting Programs,” 75 Fed. Reg. 17004 (April 2, 2010)), and the EPA’s and U.S. Department of Transportation’s joint promulgation of a FinalRule on April 1, 2010, that triggers regulation of GHGs under the Clean Air Act. These collectively may lead to more climate-based claims fordamages, and may result in longer agency review time for development projects to determine the extent of potential climate change.
• EPA's 2015 Final Rule regulating GHG emissions from existing fossil fuel-fired electrical generating units under the Federal Clean Air Act,commonly referred to as the Clean Power Plan, which remains the subject of litigation and administrative review.
• Carbon taxes in certain jurisdictions.• GHG emission cap and trade programs in certain jurisdictions.
In the EU, the first phase of the EU ETS completed at the end of 2007 and Phase II was undertaken from 2008 through 2012. The current phase (PhaseIII) runs from 2013 through to 2020, with the main changes being reduced allocation of free allowances and increased auctioning of new allowances.Phillips 66 has assets that are subject to the EU ETS, and the company is actively engaged in minimizing any financial impact from the EU ETS.
58
Table of ContentsIndex to Financial Statements
From November 30 to December 12, 2015, more than 190 countries, including the United States, participated in the United Nations Climate ChangeConference in Paris, France. The conference culminated in what is known as the “Paris Agreement,” which, upon certain conditions being met, enteredinto force on November 4, 2016. The Paris Agreement establishes a commitment by signatory parties to pursue domestic GHG emission reductions. In2017, the President of the United States announced his intention to withdraw the United States from the Paris Agreement.
In the United States, some additional form of regulation is likely to be forthcoming in the future at the state or federal levels with respect to GHGemissions. Such regulation could take any of several forms that may result in the creation of additional costs in the form of taxes, the restriction ofoutput, investments of capital to maintain compliance with laws and regulations, or required acquisition or trading of emission allowances. We areworking to continuously improve operational and energy efficiency through resource and energy conservation throughout our operations.
Compliance with changes in laws and regulations that create a GHG emission trading program, GHG reduction requirements or carbon taxes couldsignificantly increase our costs, reduce demand for fossil energy derived products, impact the cost and availability of capital and increase our exposureto litigation. Such laws and regulations could also increase demand for less carbon intensive energy sources.
An example of one such program is California’s cap and trade program, which was promulgated pursuant to the State’s Global Warming Solutions Act.The program had been limited to certain stationary sources, which include our refineries in California, but beginning in January 2015 was expanded toinclude emissions from transportation fuels distributed in California. Inclusion of transportation fuels in California’s cap and trade program as currentlypromulgated has increased our cap and trade program compliance costs. The ultimate impact on our financial performance, either positive or negative,from this and similar programs, will depend on a number of factors, including, but not limited to:
• Whether and to what extent legislation or regulation is enacted.• The nature of the legislation or regulation (such as a cap and trade system or a tax on emissions).• The GHG reductions required.• The price and availability of offsets.• The demand for, and amount and allocation of allowances.• Technological and scientific developments leading to new products or services.• Any potential significant physical effects of climate change (such as increased severe weather events, changes in sea levels and changes in
temperature).• Whether, and the extent to which, increased compliance costs are ultimately reflected in the prices of our products and services.
We consider and take into account anticipated future GHG emissions in designing and developing major facilities and projects, and implement energyefficiency initiatives to reduce GHG emissions. Data on our GHG emissions, legal requirements regulating such emissions, and the possible physicaleffects of climate change on our coastal assets are incorporated into our planning, investment, and risk management decision-making.
59
Table of ContentsIndex to Financial Statements
CRITICAL ACCOUNTING ESTIMATES
The preparation of financial statements in conformity with generally accepted accounting principles in the United States (GAAP) requires managementto select appropriate accounting policies and to make estimates and assumptions that affect the reported amounts of assets, liabilities, revenues andexpenses. See Note 1—Summary of Significant Accounting Policies , in the Notes to Consolidated Financial Statements, for descriptions of our majoraccounting policies. Some of these accounting policies involve judgments and uncertainties to such an extent that there is a reasonable likelihood thatmaterially different amounts would have been reported under different conditions, or if different assumptions had been used. The following discussionof critical accounting estimates, along with the discussion of contingencies in this report, address all important accounting areas where the nature ofaccounting estimates or assumptions could be material due to the levels of subjectivity and judgment necessary to account for highly uncertain mattersor the susceptibility of such matters to change.
ImpairmentsLong-lived assets used in operations are assessed for impairment whenever changes in facts and circumstances indicate a possible significantdeterioration in future expected cash flows. If the sum of the undiscounted expected future pre-tax cash flows of an asset group is less than the carryingvalue, including applicable liabilities, the carrying value is written down to estimated fair value. Individual assets are grouped for impairment purposesbased on a judgmental assessment of the lowest level for which there are identifiable cash flows that are largely independent of the cash flows of otherassets (for example, at a refinery complex level). Because there usually is a lack of quoted market prices for long-lived assets, the fair value of impairedassets is typically determined using one or more of the following methods: the present value of expected future cash flows using discount rates andother assumptions believed to be consistent with those used by principal market participants; a market multiple of earnings for similar assets; orhistorical market transactions of similar assets, adjusted using principal market participant assumptions when necessary. The expected future cash flowsused for impairment reviews and related fair value calculations are based on judgmental assessments of future volumes, commodity prices, operatingcosts, margins, discount rates and capital project decisions, considering all available information at the date of review.
Investments in nonconsolidated entities accounted for under the equity method are assessed for impairment when there are indicators of a loss in value,such as a lack of sustained earnings capacity or a current fair value less than the investment’s carrying amount. When it is determined that an indicatedimpairment is other than temporary, a charge is recognized for the difference between the investment’s carrying value and its estimated fair value.
When determining whether a decline in value is other than temporary, management considers factors such as the length of time and extent of thedecline, the investee’s financial condition and near-term prospects, and our ability and intention to retain our investment for a period that allows forrecovery. When quoted market prices are not available, the fair value is usually based on the present value of expected future cash flows using discountrates and other assumptions believed to be consistent with those used by principal market participants and a market analysis of comparable assets, ifappropriate. Different assumptions could affect the timing and the amount of an impairment of an investment in any period.
Asset Retirement ObligationsUnder various contracts, permits and regulations, we have legal obligations to remove tangible equipment and restore the land at the end of operationsat certain operational sites. Our largest asset removal obligations involve asbestos abatement at refineries. Estimating the timing and cost of future assetremovals is difficult. Most of these removal obligations are many years, or decades, in the future, and the contracts and regulations often have vaguedescriptions of what removal practices and criteria must be met when the removal event actually occurs. Asset removal technologies and costs,regulatory and other compliance considerations, expenditure timing, and other inputs into valuation of the obligation, including discount and inflationrates, are also subject to change.
Environmental CostsIn addition to asset retirement obligations discussed above, we have certain obligations to complete environmental-related projects. These projects areprimarily related to cleanup at domestic refineries, underground storage sites and non-operated sites. Future environmental remediation costs aredifficult to estimate because they are subject to change due to such factors as the uncertain magnitude of cleanup costs, timing and extent of suchremedial actions that may be required, and the determination of our liability in proportion to that of other responsible parties.
60
Table of ContentsIndex to Financial Statements
Intangible Assets and GoodwillAt December 31, 2018 , we had $753 million of intangible assets that we have determined to have indefinite useful lives, and therefore are notamortized. The judgmental determination that an intangible asset has an indefinite useful life is continuously evaluated. If, due to changes in facts andcircumstances, management determines these intangible assets have finite useful lives, amortization will commence at that time on a prospective basis.As long as these intangible assets are determined to have indefinite lives, they will be subject to at least annual impairment tests that requiremanagement’s judgment of their estimated fair value.
At December 31, 2018 , we had $3.3 billion of goodwill recorded in conjunction with past business combinations. Goodwill is not amortized. Instead,goodwill is subject to at least annual tests for impairment at a reporting unit level. A reporting unit is an operating segment or a component that is onelevel below an operating segment and they are determined primarily based on the manner in which the business is managed. We perform our annual goodwill impairment test using either a qualitative assessment or a quantitative assessment. As part of our qualitativeassessment, we evaluate relevant events and circumstances that could affect the fair value of our reporting units, including macroeconomic conditions,overall industry and market considerations and regulatory changes, as well as company-specific market metrics, performance and events. Theevaluation of company-specific events and circumstances includes evaluating changes in our stock price and cost of capital, actual and forecastedfinancial performance, as well as the effect of significant asset dispositions. If our qualitative assessment indicates it is likely the fair value of areporting unit has declined below its carrying value (including goodwill), or if we elect not to perform a qualitative assessment, a quantitativeassessment is performed.
When a quantitative assessment is performed, management applies judgment in determining the estimated fair values of the reporting units becausequoted market prices for our reporting units are not available. Management uses available information to make this fair value determination, includingestimated cash flows, cost of capital, observed market earnings multiples of comparable companies, our common stock price and associated totalcompany market capitalization.
We completed our annual impairment test as of October 1, 2018, and concluded that the fair values of our reporting units continued to exceed theirrespective carrying values (including goodwill) by significant percentages. A decline in the estimated fair value of one or more of our reporting units inthe future could result in an impairment. As such, we continue to monitor for indicators of impairment until our next annual impairment test isperformed.
Tax Assets and LiabilitiesOur operations are subject to various taxes, including federal, state and foreign income taxes, property taxes, and transactional taxes such as excise,sales/use and payroll taxes. We record tax liabilities based on our assessment of existing tax laws and regulations. The recording of tax liabilitiesrequires significant judgment and estimates. We recognize the financial statement effects of an income tax position when it is more likely than not thatthe position will be sustained upon examination by a taxing authority. A contingent liability related to a transactional tax claim is recorded if the loss isboth probable and estimable. Actual incurred tax liabilities can vary from our estimates for a variety of reasons, including different interpretations of taxlaws and regulations and different assessments of the amount of tax due.
In determining our income tax expense (benefit), we assess the likelihood our deferred tax assets will be recovered through future taxable income.Valuation allowances reduce deferred tax assets to an amount that will, more likely than not, be realized. Judgment is required in estimating the amountof valuation allowance, if any, that should be recorded against our deferred tax assets. Based on our historical taxable income, our expectations for thefuture, and available tax-planning strategies, we expect the net deferred tax assets will more likely than not be realized as offsets to reversing deferredtax liabilities and as reductions to future taxable income. If our actual results of operations differ from such estimates or our estimates of future taxableincome change, the valuation allowance may need to be revised.
New tax laws and regulations, as well as changes to existing tax laws and regulations, are continuously being proposed or promulgated. Theimplementation of future legislative and regulatory tax initiatives could result in increased income tax liabilities that cannot be predicted at this time.
61
Table of ContentsIndex to Financial Statements
Projected Benefit ObligationsCalculation of the projected benefit obligations for our defined benefit pension and postretirement plans impacts the obligations on the balance sheetand the amount of benefit expense in the income statement. The actuarial calculation of projected benefit obligations and company contributionrequirements involves judgment about uncertain future events, including estimated retirement dates, salary levels at retirement, mortality rates, lump-sum election rates, rates of return on plan assets, future interest rates, future health care cost-trend rates, and rates of utilization of health care servicesby retirees. We engage outside actuarial firms to assist in the calculation of these projected benefit obligations and company contribution requirementsdue to the specialized nature of these calculations. Due to differing objectives and requirements between financial accounting rules and the pension planfunding regulations promulgated by governmental agencies, the actuarial methods and assumptions for the two purposes differ in certain importantrespects. Ultimately, we will be required to fund all promised benefits under pension and postretirement benefit plans not funded by plan assets orinvestment returns, but the judgmental assumptions used in the actuarial calculations significantly affect periodic financial statements and fundingpatterns over time. Benefit expense is particularly sensitive to the discount rate and return on plan assets assumptions. A one percentage-point decreasein the discount rate assumption used for the plan obligation would increase annual benefit expense by an estimated $50 million, while a one percentage-point decrease in the return on plan assets assumption would increase annual benefit expense by an estimated $30 million. In determining the discountrate, we use yields on high-quality fixed income investments with payments matched to the estimated distributions of benefits from our plans.
In 2018 and 2017, the expected weighted-average long-term rate of return for worldwide pension plan assets was approximately 6 percent, while theactual weighted-average rate of return was a negative 4 percent in 2018 and a positive 15 percent in 2017. For the past ten years, our actual weighted-average rate of return for worldwide pension plan assets was 9 percent .
62
Table of ContentsIndex to Financial Statements
NEW ACCOUNTING STANDARDS
In February 2018, the FASB issued ASU No. 2018-02, “Income Statement—Reporting Comprehensive Income (Topic 220): Reclassification of CertainTax Effects from Accumulated Other Comprehensive Income.” This ASU allows for the deferred income tax effects stranded in accumulated othercomprehensive income (AOCI) resulting from the Tax Act enacted in December 2017 to be reclassed from AOCI to retained earnings. This ASU iseffective for fiscal years, and interim periods within those fiscal years, beginning after December 15, 2018, with early adoption permitted. Uponadoption on January 1, 2019, we increased retained earnings by approximately $90 million with the offset to accumulated other comprehensive loss onour consolidated balance sheet.
In June 2016, the FASB issued ASU No. 2016-13, “Financial Instruments—Credit Losses (Topic 326): Measurement of Credit Losses on FinancialInstruments.” The new standard amends the impairment model to utilize an expected loss methodology in place of the currently used incurred lossmethodology, which may result in earlier recognition of losses. Public business entities should apply the guidance in ASU No. 2016-13 for annualperiods beginning after December 15, 2019, including interim periods within those annual periods. Early adoption will be permitted for annual periodsbeginning after December 15, 2018. We are evaluating the provisions of ASU No. 2016-13, and currently do not expect our adoption to have a materialimpact on our consolidated financial statements.
In February 2016, the FASB issued ASU No. 2016-02, “Leases (Topic 842).” The new standard establishes a right-of-use (ROU) model that requires alessee to record a ROU asset and a lease liability on the balance sheet for all leases with terms longer than 12 months. Leases will continue to beclassified as either finance or operating, with classification affecting the pattern of expense recognition in the income statement. Similarly, lessors willbe required to classify leases as sales-type, finance or operating, with classification affecting the pattern of income recognition. Classification for bothlessees and lessors will be based on an assessment of whether risks and rewards, as well as substantive control have been transferred through a leasecontract. The ASU also requires additional disclosures. Public business entities should apply the guidance in ASU No. 2016-02 for annual periodsbeginning after December 15, 2018, including interim periods within those annual periods. Early adoption is permitted. We will adopt ASU No. 2016-02 by recognizing a cumulative-effect adjustment to our opening consolidated balance sheet as of our January 1, 2019, adoption date. As of theadoption date, we expect to recognize ROU assets and operating lease liabilities on our consolidated balance sheet of approximately $1.4 billion . Theadoption of this ASU is not expected to have a material impact on our consolidated statements of income and cash flows.
63
Table of ContentsIndex to Financial Statements
NON-GAAP RECONCILIATIONS
Refining
Our realized refining margins measure the difference between a) sales and other operating revenues derived from the sale of petroleum productsmanufactured at our refineries and b) purchase costs of feedstocks, primarily crude oil, used to produce the petroleum products. The realized refiningmargins are adjusted to include our proportional share of our joint venture refineries’ realized margins, as well as to exclude those items that are notrepresentative of the underlying operating performance of a period, which we call “special items.” The realized refining margins are converted to a per-barrel basis by dividing them by total refinery processed inputs (primarily crude oil) measured on a barrel basis, including our share of inputs processedby our joint venture refineries. Our realized refining margin per barrel is intended to be comparable with industry refining margins, which are known as“crack spreads.” As discussed in “Business Environment,” industry crack spreads measure the difference between market prices for refined petroleumproducts and crude oil. We believe realized refining margin per barrel calculated on a similar basis as industry crack spreads provides a useful measureof how well we performed relative to benchmark industry margins.
The GAAP performance measure most directly comparable to realized refining margin per barrel is the Refining segment’s “income before incometaxes per barrel.” Realized refining margin per barrel excludes items that are typically included in a manufacturer’s gross margin, such as depreciationand operating expenses, and other items used to determine income before income taxes, such as general and administrative expenses. It also includesour proportional share of joint venture refineries’ realized refining margins and excludes special items. Because realized refining margin per barrel iscalculated in this manner, and because realized refining margin per barrel may be defined differently by other companies in our industry, it haslimitations as an analytical tool. Following are reconciliations of income before income taxes to realized refining margins:
64
Table of ContentsIndex to Financial Statements
Millions of Dollars, Except as Indicated
Realized Refining MarginsAtlantic
Basin/EuropeGulf
CoastCentral
CorridorWestCoast Worldwide
Year Ended December 31, 2018 Income before income taxes $ 567 1,040 2,817 111 4,535Plus: Taxes other than income taxes 56 88 43 100 287Depreciation, amortization and impairments 201 268 135 237 841Selling, general and administrative expenses 63 57 34 50 204Operating expenses 950 1,312 488 1,040 3,790Equity in (earnings) losses of affiliates 10 6 (812) — (796)Other segment (income) expense, net (11) 3 (13) (9) (30)Proportional share of refining gross margins contributed by equityaffiliates 87 — 1,565 — 1,652
Special items: Certain tax impacts (5) — — — (5)
Realized refining margins $ 1,918 2,774 4,257 1,529 10,478 Total processed inputs ( thousands of barrels ) 186,042 292,665 106,299 136,332 721,338Adjusted total processed inputs ( thousands of barrels )* 186,042 292,665 191,561 136,332 806,600 Income before income taxes per barrel ( dollars per barrel )** $ 3.05 3.55 26.50 0.81 6.29Realized refining margins ( dollars per barrel )*** 10.32 9.48 22.22 11.20 12.99 Year Ended December 31, 2017 Income before income taxes $ 448 809 755 64 2,076Plus: Taxes other than income taxes 56 97 46 64 263Depreciation, amortization and impairments 192 273 129 244 838Selling, general and administrative expenses 61 55 34 48 198Operating expenses 847 1,212 593 982 3,634Equity in (earnings) losses of affiliates 11 (4) (329) — (322)Other segment (income) expense, net (10) (421) 13 5 (413)Proportional share of refining gross margins contributed by equityaffiliates 59 1 959 — 1,019
Special items: Certain tax impacts (23) — — — (23)
Realized refining margins $ 1,641 2,022 2,200 1,407 7,270 Total processed inputs ( thousands of barrels ) 199,068 285,951 92,146 134,089 711,254Adjusted total processed inputs ( thousands of barrels )* 199,068 285,951 176,823 134,089 795,931 Income before income taxes per barrel ( dollars per barrel )** $ 2.25 2.83 8.19 0.48 2.92Realized refining margins ( dollars per barrel )*** 8.25 7.07 12.44 10.49 9.13 * Adjusted total processed inputs include our proportional share of processed inputs of an equity affiliate. ** Income before income taxes divided by total processed inputs.*** Realized refining margins per barrel, as presented, are calculated using the underlying realized refining margin amounts, in dollars, divided by adjusted total processed inputs, in barrels.
As such, recalculated per barrel amounts using the rounded margins and barrels presented may differ from the presented per barrel amounts due to rounding.
65
Table of ContentsIndex to Financial Statements
Millions of Dollars, Except as Indicated
Realized Refining MarginsAtlantic
Basin/EuropeGulf
CoastCentral
CorridorWestCoast Worldwide
Year Ended December 31, 2016 Income (loss) before income taxes $ 187 69 367 (188) 435Plus: Taxes other than income taxes 58 73 42 80 253Depreciation, amortization and impairments 200 234 106 230 770Selling, general and administrative expenses 64 51 31 49 195Operating expenses 817 1,234 465 979 3,495Equity in (earnings) losses of affiliates 8 (50) (122) — (164)Other segment (income) expense, net (11) 3 (6) (2) (16)Proportional share of refining gross margins contributed by equityaffiliates 55 (4) 705 — 756
Special items: Pending claims and settlements — (70) — — (70)Certain tax impacts (32) — — — (32)Railcar lease residual value deficiencies and related costs 5 16 11 8 40Recognition of deferred logistics commitments 30 — — — 30
Realized refining margins $ 1,381 1,556 1,599 1,156 5,692 Total processed inputs ( thousands of barrels ) 220,519 283,574 98,217 126,329 728,639Adjusted total processed inputs ( thousands of barrels )* 220,519 283,574 183,691 126,329 814,113 Income (loss) before income taxes per barrel ( dollars per barrel)** $ 0.85 0.24 3.74 (1.49) 0.60
Realized refining margins ( dollars per barrel )*** 6.26 5.49 8.70 9.15 6.99 * Adjusted total processed inputs include our proportional share of processed inputs of an equity affiliate. ** Income (loss) before income taxes divided by total processed inputs.*** Realized refining margins per barrel, as presented, are calculated using the underlying realized refining margin amounts, in dollars, divided by adjusted total processed inputs, in barrels.
As such, recalculated per barrel amounts using the rounded margins and barrels presented may differ from the presented per barrel amounts due to rounding.
66
Table of ContentsIndex to Financial Statements
Marketing
Our realized marketing fuel margins measure the difference between a) sales and other operating revenues derived from the sale of fuels in our M&Ssegment and b) purchase costs of those fuels. The realized marketing fuel margins are adjusted to exclude those items that are not representative of theunderlying operating performance of a period, which we call “special items.” The realized marketing fuel margins are converted to a per-barrel basis bydividing them by sales volumes measured on a barrel basis. We believe realized marketing fuel margin per barrel demonstrates the value uplift ourmarketing operations provide by optimizing the placement and ultimate sale of our refineries’ fuel production. Within the M&S segment, the GAAP performance measure most directly comparable to realized marketing fuel margin per barrel is the marketingbusiness’ “income before income taxes per barrel.” Realized marketing fuel margin per barrel excludes items that are typically included in grossmargin, such as depreciation and operating expenses, and other items used to determine income before income taxes, such as general and administrativeexpenses. Because realized marketing fuel margin per barrel excludes these items, and because realized marketing fuel margin per barrel may bedefined differently by other companies in our industry, it has limitations as an analytical tool. Following are reconciliations of income before incometaxes to realized marketing fuel margins:
Millions of Dollars, Except as Indicated U.S. International 2018 2017 2016 2018 2017 2016Realized Marketing Fuel Margins
Income before income taxes $ 843 628 804 505 217 252Plus: Taxes other than income taxes* (2) 5,481 5,187 2 7,579 8,132Depreciation, amortization and impairment 13 14 12 71 67 63Selling, general and administrative expenses 763 751 708 280 264 259Equity in earnings of affiliates (8) (5) (4) (91) (83) (75)Other operating revenues* (379) (5,815) (5,558) (32) (7,594) (8,157)Other segment (income) expense, net — (15) — 2 2 3Special items:
Certain tax impacts (100) — — — — —Marketing margins 1,130 1,039 1,149 737 452 477Less: margin for non-fuel related sales — — — 44 42 45Realized marketing fuel margins $ 1,130 1,039 1,149 693 410 432 Total fuel sales volumes ( thousands of barrels ) 697,696 703,928 699,111 100,949 97,346 106,574 Income before income taxes per barrel ( dollars per barrel) $ 1.21 0.89 1.15 5.00 2.23 2.36
Realized marketing fuel margins ( dollars per barrel )** 1.62 1.48 1.64 6.87 4.21 4.05* Includes excise taxes on sales of refined petroleum products for periods prior to our adoption of ASU No. 2014-09 on January 1, 2018. See Note 2—Changes in Accounting Principles, in
the Notes to Consolidated Financial Statements, for further information on our adoption of this ASU. Other operating revenues also includes other non-fuel revenues.** Realized marketing fuel margins per barrel, as presented, are calculated using the underlying realized marketing fuel margin amounts, in dollars, divided by sales volumes, in barrels. As
such, recalculated per barrel amounts using the rounded margins and barrels presented may differ from the presented per barrel amounts due to rounding.
67
Table of ContentsIndex to Financial Statements
Item 7A. QUANTITATIVE AND QUALITATIVE DISCLOSURES ABOUT MARKET RISK
Financial Instrument Market Risk
We and certain of our subsidiaries hold and issue derivative contracts and financial instruments that expose our cash flows or earnings to changes incommodity prices, foreign currency exchange rates or interest rates. We may use financial- and commodity-based derivative contracts to manage therisks produced by changes in the prices of crude oil and related products, natural gas, NGL, and electric power; fluctuations in interest rates and foreigncurrency exchange rates; or to capture market opportunities.
Our use of derivative instruments is governed by an “Authority Limitations” document approved by our Board of Directors, that prohibits the use ofhighly leveraged derivatives or derivative instruments without sufficient market liquidity for comparable valuations. The Authority Limitationsdocument also establishes Value at Risk (VaR) limits, and compliance with these limits is monitored daily. Our Chief Executive Officer and ChiefFinancial Officer monitor risks resulting from foreign currency exchange rates, interest rates and commodity prices.
Commodity Price RiskWe sell into and receive supply from the worldwide crude oil, refined petroleum product, natural gas, NGL, and electric power markets, exposing ourrevenues, purchases, cost of operating activities, and cash flows to fluctuations in the prices for these commodities. Generally, our policy is to remainexposed to the market prices of commodities. Consistent with this policy, our Commercial organization uses derivative contracts to convert ourexposure from fixed-price sales contracts, often specified in contracts with refined petroleum product customers, back to fluctuating market prices.Conversely, our Commercial organization also uses futures, forwards, swaps and options in various markets to accomplish the following objectives tooptimize the value of our supply chain, and this may reduce our exposure to fluctuations in market prices:
• Balance physical systems or to meet our refinery requirements and marketing demand. In addition to cash settlement prior to contract expiration,exchange-traded futures contracts may be settled by physical delivery of the commodity.
• Manage the risk to our cash flows from price exposures on specific crude oil, refined petroleum product, natural gas, NGL, and electric powertransactions.
• Enable us to use the market knowledge gained from these activities to capture market opportunities such as moving physical commodities to moreprofitable locations, storing commodities to capture seasonal or time premiums, and blending commodities to capture quality upgrades.Derivatives may be utilized to optimize these activities.
We use a VaR model to estimate the loss in fair value that could potentially result on a single day from the effect of adverse changes in marketconditions on the derivative financial instruments and derivative commodity instruments held or issued, including commodity purchase and salescontracts recorded on the balance sheet at December 31, 2018 , as derivative instruments. Using the Monte Carlo simulation, a 95 percent confidencelevel and a one-day holding period, the VaR for those instruments issued or held for trading purposes at December 31, 2018 and 2017 , was immaterialto our cash flows and net income. The VaR for instruments held for purposes other than trading at December 31, 2018 and 2017 , was also immaterialto our cash flows and net income.
68
Table of ContentsIndex to Financial Statements
Interest Rate RiskOur use of fixed- or variable-rate debt directly exposes us to interest rate risk. Fixed-rate debt, such as our senior notes, exposes us to changes in the fairvalue of our debt due to changes in market interest rates. Fixed-rate debt also exposes us to the risk that we may need to refinance maturing debt withnew debt at higher rates, or that we may be obligated to pay rates higher than the current market. Variable-rate debt, such as our floating-rate notes orborrowings under our revolving credit facility, exposes us to short-term changes in market rates that impact our interest expense. The following tablesprovide information about our debt instruments that are sensitive to changes in U.S. interest rates. These tables present principal cash flows and relatedweighted-average interest rates by expected maturity dates. Weighted-average variable rates are based on effective rates at the reporting date. Thecarrying amount of our floating-rate debt approximates its fair value. The fair value of the fixed-rate financial instruments is estimated based onobservable market prices.
For additional information about our use of derivative instruments, see Note 15—Derivatives and Financial Instruments , in the Notes to ConsolidatedFinancial Statements.
69
Table of ContentsIndex to Financial Statements
CAUTIONARY STATEMENT FOR THE PURPOSES OF THE “SAFE HARBOR” PROVISIONS OF THE PRIVATE SECURITIESLITIGATION REFORM ACT OF 1995
This report includes forward-looking statements within the meaning of Section 27A of the Securities Act of 1933 and Section 21E of the SecuritiesExchange Act of 1934. You can identify our forward-looking statements by the words “anticipate,” “estimate,” “believe,” “budget,” “continue,”“could,” “intend,” “may,” “plan,” “potential,” “predict,” “seek,” “should,” “will,” “would,” “expect,” “objective,” “projection,” “forecast,” “goal,”“guidance,” “outlook,” “effort,” “target” and similar expressions.
We based the forward-looking statements on our current expectations, estimates and projections about us and the industries in which we operate ingeneral. We caution you these statements are not guarantees of future performance as they involve assumptions that, while made in good faith, mayprove to be incorrect, and involve risks and uncertainties we cannot predict. In addition, we based many of these forward-looking statements onassumptions about future events that may prove to be inaccurate. Accordingly, our actual outcomes and results may differ materially from what we haveexpressed or forecast in the forward-looking statements. Any differences could result from a variety of factors, including the following:
• Fluctuations in NGL, crude oil, refined petroleum product and natural gas prices and refining, marketing and petrochemical margins.• Failure of new products and services to achieve market acceptance.• Unexpected changes in costs or technical requirements for constructing, modifying or operating our facilities or transporting our products.• Unexpected technological or commercial difficulties in manufacturing, refining or transporting our products, including chemical products.• Lack of, or disruptions in, adequate and reliable transportation for our NGL, crude oil, natural gas and refined petroleum products.• The level and success of drilling and quality of production volumes around our Midstream assets.• Our inability to timely obtain or maintain permits, including those necessary for capital projects.• Our inability to comply with government regulations or make capital expenditures required to maintain compliance.• Failure to complete definitive agreements and feasibility studies for, and to timely complete construction of, announced and future capital
projects.• Potential disruption or interruption of our operations due to accidents, weather events, civil unrest, political events, terrorism or cyber attacks.• International monetary conditions and exchange controls.• Substantial investment or reduced demand for products as a result of existing or future environmental rules and regulations.• Liability resulting from litigation or for remedial actions, including removal and reclamation obligations under environmental regulations.• General domestic and international economic and political developments including: armed hostilities; expropriation of assets; changes in
governmental policies relating to NGL, crude oil, natural gas or refined petroleum products pricing, regulation or taxation; and other political,economic or diplomatic developments.
• Changes in tax, environmental and other laws and regulations (including alternative energy mandates) applicable to our business.• Limited access to capital or significantly higher cost of capital related to changes to our credit profile or illiquidity or uncertainty in the
domestic or international financial markets.• The operation, financing and distribution decisions of our joint ventures.• Domestic and foreign supplies of crude oil and other feedstocks.• Domestic and foreign supplies of petrochemicals and refined petroleum products, such as gasoline, diesel, aviation fuel and home heating oil.• Governmental policies relating to exports of crude oil and natural gas.• Overcapacity or undercapacity in the midstream, chemicals and refining industries.• Fluctuations in consumer demand for refined petroleum products.• The factors generally described in Item 1A.—Risk Factors in this report.
70
Table of ContentsIndex to Financial Statements
Item 8. FINANCIAL STATEMENTS AND SUPPLEMENTARY DATA
PHILLIPS 66
INDEX TO FINANCIAL STATEMENTS
Page
Report of Management 72 Reports of Independent Registered Public Accounting Firm 73 Consolidated Financial Statements of Phillips 66: Consolidated Statement of Income for the years ended December 31, 2018, 2017 and 2016 75 Consolidated Statement of Comprehensive Income for the years ended December 31, 2018, 2017 and 2016 76 Consolidated Balance Sheet at December 31, 2018 and 2017 77 Consolidated Statement of Cash Flows for the years ended December 31, 2018, 2017 and 2016 78 Consolidated Statement of Changes in Equity for the years ended December 31, 2018, 2017 and 2016 79 Notes to Consolidated Financial Statements 81 Supplementary Information Selected Quarterly Financial Data (Unaudited) 138
71
Table of ContentsIndex to Financial Statements
Report of Management
Management prepared, and is responsible for, the consolidated financial statements and the other information appearing in this Annual Report. Theconsolidated financial statements present fairly the company’s financial position, results of operations and cash flows in conformity with generallyaccepted accounting principles in the United States. In preparing its consolidated financial statements, the company includes amounts that are based onestimates and judgments management believes are reasonable under the circumstances. The company’s financial statements have been audited by Ernst& Young LLP, an independent registered public accounting firm appointed by the Audit and Finance Committee of the Board of Directors.Management has made available to Ernst & Young LLP all of the company’s financial records and related data, as well as the minutes of stockholders’and directors’ meetings.
Assessment of Internal Control Over Financial Reporting
Management is responsible for establishing and maintaining adequate internal control over financial reporting. Phillips 66’s internal control system wasdesigned to provide reasonable assurance to the company’s management and directors regarding the preparation and fair presentation of publishedfinancial statements.
All internal control systems, no matter how well designed, have inherent limitations. Therefore, even those systems determined to be effective canprovide only reasonable assurance with respect to financial statement preparation and presentation.
Management assessed the effectiveness of the company’s internal control over financial reporting as of December 31, 2018 . In making this assessment,it used the criteria set forth by the Committee of Sponsoring Organizations of the Treadway Commission in Internal Control — Integrated Framework(2013) . Based on this assessment, management concluded the company’s internal control over financial reporting was effective as of December 31,2018 .
Ernst & Young LLP has issued an audit report on the company’s internal control over financial reporting as of December 31, 2018 , and their report isincluded herein.
/s/ Greg C. Garland /s/ Kevin J. Mitchell
Greg C. Garland Kevin J. MitchellChairman and Executive Vice President, Finance andChief Executive Officer Chief Financial Officer
Date: February 22, 2019
72
Table of ContentsIndex to Financial Statements
Report of Independent Registered Public Accounting Firm
To the Board of Directors and Stockholders of Phillips 66
Opinion on the Financial Statements
We have audited the accompanying consolidated balance sheet of Phillips 66 (the Company) as of December 31, 2018 and 2017 , the relatedconsolidated statements of income, comprehensive income, changes in equity, and cash flows, for each of the three years in the period ended December31, 2018 , and the related notes (collectively referred to as the financial statements). In our opinion, the financial statements present fairly, in allmaterial respects, the consolidated financial position of the Company as of December 31, 2018 and 2017 , and the consolidated results of its operationsand its cash flows for each of the three years in the period ended December 31, 2018 , in conformity with U.S. generally accepted accounting principles.
We also have audited, in accordance with the standards of the Public Company Accounting Oversight Board (United States) (PCAOB), the Company’sinternal control over financial reporting as of December 31, 2018 , based on criteria established in Internal Control-Integrated Framework issued by theCommittee of Sponsoring Organizations of the Treadway Commission (2013 framework) and our report dated February 22, 2019 expressed anunqualified opinion thereon.
Adoption of ASU No. 2014-09
As discussed in Note 2 to the consolidated financial statements, the Company adopted ASU No. 2014-09, “Revenue from Contracts with Customers(Topic 606)” effective January 1, 2018. As a result, for the year ended December 31, 2018, the Company changed its presentation of excise taxescollected from customers on sales of refined petroleum products.
Basis for Opinion
These financial statements are the responsibility of the Company’s management. Our responsibility is to express an opinion on the Company’s financialstatements based on our audits. We are a public accounting firm registered with the PCAOB and are required to be independent with respect to theCompany in accordance with the U.S. federal securities laws and the applicable rules and regulations of the Securities and Exchange Commission andthe PCAOB.
We conducted our audits in accordance with the standards of the PCAOB. Those standards require that we plan and perform the audit to obtainreasonable assurance about whether the financial statements are free of material misstatement, whether due to error or fraud. Our audits includedperforming procedures to assess the risks of material misstatement of the financial statements, whether due to error or fraud, and performing proceduresthat respond to those risks. Such procedures include examining, on a test basis, evidence regarding the amounts and disclosures in the financialstatements. Our audits also included evaluating the accounting principles used and significant estimates made by management, as well as evaluating theoverall presentation of the financial statements. We believe that our audits provide a reasonable basis for our opinion.
/s/ Ernst & Young LLP
Houston, TexasFebruary 22, 2019
We have served as the Company’s auditor since 2011.
73
Table of ContentsIndex to Financial Statements
Report of Independent Registered Public Accounting Firm
To the Board of Directors and Stockholders of Phillips 66
Opinion on Internal Control over Financial Reporting
We have audited Phillips 66’s internal control over financial reporting as of December 31, 2018 , based on criteria established in Internal Control—Integrated Framework issued by the Committee of Sponsoring Organizations of the Treadway Commission (2013 framework) (the COSO criteria). Inour opinion, Phillips 66 (the Company) maintained, in all material respects, effective internal control over financial reporting as of December 31, 2018 ,based on the COSO criteria.
We also have audited, in accordance with the standards of the Public Company Accounting Oversight Board (United States) (PCAOB), the consolidatedbalance sheets of the Company as of December 31, 2018 and 2017 , the related consolidated statements of income, comprehensive income, changes inequity, and cash flows, for each of the three years in the period ended December 31, 2018 , and the related notes and our report dated February 22, 2019expressed an unqualified opinion thereon.
Basis for Opinion
The Company’s management is responsible for maintaining effective internal control over financial reporting and for its assessment of the effectivenessof internal control over financial reporting included under the heading “Assessment of Internal Control Over Financial Reporting” in the accompanying“Report of Management.” Our responsibility is to express an opinion on the Company’s internal control over financial reporting based on our audit. Weare a public accounting firm registered with the PCAOB and are required to be independent with respect to the Company in accordance with the U.S.federal securities laws and the applicable rules and regulations of the Securities and Exchange Commission and the PCAOB.
We conducted our audit in accordance with the standards of the PCAOB. Those standards require that we plan and perform the audit to obtainreasonable assurance about whether effective internal control over financial reporting was maintained in all material respects.
Our audit included obtaining an understanding of internal control over financial reporting, assessing the risk that a material weakness exists, testing andevaluating the design and operating effectiveness of internal control based on the assessed risk, and performing such other procedures as we considerednecessary in the circumstances. We believe that our audit provides a reasonable basis for our opinion.
Definition and Limitations of Internal Control Over Financial Reporting
A company’s internal control over financial reporting is a process designed to provide reasonable assurance regarding the reliability of financialreporting and the preparation of financial statements for external purposes in accordance with generally accepted accounting principles. A company’sinternal control over financial reporting includes those policies and procedures that (1) pertain to the maintenance of records that, in reasonable detail,accurately and fairly reflect the transactions and dispositions of the assets of the company; (2) provide reasonable assurance that transactions arerecorded as necessary to permit preparation of financial statements in accordance with generally accepted accounting principles, and that receipts andexpenditures of the company are being made only in accordance with authorizations of management and directors of the company; and (3) providereasonable assurance regarding prevention or timely detection of unauthorized acquisition, use, or disposition of the company’s assets that could have amaterial effect on the financial statements.
Because of its inherent limitations, internal control over financial reporting may not prevent or detect misstatements. Also, projections of any evaluationof effectiveness to future periods are subject to the risk that controls may become inadequate because of changes in conditions, or that the degree ofcompliance with the policies or procedures may deteriorate.
/s/ Ernst & Young LLP
Houston, TexasFebruary 22, 2019
74
Table of ContentsIndex to Financial Statements
Consolidated Statement of Income Phillips 66
Millions of DollarsYears Ended December 31 2018 2017 2016Revenues and Other Income Sales and other operating revenues* $ 111,461 102,354 84,279Equity in earnings of affiliates 2,676 1,732 1,414Net gain on dispositions 19 15 10Other income 61 521 74
Total Revenues and Other Income 114,217 104,622 85,777 Costs and Expenses Purchased crude oil and products 97,930 79,409 62,468Operating expenses 4,880 4,699 4,275Selling, general and administrative expenses 1,677 1,695 1,638Depreciation and amortization 1,356 1,318 1,168Impairments 8 24 5Taxes other than income taxes* 425 13,462 13,688Accretion on discounted liabilities 23 22 21Interest and debt expense 504 438 338Foreign currency transaction gains (31) — (15)
Total Costs and Expenses 106,772 101,067 83,586Income before income taxes 7,445 3,555 2,191Income tax expense (benefit) 1,572 (1,693) 547Net Income 5,873 5,248 1,644Less: net income attributable to noncontrolling interests 278 142 89Net Income Attributable to Phillips 66 $ 5,595 5,106 1,555 Net Income Attributable to Phillips 66 Per Share of Common Stock (dollars) Basic $ 11.87 9.90 2.94Diluted 11.80 9.85 2.92 Weighted-Average Common Shares Outstanding (thousands) Basic 470,708 515,090 527,531Diluted 474,047 518,508 530,066* Includes excise taxes on sales of refined petroleum products for periods prior to the adoption of Accounting
Standards Update No. 2014-09 on January 1, 2018: $ 13,054 13,381See Notes to Consolidated Financial Statements.
75
Table of ContentsIndex to Financial Statements
Consolidated Statement of Comprehensive Income Phillips 66 Millions of DollarsYears Ended December 31 2018 2017 2016
Net Income $ 5,873 5,248 1,644Other comprehensive income (loss)
Defined benefit plans Net actuarial loss arising during the period (16) (1) (178)Amortization to income of net actuarial loss, net prior service cost (credit) and
settlements 148 176 94Curtailment gain 5 — 31Plans sponsored by equity affiliates 22 10 (11)Income taxes on defined benefit plans (33) (70) 13
Defined benefit plans, net of income taxes 126 115 (51)Foreign currency translation adjustments (205) 268 (301)Income taxes on foreign currency translation adjustments 3 (9) 5
Foreign currency translation adjustments, net of income taxes (202) 259 (296)Cash flow hedges 1 6 8Income taxes on hedging activities — (2) (3)
Hedging activities, net of income taxes 1 4 5Other Comprehensive Income (Loss), Net of Income Taxes (75) 378 (342)Comprehensive Income 5,798 5,626 1,302Less: comprehensive income attributable to noncontrolling interests 278 142 89Comprehensive Income Attributable to Phillips 66 $ 5,520 5,484 1,213See Notes to Consolidated Financial Statements.
76
Table of ContentsIndex to Financial Statements
Consolidated Balance Sheet Phillips 66 Millions of DollarsAt December 31 2018 2017Assets Cash and cash equivalents $ 3,019 3,119Accounts and notes receivable (net of allowances of $22 million in 2018
and $29 million in 2017) 5,414 6,424Accounts and notes receivable—related parties 759 1,082Inventories 3,543 3,395Prepaid expenses and other current assets 474 370
Total Current Assets 13,209 14,390Investments and long-term receivables 14,421 13,941Net properties, plants and equipment 22,018 21,460Goodwill 3,270 3,270Intangibles 869 876Other assets 515 434Total Assets $ 54,302 54,371
Liabilities Accounts payable $ 6,113 7,242Accounts payable—related parties 473 785Short-term debt 67 41Accrued income and other taxes 1,116 1,002Employee benefit obligations 724 582Other accruals 442 455
Total Current Liabilities 8,935 10,107Long-term debt 11,093 10,069Asset retirement obligations and accrued environmental costs 624 641Deferred income taxes 5,275 5,008Employee benefit obligations 867 884Other liabilities and deferred credits 355 234Total Liabilities 27,149 26,943
Equity Common stock (2,500,000,000 shares authorized at $0.01 par value)
Issued (2018—645,691,761 shares; 2017—643,835,464 shares) Par value 6 6Capital in excess of par 19,873 19,768
Treasury stock (at cost: 2018—189,526,331 shares; 2017—141,565,145 shares) (15,023) (10,378)Retained earnings 20,489 16,306Accumulated other comprehensive loss (692) (617)
Total Stockholders’ Equity 24,653 25,085Noncontrolling interests 2,500 2,343Total Equity 27,153 27,428Total Liabilities and Equity $ 54,302 54,371See Notes to Consolidated Financial Statements.
77
Table of ContentsIndex to Financial Statements
Consolidated Statement of Cash Flows Phillips 66 Millions of DollarsYears Ended December 31 2018 2017 2016Cash Flows From Operating Activities Net income $ 5,873 5,248 1,644Adjustments to reconcile net income to net cash provided by operating activities
Depreciation and amortization 1,356 1,318 1,168Impairments 8 24 5Accretion on discounted liabilities 23 22 21Deferred income taxes 252 (1,886) 612Undistributed equity earnings 221 (516) (815)Net gain on dispositions (19) (15) (10)Gain on consolidation of business — (423) —Other 132 (186) (163)Working capital adjustments
Accounts and notes receivable 1,320 (1,182) (1,258)Inventories (202) (176) 216Prepaid expenses and other current assets (113) 104 (147)Accounts payable (1,546) 1,153 1,579Taxes and other accruals 268 163 111
Net Cash Provided by Operating Activities 7,573 3,648 2,963 Cash Flows From Investing Activities Capital expenditures and investments (2,639) (1,832) (2,844)Proceeds from asset dispositions* 57 86 156Advances/loans—related parties (1) (10) (432)Collection of advances/loans—related parties — 326 108Restricted cash received from consolidation of business — 318 —Other 112 (34) (146)Net Cash Used in Investing Activities (2,471) (1,146) (3,158) Cash Flows From Financing Activities Issuance of debt 2,184 3,508 2,090Repayment of debt (1,144) (3,678) (833)Issuance of common stock 39 35 34Repurchase of common stock (4,645) (1,590) (1,042)Dividends paid on common stock (1,436) (1,395) (1,282)Distributions to noncontrolling interests (207) (120) (75)Net proceeds from issuance of Phillips 66 Partners LP common and preferred units 128 1,205 972Other (86) (76) (42)Net Cash Used in Financing Activities (5,167) (2,111) (178) Effect of Exchange Rate Changes on Cash, Cash Equivalents and Restricted Cash (35) 17 10 Net Change in Cash, Cash Equivalents and Restricted Cash (100) 408 (363)Cash, cash equivalents and restricted cash at beginning of year 3,119 2,711 3,074Cash, Cash Equivalents and Restricted Cash at End of Year $ 3,019 3,119 2,711* Includes return of investments in equity affiliates.See Notes to Consolidated Financial Statements.
78
Table of ContentsIndex to Financial Statements
Consolidated Statement of Changes in Equity Phillips 66 Millions of Dollars Attributable to Phillips 66 Common Stock
Par Value
Capital inExcess of
ParTreasury
StockRetainedEarnings
Accum. Other Comprehensive
LossNoncontrolling
Interests Total December 31, 2015 $ 6 19,145 (7,746) 12,348 (653) 838 23,938Net income — — — 1,555 — 89 1,644Other comprehensive loss — — — — (342) — (342)Dividends paid on common stock — — — (1,282) — — (1,282)Repurchase of common stock — — (1,042) — — — (1,042)Benefit plan activity — 106 — (13) — — 93Issuance of Phillips 66 Partners LP common
units — 308 — — — 483 791Distributions to noncontrolling interests — — — — — (75) (75)December 31, 2016 6 19,559 (8,788) 12,608 (995) 1,335 23,725Net income — — — 5,106 — 142 5,248Other comprehensive income — — — — 378 — 378Dividends paid on common stock — — — (1,395) — — (1,395)Repurchase of common stock — — (1,590) — — — (1,590)Benefit plan activity — 72 — (13) — — 59Issuance of Phillips 66 Partners LP common
and preferred units — 137 — — — 986 1,123Distributions to noncontrolling interests — — — — — (120) (120)December 31, 2017 6 19,768 (10,378) 16,306 (617) 2,343 27,428Cumulative effect of accounting changes — — — 36 — 13 49Net income — — — 5,595 — 278 5,873Other comprehensive loss — — — — (75) — (75)Dividends paid on common stock — — — (1,436) — — (1,436)Repurchase of common stock — — (4,645) — — — (4,645)Benefit plan activity — 63 — (12) — — 51Issuance of Phillips 66 Partners LP common
Shares in Thousands Common Stock Issued Treasury Stock December 31, 2015 639,336 109,926Repurchase of common stock — 12,901Shares issued—share-based compensation 2,258 —December 31, 2016 641,594 122,827Repurchase of common stock — 18,738Shares issued—share-based compensation 2,241 —December 31, 2017 643,835 141,565Repurchase of common stock — 47,961Shares issued—share-based compensation 1,857 —December 31, 2018 645,692 189,526
DollarsYears Ended December 31 Dividends Paid Per Share of Common Stock 2016 $ 2.45 2017 2.73 2018 3.10 See Notes to Consolidated Financial Statements.
80
Table of ContentsIndex to Financial Statements
Notes to Consolidated Financial Statements Phillips 66
Note 1— Summary of Significant Accounting Policies
▪ Consolidation Principles and Investments —Our consolidated financial statements include the accounts of majority-owned, controlledsubsidiaries and variable interest entities (VIEs) where we are the primary beneficiary. Undivided interests in pipelines, natural gas plants andterminals are consolidated on a proportionate basis. See Note 27—Phillips 66 Partners LP , for further discussion on our significantconsolidated VIE.
The equity method is used to account for investments in affiliates in which we have the ability to exert significant influence over the affiliates’operating and financial policies, including VIEs of which we are not the primary beneficiary. Other securities and investments are generallycarried at fair value, or cost less impairments, if any, adjusted up or down for price changes in similar financial instruments issued by theinvestee, when and if observed. See Note 7—Investments, Loans and Long-Term Receivables , for further discussion on our significantnonconsolidated VIEs.
▪ Recasted Financial Information —Certain prior period financial information has been recasted to reflect the current year’s presentation.
▪ Use of Estimates —The preparation of financial statements in conformity with generally accepted accounting principles in the United States(GAAP) requires management to make estimates and assumptions that affect the reported amounts of assets, liabilities, revenues and expenses,and the disclosure of contingent assets and liabilities. Actual results could differ from these estimates.
▪ Foreign Currency Translation —Adjustments resulting from the process of translating foreign functional currency financial statements intoU.S. dollars are included in accumulated other comprehensive income (loss) in stockholders’ equity. Foreign currency transaction gains andlosses result from remeasuring monetary assets and liabilities denominated in a foreign currency into the functional currency of our subsidiaryholding the asset or liability. We include these transaction gains and losses in current earnings. Most of our foreign operations use their localcurrency as the functional currency.
▪ Cash Equivalents —Cash equivalents are highly liquid, short-term investments that are readily convertible to known amounts of cash and willmature within 90 days or less from the date of acquisition. We carry these investments at cost plus accrued interest.
▪ Inventories —We have several valuation methods for our various types of inventories and consistently use the following methods for eachtype of inventory. Crude oil and petroleum products inventories are valued at the lower of cost or market in the aggregate, primarily on the last-in, first-out (LIFO) basis. Any necessary lower-of-cost-or-market write-downs at year end are recorded as permanent adjustments to the LIFOcost basis. LIFO is used to better match current inventory costs with current revenues and to meet tax-conformity requirements. Costs includeboth direct and indirect expenditures incurred in bringing an item or product to its existing condition and location. Materials and suppliesinventories are valued using the weighted-average-cost method.
▪ Fair Value Measurements —We categorize assets and liabilities measured at fair value into one of three different levels depending on theobservability of the inputs employed in the measurement. Level 1 inputs are quoted prices in active markets for identical assets or liabilities.Level 2 inputs are inputs other than quoted prices included within Level 1 that are observable for the asset or liability, either directly orindirectly, through market-corroborated inputs. Level 3 inputs are unobservable inputs for the asset or liability that are used to measure fairvalue to the extent that relevant observable inputs are not available, and that reflect the assumptions we believe market participants would usewhen pricing an asset or liability for which there is little, if any, market activity at the measurement date.
81
Table of ContentsIndex to Financial Statements
▪ Derivative Instruments —Derivative instruments are recorded on the balance sheet at fair value. We have master netting agreements with ourexchange-cleared instrument counterparties and certain of our counterparties to other commodity instrument contracts (e.g., physicalcommodity forward contracts). We have elected to net derivative assets and liabilities with the same counterparty on the balance sheet if thelegal right of offset exists and certain other criteria are met. We also net collateral payables and receivables against derivative assets andderivative liabilities, respectively.
Recognition and classification of the gain or loss that results from recording and adjusting a derivative to fair value depends on the purpose forissuing or holding the derivative. All realized and unrealized gains and losses from derivative instruments for which we do not apply hedgeaccounting are immediately recognized in our consolidated statement of income. Unrealized gains or losses from derivative instruments thatqualify for and are designated as cash flow hedges are recognized in other comprehensive income (loss) and appear on the balance sheet inaccumulated other comprehensive income (loss) until the hedged transactions are recognized in earnings. However, to the extent the change inthe fair value of a derivative instrument exceeds the change in the anticipated cash flows of the hedged transaction, the excess gain or loss isrecognized immediately in earnings.
▪ Loans and Long-Term Receivables —We enter into agreements with other parties to pursue business opportunities, which may require us toprovide loans or advances to certain affiliated and non-affiliated companies. Loans are recorded when cash is transferred or seller financing isprovided to the affiliated or non-affiliated company pursuant to a loan agreement. The loan balance will increase as interest is earned on theoutstanding loan balance and will decrease as interest and principal payments are received. Interest is earned at the loan agreement’s statedinterest rate. Loans and long-term receivables are assessed for impairment when events indicate the loan balance may not be fully recovered.
▪ Impairment of Investments in Nonconsolidated Entities —Investments in nonconsolidated entities accounted for under the equity methodare assessed for impairment whenever changes in the facts and circumstances indicate a loss in value has occurred. When indicators exist, thefair value is estimated and compared to the investment carrying value. If any impairment is judgmentally determined to be other thantemporary, the carrying value of the investment is written down to fair value. The fair value of the impaired investment is determined based onquoted market prices, if available, or upon the present value of expected future cash flows using discount rates and other assumptions believedto be consistent with those used by principal market participants and a market analysis of comparable assets, if appropriate.
▪ Depreciation and Amortization —Depreciation and amortization of properties, plants and equipment (PP&E) are determined by either theindividual-unit-straight-line method or the group-straight-line method (for those individual units that are highly integrated with other units).
▪ Capitalized Interest —A portion of interest from external borrowings is capitalized on major projects with an expected construction period ofone year or longer. Capitalized interest is added to the cost of the related asset, and is amortized over the useful life of the related asset.
▪ Impairment of Properties, Plants and Equipment —PP&E used in operations are assessed for impairment whenever changes in facts andcircumstances indicate a possible significant deterioration in the future cash flows expected to be generated by an asset group. If indicators ofpotential impairment exist, an undiscounted cash flow test is performed. If the sum of the undiscounted expected future pre-tax cash flows of anasset group is less than the carrying value of the asset group, including applicable liabilities, the carrying value of the PP&E included in theasset group is written down to estimated fair value and the write down is reported in the “Impairments” line on our consolidated statement ofincome in the period in which the impairment determination is made. Individual assets are grouped for impairment purposes at the lowest levelfor which identifiable cash flows are largely independent of the cash flows of assets (for example, at a refinery complex level). Because there isusually a lack of quoted market prices for long-lived assets, the fair value of impaired assets is typically determined using one or more of thefollowing methods: the present values of expected future cash flows using discount rates and other assumptions believed to be consistent withthose used by principal market participants; a market multiple of earnings for similar assets; or historical market transactions of similar assets,adjusted using principal market participant assumptions when necessary. Long-lived assets held for sale
82
Table of ContentsIndex to Financial Statements
are accounted for at the lower of amortized cost or fair value, less cost to sell, with fair value determined using a binding negotiated price, ifavailable, or present value of expected future cash flows as previously described.
The expected future cash flows used for impairment reviews and related fair value calculations are based on estimated future volumes, prices,costs, margins and capital project decisions, considering all available evidence at the date of review.
▪ Property Dispositions —When complete units of depreciable property are sold, the asset cost and related accumulated depreciation areeliminated, with any gain or loss reflected in the “Net gain on dispositions” line on our consolidated statement of income. When less thancomplete units of depreciable property are disposed of or retired, the difference between asset cost and salvage value is charged or credited toaccumulated depreciation.
▪ Goodwill —Goodwill represents the excess of the purchase price over the estimated fair value of the net assets acquired in a businesscombination. It is not amortized, but is tested for impairment annually and when events or changes in circumstance indicate that the fair valueof a reporting unit with goodwill is below its carrying value. The impairment test requires allocating goodwill and other assets and liabilities toreporting units. The fair value of each reporting unit is determined and compared to the book value of the reporting unit. If the fair value of thereporting unit is less than the book value, an impairment is recognized for the amount by which the book value exceeds the reporting unit’s fairvalue. A goodwill loss cannot exceed the total amount of goodwill allocated to that reporting unit. For purposes of testing goodwill forimpairment, we have three reporting units with goodwill balances: Transportation, Refining, and Marketing and Specialties.
▪ Intangible Assets Other Than Goodwill —Intangible assets with finite useful lives are amortized using the straight-line method over theiruseful lives. Intangible assets with indefinite useful lives are not amortized, but are tested at least annually for impairment. Each reportingperiod, we evaluate the remaining useful lives of intangible assets not being amortized to determine whether events and circumstances continueto support the indefinite useful life classification. Indefinite-lived intangible assets are considered impaired if their fair value is lower than theirnet book value. The fair value of intangible assets is determined based on quoted market prices in active markets, if available. If quoted marketprices are not available, the fair value of intangible assets is determined based upon the present values of expected future cash flows usingdiscount rates and other assumptions believed to be consistent with those used by principal market participants, or upon estimated replacementcost, if expected future cash flows from the intangible asset are not determinable.
▪ Asset Retirement Obligations and Environmental Costs —The fair value of legal obligations to retire and remove long-lived assets arerecorded in the period in which the obligation arises. When the liability is initially recorded, we capitalize this cost by increasing the carryingamount of the related PP&E. Over time, the liability is increased for the change in its present value, and the capitalized cost in PP&E isdepreciated over the useful life of the related asset. If our estimate of the liability changes after initial recognition, we record an adjustment tothe liability and PP&E.
Environmental expenditures are expensed or capitalized, depending upon their future economic benefit. Expenditures relating to an existingcondition caused by past operations, and those having no future economic benefit, are expensed. Liabilities for environmental expenditures arerecorded on an undiscounted basis (unless acquired in a business combination) when environmental assessments or cleanups are probable andthe costs can be reasonably estimated. Recoveries of environmental remediation costs from other parties, such as state reimbursement funds,are recorded as assets when their receipt is probable and estimable.
▪ Guarantees —The fair value of a guarantee is determined and recorded as a liability at the time the guarantee is given. The initial liability issubsequently reduced as we are released from exposure under the guarantee. We amortize the guarantee liability over the relevant time period,if one exists, based on the facts and circumstances surrounding each type of guarantee. In cases where the guarantee term is indefinite, wereverse the liability when we have information indicating the liability has essentially been relieved or amortize it over an appropriate timeperiod as the fair value of our guarantee exposure declines over time. We amortize the guarantee liability to the related income statement lineitem based on the nature of the guarantee. When it becomes probable we will have to perform on a guarantee, we accrue a separate liability forthe excess amount above the guarantee’s book
83
Table of ContentsIndex to Financial Statements
value, if it is reasonably estimable, based on the facts and circumstances at that time. We reverse the fair value liability only when there is nofurther exposure under the guarantee.
▪ Treasury Stock —We record treasury stock purchases at cost, which includes incremental direct transaction costs. Amounts are recorded asreductions of stockholders’ equity on the consolidated balance sheet.
▪ Revenue Recognition —Our revenues are primarily associated with sales of refined petroleum products, crude oil and natural gas liquids(NGL). Each gallon, or other unit of measure of product, is separately identifiable and represents a distinct performance obligation to which atransaction price is allocated. The transaction prices of our contracts with customers are either fixed or variable, with variable pricing basedupon various market indices. For our contracts that include variable consideration, we utilize the variable consideration allocation exception,whereby the variable consideration is only allocated to the performance obligations that are satisfied during the period. The related revenue isrecognized at a point in time when control passes to the customer, which is when title and the risk of ownership passes to the customer andphysical delivery of goods occurs, either immediately or within a fixed delivery schedule that is reasonable and customary in the industry. Thepayment terms with our customers vary based on the product or service provided, but usually are 30 days or less.
Revenues associated with pipeline transportation services are recognized at a point in time when the volumes are delivered based on contractualrates. Revenues associated with terminaling and storage services are recognized over time as the services are performed based on throughputvolume or capacity utilization at contractual rates.
Revenues associated with transactions commonly called buy/sell contracts, in which the purchase and sale of inventory with the samecounterparty are entered into in contemplation of one another, are combined and reported in the “Purchased crude oil and products” line on ourconsolidated statement of income (i.e., these transactions are recorded net).
▪ Taxes Collected from Customers and Remitted to Governmental Authorities —Effective for reporting periods ending after our adoption ofFinancial Accounting Standards Board (FASB) Accounting Standards Update (ASU) No. 2014-09 on January 1, 2018, excise taxes on sales ofrefined petroleum products charged to our customers are presented net of taxes on sales of refined petroleum products owed to governmentalauthorities in the “Taxes other than income taxes” line on our consolidated statement of income. For reporting periods ending prior to January1, 2018, excise taxes on sales of refined petroleum products charged to our customers are presented in the “Sales and other operating revenues”line on our consolidated statement of income, and excise taxes on sales of refined petroleum products owed to governmental authorities arepresented in the “Taxes other than income taxes” line on our consolidated statement of income. See Note 2—Changes in Accounting Principles, for more information regarding our adoption of this ASU.
Other sales and value-added taxes are recorded net in the “Taxes other than income taxes” line on our consolidated statement of income.
▪ Shipping and Handling Costs —We have elected to account for shipping and handling costs as fulfillment activities and include theseactivities in the “Purchased crude oil and products” line on our consolidated statement of income. Freight costs billed to customers are recordedin “Sales and other operating revenues.”
▪ Maintenance and Repairs —Costs of maintenance and repairs, which are not significant improvements, are expensed when incurred. Majorrefinery maintenance turnarounds are expensed as incurred.
▪ Share-Based Compensation —We recognize share-based compensation expense over the shorter of: (1) the service period (i.e., the statedperiod of time required to earn the award); or (2) the period beginning at the start of the service period and ending when an employee firstbecomes eligible for retirement, but not less than six months as this is the minimum period of time required for an award not to be subject toforfeiture. Our equity-classified programs generally provide accelerated vesting (i.e., a waiver of the remaining period of service required toearn an award) for awards held by employees at the time they become eligible for retirement (at age 55 with 5 years of service). We haveelected to recognize expense on a straight-line basis over the service period for the entire award, irrespective of whether the award was grantedwith ratable or cliff vesting, and have elected to recognize forfeitures of awards when they occur.
84
Table of ContentsIndex to Financial Statements
▪ Income Taxes —Income taxes are accounted for under the asset and liability method. Deferred tax assets and liabilities are recognized for thefuture tax consequences attributable to differences between the financial statement carrying amounts of existing assets and liabilities and theirrespective tax bases. Deferred tax assets and liabilities are measured using enacted tax rates expected to apply to taxable income in the years inwhich those temporary differences are expected to be recovered or settled. The effect on deferred tax assets and liabilities of a change in taxrates is recognized in income in the period that includes the enactment date. Interest related to unrecognized income tax benefits is reflected ininterest expense, and penalties in operating expenses.
Note 2— Changes in Accounting Principles
Effective January 1, 2018, we adopted ASU No. 2017-05, “Other Income—Gains and Losses from the Derecognition of Nonfinancial Assets (Subtopic610-20),” which clarifies the scope and accounting for the sale or transfer of nonfinancial assets and in substance nonfinancial assets to noncustomers,including partial sales. This ASU eliminated the use of carryover basis for most nonmonetary exchanges, including contributions of assets to equity-method joint ventures, and could result in the entity recognizing a gain or loss on the sale or transfer of nonfinancial assets. At the time of adoption,there was no impact on our consolidated financial statements from this ASU.
Effective January 1, 2018, we adopted ASU No. 2017-01, “Business Combinations (Topic 805): Clarifying the Definition of a Business,” whichclarifies the definition of a business with the objective of adding guidance to assist in evaluating whether transactions should be accounted for asacquisitions of assets or businesses. The amendment provides a screen for determining when a transaction involves an acquisition of a business. Ifsubstantially all of the fair value of the gross assets acquired is concentrated in a single identifiable asset, or a group of similar identifiable assets, thenthe screen is met and the transaction is not considered an acquisition of a business. If the screen is not met, the amendment requires that to beconsidered a business, the operation must include at a minimum an input and a substantive process that together significantly contribute to the ability tocreate an output. The guidance may reduce the number of future transactions accounted for as business acquisitions. At the time of adoption, there wasno impact on our consolidated financial statements from this ASU.
Effective January 1, 2018, we adopted ASU No. 2016-16, “Income Taxes (Topic 740): Intra-Entity Asset Transfers of Assets Other Than Inventory.” This ASU requires the income tax consequences of an intra-entity transfer of an asset, other than inventory, to be recognized when the transfer occurs. At the time of adoption, this ASU did not have a material impact on our consolidated financial statements.
Effective January 1, 2018, we adopted ASU No. 2016-01, “Financial Instruments—Overall (Subtopic 825-10): Recognition and Measurement ofFinancial Assets and Financial Liabilities.” The majority of this ASU’s provisions amend only the presentation or disclosures of financial instruments;however, one provision could also affect net income. Equity investments carried under the cost method or the lower of cost or fair value method ofaccounting, in accordance with previous GAAP, will have to be carried at fair value with changes in fair value recorded in net income. For equityinvestments that do not have readily determinable fair values, a company may elect to carry such investments at cost less impairments, if any, adjustedup or down for price changes in similar financial instruments issued by the investee, when and if observed. At the time of adoption, this ASU did nothave a material impact on our consolidated financial statements.
85
Table of ContentsIndex to Financial Statements
Effective January 1, 2018, we adopted ASU No. 2014-09, “Revenue from Contracts with Customers (Topic 606),” using the modified retrospectivetransition method applied to all contracts. Under the new guidance, recognition of revenue involves a multiple step approach including (i) identifyingthe contract, (ii) identifying the separate performance obligations, (iii) determining the transaction price, (iv) allocating the price to the performanceobligations and (v) recognizing the revenue as the obligations are satisfied. Additional disclosures are required to enable users of financial statements tounderstand the nature, amount, timing and uncertainty of revenue and cash flows arising from contracts with customers.
We recorded noncash cumulative effect adjustments to our opening total equity balance as of January 1, 2018, to increase retained earnings by $35million , net of $11 million of income taxes, and noncontrolling interests by $13 million . These adjustments primarily reflected amounts recorded byour equity-method investees related to contracts that contain tier-pricing and minimum volume commitments with recovery provisions.
In addition, prospectively from January 1, 2018, our presentation of excise taxes on sales of refined petroleum products changed to a net basis from agross basis. As a result, the “Sales and other operating revenues” and “Taxes other than income taxes” lines on our consolidated statement of income forthe year ended December 31, 2018 , are not presented on a comparable basis to the years ended December 31, 2017 and 2016. See Note 1—Summaryof Significant Accounting Policies , for more information on our presentation of excise taxes on sales of refined petroleum products.
Note 3— Sales and Other Operating Revenues
Disaggregated RevenuesThe following tables present our disaggregated sales and other operating revenues:
Millions of Dollars 2018 2017* 2016*Product Line and Services Refined petroleum products $ 87,967 85,405 73,385Crude oil resales 16,419 11,808 7,594NGL 6,161 4,670 3,107Services and other 914 471 193Consolidated sales and other operating revenues $ 111,461 102,354 84,279
Geographic Location** United States $ 86,401 75,684 59,742United Kingdom 11,054 10,626 9,895Germany 4,352 6,692 6,128Other foreign countries 9,654 9,352 8,514Consolidated sales and other operating revenues $ 111,461 102,354 84,279* Sales and other operating revenues for the years ended December 31, 2017 and 2016, are presented in accordance with accounting standards in effect prior to our adoption of ASU No.
2014-09 on January 1, 2018. See Note 2—Changes in Accounting Principles , for further discussion regarding our adoption of ASU No. 2014-09.** Sales and other operating revenues are attributable to countries based on the location of the operations generating the revenues.
86
Table of ContentsIndex to Financial Statements
Contract-Related Assets and LiabilitiesAt December 31, 2018 , and January 1, 2018, receivables from contracts with customers were $4,993 million and $6,186 million , respectively.Significant non-customer balances, such as buy/sell receivables and excise tax receivables, were excluded from these amounts.
Our contract-related assets also include payments we make to our marketing customers related to incentive programs. An incentive payment is initiallyrecognized as an asset and subsequently amortized as a reduction to revenue over the contract term, which generally ranges from 5 to 15 years. AtDecember 31, 2018 , and January 1, 2018, our asset balances related to such payments were $248 million and $208 million , respectively.
Our contract liabilities represent advances from our customers prior to product or service delivery. At December 31, 2018 , and January 1, 2018,contract liabilities were not material.
Remaining Performance ObligationsMost of our contracts with customers are spot contracts or term contracts with only variable consideration. We do not disclose remaining performanceobligations for these contracts as the expected duration is one year or less or because the variable consideration has been allocated entirely to anunsatisfied performance obligation. We also have certain contracts in our Midstream segment that include minimum volume commitments with fixedpricing, which mostly expire by 2021. At December 31, 2018 , the remaining performance obligations related to these minimum volume commitmentcontracts were not material.
Note 4— Inventories
Inventories at December 31 consisted of the following:
Millions of Dollars 2018 2017
Crude oil and petroleum products $ 3,238 3,106Materials and supplies 305 289 $ 3,543 3,395
Inventories valued on the LIFO basis totaled $3,123 million and $2,980 million at December 31, 2018 and 2017 , respectively. The estimated excess ofcurrent replacement cost over LIFO cost of inventories amounted to approximately $2.9 billion and $4.3 billion at December 31, 2018 and 2017 ,respectively.
LIFO inventory liquidations did not have a material impact on net income for the years ended December 31, 2018 and 2017 . For the year endedDecember 31, 2016 , LIFO inventory liquidations, excluding the disposition of the Whitegate Refinery, decreased net income by approximately $68million .
In conjunction with the Whitegate Refinery disposition, the refinery’s LIFO inventory values were liquidated causing a decrease in net income of $62million during 2016. This LIFO liquidation impact was included in the net gain recognized on the disposition.
87
Table of ContentsIndex to Financial Statements
Note 5— Business Combinations
Merey Sweeny LLC, successor to Merey Sweeny, L.P. (both referred to herein as Merey Sweeny), owns a delayed coker and related facilities at theSweeny Refinery. In February 2017, we began accounting for Merey Sweeny as a consolidated subsidiary because the exercise of a call right triggeredby certain defaults by the co-venturer, Petróleos de Venezuela S.A. (PDVSA), with respect to supply of crude oil to the Sweeny Refinery ceased to besubject to legal challenge. The purchase price for PDVSA’s 50 percent ownership interest was determined by a contractual formula. As the distributionsPDVSA received from Merey Sweeny exceeded the amounts it contributed to Merey Sweeny, the contractual formula required no cash considerationfor the acquisition.
Based on a third-party appraisal of the fair value of Merey Sweeny’s net assets, utilizing discounted cash flows and replacement costs, the acquisition ofPDVSA’s 50 percent interest resulted in the recognition of a pre-tax gain of $423 million in the first quarter of 2017. This gain was included in the“Other income” line on our consolidated statement of income. The fair value of our original equity interest in Merey Sweeny immediately prior to thedeemed acquisition was $145 million . As a result of the transaction, we recorded $318 million of restricted cash, $250 million of PP&E and $238million of debt, as well as a net $93 million for the elimination of our equity investment in Merey Sweeny and net intercompany payables. Ouracquisition accounting was finalized in the first quarter of 2017.
The results of Merey Sweeny were included in our Refining segment until October 2017, when we contributed our 100 percent interest in MereySweeny to Phillips 66 Partners LP (Phillips 66 Partners), which is included in our Midstream segment.
In November 2016, Phillips 66 Partners acquired NGL logistics assets located in southeast Louisiana, consisting of approximately 500 miles ofpipelines and storage caverns connecting multiple fractionation facilities, refineries and a petrochemical facility. The acquisition provided anopportunity for fee-based growth in the Louisiana market within our Midstream segment. The acquisition was included in the “Capital expenditures andinvestments” line on our consolidated statement of cash flows. At the acquisition date, we recorded $183 million of PP&E and $3 million of goodwill.Our acquisition accounting was finalized during the first quarter of 2017, with no change to the provisional amounts recorded in 2016.
Note 6— Assets Held for Sale or Sold
In September 2016, we completed the sale of the Whitegate Refinery and related marketing assets, which were included primarily in our Refiningsegment. The net carrying value of the assets at the time of their disposition was $135 million , which consisted of $127 million of inventory, otherworking capital, and PP&E; and $8 million of allocated goodwill. An immaterial gain was recognized in 2016 on the disposition.
88
Table of ContentsIndex to Financial Statements
Note 7— Investments, Loans and Long-Term Receivables
Components of investments and long-term receivables at December 31 were:
Equity InvestmentsSignificant affiliated companies accounted for under the equity method, including nonconsolidated VIEs, at December 31, 2018 and 2017, included:
• Chevron Phillips Chemical Company LLC (CPChem) — 50 -percent-owned joint venture that manufactures and markets petrochemicals andplastics. We have multiple supply and purchase agreements in place with CPChem, ranging in initial terms from one to 99 years, with extensionoptions. These agreements cover sales and purchases of refined petroleum products, solvents, and petrochemical and NGL feedstocks, as well asfuel oils and gases. All products are purchased and sold under specified pricing formulas based on various published pricing indices. AtDecember 31, 2018 and 2017, the book value of our investment in CPChem was $6,233 million and $6,222 million , respectively.
• DCP Midstream, LLC (DCP Midstream) — 50 -percent-owned joint venture that owns and operates gas plants, gathering systems, storagefacilities and fractionation plants, through its subsidiary DCP Midstream, LP (DCP Partners). DCP Midstream markets a portion of its NGL to usand our equity affiliates under existing contracts. At December 31, 2018 and 2017, the book value of our investment in DCP Midstream was$2,240 million and $2,227 million , respectively.
• WRB Refining LP (WRB) — 50 -percent-owned joint venture that owns the Wood River and Borger refineries located in Roxana, Illinois, andBorger, Texas, respectively, for which we are the operator and managing partner. At December 31, 2018 and 2017, the book value of ourinvestment in WRB was $2,108 million and $2,269 million , respectively.
We have a basis difference for our investment in WRB because the carrying value of our investment is lower than our share of WRB’s recordednet assets. This basis difference was primarily the result of our contribution of these refineries to WRB. On the contribution closing date, a basisdifference was created because the fair value of the contributed assets recorded by WRB exceeded our historical book value. The contribution-related basis difference is primarily being amortized and recognized as a benefit to equity earnings evenly over a period of 26 years, which wasthe estimated remaining useful life of the refineries’ PP&E at the contribution closing date. At December 31, 2018, the aggregate remainingbasis difference for this investment was $2,610 million . Equity earnings for the years ended December 31, 2018 , 2017 and 2016 , wereincreased by $177 million , $186 million and $185 million , respectively, due to the amortization of our aggregate basis difference.
• Dakota Access, LLC (Dakota Access) and Energy Transfer Crude Oil Company, LLC (ETCO) —Phillips 66 Partners’ two 25 -percent-ownedjoint ventures. Dakota Access owns a pipeline system that delivers crude oil from the Bakken/Three Forks production area in North Dakota toPatoka, Illinois, and ETCO owns a connecting crude oil pipeline system from Patoka, Illinois, to Nederland, Texas. These two pipeline systemscollectively form the Bakken Pipeline system, which is operated by a co-venturer. The Bakken Pipeline system went into service in June 2017.At December 31, 2018 and 2017, the aggregate book value of Phillips 66 Partners’ investments in Dakota Access and ETCO was $608 millionand $621 million , respectively.
89
Table of ContentsIndex to Financial Statements
• DCP Sand Hills Pipeline, LLC (Sand Hills) —Phillips 66 Partners’ 33 -percent-owned joint venture that owns an NGL pipeline system thatextends from the Permian Basin and Eagle Ford to facilities on the Texas Gulf Coast and to the Mont Belvieu, Texas market hub. The Sand HillsPipeline system is operated by DCP Partners. At December 31, 2018 and 2017, the book value of Phillips 66 Partners’ investment in Sand Hillswas $601 million and $515 million , respectively.
• Rockies Express Pipeline LLC (REX) — 25 -percent-owned joint venture that owns a natural gas pipeline system that extends from Wyomingand Colorado to Ohio with a bi-directional section that extends from Ohio to Illinois. The REX Pipeline system is operated by our co-venturer.In July 2018, we contributed $138 million to REX to cover our 25 percent share of a $550 million debt repayment. Our capital contribution wasincluded in the “Capital expenditures and investments” line on our consolidated statement of cash flows. At December 31, 2018 and 2017, thebook value of our investment in REX was $600 million and $445 million , respectively.
We have a basis difference for our investment in REX because the carrying value of our investment is lower than our share of REX’s recordednet assets. This basis difference was created by historical impairment charges we recorded for this investment. This basis difference is beingamortized and recognized as a benefit to equity earnings evenly over a period of 25 years, which was the estimated remaining useful life ofREX’s PP&E when the impairment charges were recorded. At December 31, 2018, the remaining basis difference for this investment was $357million . Equity earnings for the years ended December 31, 2018, 2017 and 2016, were each increased by approximately $20 million due to theamortization of our basis difference.
• Gray Oak Pipeline, LLC (Gray Oak) —Phillips 66 Partners’ consolidated subsidiary, Gray Oak Holdings LLC (Holdings LLC), owned a 75percent interest in a joint venture formed in 2018 to develop and construct the Gray Oak Pipeline system which, upon completion, will providecrude oil transportation from the Permian Basin and Eagle Ford to destinations in the Corpus Christi and Freeport markets on the Texas GulfCoast. The pipeline system is expected to be placed in service by the end of 2019.
Phillips 66 Partners accounts for the investment in Gray Oak under the equity method because it does not have sufficient voting rights over keygovernance provisions to assert control over Gray Oak. Gray Oak is considered a VIE because it does not have sufficient equity at risk to fullyfund the construction of all assets required for principal operations. Phillips 66 Partners has determined it is not the primary beneficiary becauseit and its co-venturer jointly direct the activities of Gray Oak that most significantly impact economic performance. At December 31, 2018 ,Phillips 66 Partners’ maximum exposure to loss was $373 million , which represented the book value of the investment in Gray Oak of $288million and guaranteed purchase obligations of $85 million .
In February 2019, another party exercised its option to acquire a 10 percent interest in Gray Oak, which reduced Holdings LLC’s ownershipinterest to 65 percent .
See Note 27—Phillips 66 Partners LP , for additional information regarding Phillips 66 Partners’ ownership in Holdings LLC and Gray Oak.
• Bayou Bridge Pipeline, LLC (Bayou Bridge )—Phillips 66 Partners’ 40 -percent-owned joint venture that owns a pipeline that delivers crude oilfrom Nederland, Texas, to Lake Charles, Louisiana. The Bayou Bridge Pipeline is operated by our co-venturer. An extension of the pipelinefrom Lake Charles to St. James, Louisiana, is expected to be in service in March 2019. At December 31, 2018 and 2017, the book value of ourinvestment in Bayou Bridge was $277 million and $173 million , respectively.
• DCP Southern Hills Pipeline, LLC (Southern Hills) —Phillips 66 Partners’ 33 -percent-owned joint venture that owns an NGL pipeline systemthat extends from the Midcontinent region to the Mont Belvieu, Texas market hub. The Southern Hills Pipeline system is operated by DCPPartners. At December 31, 2018 and 2017, the book value of Phillips 66 Partners’ investment in Southern Hills was $206 million and $209million , respectively.
• OnCue Holdings, LLC (OnCue) — 50 -percent-owned joint venture that owns and operates retail convenience stores. We fully guaranteedvarious debt agreements of OnCue, and our co-venturer did not participate in the guarantees. This entity is considered a VIE because our debtguarantees resulted in OnCue not being exposed to all potential losses. We have determined we are not the primary beneficiary because we donot have the power to
90
Table of ContentsIndex to Financial Statements
direct the activities that most significantly impact economic performance. At December 31, 2018 , our maximum exposure to loss was $122million , which represented the book value of our investment in OnCue of $69 million and guaranteed debt obligations of $53 million .
Total distributions received from affiliates were $2,942 million , $1,270 million , and $616 million for the years ended December 31, 2018 , 2017 and2016 , respectively. In addition, at December 31, 2018 , retained earnings included approximately $2,285 million related to the undistributed earnings ofaffiliated companies.
Summarized 100 percent financial information for all affiliated companies accounted for under the equity method, on a combined basis, was:
Related Party Loans and AdvancesIn 2017, we received payment of the $250 million outstanding sponsor loans to the Dakota Access and ETCO joint ventures. We also received paymentof the $75 million partner loan we made to WRB in 2016. These cash inflows, totaling $325 million , are included in the “Collection of advances/loans—related parties” line on our consolidated statement of cash flows.
Note 8— Properties, Plants and Equipment
Our investment in PP&E is recorded at cost. Investments in refining and processing facilities are generally depreciated on a straight-line basis over a 25-year life, pipeline assets over a 45 -year life and terminal assets over a 33 -year life. The company’s investment in PP&E, with the associatedaccumulated depreciation and amortization (Accum. D&A), at December 31 was:
GoodwillThe carrying amount of goodwill by segment at December 31 was:
Millions of Dollars
Midstream Refining Marketing and
Specialties Total
Balance at January 1, 2017 $ 626 1,805 839 3,270Adjustments — — — —Balance at December 31, 2017 626 1,805 839 3,270Adjustments — — — —Balance at December 31, 2018 $ 626 1,805 839 3,270
Intangible AssetsThe gross carrying value of indefinite-lived intangible assets at December 31 consisted of the following:
Millions of Dollars 2018 2017
Trade names and trademarks $ 503 503Refinery air and operating permits 250 252Other — 1 $ 753 756
The net book value of our amortized intangible assets was $116 million and $120 million at December 31, 2018 and 2017, respectively. Acquisitions ofamortized intangible assets were not material in 2018 and 2017. For the years ended December 31, 2018 , 2017 and 2016 , amortization expense was$14 million , $21 million and $18 million , respectively, and is expected to be less than $20 million per year in future years.
92
Table of ContentsIndex to Financial Statements
Note 10— Asset Retirement Obligations and Accrued Environmental Costs
Asset retirement obligations and accrued environmental costs at December 31 were:
Millions of Dollars 2018 2017
Asset retirement obligations $ 261 268Accrued environmental costs 447 458Total asset retirement obligations and accrued environmental costs 708 726Asset retirement obligations and accrued environmental costs due within one year* (84) (85)Long-term asset retirement obligations and accrued environmental costs $ 624 641* Classified as a current liability on the consolidated balance sheet, under the caption “Other accruals.”
Asset Retirement ObligationsWe have asset retirement obligations that we are required to perform under law or contract once an asset is permanently taken out of service. Most ofthese obligations are not expected to be paid until many years in the future and are expected to be funded from general company resources at the time ofremoval. Our largest individual obligations involve asbestos abatement at refineries.
During the years ended December 31, 2018 and 2017 , our overall asset retirement obligation changed as follows:
Millions of Dollars 2018 2017
Balance at January 1 $ 268 244Accretion of discount 10 10Changes in estimates of existing obligations 3 17Spending on existing obligations (15) (14)Foreign currency translation (5) 11Balance at December 31 $ 261 268
Accrued Environmental CostsFor the year ended December 31, 2018, the $11 million decrease in total accrued environmental costs was due to payments and settlements during theyear, which exceeded new accruals, accrual adjustments and accretion.
Of our total accrued environmental costs at December 31, 2018 , $224 million was primarily related to cleanup at domestic refineries and undergroundstorage tanks at U.S. service stations; $167 million was associated with nonoperator sites; and $56 million was related to sites at which we have beennamed a potentially responsible party under federal or state laws. A large portion of our expected environmental expenditures have been discounted asthese obligations were acquired in various business combinations. Expected expenditures for acquired environmental obligations were discounted usinga weighted-average discount rate of approximately 5 percent . At December 31, 2018 , the accrued balance for acquired environmental liabilities was$261 million . The expected future undiscounted payments related to the portion of the accrued environmental costs that have been discounted are: $24million in 2019 , $41 million in 2020 , $23 million in 2021 , $22 million in 2022 , $15 million in 2023 , and $206 million in the aggregate for all yearsafter 2023 .
93
Table of ContentsIndex to Financial Statements
Note 11— Earnings Per Share
The numerator of basic earnings per share (EPS) is net income attributable to Phillips 66, reduced by noncancelable dividends paid on unvested share-based employee awards during the vesting period (participating securities). The denominator of basic EPS is the sum of the daily weighted-averagenumber of common shares outstanding during the periods presented and fully vested stock and unit awards that have not yet been issued as commonstock. The numerator of diluted EPS is also based on net income attributable to Phillips 66, which is reduced only by dividend equivalents paid onparticipating securities for which the dividends are more dilutive than the participation of the awards in the earnings of the periods presented. To theextent unvested stock, unit or option awards and vested unexercised stock options are dilutive, they are included with the weighted-average commonshares outstanding in the denominator. Treasury stock is excluded from the denominator in both basic and diluted EPS.
2018 2017 2016 Basic Diluted Basic Diluted Basic DilutedAmounts Attributed to Phillips 66 Common Stockholders
(millions) : Net income attributable to Phillips 66 $ 5,595 5,595 5,106 5,106 1,555 1,555Income allocated to participating securities (6) — (6) — (6) (5)
Net income available to common stockholders $ 5,589 5,595 5,100 5,106 1,549 1,550
Weighted-average common shares outstanding (thousands) : 467,483 470,708 511,268 515,090 523,250 527,531Effect of share-based compensation 3,225 3,339 3,822 3,418 4,281 2,535Weighted-average common shares outstanding—EPS 470,708 474,047 515,090 518,508 527,531 530,066
Earnings Per Share of Common Stock (dollars) $ 11.87 11.80 9.90 9.85 2.94 2.92
94
Table of ContentsIndex to Financial Statements
Note 12— Debt
Short-term and long-term debt at December 31 was:
Millions of Dollars 2018 2017Phillips 66 4.300% Senior Notes due April 2022 $ 2,000 2,0003.900% Senior Notes due March 2028 800 —4.650% Senior Notes due November 2034 1,000 1,0005.875% Senior Notes due May 2042 1,500 1,5004.875% Senior Notes due November 2044 1,700 1,500Floating-rate notes due April 2019 at 2.009% at year-end 2017 — 300Floating-rate notes due April 2020 at 3.186% and 2.109% at year-end 2018 and 2017, respectively 300 300Term loan due April 2020 at 3.422% and 2.469% at year-end 2018 and 2017, respectively 200 450Floating-rate Senior Notes due February 2021 at 3.289% at year-end 2018 500 —Other 1 1
Phillips 66 Partners 2.646% Senior Notes due February 2020 300 3003.605% Senior Notes due February 2025 500 5003.550% Senior Notes due October 2026 500 5003.750% Senior Notes due March 2028 500 5004.680% Senior Notes due February 2045 450 4504.900% Senior Notes due October 2046 625 625Tax-exempt bonds due April 2020 and April 2021 at 1.885% and 1.935% at year-end 2018 and 2017,
respectively 75 100Revolving credit facility due January 2019 and October 2021 at weighted-average rate of 3.669% at
year-end 2018 125 —Debt at face value 11,076 10,026Capitalized leases 184 192Net unamortized discounts and debt issuance costs (100) (108)Total debt 11,160 10,110Short-term debt (67) (41)Long-term debt $ 11,093 10,069
Maturities of borrowings outstanding at December 31, 2018 , inclusive of net unamortized discounts and debt issuance costs, for each of the years from2019 through 2023 are $67 million , $836 million , $636 million , $2,005 million and $11 million , respectively.
95
Table of ContentsIndex to Financial Statements
Debt Issuances
2018 IssuancesOn March 1, 2018, Phillips 66 closed on a public offering of $1,500 million aggregate principal amount of unsecured notes consisting of:
• $500 million of floating-rate Senior Notes due February 2021. Interest on these notes is equal to the three-month London Interbank OfferedRate (LIBOR) plus 0.60% per annum and is payable quarterly in arrears on February 26, May 26, August 26 and November 26, beginning onMay 29, 2018.
• $800 million of 3.900% Senior Notes due March 2028. Interest on these notes is payable semiannually on March 15 and September 15 of eachyear, beginning on September 15, 2018.
• An additional $200 million of our 4.875% Senior Notes due November 2044. Interest on these notes is payable semiannually on May 15 andNovember 15 of each year, beginning on May 15, 2018.
These notes are guaranteed by Phillips 66 Company, a wholly owned subsidiary. Phillips 66 used the net proceeds from the issuance of these notes andcash on hand to repay commercial paper borrowings during the three months ended March 31, 2018, and for general corporate purposes. Thecommercial paper borrowings during the three months ended March 31, 2018, were primarily used to repurchase shares of our common stock. See Note17—Equity , for additional information.
2017 IssuancesIn October 2017, Phillips 66 Partners closed on a public offering of $650 million aggregate principal amount of senior notes, consisting of $500 millionof 3.750% Senior Notes due March 2028 and $150 million of 4.680% Senior Notes due February 2045. Interest on the 3.750% Senior Notes due March2028 is payable semiannually in arrears on March 1 and September 1 of each year, commencing on March 1, 2018. Interest on the 4.680% Senior Notesdue February 2045 is payable semiannually in arrears on February 15 and August 15 of each year.
In April 2017, Phillips 66 completed a private offering of $600 million aggregate principal amount of unsecured notes, consisting of $300 million offloating-rate notes due April 2019 (2019 Notes) and $300 million of floating-rate notes due April 2020 (2020 Notes). Interest on these notes is a floatingrate equal to three-month LIBOR plus 0.65% per annum for the 2019 Notes and three-month LIBOR plus 0.75% per annum for the 2020 Notes. Intereston both series of notes is payable quarterly in arrears on January 15, April 15, July 15 and October 15, commencing in July 2017. The 2019 Notesmature on April 15, 2019, and the 2020 Notes mature on April 15, 2020. The notes are guaranteed by Phillips 66 Company, a wholly owned subsidiary.
Also in April 2017, Phillips 66 entered into term loan facilities with an aggregate borrowing amount of $900 million , consisting of a $450 million 364 -day facility due April 2018 and a $450 million three -year facility due April 2020. Interest on the term loans is a floating rate based on either theEurodollar rate or the reference rate, plus a margin determined by our long-term credit ratings.
In February 2017, as part of the consolidation of Merey Sweeny, Phillips 66 assumed $135 million of 8.850% Senior Notes due in 2019 and $100million of tax-exempt bonds due between 2018 and 2021. See Note 5—Business Combinations , for additional information regarding the consolidationof Merey Sweeny.
Debt Repayments
2018 RepaymentsIn December 2018, Phillips 66 repaid the $300 million floating-rate notes due April 2019.
In June 2018, Phillips 66 repaid $250 million of the $450 million outstanding under its three -year term loan facility due April 2020.
96
Table of ContentsIndex to Financial Statements
2017 RepaymentsIn October 2017, as part of a contribution of assets to Phillips 66 Partners, Phillips 66 Partners assumed the $450 million term loan outstanding underthe 364 -day facility originally issued in April 2017, and subsequently repaid the loan. See Note 27—Phillips 66 Partners LP , for additionalinformation.
In May 2017, Phillips 66 repaid $1,500 million of 2.950% Senior Notes upon maturity with the funding from the April 2017 debt issuances discussedabove. In addition, Phillips 66 repaid $135 million of Merey Sweeny 8.850% Senior Notes due in 2019 originally recorded in February 2017 as part ofthe consolidation of Merey Sweeny. See Note 5—Business Combinations , for additional information regarding the consolidation of Merey Sweeny.
In 2017, Phillips 66 Partners repaid the $210 million of borrowings outstanding under its $750 million revolving credit facility at December 31, 2016.
Credit Facilities and Commercial PaperPhillips 66 has a $5 billion revolving credit facility that extends until October 2021. This facility may be used for direct bank borrowings, as support forissuances of letters of credit, or as support for our commercial paper program. The facility is with a broad syndicate of financial institutions and containscovenants that are usual and customary for an agreement of this type for comparable commercial borrowers, including a maximum consolidated netdebt-to-capitalization ratio of 60 percent . The agreement has customary events of default, such as nonpayment of principal when due; nonpayment ofinterest, fees or other amounts; violation of covenants; cross-payment default and cross-acceleration (in each case, to indebtedness in excess of athreshold amount); and a change of control. Borrowings under the facility will incur interest at the LIBOR plus a margin based on the credit rating ofour senior unsecured long-term debt as determined from time to time by Standard & Poor’s Financial Services LLC and Moody’s Investors Service,Inc. The facility also provides for customary fees, including administrative agent fees and commitment fees. At December 31, 2018 and 2017 , noamount had been drawn under this revolving credit agreement.
Phillips 66 has a $5 billion commercial paper program for short-term working capital needs that is supported by our revolving credit facility.Commercial paper maturities are generally limited to 90 days. At December 31, 2018 and 2017 , no borrowings were outstanding under the commercialpaper program.
Phillips 66 Partners has a $750 million revolving credit facility that extends until October 2021. The Phillips 66 Partners facility is with a broadsyndicate of financial institutions and contains covenants that are usual and customary for an agreement of this type for comparable commercialborrowers. At Phillips 66 Partners’ option, outstanding borrowings under this facility bear interest at either i) the Eurodollar rate plus a margin based onits credit rating; or ii) the base rate (as described in the facility agreement) plus a margin based on its credit rating. Eurodollar rate borrowings are dueon the facility’s termination date, while base rate borrowings are due the earlier of the facility’s termination date or the fourteenth business day aftersuch borrowings were made. At December 31, 2018 , Phillips 66 Partners had borrowings of $125 million outstanding under this facility. There were noborrowings outstanding under this facility at December 31, 2017 .
Note 13— Guarantees
At December 31, 2018 , we were liable for certain contingent obligations under various contractual arrangements as described below. We recognize aliability for the fair value of our obligation as a guarantor for newly issued or modified guarantees. Unless the carrying amount of the liability is notedbelow, we have not recognized a liability either because the guarantees were issued prior to December 31, 2002, or because the fair value of theobligation is immaterial. In addition, unless otherwise stated, we are not currently performing with any significance under the guarantees and expectfuture performance to be either immaterial or have only a remote chance of occurrence.
Guarantees of Joint Venture ObligationsAt December 31, 2018 , we had guarantees outstanding for our portion of certain joint venture debt and purchase obligations, which have remainingterms of up to seven years. The maximum potential amount of future payments to third parties under these guarantees was approximately $304 million .Payment would be required if a joint venture defaults on its obligations.
97
Table of ContentsIndex to Financial Statements
Residual Value GuaranteesUnder the operating lease agreement on our headquarters facility in Houston, Texas, we have a residual value guarantee with a maximum futureexposure of $554 million . The operating lease term ends in June 2021 and provides us the option, at the end of the lease term, to request to renew thelease, purchase the facility or assist the lessor in marketing it for resale.
We also have residual value guarantees associated with railcar and airplane leases with maximum future exposures totaling $300 million , which haveremaining terms of up to five years. For the years ended December 31, 2018 , 2017 and 2016 , we recognized incremental operating lease rental expenseof $20 million , $45 million and $28 million , respectively, for residual value deficiencies for certain railcar leases based on third-party appraisals of therailcars’ expected fair value at the end of the lease terms. These railcar leases were amended in November 2018 and October 2017 resulting in residualvalue deficiency settlement payments of $40 million and $53 million , respectively. At December 31, 2018 , we do not have any liabilities recorded forresidual value deficiencies under our railcar leases.
IndemnificationsOver the years, we have entered into various agreements to sell ownership interests in certain corporations, joint ventures and assets that gave rise toindemnification. Agreements associated with these sales include indemnifications for taxes, litigation, environmental liabilities, permits and licensesand employee claims, as well as real estate indemnity against tenant defaults. The provisions of these indemnifications vary greatly. The majority ofthese indemnifications are related to environmental issues, which generally have indefinite terms and potentially unlimited exposure. At December 31,2018 and 2017, the carrying amount of recorded indemnifications was $171 million and $193 million , respectively.
We amortize the indemnification liability over the relevant time period, if one exists, based on the facts and circumstances surrounding each type ofindemnity. In cases where the indemnification term is indefinite, we will reverse the liability when we have information to support that the liability wasessentially relieved or amortize the liability over an appropriate time period as the fair value of our indemnification exposure declines. Although it isreasonably possible future payments may exceed amounts recorded, due to the nature of the indemnifications, it is not possible to make a reasonableestimate of the maximum potential amount of future payments. At December 31, 2018 and 2017, environmental accruals for known contamination of$101 million and $104 million , respectively, were included in the carrying amount of recorded indemnifications. These environmental accruals wereprimarily included in the “Asset retirement obligations and accrued environmental costs” line on our consolidated balance sheet. For additionalinformation about environmental liabilities, see Note 14—Contingencies and Commitments .
Indemnification and Release AgreementIn 2012, in connection with our separation from ConocoPhillips (the Separation), we entered into the Indemnification and Release Agreement. Thisagreement governs the treatment between ConocoPhillips and us of matters relating to indemnification, insurance, litigation responsibility andmanagement, and litigation document sharing and cooperation arising in connection with the Separation. Generally, the agreement provides for cross-indemnities principally designed to place financial responsibility for the obligations and liabilities of our business with us and financial responsibilityfor the obligations and liabilities of ConocoPhillips’ business with ConocoPhillips. The agreement also establishes procedures for handling claimssubject to indemnification and related matters.
98
Table of ContentsIndex to Financial Statements
Note 14— Contingencies and Commitments
A number of lawsuits involving a variety of claims that arose in the ordinary course of business have been filed against us or are subject toindemnifications provided by us. We also may be required to remove or mitigate the effects on the environment of the placement, storage, disposal orrelease of certain chemical, mineral and petroleum substances at various active and inactive sites. We regularly assess the need for financial recognitionor disclosure of these contingencies. In the case of all known contingencies (other than those related to income taxes), we accrue a liability when theloss is probable and the amount is reasonably estimable. If a range of amounts can be reasonably estimated and no amount within the range is a betterestimate than any other amount, then the minimum of the range is accrued. We do not reduce these liabilities for potential insurance or third-partyrecoveries. If applicable, we accrue receivables for probable insurance or other third-party recoveries. In the case of income-tax-related contingencies,we use a cumulative probability-weighted loss accrual in cases where sustaining a tax position is less than certain. See Note 21—Income Taxes , foradditional information about income-tax-related contingencies.
Based on currently available information, we believe it is remote that future costs related to known contingent liability exposures will exceed currentaccruals by an amount that would have a material adverse impact on our consolidated financial statements. As we learn new facts concerningcontingencies, we reassess our position both with respect to accrued liabilities and other potential exposures. Estimates particularly sensitive to futurechanges include contingent liabilities recorded for environmental remediation, tax and legal matters. Estimated future environmental remediation costsare subject to change due to such factors as the uncertain magnitude of cleanup costs, the unknown time and extent of such remedial actions that may berequired, and the determination of our liability in proportion to that of other potentially responsible parties. Estimated future costs related to tax andlegal matters are subject to change as events evolve and as additional information becomes available during the administrative and litigation processes.
EnvironmentalWe are subject to international, federal, state and local environmental laws and regulations. When we prepare our consolidated financial statements, werecord accruals for environmental liabilities based on management’s best estimates, using information available at the time. We measure estimates andbase contingent liabilities on currently available facts, existing technology and presently enacted laws and regulations, taking into account stakeholderand business considerations. When measuring contingent environmental liabilities, we also consider our prior experience in remediation ofcontaminated sites, other companies’ cleanup experience, and data released by the U.S. Environmental Protection Agency (EPA) or other organizations.We consider unasserted claims in our determination of environmental liabilities, and we accrue them in the period they are both probable andreasonably estimable.
Although liability for environmental remediation costs is generally joint and several for federal sites and frequently so for state sites, we are usuallyonly one of many companies alleged to have liability at a particular site. Due to such joint and several liabilities, we could be responsible for all cleanupcosts related to any site at which we have been designated as a potentially responsible party. We have been successful to date in sharing cleanup costswith other financially sound companies. Many of the sites at which we are potentially responsible are still under investigation by the EPA or the stateagencies concerned. Prior to actual cleanup, those potentially responsible normally assess the site conditions, apportion responsibility and determine theappropriate remediation. In some instances, we may have no liability or may attain a settlement of liability. Where it appears that other potentiallyresponsible parties may be financially unable to bear their proportional share, we consider this inability in estimating our potential liability, and weadjust our accruals accordingly. As a result of various acquisitions in the past, we assumed certain environmental obligations. Some of theseenvironmental obligations are mitigated by indemnifications made by others for our benefit, although some of the indemnifications are subject to dollarand time limits.
We are currently participating in environmental assessments and cleanups at numerous federal Superfund and comparable state sites. After anassessment of environmental exposures for cleanup and other costs, we make accruals on an undiscounted basis (except those pertaining to sitesacquired in a business combination, which we record on a discounted basis) for planned investigation and remediation activities for sites where it isprobable future costs will be incurred and these costs can be reasonably estimated. We have not reduced these accruals for possible insurancerecoveries. In the future, we may be involved in additional environmental assessments, cleanups and proceedings. See Note 10— Asset RetirementObligations and Accrued Environmental Costs , for a summary of our accrued environmental liabilities.
99
Table of ContentsIndex to Financial Statements
Legal ProceedingsOur legal organization applies its knowledge, experience and professional judgment to the specific characteristics of our cases, employing a litigationmanagement process to manage and monitor the legal proceedings against us. Our process facilitates the early evaluation and quantification of potentialexposures in individual cases and enables the tracking of those cases that have been scheduled for trial and/or mediation. Based on professionaljudgment and experience in using these litigation management tools and available information about current developments in all our cases, our legalorganization regularly assesses the adequacy of current accruals and determines if adjustment of existing accruals, or establishment of new accruals, isrequired.
Other ContingenciesWe have contingent liabilities resulting from throughput agreements with pipeline and processing companies not associated with financingarrangements. Under these agreements, we may be required to provide any such company with additional funds through advances and penalties for feesrelated to throughput capacity not utilized.
At December 31, 2018 , we had performance obligations secured by letters of credit and bank guarantees of $587 million related to various purchaseand other commitments incident to the ordinary conduct of business.
Long-Term Throughput Agreements and Take-or-Pay AgreementsWe have certain throughput agreements and take-or-pay agreements in support of third-party financing arrangements. The agreements typically providefor crude oil transportation to be used in the ordinary course of our business. At December 31, 2018, the estimated aggregate future payments underthese agreements were $318 million per year for each year from 2019 through 2023 and $2,280 million in the aggregate for all years after 2023. For theyears ended December 31, 2018 , 2017 and 2016 , total payments under these agreements were $323 million , $323 million and $325 million ,respectively.
Note 15— Derivatives and Financial Instruments
Derivative InstrumentsWe use financial and commodity-based derivative contracts to manage exposures to fluctuations in commodity prices, interest rates and foreigncurrency exchange rates, or to capture market opportunities. Because we do not apply hedge accounting for commodity derivative contracts, all realizedand unrealized gains and losses from commodity derivative contracts are recognized in our consolidated statement of income. Gains and losses fromderivative contracts held for trading not directly related to our physical business are reported net in the “Other income” line on our consolidatedstatement of income. Cash flows from all our derivative activity for the periods presented appear in the operating section on our consolidated statementof cash flows.
Purchase and sales contracts with firm minimum notional volumes for commodities that are readily convertible to cash are recorded on our consolidatedbalance sheet as derivatives unless the contracts are eligible for, and we elect, the normal purchases and normal sales exception, whereby the contractsare recorded on an accrual basis. We generally apply the normal purchases and normal sales exception to eligible crude oil, refined petroleum product,NGL, natural gas and power commodity contracts to purchase or sell quantities we expect to use or sell in the normal course of business. All otherderivative instruments are recorded at fair value on our consolidated balance sheet. For further information on the fair value of derivatives, see Note 16—Fair Value Measurements .
Commodity Derivative Contracts —We sell into or receive supply from the worldwide crude oil, refined petroleum product, NGL, natural gas andelectric power markets, exposing our revenues, purchases, cost of operating activities and cash flows to fluctuations in the prices for these commodities.Generally, our policy is to remain exposed to the market prices of commodities; however, we use futures, forwards, swaps and options in variousmarkets to balance physical systems, meet customer needs, manage price exposures on specific transactions, and do a limited amount of trading notdirectly related to our physical business, all of which may reduce our exposure to fluctuations in market prices. We also use the market knowledgegained from these activities to capture market opportunities such as moving physical commodities to more profitable locations, storing commodities tocapture seasonal or time premiums, and blending commodities to capture quality upgrades.
100
Table of ContentsIndex to Financial Statements
The following table indicates the consolidated balance sheet line items that include the fair values of commodity derivative assets and liabilities. Thebalances in the following table are presented on a gross basis, before the effects of counterparty and collateral netting. However, we have elected topresent our commodity derivative assets and liabilities with the same counterparty on a net basis on our consolidated balance sheet when the legal rightof offset exists.
Millions of Dollars
December 31, 2018 December 31, 2017
Commodity Derivatives
Effect ofCollateral
Netting
NetCarrying
ValuePresented
on theBalance
Sheet
Commodity Derivatives
Effect ofCollateral
Netting
NetCarrying
ValuePresented
on theBalance
Sheet Assets Liabilities Assets Liabilities
Assets Prepaid expenses and other current assets $ 1,257 (1,070) (89) 98 43 (19) — 24
Other liabilities and deferred credits 5 (7) — (2) — (1) — (1)
Total $ 1,264 (1,100) (89) 75 749 (769) 21 1
At December 31, 2018 and 2017, there was no material cash collateral received or paid that was not offset on our consolidated balance sheet.
The realized and unrealized gains (losses) incurred from commodity derivatives, and the line items where they appear on our consolidated statement ofincome, were:
Millions of Dollars 2018 2017 2016
Sales and other operating revenues $ 192 (247) (451)Other income (15) 27 29Purchased crude oil and products (64) (18) (62)Net gain (loss) from commodity derivative activity $ 113 (238) (484)
The following table summarizes our material net exposures resulting from outstanding commodity derivative contracts. These financial and physicalderivative contracts are primarily used to manage price exposure on our underlying operations. The underlying exposures may be from non-derivativepositions such as inventory volumes. Financial derivative contracts may also offset physical derivative contracts, such as forward sales contracts. Thepercentage of our derivative contract volumes expiring within the next twelve months was at least 98 percent at December 31, 2018 and 2017 .
Open PositionLong / (Short)
2018 2017Commodity Crude oil, refined petroleum products and NGL (millions of barrels) (17) (11)
101
Table of ContentsIndex to Financial Statements
Interest Rate Derivative Contracts —In 2016, we entered into interest rate swaps to hedge the variability of lease payments on our headquartersfacility. These monthly lease payments vary based on monthly changes in the one-month LIBOR and changes, if any, in our credit rating over the five-year term of the lease. The pay-fixed, receive-floating interest rate swaps have an aggregate notional value of $ 650 million and end in April 2021. Wehave designated these swaps as cash flow hedges.
The aggregate net fair value of these swaps, which is included in the “Prepaid expenses and other current assets” and “Other assets” lines on ourconsolidated balance sheet, totaled $15 million and $14 million at December 31, 2018 and 2017 , respectively.
We report the mark-to-market gains or losses on our interest rate swaps designated as highly effective cash flow hedges as a component of othercomprehensive income (loss), and reclassify such gains and losses into earnings in the same period during which the hedged transaction affectsearnings. Net realized gains and losses from settlements of the swaps were immaterial for the years ended December 31, 2018 and 2017 .
We currently estimate that pre-tax gains of $7 million will be reclassified from accumulated other comprehensive loss into general and administrativeexpenses during the next twelve months as the hedged transactions settle; however, the actual amounts that will be reclassified will vary based onchanges in interest rates.
Credit RiskFinancial instruments potentially exposed to concentrations of credit risk consist primarily of trade receivables and derivative contracts.
Our trade receivables result primarily from the sale of products from, or related to, our refinery operations and reflect a broad national and internationalcustomer base, which limits our exposure to concentrations of credit risk. The majority of these receivables have payment terms of 30 days or less . Wecontinually monitor this exposure and the creditworthiness of the counterparties and recognize bad debt expense based on historical write-offexperience or specific counterparty collectability. Generally, we do not require collateral to limit the exposure to loss; however, we will sometimes useletters of credit, prepayments or master netting arrangements to mitigate credit risk with counterparties that both buy from and sell to us, as theseagreements permit the amounts owed by us or owed to others to be offset against amounts due to us.
The credit risk from our derivative contracts, such as forwards and swaps, derives from the counterparty to the transaction. Individual counterpartyexposure is managed within predetermined credit limits and includes the use of cash-call margins when appropriate, thereby reducing the risk ofsignificant nonperformance. We also use futures, swaps and option contracts that have a negligible credit risk because these trades are cleared with anexchange clearinghouse and subject to mandatory margin requirements, typically on a daily basis, until settled.
Certain of our derivative instruments contain provisions that require us to post collateral if the derivative exposure exceeds a threshold amount. Wehave contracts with fixed threshold amounts and other contracts with variable threshold amounts that are contingent on our credit rating. The variablethreshold amounts typically decline for lower credit ratings, while both the variable and fixed threshold amounts typically revert to zero if our creditratings fall below investment grade. Cash is the primary collateral in all contracts; however, many contracts also permit us to post letters of credit ascollateral.
The aggregate fair values of all derivative instruments with such credit-risk-related contingent features that were in a liability position were immaterialat December 31, 2018 and 2017 .
102
Table of ContentsIndex to Financial Statements
Note 16— Fair Value Measurements
Recurring Fair Value MeasurementsWe carry certain assets and liabilities at fair value, which we measure at the reporting date using the price that would be received to sell an asset or paidto transfer a liability (i.e., an exit price), and disclose the quality of these fair values based on the valuation inputs used in these measurements under thefollowing hierarchy:
• Level 1: Fair value measured with unadjusted quoted prices from an active market for identical assets or liabilities.• Level 2: Fair value measured either with: (1) adjusted quoted prices from an active market for similar assets or liabilities; or (2) other valuation
inputs that are directly or indirectly observable.• Level 3: Fair value measured with unobservable inputs that are significant to the measurement.
We classify the fair value of an asset or liability based on the significance of its observable or unobservable inputs to the measurement. However, thefair value of an asset or liability initially reported as Level 3 will be subsequently reported as Level 2 if the unobservable inputs become inconsequentialto its measurement or corroborating market data becomes available. Conversely, an asset or liability initially reported as Level 2 will be subsequentlyreported as Level 3 if corroborating market data becomes unavailable. For the year ended December 31, 2018, derivative assets with an aggregate valueof $246 million and derivative liabilities with an aggregate value of $246 million were transferred to Level 1 from Level 2, as measured from thebeginning of the reporting period. The measurements were reclassified within the fair value hierarchy due to the availability of unadjusted quoted pricesfrom an active market.
We used the following methods and assumptions to estimate the fair value of financial instruments:
• Cash and cash equivalents —The carrying amount reported on our consolidated balance sheet approximates fair value.• Accounts and notes receivable — The carrying amount reported on our consolidated balance sheet approximates fair value.• Derivative instruments —We fair value our exchange-traded contracts based on quoted market prices obtained from the New York Mercantile
Exchange, the Intercontinental Exchange or other exchanges, and classify them as Level 1 in the fair value hierarchy. When exchange-clearedcontracts lack sufficient liquidity, or are valued using either adjusted exchange-provided prices or non-exchange quotes, we classify thosecontracts as Level 2.Physical commodity forward purchase and sales contracts and over-the-counter (OTC) financial swaps are generally valued using forwardquotes provided by brokers and price index developers, such as Platts and Oil Price Information Service. We corroborate these quotes withmarket data and classify the resulting fair values as Level 2. When forward market prices are not available, we estimate fair value using theforward price of a similar commodity, adjusted for the difference in quality or location. In certain less liquid markets or for longer-termcontracts, forward prices are not as readily available. In these circumstances, physical commodity purchase and sales contracts and OTC swapsare valued using internally developed methodologies that consider historical relationships among various commodities that result inmanagement’s best estimate of fair value. We classify these contracts as Level 3. Physical and OTC commodity options are valued usingindustry-standard models that consider various assumptions, including quoted forward prices for commodities, time value, volatility factors andcontractual prices for the underlying instruments, as well as other relevant economic measures. The degree to which these inputs are observablein the forward markets determines whether the options are classified as Level 2 or 3. We use a mid-market pricing convention (the mid-pointbetween bid and ask prices). When appropriate, valuations are adjusted to reflect credit considerations, generally based on available marketevidence.We determine the fair value of our interest rate swaps based on observed market valuations for interest rate swaps that have notional amounts,terms and pay and reset frequencies similar to ours.
• Rabbi trust assets —These deferred compensation investments are measured at fair value using unadjusted quoted prices available fromnational securities exchanges and are therefore categorized as Level 1 in the fair value hierarchy.
103
Table of ContentsIndex to Financial Statements
• Debt —The carrying amount of our floating-rate debt approximates fair value. The fair value of our fixed-rate debt is estimated based onobservable market prices.
The following tables display the fair value hierarchy for our financial assets and liabilities either accounted for or disclosed at fair value on a recurringbasis. These values are determined by treating each contract as the fundamental unit of account; therefore, derivative assets and liabilities with the samecounterparty are shown on a gross basis in the hierarchy sections of these tables, before the effects of counterparty and collateral netting. The followingtables also reflect the effect of netting derivative assets and liabilities with the same counterparty for which we have the legal right of offset andcollateral netting.
The carrying values and fair values by hierarchy of our financial assets and liabilities, either carried or disclosed at fair value, including any effects ofcounterparty and collateral netting, were:
Millions of Dollars December 31, 2018 Fair Value Hierarchy
The rabbi trust assets are recorded in the “Investments and long-term receivables” line and floating-rate and fixed-rate debt are recorded in the “Short-term debt” and “Long-term debt” lines on our consolidated balance sheet. See Note 15—Derivatives and Financial Instruments , for informationregarding where the assets and liabilities related to our commodity and interest rate derivatives are recorded on our consolidated balance sheet.
Nonrecurring Fair Value MeasurementsSee Note 5—Business Combinations , for information on the remeasurement of our investment in Merey Sweeny to fair value in 2017 . For the yearsended December 31, 2018 and 2017 , there were no other material nonrecurring fair value remeasurements of assets subsequent to their initialrecognition.
105
Table of ContentsIndex to Financial Statements
Note 17— Equity
Preferred StockWe have 500 million shares of preferred stock authorized, with a par value of $0.01 per share, none of which have been issued.
Treasury StockSince July 2012, our Board of Directors has, at various times, authorized repurchases of our outstanding common stock under our share repurchaseprogram, which aggregate to a total authorization of up to $12 billion . The shares will be repurchased from time to time in the open market at thecompany’s discretion, subject to market conditions and other factors, and in accordance with applicable regulatory requirements. We are not obligatedto acquire any particular amount of common stock and may commence, suspend or discontinue purchases at any time or from time to time without priornotice. Since the inception of our share repurchase program in 2012 through December 31, 2018 , we have repurchased a total of 137,103,716 shares atan aggregate cost of $10,393 million .
In February 2018, we entered into a Stock Purchase and Sale Agreement (Purchase Agreement) with Berkshire Hathaway Inc. and National IndemnityCompany, a wholly owned subsidiary of Berkshire Hathaway, to repurchase 35,000,000 shares of Phillips 66 common stock for an aggregate purchaseprice of $3,280 million . Pursuant to the Purchase Agreement, the purchase price per share of $93.725 was based on the volume-weighted-average priceof our common stock on the New York Stock Exchange on February 13, 2018. The transaction closed in February 2018. We funded the repurchase withcash of $1,880 million and borrowings of $1,400 million under our commercial paper program. These borrowings were subsequently refinancedthrough a public offering of senior notes. This specific share repurchase transaction was separately authorized by our Board of Directors and thereforedid not impact previously announced authorizations under our share repurchase program, which are discussed above.
In 2014, we completed the exchange of our flow improver business for shares of Phillips 66 common stock owned by the other party to the transaction.We received 17,422,615 shares of our common stock with a fair value at the time of the exchange of $1,350 million . This specific share repurchasetransaction was also separately authorized by our Board of Directors and therefore did not impact previously announced authorizations under our sharerepurchase program, which are discussed above.
Common Stock DividendsOn February 6, 2019, our Board of Directors declared a quarterly cash dividend of $0.80 per common share, payable March 1, 2019, to holders ofrecord at the close of business on February 19, 2019.
Noncontrolling InterestsOur noncontrolling interests primarily represent issuances of common and preferred units to the public by Phillips 66 Partners. See Note 27—Phillips66 Partners LP , for information on Phillips 66 Partners.
106
Table of ContentsIndex to Financial Statements
Note 18— Leases
We lease ocean transport vessels, tugboats, barges, pipelines, storage tanks, railcars, service station sites, office buildings, corporate aircraft, land andother facilities and equipment. Certain leases include escalation clauses for adjusting rental payments to reflect changes in price indices, as well asrenewal options and/or options to purchase the leased property. There are no significant restrictions imposed on us by the leasing agreements withregard to dividends, asset dispositions or borrowing ability. Our capital lease obligations relate primarily to the lease of an oil terminal in the UnitedKingdom. The lease obligation is subject to foreign currency translation adjustments each reporting period. The total net PP&E recorded for capitalleases was $196 million and $210 million at December 31, 2018 and 2017 , respectively.
Future minimum lease payments at December 31, 2018 , for capital and operating lease obligations were:
The following table provides a reconciliation of the projected benefit obligations and plan assets for our pension plans and accumulated benefitobligations for our other postretirement benefit plans:
Millions of Dollars Pension Benefits Other Benefits 2018 2017 2018 2017 U.S. Int’l. U.S. Int’l. Change in Benefit Obligations Benefit obligations at January 1 $ 3,043 1,209 2,881 1,055 232 225Service cost 136 29 132 32 6 6Interest cost 104 28 108 27 7 8Plan participant contributions — 2 — 2 4 3Net actuarial loss (gain) (167) (165) 267 (5) (9) 6Benefits paid (386) (27) (345) (20) (20) (16)Curtailment gain — (5) — — — —Foreign currency exchange rate change — (64) — 118 — —Benefit obligations at December 31 $ 2,730 1,007 3,043 1,209 220 232 Change in Fair Value of Plan Assets Fair value of plan assets at January 1 $ 2,751 972 2,274 796 — —Actual return on plan assets (122) (29) 399 71 — —Company contributions 134 34 423 35 16 13Plan participant contributions — 2 — 2 4 3Benefits paid (386) (27) (345) (20) (20) (16)Foreign currency exchange rate change — (50) — 88 — —Fair value of plan assets at December 31 $ 2,377 902 2,751 972 — —
Funded Status at December 31 $ (353) (105) (292) (237) (220) (232)
Amounts recognized in the consolidated balance sheet for our pension and other postretirement benefit plans at December 31 include:
Millions of Dollars Pension Benefits Other Benefits 2018 2017 2018 2017 U.S. Int’l. U.S. Int’l. Amounts Recognized in the Consolidated
Included in accumulated other comprehensive loss at December 31 were the following pre-tax amounts that had not been recognized in net periodicbenefit cost:
Millions of Dollars Pension Benefits Other Benefits 2018 2017 2018 2017 U.S. Int’l. U.S. Int’l.
Unrecognized net actuarial loss (gain) $ 539 64 545 190 (8) 1Unrecognized prior service credit — (3) — (4) (6) (7)
Millions of Dollars Pension Benefits Other Benefits 2018 2017 2018 2017 U.S. Int’l. U.S. Int’l. Sources of Change in Other Comprehensive
Loss Net actuarial gain (loss) arising during the period $ (125) 102 (14) 14 9 (6)Curtailment gain — 5 — — — —Amortization of net actuarial loss and settlements
included in income 131 19 153 23 — —Net change in unrecognized net actuarial loss
(gain) during the period $ 6 126 139 37 9 (6)
Prior service cost (credit) arising during the period $ — — — — — —Amortization of prior service cost (credit) included
in income — (1) 3 (1) (1) (2)Net change in unrecognized prior service cost
(credit) during the period $ — (1) 3 (1) (1) (2)
The accumulated benefit obligations for all U.S. and international pension plans were $2,466 million and $878 million , respectively, at December 31,2018 , and $2,743 million and $1,006 million , respectively, at December 31, 2017 .
Information for U.S. and international pension plans with an accumulated benefit obligation in excess of plan assets at December 31 were:
Millions of Dollars Pension Benefits 2018 2017 U.S. Int’l. U.S. Int’l.
Accumulated benefit obligations $ 123 345 143 368Fair value of plan assets — 182 — 196
109
Table of ContentsIndex to Financial Statements
Information for U.S. and international pension plans with a projected benefit obligation in excess of plan assets at December 31 were:
Millions of Dollars Pension Benefits 2018 2017 U.S. Int’l. U.S. Int’l.
Projected benefit obligations $ 2,730 365 3,043 1,209Fair value of plan assets 2,377 182 2,751 972
Components of net periodic benefit cost for all defined benefit plans are presented in the table below:
Millions of Dollars Pension Benefits Other Benefits 2018 2017 2016 2018 2017 2016 U.S. Int’l. U.S. Int’l. U.S. Int’l. Components of Net
Periodic Benefit Cost Service cost $ 136 29 132 32 127 32 6 6 7Interest cost 104 28 108 27 116 28 7 8 8Expected return on plan
assets (169) (46) (146) (40) (128) (38) — — —Amortization of prior service
cost (credit) — (1) 3 (1) 3 (1) (1) (2) (1)Amortization of net actuarial
cost* $ 202 29 250 41 198 35 12 12 14* Included in the “Operating expenses” and “Selling, general and administrative expenses” lines on our consolidated statement of income.
In determining net periodic benefit cost, we amortize prior service costs on a straight-line basis over the average remaining service period of employeesexpected to receive benefits under the plan. For net actuarial gains and losses, we amortize 10 percent of the unamortized balance each year. Theamount subject to amortization is determined on a plan-by-plan basis.
110
Table of ContentsIndex to Financial Statements
The following weighted-average assumptions were used to determine benefit obligations and net periodic benefit costs for years ended December 31:
Pension Benefits Other Benefits 2018 2017 2018 2017 U.S. Int’l. U.S. Int’l. Assumptions Used to Determine Benefit
Obligations: Discount rate 4.30% 2.59 3.60 2.36 4.15 3.35Rate of compensation increase 4.00 3.34 4.00 3.74 — —Interest crediting rate on cash balance plan 3.25 — 3.00 — — —
Assumptions Used to Determine Net PeriodicBenefit Cost:
Discount rate 3.60% 2.36 3.95 2.46 3.35 3.65Expected return on plan assets 6.50 4.78 6.75 4.74 — —Rate of compensation increase 4.00 3.74 4.00 3.78 — —Interest crediting rate on cash balance plan 3.00 — 3.55 — — —
For both U.S. and international pension plans, the overall expected long-term rate of return is developed from the expected future return of each assetclass, weighted by the expected allocation of pension assets to that asset class. We rely on a variety of independent market forecasts in developing theexpected rate of return for each class of assets.
For the year ended December 31, 2018 , actuarial gains resulted in decreases in our U.S. and international pension benefit obligations of $167 millionand $165 million , respectively. The primary drivers for the actuarial gains were increases in the discount rates and changes to the census datademographics. For the year ended December 31, 2017 , actuarial losses resulted in an increase in our U.S. pension benefit obligations of $267 million .The primary drivers for the actuarial losses were decreases in the discount rates and changes to the census data demographics.
For the year ended December 31, 2018, the weighted-average actual return on plan assets for our U.S. pension plans was negative 4 percent , whichresulted in a $122 million reduction in plan assets. For the year ended December 31, 2017, the weighted-average actual return on plan assets for ourU.S. pension plans was positive 18 percent , which resulted in a $399 million increase in plan assets. The primary driver of the return on plan assets in2018 and 2017 was fluctuations in the equity markets.
Our other postretirement benefit plans for health insurance are contributory. Effective December 31, 2012, we terminated the subsidy for retiree medicalplans. Since January 1, 2013, eligible employees have been able to utilize notional amounts credited to an account during their period of service withthe company to pay all, or a portion, of their cost to participate in postretirement health insurance through the company. In general, employees hiredafter December 31, 2012, will not receive credits to an account, but will have unsubsidized access to health insurance through the plan. The cost ofhealth insurance will be adjusted annually by the company’s actuary to reflect actual experience and expected health care cost trends. The measurementof the accumulated benefit obligation assumes a health care cost trend rate of 7.00 percent in 2019 that declines to 5.00 percent by 2027 .
Plan AssetsThe investment strategy for managing pension plan assets is to seek a reasonable rate of return relative to an appropriate level of risk and provideadequate liquidity for benefit payments and portfolio management. We follow a policy of diversifying pension plan assets across asset classes,investment managers, and individual holdings. As a result, our plan assets have no significant concentrations of credit risk. Asset classes that areconsidered appropriate include equities, fixed income, cash, real estate and insurance contracts. Plan fiduciaries may consider and add other assetclasses to the
111
Table of ContentsIndex to Financial Statements
investment program from time to time. The target allocations for plan assets are approximately 50 percent equity securities, 42 percent debt securitiesand 8 percent in all other types of investments. Generally, the investments in the plans are publicly traded, therefore minimizing the liquidity risk in theportfolio.
The following is a description of the valuation methodologies used for the pension plan assets.
• Fair values of equity securities and government debt securities are based on quoted market prices.
• Fair values of corporate debt securities are estimated using recently executed transactions and market price quotations. If there have been nomarket transactions in a particular fixed income security, its fair value is calculated by pricing models that benchmark the security against othersecurities with actual market prices.
• Fair values of mutual funds are valued based on quoted market prices, which represent the net asset value (NAV) of shares held.
• Cash and cash equivalents are valued at cost, which approximates fair value.
• Fair values of insurance contracts are valued at the present value of the future benefit payments owed by the insurance company to the plans’participants.
• Fair values of investments in common/collective trusts and real estate funds are valued at NAV as a practical expedient. The NAV is based onthe underlying net assets owned by the fund and the relative interest of each participating investor in the fair value of the underlying assets.These investments valued at NAV are not classified within the fair value hierarchy, but are presented in the fair value table to permitreconciliation of total plan assets to the amounts presented in the notes to consolidated financial statements.
The fair values of our pension plan assets at December 31, by asset class, were:
Millions of Dollars U.S. International Level 1 Level 2 Level 3 Total Level 1 Level 2 Level 3 Total2018 Equity securities $ 421 — — 421 — — — —Government debt securities 610 — — 610 — — — —Corporate debt securities — 129 — 129 — — — —Cash and cash equivalents 50 — — 50 7 — — 7Insurance contracts — — — — — — 14 14Total assets in the fair value
measured at NAV 1,311 944Real estate funds measured
at NAV — 8Total $ 1,440 — — 2,751 6 — 14 972
Our funding policy for U.S. plans is to contribute at least the minimum required by the Employee Retirement Income Security Act of 1974 and theInternal Revenue Code of 1986, as amended. Contributions to international plans are subject to local laws and tax regulations. Actual contributionamounts are dependent upon plan asset returns, changes in pension obligations, regulatory environments, and other economic factors. In 2019 , weexpect to contribute approximately $60 million to our U.S. pension plans and other postretirement benefit plans and $30 million to our internationalpension plans.
The following benefit payments, which reflect expected future service, as appropriate, are expected to be paid to plan participants in the years indicated:
Millions of Dollars Pension Benefits Other Benefits U.S. Int’l.
Defined Contribution PlansMost U.S. employees are eligible to participate in the Phillips 66 Savings Plan (Savings Plan). Employees can contribute up to 75 percent of theireligible pay, subject to certain statutory limits, in the thrift feature of the Savings Plan to a choice of investment funds. For the years ended December31, 2018, 2017 and 2016, Phillips 66 provided a company match of participant thrift contributions up to 5 percent of eligible pay. In addition,participants who contributed at least 1 percent to the Savings Plan were eligible for “Success Share,” a semi-annual discretionary company contributionto the Savings Plan that can range from 0 to 6 percent of eligible pay, with a target of 2 percent . For the years ended December 31, 2018 , 2017 and2016 , we recorded expense of $178 million , $101 million and $99 million , respectively, related to our contributions to the Savings Plan.
Note 20— Share-Based Compensation Plans
In accordance with the Employee Matters Agreement related to the Separation, compensation awards based on ConocoPhillips stock and granted beforeApril 30, 2012 (the Separation Date) were converted to compensation awards based on both ConocoPhillips and Phillips 66 stock if, on the SeparationDate, the awards were: (1) options outstanding and exercisable; or (2) restricted stock or restricted stock units (RSUs) awarded for completedperformance periods under the ConocoPhillips Performance Share Program. Phillips 66 restricted stock, RSUs and options issued in this conversionbecame subject to the “Omnibus Stock and Performance Incentive Plan of Phillips 66” (the 2012 Plan) on the Separation Date, whether held by granteesworking for Phillips 66 or grantees that remained employees of ConocoPhillips. Some of these awards based on Phillips 66 stock and held byemployees of ConocoPhillips are outstanding and appear in the activity tables for the Stock Option and the Performance Share Programs presented laterin this footnote.
In May 2013, shareholders approved the 2013 Omnibus Stock and Performance Incentive Plan of Phillips 66 (the P66 Omnibus Plan). Subsequent tothis approval, all new share-based awards are granted under the P66 Omnibus Plan, which authorizes the Human Resources and CompensationCommittee (HRCC) of our Board of Directors to grant stock options, stock appreciation rights, stock awards (including restricted stock and RSUawards), cash awards, and performance awards to our employees, non-employee directors and other plan participants. The number of new shares thatmay be issued under the P66 Omnibus Plan to settle share-based awards may not exceed 45 million .
We recognize share-based compensation expense over the shorter of: (1) the service period (i.e., the stated period of time required to earn the award); or(2) the period beginning at the start of the service period and ending when an employee first becomes eligible for retirement, but not less than sixmonths as this is the minimum period of time required for an award not to be subject to forfeiture. Our equity-classified programs generally provideaccelerated vesting (i.e., a waiver of the remaining period of service required to earn an award) for awards held by employees at the time they becomeeligible for retirement (at age 55 with 5 years of service). We have elected to recognize expense on a straight-line basis over the service period for theentire award, irrespective of whether the award was granted with ratable or cliff vesting, and have elected to recognize forfeitures of awards when theyoccur.
Total share-based compensation expense recognized in income and the associated income tax benefit for the years ended December 31 were:
Stock OptionsStock options granted under the provisions of the P66 Omnibus Plan and earlier plans permit purchases of our common stock at exercise pricesequivalent to the average of the high and low market price of our stock on the date the options were granted. The options have terms of 10 years andvest ratably, with one-third of the options becoming exercisable on each anniversary date for the three years following the date of grant. Optionsawarded to employees eligible for retirement are not subject to forfeiture six months after the grant date.
The following table summarizes our stock option activity from January 1, 2018 , to December 31, 2018 :
Millions of Dollars
Options
Weighted- Average
Exercise Price
Weighted-AverageGrant-DateFair Value
Aggregate Intrinsic Value
Outstanding at January 1, 2018 4,838,855 $ 58.34 Granted 650,000 94.85 $ 20.69 Forfeited (49,027) 89.93 Exercised (687,020) 57.61 $ 37Outstanding at December 31, 2018 4,752,808 $ 63.11
Vested at December 31, 2018 3,941,271 $ 57.79 $ 109 Exercisable at December 31, 2018 3,331,259 $ 53.51 $ 106
The weighted-average remaining contractual terms of vested options and exercisable options at December 31, 2018 , were 4.87 years and 4.29 years,respectively. During 2018 , we received $39 million in cash and realized an income tax benefit of $7 million from the exercise of options. At December31, 2018 , the remaining unrecognized compensation expense from unvested options was $6 million , which will be recognized over a weighted-averageperiod of 21 months, the longest period being 25 months. The calculations of realized income tax benefits and weighted-average periods include awardsbased on both Phillips 66 and ConocoPhillips stock held by Phillips 66 employees.
During 2017 and 2016 , we granted options with a weighted-average grant-date fair value of $16.95 and $16.94 , respectively. During 2017 and 2016 ,employees exercised options with an aggregate intrinsic value of $62 million and $58 million , respectively.
The following table provides the significant assumptions used to calculate the grant-date fair values of options granted over the years shown below, ascalculated using the Black-Scholes-Merton option-pricing model:
We calculate the volatility factor using historical Phillips 66 end-of-week closing stock prices since the Separation Date. We periodically calculate theaverage period of time elapsed between grant dates and exercise dates of past grants to estimate the expected life of new option grants.
115
Table of ContentsIndex to Financial Statements
Restricted Stock UnitsGenerally, RSUs are granted annually under the provisions of the P66 Omnibus Plan and cliff vest at the end of three years. The grant date fair value isequal to the average of the high and low market price of our stock on the grant date. The recipients receive a quarterly dividend equivalent cashpayment until the RSU is settled by issuing one share of our common stock for each RSU at the end of the service period. RSUs granted to retirement-eligible employees are not subject to forfeiture six months after the grant date. Special RSUs are granted to attract or retain key personnel and the termsand conditions may vary by award.
The following table summarizes our RSU activity from January 1, 2018 , to December 31, 2018 :
Millions of Dollars
Stock Units
Weighted-AverageGrant-DateFair Value Total Fair Value
Outstanding at January 1, 2018 2,496,425 $ 77.20 Granted 822,457 96.16 Forfeited (63,977) 84.61 Issued (995,076) 75.77 $ 102Outstanding at December 31, 2018 2,259,829 $ 84.52
Not Vested at December 31, 2018 1,565,641 $ 84.99
At December 31, 2018 , the remaining unrecognized compensation cost from unvested RSU awards was $53 million , which will be recognized over aweighted-average period of 22 months, the longest period being 36 months.
During 2017 and 2016 , we granted RSUs with a weighted-average grant-date fair value of $78.49 and $78.56 , respectively. During 2017 and 2016 ,we issued shares with an aggregate fair value of $85 million and $109 million , respectively, to settle RSUs.
Performance Share UnitsUnder the P66 Omnibus Plan, we annually grant to senior management restricted performance share units (PSUs) with three -year performance periodsthat vest when the HRCC approves the three-year performance results on the grant date. PSUs granted under the P66 Omnibus Plan are classified asliability awards and compensation expense is recognized beginning on the authorization date and ending on the vesting date.
PSUs granted under the P66 Omnibus Plan are settled by cash payments equal to the fair value of the awards, which is based on the market prices of ourstock near the end of the performance periods. The HRCC must approve the three -year performance results prior to payout. Dividend equivalents arenot paid on these awards.
PSUs granted under prior incentive compensation plans were classified as equity awards. These equity awards are settled upon an employee’sretirement by issuing one share of our common stock for each PSU held. Dividend equivalents are paid on these awards.
116
Table of ContentsIndex to Financial Statements
The following table summarizes our PSU activity from January 1, 2018 , to December 31, 2018 :
Millions of Dollars
PerformanceShare Units
Weighted-AverageGrant-Date
Fair Value Total Fair Value
Outstanding at January 1, 2018 2,558,278 $ 52.06 Granted 494,277 99.74 Forfeited (16,716) 69.90 Issued (639,060) 59.15 $ 70Cash settled (494,277) 99.74 49Outstanding at December 31, 2018 1,902,502 $ 49.52
Not Vested at December 31, 2018 153,236 $ 65.59
At December 31, 2018 , the remaining unrecognized compensation cost from unvested PSU awards was $1 million , which will be recognized over aweighted-average period of 14 months, with the longest period being 4 years. The calculations of unamortized expense and weighted-average periodsinclude awards based on both Phillips 66 and ConocoPhillips stock held by Phillips 66 employees.
During 2017 and 2016 , we granted PSUs with a weighted-average grant-date fair value of $86.88 and $78.62 , respectively. During 2017 and 2016 , weissued shares with an aggregate fair value of $54 million and $26 million , respectively, to settle PSUs. During 2017 and 2016, we cash settled PSUswith an aggregate fair value of $56 million and $60 million , respectively.
Note 21— Income Taxes
In December 2017, the U.S. government enacted comprehensive income tax legislation, referred to as the Tax Cuts and Jobs Act (the Tax Act). Thematerial provisions of the Tax Act i) reduced the U.S. federal corporate income tax rate from 35 percent to 21 percent beginning January 1, 2018, ii)required companies to reflect on their 2017 corporate income tax return a liability for a one-time deemed repatriation tax on foreign-sourced earningsthat were previously tax deferred, and iii) created a new tax regime for post-2017 foreign-sourced earnings.
To account for the reduction in the U.S. federal corporate income tax rate, we remeasured our deferred tax assets and liabilities based on the rates atwhich they are expected to reverse in the future, generally 21 percent , which resulted in the recognition of a provisional deferred tax benefit of $2,870million in the year ended December 31, 2017. To account for the one-time deemed repatriation income tax, we calculated our provisional liability inaccordance with the Tax Act and considered previously accrued current and deferred tax liabilities on undistributed earnings of our foreign subsidiariesand foreign joint ventures. The effects of the one-time deemed repatriation tax resulted in the recognition of a provisional income tax expense of $149million in the year ended December 31, 2017.
During the year ended December 31, 2018, we recorded adjustments to finalize our accounting for the income tax effects of the Tax Act, whichincreased our income tax expense by $36 million . The adjustments were primarily due to the revision of our estimated deferred income tax balances inconjunction with the filing of our 2017 income tax return and the issuance of additional guidance by the U.S. Internal Revenue Service related to thecalculation of the one-time deemed repatriation tax.
117
Table of ContentsIndex to Financial Statements
Components of income tax expense (benefit) were:
Millions of Dollars 2018 2017 2016Income Tax Expense (Benefit) Federal
Current $ 739 9 (105)Deferred 257 (1,960) 645
Foreign Current 326 126 66Deferred 53 3 (84)
State and local Current 255 61 (24)Deferred (58) 68 49
$ 1,572 (1,693) 547
Deferred income taxes reflect the net tax effect of temporary differences between the carrying amounts of assets and liabilities for financial reportingpurposes and the amounts used for tax purposes. Major components of deferred tax liabilities and assets at December 31 were:
Millions of Dollars 2018 2017Deferred Tax Liabilities Properties, plants and equipment, and intangibles $ 3,074 2,942Investment in joint ventures 2,041 1,923Investment in subsidiaries 602 594Inventory 66 —Other 14 18Total deferred tax liabilities 5,797 5,477 Deferred Tax Assets Benefit plan accruals 395 314Asset retirement obligations and accrued environmental costs 109 121Loss and credit carryforwards 59 96Other financial accruals and deferrals 16 44Inventory — 10Other — 3Total deferred tax assets 579 588Less: valuation allowance 8 28Net deferred tax assets 571 560Net deferred tax liabilities $ 5,226 4,917
At December 31, 2018, the loss and credit carryforward deferred tax assets were primarily related to a German interest deduction carryforward of $51million , and capital loss and net operating loss carryforwards in the United Kingdom of $5 million . All losses may be carried forward indefinitely.
118
Table of ContentsIndex to Financial Statements
Valuation allowances have been established to reduce deferred tax assets to an amount that will, more likely than not, be realized. During the yearended December 31, 2018 , our total valuation allowance balance decreased by $20 million . Based on our historical taxable income, expectations forthe future and available tax planning strategies, management expects the remaining net deferred tax assets will be realized as offsets to reversingdeferred tax liabilities and the tax consequences of future taxable income.
At December 31, 2017 , all undistributed earnings of our foreign subsidiaries and foreign joint ventures were included in our computation of the one-time deemed repatriation tax associated with the enactment of the Tax Act. Earnings of our foreign subsidiaries and foreign joint ventures afterDecember 31, 2017, are generally not subject to incremental income taxes in the United States or withholding taxes in foreign countries uponrepatriation. As such, we only assert that the earnings of one of our foreign subsidiaries are permanently reinvested. At December 31, 2018 and 2017,the unrecorded deferred tax liability related to the undistributed earnings of this foreign subsidiary was not material.
As a result of the Separation and pursuant to the Tax Sharing Agreement with ConocoPhillips, the unrecognized income tax benefits related to ouroperations for which ConocoPhillips was the taxpayer remain the responsibility of ConocoPhillips, and we have indemnified ConocoPhillips for suchamounts. Following is a reconciliation of the changes in our unrecognized income tax benefits balance:
Millions of Dollars 2018 2017 2016
Balance at January 1 $ 34 70 82Additions for tax positions of prior years 1 1 5Reductions for tax positions of prior years (2) (5) (17)Settlements (10) (32) —Balance at December 31 $ 23 34 70
Included in the balance of unrecognized income tax benefits at December 31, 2018 , 2017 and 2016 were $1 million , $5 million and $13 million ,respectively, which, if recognized, would affect our effective income tax rate. With respect to various unrecognized income tax benefits and the relatedaccrued liabilities, we do not expect any to be recognized or paid within the next twelve months.
At December 31, 2018 , 2017 and 2016 , accrued liabilities for interest and penalties, net of accrued income taxes, totaled $5 million , $8 million and$12 million , respectively. As a result of reversing certain of these accruals, net income increased by $1 million and $7 million for the years endedDecember 31, 2017 and 2016 , respectively.
We file tax returns in the U.S. federal jurisdiction and in many foreign and state jurisdictions. Audits in significant jurisdictions are generally completeas follows: United Kingdom (2015), Germany (2014) and United States Phillips 66 audits (2013) and United States ConocoPhillips audits (2010).Certain issues remain in dispute for audited years, and unrecognized income tax benefits for years still subject to or currently undergoing an audit aresubject to change. As a consequence, the balance in unrecognized income tax benefits can be expected to fluctuate from period to period. Although it isreasonably possible such changes could be significant when compared with our total unrecognized income tax benefits, the amount of change is notestimable.
119
Table of ContentsIndex to Financial Statements
The amounts of U.S. and foreign income before income taxes, with a reconciliation of income tax at the federal statutory rate to the recorded income taxexpense (benefit), were:
Millions of Dollars Percentage of
Income Before Income Taxes 2018 2017 2016 2018 2017 2016Income before income taxes
United States $ 5,716 2,799 1,713 76.8 % 78.7 78.2Foreign 1,729 756 478 23.2 21.3 21.8
$ 7,445 3,555 2,191 100.0 % 100.0 100.0
Federal statutory income tax $ 1,563 1,244 767 21.0 % 35.0 35.0State income tax, net of federal benefit 155 79 12 2.1 2.2 0.6Tax Cuts and Jobs Act 36 (2,721) — 0.5 (76.5) —Foreign rate differential (91) (210) (152) (1.2) (5.9) (6.9)Noncontrolling interests (58) (46) (26) (0.8) (1.3) (1.2)Change in valuation allowance (20) (4) (81) (0.3) (0.1) (3.7)Federal manufacturing deduction — (18) — — (0.5) —Other (13) (17) 27 (0.2) (0.5) 1.2 $ 1,572 (1,693) 547 21.1 % (47.6) 25.0
Income tax expense of $13 million , $81 million and $150 million for the years ended December 31, 2018 , 2017 and 2016 , respectively, is reflected inthe “Capital in Excess of Par” column on our consolidated statement of changes in equity.
120
Table of ContentsIndex to Financial Statements
Note 22— Accumulated Other Comprehensive Loss
Changes in the balances of each component of accumulated other comprehensive loss were as follows:
Millions of Dollars
DefinedBenefit
Plans
ForeignCurrency
Translation Hedging
AccumulatedOther
ComprehensiveLoss
December 31, 2015 $ (662) 11 (2) (653)Other comprehensive income (loss) before reclassifications (112) (296) 5 (403)Amounts reclassified from accumulated other comprehensive loss*
Amortization of defined benefit plan items** Net actuarial loss, prior service cost (credit) and settlements 61 — — 61
Net current period other comprehensive income (loss) (51) (296) 5 (342)December 31, 2016 (713) (285) 3 (995)Other comprehensive income before reclassifications 3 259 4 266Amounts reclassified from accumulated other comprehensive loss*
Amortization of defined benefit plan items** Net actuarial loss, prior service cost (credit) and settlements 112 — — 112
Net current period other comprehensive income 115 259 4 378December 31, 2017 (598) (26) 7 (617)Other comprehensive income (loss) before reclassifications 14 (192) 4 (174)Amounts reclassified from accumulated other comprehensive loss
Amortization of defined benefit plan items** Net actuarial loss, prior service cost (credit) and settlements 112 — — 112
Net current period other comprehensive income (loss) 126 (202) 1 (75)December 31, 2018 $ (472) (228) 8 (692)* There were no significant reclassifications related to foreign currency translation or hedging in the years ended December 31, 2017 and 2016 .
** Included in the computation of net periodic benefit cost. See Note 19—Pension and Postretirement Plans , for additional information.
121
Table of ContentsIndex to Financial Statements
Note 23— Cash Flow Information
Supplemental Cash Flow Information
Millions of Dollars 2018 2017 2016Cash Payments (Receipts) Interest $ 465 421 311Income taxes* 984 (257) (375)* 2017 and 2016 reflected a net cash refund position; cash payments for income taxes were $102 million and $385 million in 2017 and 2016, respectively.
Restricted CashAt December 31, 2018, 2017 and 2016, the company did not have any restricted cash. The restrictions on the cash acquired in February 2017, as a resultof the consolidation of Merey Sweeny, were fully removed in May 2017 when Merey Sweeny’s outstanding debt that contained lender restrictions onthe use of cash was paid in full. See Note 5—Business Combinations , for additional information regarding our consolidation of Merey Sweeny.
Note 24— Other Financial Information
Millions of Dollars 2018 2017 2016Interest and Debt Expense Incurred
Other Income Interest income $ 45 31 18Gain on consolidation of business* — 423 —Other, net** 16 67 56 $ 61 521 74 * See Note 5—Business Combinations, for more information regarding the gain recognized in 2017.** Includes derivatives-related activities. See Note 15—Derivatives and Financial Instruments, for additional information.
Research and Development Expenses $ 55 60 60
Advertising Expenses $ 68 76 80
Foreign Currency Transaction (Gains) Losses Midstream $ — — —Chemicals — — —Refining (24) (2) (13)Marketing and Specialties 1 1 1Corporate and Other (8) 1 (3) $ (31) — (15)
122
Table of ContentsIndex to Financial Statements
Note 25— Related Party Transactions
Significant transactions with related parties were:
Millions of Dollars 2018 2017 2016
Operating revenues and other income (a) $ 3,514 2,596 2,174Purchases (b) 12,755 10,468 8,109Operating expenses and selling, general and
administrative expenses (c) 59 79 125
(a) We sold NGL and other petrochemical feedstocks, along with solvents, to CPChem, gas oil and hydrogen feedstocks to Excel Paralubes(Excel), and refined petroleum products to OnCue. We also sold certain feedstocks and intermediate products to WRB and acted as agent forWRB in supplying crude oil and other feedstocks for a fee. In addition, we charged several of our affiliates, including CPChem, for the use ofcommon facilities, such as steam generators, waste and water treaters and warehouse facilities.
(b) We purchased crude oil, refined petroleum products and NGL from WRB and also acted as agent for WRB in distributing solvents. We alsopurchased natural gas and NGL from DCP Midstream and CPChem, as well as other feedstocks from various affiliates, for use in our refineryand fractionation processes. In addition, we purchased base oils and fuel products from Excel for use in our specialty and refining businesses.We paid NGL fractionation fees to CPChem. We also paid fees to various pipeline affiliates for transporting crude oil, refined petroleumproducts and NGL.
(c) We paid utility and processing fees to various affiliates.
As discussed more fully in Note 5— Business Combinations , in February 2017, we began accounting for Merey Sweeny as a consolidated subsidiary.Accordingly, the table above only includes processing fees paid to Merey Sweeny through the consolidation date.
123
Table of ContentsIndex to Financial Statements
Note 26— Segment Disclosures and Related Information
During the fourth quarter of 2018, the segment performance measure used by our chief executive officer to assess performance and allocate resourceswas changed from “net income” to “income before income taxes.” Prior-period segment information has been recast to conform to the currentpresentation.
Our operating segments are:
1) Midstream— Provides crude oil and refined petroleum product transportation, terminaling and processing services, as well as natural gas andNGL transportation, storage, processing and marketing services, mainly in the United States. The Midstream segment includes our masterlimited partnership (MLP), Phillips 66 Partners, as well as our 50 percent equity investment in DCP Midstream.
2) Chemicals— Consists of our 50 percent equity investment in CPChem, which manufactures and markets petrochemicals and plastics on aworldwide basis.
3) Refining— Refines crude oil and other feedstocks into petroleum products (such as gasoline, distillates and aviation fuels) at 13 refineries inthe United States and Europe.
4) Marketing and Specialties— Purchases for resale and markets refined petroleum products, mainly in the United States and Europe. Inaddition, this segment includes the manufacturing and marketing of specialty products, as well as power generation operations.
Corporate and Other includes general corporate overhead, interest expense, our investment in new technologies and various other corporate activities.Corporate assets include all cash, cash equivalents and income tax-related assets.
Intersegment sales are at prices that we believe approximate market.
124
Table of ContentsIndex to Financial Statements
Analysis of Results by Operating Segment
Millions of Dollars 2018 2017* 2016*Sales and Other Operating Revenues** Midstream
Total sales $ 8,293 6,620 4,226Intersegment eliminations (2,176) (1,842) (1,299)
Total Midstream 6,117 4,778 2,927Chemicals 5 5 5Refining
Total sales 83,140 65,494 52,068Intersegment eliminations (49,343) (40,284) (34,120)
Total Refining 33,797 25,210 17,948Marketing and Specialties
Total sales 73,414 73,565 64,476Intersegment eliminations (1,899) (1,233) (1,109)
Total Marketing and Specialties 71,515 72,332 63,367Corporate and Other 27 29 32Consolidated sales and other operating revenues $ 111,461 102,354 84,279
* Sales and other operating revenues for the years ended December 31, 2017 and 2016, are presented in accordance with accounting standards in effect prior to our adoption of ASU No.2014-09 on January 1, 2018. See Note 2—Changes in Accounting Principles, for further discussion regarding our adoption of ASU No. 2014-09.
** See Note 3—Sales and Other Operating Revenues, for further details on our disaggregated sales and other operating revenues.
Equity in Earnings of Affiliates Midstream $ 676 454 184Chemicals 1,025 713 834Refining 796 322 164Marketing and Specialties 164 243 232Corporate and Other 15 — —Consolidated equity in earnings of affiliates $ 2,676 1,732 1,414
Depreciation, Amortization and Impairments Midstream $ 326 299 218Chemicals — — —Refining 841 838 770Marketing and Specialties 114 116 107Corporate and Other 83 89 78Consolidated depreciation, amortization and impairments $ 1,364 1,342 1,173
125
Table of ContentsIndex to Financial Statements
Millions of Dollars 2018 2017 2016Interest Income and Expense Interest income
Midstream $ — 1 2Chemicals — — —Refining — — —Marketing and Specialties — — —Corporate and Other 45 30 16
Consolidated interest income $ 45 31 18
Interest and debt expense Corporate and Other $ 504 438 338
Income (Loss) Before Income Taxes Midstream $ 1,181 638 403Chemicals 1,025 716 839Refining 4,535 2,076 435Marketing and Specialties 1,557 1,020 1,261Corporate and Other (853) (895) (747)Consolidated income before income taxes $ 7,445 3,555 2,191
Investments In and Advances To Affiliates Midstream $ 5,423 4,734 4,769Chemicals 6,233 6,222 5,773Refining 2,226 2,398 2,420Marketing and Specialties 349 390 391Corporate and Other — — 1Consolidated investments in and advances to affiliates $ 14,231 13,744 13,354
Total Assets* Midstream $ 14,329 13,231 12,832Chemicals 6,235 6,226 5,802Refining 23,230 23,780 22,781Marketing and Specialties 6,572 7,052 6,179Corporate and Other 3,936 4,082 4,059Consolidated total assets $ 54,302 54,371 51,653* Prior-period segment information has been recast to include all income tax-related assets in Corporate and Other.
126
Table of ContentsIndex to Financial Statements
Millions of Dollars 2018 2017 2016Capital Expenditures and Investments Midstream $ 1,548 771 1,453Chemicals — — —Refining 826 853 1,149Marketing and Specialties 125 108 98Corporate and Other 140 100 144Consolidated capital expenditures and investments $ 2,639 1,832 2,844
Geographic Information
Long-lived assets, defined as net PP&E plus investments and long-term receivables, by geographic location at December 31 were:
Millions of Dollars 2018 2017 2016
United States $ 34,587 33,457 32,619United Kingdom 1,191 1,254 1,177Germany 570 593 505Other foreign countries 91 97 88Worldwide consolidated $ 36,439 35,401 34,389
127
Table of ContentsIndex to Financial Statements
Note 27— Phillips 66 Partners LP
Phillips 66 Partners, headquartered in Houston, Texas, is a publicly traded MLP formed in 2013 to own, operate, develop and acquire primarily fee-based midstream assets. Phillips 66 Partners’ operations currently consist of crude oil, refined petroleum product and NGL transportation, processing,terminaling and storage assets.
We consolidate Phillips 66 Partners because we determined it is a VIE of which we are the primary beneficiary. As general partner of Phillips 66Partners, we have the ability to control its financial interests, as well as the ability to direct the activities that most significantly impact its economicperformance. As a result of this consolidation, the public common and perpetual convertible preferred unitholders’ ownership interests in Phillips 66Partners are reflected as noncontrolling interests of $2,469 million and $2,314 million on our consolidated balance sheet at December 31, 2018 and2017 , respectively. Generally, drop down transactions to Phillips 66 Partners will eliminate in consolidation, except for third-party debt and third-partyequity offerings made by Phillips 66 Partners to finance such transactions.
At December 31, 2018 , we owned a 54 percent limited partner interest and a 2 percent general partner interest in Phillips 66 Partners, while the publicowned a 44 percent limited partner interest and 13.8 million perpetual convertible preferred units. Holders of the preferred units are entitled to receivecumulative quarterly distributions equal to $0.678375 per unit. Beginning in October 2020, holders are entitled to receive quarterly distributions equalto the greater of $0.678375 per unit or the per-unit distribution paid to common unitholders.
The most significant assets of Phillips 66 Partners that are available to settle only its obligations, along with its most significant liabilities for which itscreditors do not have recourse to Phillips 66’s general credit, were:
Millions of Dollars
December 31
2018 December 31
2017
Cash and cash equivalents $ 1 185Equity investments* 2,448 1,932Net properties, plants and equipment 3,052 2,918Long-term debt 2,998 2,920* Included in “Investments and long-term receivables” line on the Phillips 66 consolidated balance sheet.
2018 ActivitiesPhillips 66 Partners’ initial $250 million continuous offering of common units, or at-the-market (ATM) program, was completed in June 2018. At thattime, Phillips 66 Partners commenced issuing common units under its second $250 million ATM program. For the years ended December 31, 2018 and2017 , on a settlement-date basis, Phillips 66 Partners generated net proceeds of $128 million and $173 million , respectively, from common unitsissued under the ATM programs. Since inception in June 2016 through December 31, 2018 , the ATM programs have generated net proceeds of $320million .
Phillips 66 Partners’ investment in the Gray Oak Pipeline development is held through Holdings LLC. In December 2018, a third party exercised itsoption to acquire a 35 percent interest in Holdings LLC. Because Holdings LLC’s sole asset was its 75 percent ownership interest in Gray Oak, which isconsidered a financial asset, and because certain restrictions were placed on the third party’s ability to transfer or sell its interest in Holdings LLCduring the construction of the Gray Oak Pipeline, the legal sale of the 35 percent interest did not qualify as a sale under GAAP. As such, thecontributions the third party will make to Holdings LLC in 2019 to cover its share of previously incurred and future construction costs plus a premiumto Phillips 66 Partners will be reflected as a long-term obligation on our consolidated balance sheet and financing cash inflows on our consolidatedstatement of cash flows. After construction of the Gray Oak Pipeline is completed, these restrictions expire, and the sale will be recognized underGAAP. Phillips 66 Partners will continue to control and consolidate Holdings LLC after sale recognition, and therefore the third party’s 35 percentinterest will be recharacterized from a long-term obligation to a noncontrolling interest in our financial statements at that time. Also at that time, thepremium paid will be recharacterized from a long-term obligation to a gain in our consolidated statement of income. During January and February of2019, the third party contributed an aggregate of
128
Table of ContentsIndex to Financial Statements
$294 million into Holdings LLC, which Holdings LLC used to fund its portion of Gray Oak’s cash calls. See Note 7—Investments, Loans and Long-Term Receivables , for further discussion regarding Phillip 66 Partners’ investment in Gray Oak.
2017 ActivitiesIn October 2017, we contributed to Phillips 66 Partners our 25 percent ownership interests in both Dakota Access and ETCO and our 100 percentownership interest in Merey Sweeny. Total consideration for the transaction was $1.65 billion , which consisted of $372 million in cash at closing, theassumption of $588 million of promissory notes payable to us, the assumption of a $450 million term loan payable to a third party, and the issuance tous of common and general partner units with a fair value of $240 million . Shortly after closing, Phillips 66 Partners repaid the $588 million ofpromissory notes payable to us, resulting in total cash received by us for the transaction of $960 million .
Phillips 66 Partners financed the consideration paid with the proceeds from the following third-party equity and debt offerings:
• Net proceeds of $737 million from a private placement of 13,819,791 perpetual convertible preferred units, at a price of $54.27 per unit.• Net proceeds of $295 million from a private placement of 6,304,204 common units, at a price of $47.59 per unit.• A portion of the $643 million of net proceeds from a public offering of $650 million of Senior Notes. See Note 12—Debt , for additional
information on the Senior Notes.
Note 28— New Accounting Standards
In February 2018, the FASB issued ASU No. 2018-02, “Income Statement—Reporting Comprehensive Income (Topic 220): Reclassification of CertainTax Effects from Accumulated Other Comprehensive Income.” This ASU allows for the deferred income tax effects stranded in accumulated othercomprehensive income (AOCI) resulting from the Tax Act enacted in December 2017 to be reclassed from AOCI to retained earnings. This ASU iseffective for fiscal years, and interim periods within those fiscal years, beginning after December 15, 2018, with early adoption permitted. Uponadoption on January 1, 2019, we increased retained earnings by approximately $90 million with the offset to accumulated other comprehensive loss onour consolidated balance sheet.
In June 2016, the FASB issued ASU No. 2016-13, “Financial Instruments—Credit Losses (Topic 326): Measurement of Credit Losses on FinancialInstruments.” The new standard amends the impairment model to utilize an expected loss methodology in place of the currently used incurred lossmethodology, which may result in earlier recognition of losses. Public business entities should apply the guidance in ASU No. 2016-13 for annualperiods beginning after December 15, 2019, including interim periods within those annual periods. Early adoption will be permitted for annual periodsbeginning after December 15, 2018. We are evaluating the provisions of ASU No. 2016-13, and currently do not expect our adoption to have a materialimpact on our consolidated financial statements.
In February 2016, the FASB issued ASU No. 2016-02, “Leases (Topic 842).” The new standard establishes a right-of-use (ROU) model that requires alessee to record a ROU asset and a lease liability on the balance sheet for all leases with terms longer than 12 months. Leases will continue to beclassified as either finance or operating, with classification affecting the pattern of expense recognition in the income statement. Similarly, lessors willbe required to classify leases as sales-type, finance or operating, with classification affecting the pattern of income recognition. Classification for bothlessees and lessors will be based on an assessment of whether risks and rewards, as well as substantive control have been transferred through a leasecontract. The ASU also requires additional disclosures. Public business entities should apply the guidance in ASU No. 2016-02 for annual periodsbeginning after December 15, 2018, including interim periods within those annual periods. Early adoption is permitted. We will adopt ASU No. 2016-02 by recognizing a cumulative-effect adjustment to our opening consolidated balance sheet as of our January 1, 2019, adoption date. As of theadoption date, we expect to recognize ROU assets and operating lease liabilities on our consolidated balance sheet of approximately $1.4 billion . Theadoption of this ASU is not expected to have a material impact on our consolidated statements of income and cash flows.
129
Table of ContentsIndex to Financial Statements
Note 29— Condensed Consolidating Financial Information
Phillips 66 has senior notes outstanding, the payment obligations of which are fully and unconditionally guaranteed by Phillips 66 Company, a 100 -percent-owned subsidiary. The following condensed consolidating financial information presents the results of operations, financial position and cashflows for:
• Phillips 66 and Phillips 66 Company (in each case, reflecting investments in subsidiaries utilizing the equity method of accounting).• All other nonguarantor subsidiaries.• The consolidating adjustments necessary to present Phillips 66’s results on a consolidated basis.
This condensed consolidating financial information should be read in conjunction with the accompanying consolidated financial statements and notes.
Millions of Dollars Year Ended December 31, 2018
Statement of Income Phillips 66Phillips 66Company
All OtherSubsidiaries
ConsolidatingAdjustments
TotalConsolidated
Revenues and Other Income Sales and other operating revenues $ — 85,486 25,975 — 111,461Equity in earnings of affiliates 5,918 4,030 747 (8,019) 2,676Net gain on dispositions — 8 11 — 19Other income — 33 28 — 61Intercompany revenues — 3,493 14,085 (17,578) —
Total Revenues and Other Income 5,918 93,050 40,846 (25,597) 114,217 Costs and Expenses Purchased crude oil and products — 79,559 35,563 (17,192) 97,930Operating expenses — 3,769 1,193 (82) 4,880Selling, general and administrative expenses 7 1,297 383 (10) 1,677Depreciation and amortization — 926 430 — 1,356Impairments — 3 5 — 8Taxes other than income taxes — 321 104 — 425Accretion on discounted liabilities — 18 5 — 23Interest and debt expense 402 146 250 (294) 504Foreign currency transaction gains — — (31) — (31)
Total Costs and Expenses 409 86,039 37,902 (17,578) 106,772Income before income taxes 5,509 7,011 2,944 (8,019) 7,445Income tax expense (benefit) (86) 1,093 565 — 1,572Net Income 5,595 5,918 2,379 (8,019) 5,873Less: net income attributable to noncontrolling interests — — 278 — 278Net Income Attributable to Phillips 66 $ 5,595 5,918 2,101 (8,019) 5,595
Comprehensive Income $ 5,520 5,843 2,291 (7,856) 5,798
130
Table of ContentsIndex to Financial Statements
Millions of Dollars Year Ended December 31, 2017
Statement of Income Phillips 66Phillips 66Company
All OtherSubsidiaries
ConsolidatingAdjustments
TotalConsolidated
Revenues and Other Income Sales and other operating revenues $ — 74,640 27,714 — 102,354Equity in earnings of affiliates 5,336 3,256 559 (7,419) 1,732Net gain on dispositions — 1 14 — 15Other income 3 471 47 — 521Intercompany revenues — 1,610 13,457 (15,067) —
Total Revenues and Other Income 5,339 79,978 41,791 (22,486) 104,622 Costs and Expenses Purchased crude oil and products — 63,812 30,379 (14,782) 79,409Operating expenses — 3,672 1,085 (58) 4,699Selling, general and administrative expenses 7 1,300 399 (11) 1,695Depreciation and amortization — 892 426 — 1,318Impairments — 20 4 — 24Taxes other than income taxes — 5,784 7,678 — 13,462Accretion on discounted liabilities — 17 5 — 22Interest and debt expense 348 70 236 (216) 438
Total Costs and Expenses 355 75,567 40,212 (15,067) 101,067Income before income taxes 4,984 4,411 1,579 (7,419) 3,555Income tax benefit (122) (925) (646) — (1,693)Net Income 5,106 5,336 2,225 (7,419) 5,248Less: net income attributable to noncontrolling interests — — 142 — 142Net Income Attributable to Phillips 66 $ 5,106 5,336 2,083 (7,419) 5,106
Comprehensive Income $ 5,484 5,714 2,498 (8,070) 5,626
131
Table of ContentsIndex to Financial Statements
Millions of Dollars Year Ended December 31, 2016
Statement of Income Phillips 66Phillips 66Company
All OtherSubsidiaries
ConsolidatingAdjustments
TotalConsolidated
Revenues and Other Income Sales and other operating revenues $ — 58,822 25,457 — 84,279Equity in earnings of affiliates 1,797 1,839 296 (2,518) 1,414Net gain (loss) on dispositions — (9) 19 — 10Other income — 42 32 — 74Intercompany revenues — 864 9,160 (10,024) —
Total Revenues and Other Income 1,797 61,558 34,964 (12,542) 85,777 Costs and Expenses Purchased crude oil and products — 48,171 24,102 (9,805) 62,468Operating expenses — 3,465 846 (36) 4,275Selling, general and administrative expenses 6 1,236 406 (10) 1,638Depreciation and amortization — 821 347 — 1,168Impairments — 1 4 — 5Taxes other than income taxes — 5,477 8,211 — 13,688Accretion on discounted liabilities — 16 5 — 21Interest and debt expense 366 21 124 (173) 338Foreign currency transaction gains — — (15) — (15)
Total Costs and Expenses 372 59,208 34,030 (10,024) 83,586Income before income taxes 1,425 2,350 934 (2,518) 2,191Income tax expense (benefit) (130) 553 124 — 547Net Income 1,555 1,797 810 (2,518) 1,644Less: net income attributable to noncontrolling interests — — 89 — 89Net Income Attributable to Phillips 66 $ 1,555 1,797 721 (2,518) 1,555
Comprehensive Income $ 1,213 1,455 451 (1,817) 1,302
132
Table of ContentsIndex to Financial Statements
Millions of Dollars Year Ended December 31, 2018
Balance Sheet Phillips 66Phillips 66Company
All OtherSubsidiaries
ConsolidatingAdjustments
TotalConsolidated
Assets Cash and cash equivalents $ — 1,648 1,371 — 3,019Accounts and notes receivable 9 4,255 3,202 (1,293) 6,173Inventories — 2,489 1,054 — 3,543Prepaid expenses and other current assets 2 373 99 — 474
Statement of Cash Flows Phillips 66Phillips 66Company
All OtherSubsidiaries
ConsolidatingAdjustments
TotalConsolidated
Cash Flows From Operating Activities Net Cash Provided by Operating Activities $ 2,955 6,962 2,642 (4,986) 7,573 Cash Flows From Investing Activities Capital expenditures and investments — (998) (1,641) — (2,639)Proceeds from asset dispositions* — 462 50 (455) 57Intercompany lending activities 2,214 (3,031) 817 — —Advances/loans—related parties — — (1) — (1)Other — 27 85 — 112Net Cash Provided by (Used in) Investing Activities 2,214 (3,540) (690) (455) (2,471) Cash Flows From Financing Activities Issuance of debt 1,509 — 675 — 2,184Repayment of debt (550) (11) (583) — (1,144)Issuance of common stock 39 — — — 39Repurchase of common stock (4,645) — — — (4,645)Dividends paid on common stock (1,436) (3,174) (1,812) 4,986 (1,436)Distributions to noncontrolling interests — — (207) — (207)Net proceeds from issuance of Phillips 66 Partners LP common units — — 128 — 128Other (86) — (455) 455 (86)Net Cash Used in Financing Activities (5,169) (3,185) (2,254) 5,441 (5,167) Effect of Exchange Rate Changes on Cash, Cash Equivalents and
Restricted Cash — — (35) — (35) Net Change in Cash, Cash Equivalents and Restricted Cash — 237 (337) — (100)Cash, cash equivalents and restricted cash at beginning of period — 1,411 1,708 — 3,119Cash, Cash Equivalents and Restricted Cash at End of Period $ — 1,648 1,371 — 3,019* Includes return of investments in equity affiliates.
135
Table of ContentsIndex to Financial Statements
Millions of Dollars Year Ended December 31, 2017
Statement of Cash Flows Phillips 66Phillips 66Company
All OtherSubsidiaries
ConsolidatingAdjustments
TotalConsolidated
Cash Flows From Operating Activities Net Cash Provided by Operating Activities $ 2,619 2,702 1,747 (3,420) 3,648 Cash Flows From Investing Activities Capital expenditures and investments* — (1,133) (839) 140 (1,832)Proceeds from asset dispositions** — 265 84 (263) 86Intercompany lending activities 401 1,453 (1,854) — —Advances/loans—related parties — (10) — — (10)Collection of advances/loans—related parties — 75 251 — 326Restricted cash received from consolidation of business — — 318 — 318Other — (26) (8) — (34)Net Cash Provided by (Used in) Investing Activities 401 624 (2,048) (123) (1,146) Cash Flows From Financing Activities Issuance of debt 1,500 — 2,008 — 3,508Repayment of debt (1,500) (17) (2,161) — (3,678)Issuance of common stock 35 — — — 35Repurchase of common stock (1,590) — — — (1,590)Dividends paid on common stock (1,395) (2,752) (668) 3,420 (1,395)Distributions to noncontrolling interests — — (120) — (120)Net proceeds from issuance of Phillips 66 Partners LP common and
preferred units — — 1,205 — 1,205Other* (70) — (129) 123 (76)Net Cash Provided by (Used in) Financing Activities (3,020) (2,769) 135 3,543 (2,111) Effect of Exchange Rate Changes on Cash, Cash Equivalents and
Restricted Cash — — 17 — 17 Net Change in Cash, Cash Equivalents and Restricted Cash — 557 (149) — 408Cash, cash equivalents and restricted cash at beginning of period — 854 1,857 — 2,711Cash, Cash Equivalents and Restricted Cash at End of Period $ — 1,411 1,708 — 3,119 * Includes intercompany capital contributions.** Includes return of investments in equity affiliates.
136
Table of ContentsIndex to Financial Statements
Millions of Dollars Year Ended December 31, 2016
Statement of Cash Flows Phillips 66Phillips 66Company
All OtherSubsidiaries
ConsolidatingAdjustments
TotalConsolidated
Cash Flows From Operating Activities Net Cash Provided by Operating Activities $ 3,491 2,307 1,552 (4,387) 2,963
Cash Flows From Investing Activities Capital expenditures and investments* — (1,425) (1,457) 38 (2,844)Proceeds from asset dispositions** — 1,007 156 (1,007) 156Intercompany lending activities (1,139) 2,046 (907) — —Advances/loans—related parties — (75) (357) — (432)Collection of advances/loans—related parties — — 108 — 108Other — 18 (164) — (146)Net Cash Provided by (Used in) Investing Activities (1,139) 1,571 (2,621) (969) (3,158)
Cash Flows From Financing Activities Issuance of debt — — 2,090 — 2,090Repayment of debt — (26) (807) — (833)Issuance of common stock 34 — — — 34Repurchase of common stock (1,042) — — — (1,042)Dividends paid on common stock (1,282) (3,604) (783) 4,387 (1,282)Distributions to noncontrolling interests — — (75) — (75)Net proceeds from issuance of Phillips 66 Partners LP common units — — 972 — 972Other* (62) 31 (980) 969 (42)Net Cash Provided by (Used in) Financing Activities (2,352) (3,599) 417 5,356 (178)
Effect of Exchange Rate Changes on Cash, Cash Equivalents andRestricted Cash — — 10 — 10
Net Change in Cash, Cash Equivalents and Restricted Cash — 279 (642) — (363)Cash, cash equivalents and restricted cash at beginning of period — 575 2,499 — 3,074Cash, Cash Equivalents and Restricted Cash at End of Period $ — 854 1,857 — 2,711 * Includes intercompany capital contributions.** Includes return of investments in equity affiliates.
137
Table of ContentsIndex to Financial Statements
Selected Quarterly Financial Data (Unaudited)
Millions of Dollars Per Share of Common Stock Sales and Other
2017 First $ 22,894 797 563 535 1.02 1.02Second 24,087 848 581 550 1.06 1.06Third 25,627 1,256 849 823 1.60 1.60Fourth** 29,746 654 3,255 3,198 6.29 6.25* 2017 amounts include excise taxes on sales of refined petroleum products.
** Includes a $2,721 million provisional income tax benefit from the enactment of the U.S. Tax Cuts and Jobs Act in December 2017.
138
Table of ContentsIndex to Financial Statements
Item 9. CHANGES IN AND DISAGREEMENTS WITH ACCOUNTANTS ON ACCOUNTING AND FINANCIAL DISCLOSURE
None.
Item 9A. CONTROLS AND PROCEDURES
We maintain disclosure controls and procedures designed to ensure that information required to be disclosed in reports we file or submit under theSecurities Exchange Act of 1934, as amended (the Act), is recorded, processed, summarized and reported within the time periods specified in SEC rulesand forms, and that such information is accumulated and communicated to management, including our principal executive and principal financialofficers, as appropriate, to allow timely decisions regarding required disclosure. As of December 31, 2018 , with the participation of management, ourChairman and Chief Executive Officer and our Executive Vice President, Finance and Chief Financial Officer carried out an evaluation, pursuant toRule 13a-15(b) of the Act, of the effectiveness of our disclosure controls and procedures (as defined in Rule 13a-15(e) of the Act). Based upon thatevaluation, our Chairman and Chief Executive Officer and our Executive Vice President, Finance and Chief Financial Officer concluded that ourdisclosure controls and procedures were operating effectively as of December 31, 2018 .
There have been no changes in our internal control over financial reporting, as defined in Rule 13a-15(f) of the Act, in the quarterly period endedDecember 31, 2018 , that have materially affected, or are reasonably likely to materially affect, our internal control over financial reporting.
Management’s Annual Report on Internal Control Over Financial Reporting
This report is included in Item 8 and is incorporated herein by reference.
Report of Independent Registered Public Accounting Firm on Internal Control Over Financial Reporting
This report is included in Item 8 and is incorporated herein by reference.
Item 9B. OTHER INFORMATION
None.
139
Table of ContentsIndex to Financial Statements
PART III
Item 10. DIRECTORS, EXECUTIVE OFFICERS AND CORPORATE GOVERNANCE
Information regarding our executive officers appears in Part I of this report.
The remaining information required by Item 10 of Part III is incorporated herein by reference from our Proxy Statement for the Annual Meeting ofStockholders to be held on May 8, 2019 , which will be filed within 120 days after December 31, 2018 ( 2019 Definitive Proxy Statement).*
Item 11. EXECUTIVE COMPENSATION
The information required by Item 11 of Part III is incorporated herein by reference from our 2019 Definitive Proxy Statement.*
Item 12. SECURITY OWNERSHIP OF CERTAIN BENEFICIAL OWNERS AND MANAGEMENT AND RELATED STOCKHOLDERMATTERS
The information required by Item 12 of Part III is incorporated herein by reference from our 2019 Definitive Proxy Statement.*
Item 13. CERTAIN RELATIONSHIPS AND RELATED TRANSACTIONS, AND DIRECTOR INDEPENDENCE
The information required by Item 13 of Part III is incorporated herein by reference from our 2019 Definitive Proxy Statement.*
Item 14. PRINCIPAL ACCOUNTING FEES AND SERVICES
The information required by Item 14 of Part III is incorporated herein by reference from our 2019 Definitive Proxy Statement.*
_________________________* Except for information or data specifically incorporated herein by reference under Items 10 through 14, other information and data appearing in our 2019 Definitive Proxy Statement are not
deemed to be a part of this Annual Report on Form 10-K or deemed to be filed with the Commission as a part of this report.
140
Table of ContentsIndex to Financial Statements
PART IV
Item 15. EXHIBITS, FINANCIAL STATEMENT SCHEDULES
(a) 1. Financial Statements and Supplementary DataThe financial statements and supplementary information listed in the Index to Financial Statements, which appears on page 71, are filed aspart of this Annual Report on Form 10-K.
2. Financial Statement SchedulesAll financial statement schedules are omitted because they are not required, not significant, not applicable, or the information is shown inthe financial statements or notes thereto.
3. Exhibits
The exhibits listed in the Index to Exhibits, which appears on pages 142 to 145, are filed as part of this Annual Report on Form 10-K.
Item 16. FORM 10-K SUMMARY
None.
141
Table of ContentsIndex to Financial Statements
PHILLIPS 66
INDEX TO EXHIBITS
Incorporated by ReferenceExhibitNumber Exhibit Description Form
ExhibitNumber
FilingDate
SECFile No.
2.1
Separation and Distribution Agreement between ConocoPhillips andPhillips 66, dated April 26, 2012 .
8-K 2.1 05/01/2012 001-35349
3.1 Amended and Restated Certificate of Incorporation of Phillips 66 . 8-K 3.1 05/01/2012 001-35349 3.2 Amended and Restated By-Laws of Phillips 66 . 8-K 3.1 02/09/2017 001-35349 4.1
Indenture, dated as of March 12, 2012, among Phillips 66, as issuer,Phillips 66 Company, as guarantor, and The Bank of New York MellonTrust Company, N.A., as trustee, in respect of senior debt securities ofPhillips 66 .
10 4.3 04/05/2012 001-35349
As permitted by Item 601(b)(4)(iii)(A) of Regulation S-K, the company hasnot filed with this Annual Report on Form 10-K certain instrumentsdefining the rights of holders of long-term debt of the company and itssubsidiaries because the total amount of securities authorized thereunderdoes not exceed 10 percent of the total assets of the company and itssubsidiaries on a consolidated basis. The company agrees to furnish a copyof such agreements to the Commission upon request.
10.1
Credit Agreement among Phillips 66, Phillips 66 Company, JPMorganChase Bank, N.A., as Administrative Agent, and the lenders named therein,dated as of February 22, 2012 .
10 4.1 03/01/2012 001-35349
10.2
First Amendment to Credit Agreement among Phillips 66, Phillips 66Company, JPMorgan Chase Bank, N.A., and lenders named therein, datedas of June 10, 2013 .
10-Q 10.1 05/01/2014 001-35349
10.3
Second Amendment to Credit Agreement among Phillips 66, Phillips 66Company, JPMorgan Chase Bank, N.A., and lenders named therein, datedas of December 10, 2014 .
10-K 10.3 02/20/2015 001-35349
10.4
Third Amendment to Credit Agreement among Phillips 66, Phillips 66Company, JPMorgan Chase Bank, N.A., and lenders named therein, datedas of October 3, 2016 .
10-K 10.4 02/17/2017 001-35349
10.5
Third Amended and Restated Limited Liability Company Agreement ofChevron Phillips Chemical Company LLC, effective as of May 1, 2012 .
10-Q 10.14 08/03/2012 001-35349
10.6
First Amendment to Third Amended and Restated Limited LiabilityCompany Agreement of Chevron Phillips Chemical Company LLC,effective as of December 31, 2017 .
10-K 10.6 02/23/2018 001-35349
10.7
Second Amendment to Third Amended and Restated Limited LiabilityCompany Agreement of Chevron Phillips Chemical Company LLC,effective as of June 1, 2018 .
Incorporated by ReferenceExhibit Number Exhibit Description Form
Exhibit Number
Filing Date
SEC File No.
10.8
Second Amended and Restated Limited Liability Company Agreement ofDuke Energy Field Services, LLC, dated July 5, 2005, by and betweenConocoPhillips Gas Company and Duke Energy Enterprises Corporation .
10 10.12 03/01/2012 001-35349
10.9
First Amendment to Second Amended and Restated Limited LiabilityCompany Agreement of Duke Energy Field Services, LLC, dated August11, 2006, by and between ConocoPhillips Gas Company and Duke EnergyEnterprises Corporation .
10 10.13 03/01/2012 001-35349
10.10
Second Amendment to Second Amended and Restated Limited LiabilityCompany Agreement of DCP Midstream, LLC (formerly Duke EnergyField Services, LLC), dated February 1, 2007, by and betweenConocoPhillips Gas Company, Spectra Energy DEFS Holding, LLC, andSpectra Energy DEFS Holding Corp .
10 10.14 03/01/2012 001-35349
10.11
Third Amendment to Second Amended and Restated Limited LiabilityCompany Agreement of DCP Midstream, LLC (formerly Duke EnergyField Services, LLC), dated April 30, 2009, by and betweenConocoPhillips Gas Company, Spectra Energy DEFS Holding, LLC, andSpectra Energy DEFS Holding Corp .
10 10.15 03/01/2012 001-35349
10.12
Fourth Amendment to Second Amended and Restated Limited LiabilityCompany Agreement of DCP Midstream, LLC (formerly Duke EnergyField Services, LLC), dated November 9, 2010, by and betweenConocoPhillips Gas Company, Spectra Energy DEFS Holding, LLC, andSpectra Energy DEFS Holding Corp .
10 10.16 03/01/2012 001-35349
10.13
Fifth Amendment to July 5, 2005 Second Amended and Restated LimitedLiability Company Agreement of DCP Midstream, LLC (formerly DukeEnergy Field Services, LLC) dated September 9, 2014, by and betweenPhillips Gas Company (formerly ConocoPhillips Gas Company), SpectraEnergy DEFS Holding, LLC, and Spectra Energy DEFS Holding II, LLC .
10-Q 10.1 10/30/2014 001-35349
10.14
Indemnification and Release Agreement between ConocoPhillips andPhillips 66, dated April 26, 2012 .
8-K 10.1 05/01/2012 001-35349
10.15
Intellectual Property Assignment and License Agreement betweenConocoPhillips and Phillips 66, dated April 26, 2012 .
8-K 10.2 05/01/2012 001-35349
10.16
Tax Sharing Agreement between ConocoPhillips and Phillips 66, datedApril 26, 2012 .
8-K 10.3 05/01/2012 001-35349
10.17
Employee Matters Agreement between ConocoPhillips and Phillips 66,dated April 26, 2012 .
8-K 10.4 05/01/2012 001-35349
10.18
Amendment to the Employee Matters Agreement by and betweenConocoPhillips and Phillips 66, dated April 26, 2012 .
10-Q 10.1 05/02/2013 001-35349
10.19
Transition Services Agreement between ConocoPhillips and Phillips 66,dated April 26, 2012 .
Incorporated by ReferenceExhibit Number Exhibit Description Form
Exhibit Number
Filing Date
SEC File No.
10.20 2013 Omnibus Stock and Performance Incentive Plan of Phillips 66 .** DEF14A App. A 03/27/2013 001-35349 10.21 Phillips 66 Key Employee Supplemental Retirement Plan .** 10-Q 10.15 08/03/2012 001-35349 10.22
First Amendment to the Phillips 66 Key Employee SupplementalRetirement Plan .**
10-K 10.18 02/22/2013 001-35349
10.23 Phillips 66 Amended and Restated Executive Severance Plan .** 10-Q 10.1 07/29/2016 001-35349 10.24 Phillips 66 Deferred Compensation Plan for Non-Employee Directors .** 10-Q 10.17 08/03/2012 001-35349 10.25 Phillips 66 Key Employee Deferred Compensation Plan-Title I .** 10-Q 10.18 08/03/2012 001-35349 10.26 Phillips 66 Key Employee Deferred Compensation Plan-Title II .** 10-Q 10.19 08/03/2012 001-35349 10.27
First Amendment to the Phillips 66 Key Employee Deferred CompensationPlan Title II .**
10-K 10.24 02/22/2013 001-35349
10.28 Phillips 66 Defined Contribution Make-Up Plan Title I .** 10-Q 10.20 08/03/2012 001-35349 10.29 Phillips 66 Defined Contribution Make-Up Plan Title II .** 10-K 10.26 02/22/2013 001-35349 10.30 Phillips 66 Key Employee Change in Control Severance Plan .** 10-K 10.27 02/22/2013 001-35349 10.31
First Amendment to Phillips 66 Key Employee Change in ControlSeverance Plan, Effective October 2, 2015 .**
8-K 10.1 11/08/2013 001-35349
10.32
Annex to the Phillips 66 Nonqualified Deferred CompensationArrangements .**
10-Q 10.23 08/03/2012 001-35349
10.33 *
Form of Stock Option Award Agreement under the 2013 Omnibus Stockand Performance Incentive Plan of Phillips 66 .**
10.34 *
Form of Restricted Stock or Restricted Stock Unit Award Agreement underthe 2013 Omnibus Stock and Performance Incentive Plan of Phillips 66 .**
10.35 *
Form of Performance Share Unit Award Agreement under the 2013Omnibus Stock and Performance Incentive Plan of Phillips 66 .**
10.36
Stock Purchase and Sale Agreement between Phillips 66, BerkshireHathaway Inc., and National Indemnity Company, dated February 13, 2018.
8-K 10.1 02/14/2018 001-35349
21 * List of Subsidiaries of Phillips 66 . 23.1 *
Consent of Ernst & Young LLP, independent registered public accountingfirm .
31.1 *
Certification of Chief Executive Officer pursuant to Rule 13a-14(a) underthe Securities Exchange Act of 1934 .
** Management contracts and compensatory plans or arrangements.
145
Table of ContentsIndex to Financial Statements
SIGNATURES
Pursuant to the requirements of Section 13 or 15(d) of the Securities Exchange Act of 1934, the registrant has duly caused this report to be signed on itsbehalf by the undersigned, thereunto duly authorized.
PHILLIPS 66 Date: February 22, 2019 /s/ Greg C. Garland
Greg C. GarlandChairman of the Board of Directors
and Chief Executive Officer
Pursuant to the requirements of the Securities Exchange Act of 1934, this report has been signed below, as of February 22, 2019 , by the followingpersons on behalf of the registrant, and in the capacities indicated.
Signature Title
/s/ Greg C. Garland Chairman of the Board of DirectorsGreg C. Garland and Chief Executive Officer
(Principal executive officer)
/s/ Kevin J. Mitchell Executive Vice President, FinanceKevin J. Mitchell and Chief Financial Officer
(Principal financial officer)
/s/ Chukwuemeka A. Oyolu Vice President and ControllerChukwuemeka A. Oyolu (Principal accounting officer)
146
Table of ContentsIndex to Financial Statements
/s/ Gary K. Adams DirectorGary K. Adams
/s/ J. Brian Ferguson DirectorJ. Brian Ferguson
/s/ John E. Lowe DirectorJohn E. Lowe
/s/ Harold W. McGraw III DirectorHarold W. McGraw III
/s/ Denise L. Ramos DirectorDenise L. Ramos
/s/ Glenn F. Tilton DirectorGlenn F. Tilton
/s/ Victoria J. Tschinkel DirectorVictoria J. Tschinkel
/s/ Marna C. Whittington DirectorMarna C. Whittington
147
Exhibit 10.33
PHILLIPS 66
Terms & ConditionsFor
[ • ] Stock Option Program
Grant Date: [•]Grant Price: [•]Vesting Schedule: One third on each anniversary date of grant in the first three years
This document applies to Awards made under the Stock Option Program (“Program”) provided under the 2013 Omnibus Stock andPerformance Incentive Plan of Phillips 66 (“Plan”) or any successor to the Plan. Phillips 66 reserves the right to discontinue orchange this Program at any time.
Capitalized terms shall have the meaning designated in this Program. Capitalized terms not defined in this Program shall have themeaning set forth in the Plan.
• Authorized Party means the person who is authorized to approve an Award, exercise discretion, or take action under theProgram pursuant to the Plan. With regard to the CEO and Senior Officers, the Committee is the Authorized Party. Withregard to other Employees, the CEO is the Authorized Party, although the Committee may act concurrently as the AuthorizedParty.
• Award means cash, stock option, performance share unit, restricted stock unit or any other form of equity or cash pursuant tothe Program’s applicable terms, conditions and limitations as the Authorized Party may provide in order to fulfill theobjectives of the Program.
• Award Agreement means any written or electronic agreement setting forth, or incorporating by reference, the terms,conditions, and limitations applicable to an Award to a Participating Employee. An Award Agreement may be unilaterallyissued by the Company and need not be executed or countersigned by the Participating Employee.
• Board means the Board of Directors of Phillips 66.• CEO means the Chief Executive Officer of Phillips 66. Where applicable, CEO also refers to the person holding that title but
acting as a Special Equity Award Committee pursuant to the authority granted by the Board.• Committee means the Human Resources and Compensation Committee of the Board of Directors of the Company, or any
successor committee to it.• Company means Phillips 66, a Delaware Corporation.
• Disability means a disability for which the Employee in question has been determined to be entitled to either, (i) benefitsunder the applicable long-term disability plan of the Participating Company or (ii) disability benefits under the SocialSecurity Act. In the absence of any determination, the Authorized Party may make a determination that the Employee has aDisability.
• Eligible Employee shall include Employees that meet the participation requirements for this Program. Being an EligibleEmployee does not guarantee an Award.
• Employee shall include employees of Phillips 66 and its subsidiaries, as designated in the records of the Company and itssubsidiaries.
• Fair Market Value means, as of a particular date, the mean between the highest and lowest sales price per share on theconsolidated transaction reporting system for the principal national securities exchange on which shares are listed on that daterounded to 5 decimals, or, if there is no sale reported on that date, on the next preceding date on which a sale is reported or, atthe discretion of the Committee, the price prevailing on the exchange at a designated time.
• Grant Date means the date the Award is granted.• Grant Price is a simplified way of describing “Fair Market Value as of Grant Date”. It is the price at which Employees may
exercise their right to receive cash or shares under the terms of an Award.• Layoff means an applicable Termination due to layoff under the Phillips 66 Severance Pay Plan, Phillips 66 Executive
Severance Plan, or the Phillips 66 Key Employee Change in Control Severance Plan, or layoff or redundancy under anysimilar layoff or redundancy plan which the Participating Company may adopt from time to time. If all or any portion of thebenefits under the redundancy or layoff plan are contingent on the Employee’s signing a Release of Liability or covenant notto compete or both, the Termination shall not be considered as a “Layoff” for purposes of the Program unless the Employeeexecutes and does not revoke a Release of Liability, a covenant not to compete, or both, acceptable to the Company, underthe terms of the layoff or redundancy plan.
• Participating Company includes Phillips 66 and its 100% owned subsidiaries, including both those directly owned and thoseowned through subsidiaries, whose participation has been approved by the Authorized Party.
• Participating Employee shall include Eligible Employee receiving an Award under this Program. Being a ParticipatingEmployee does not guarantee a distribution.
• Plan Administrator means the Phillips 66 Employee internally responsible for the administration of Programs.• Release of Liability is a form provided to an Employee upon Layoff. Unless the Participating Employee executes and does
not revoke the Release of Liability, the Participating Employee forfeits all Awards.• Retirement means Termination at age 55 or older with a minimum of 5 years of service with a Participating Company;
provided, however, that with regard to an Employee not on the United States payroll, the Authorized Party may approve theuse of a different definition. Service is defined by the policies of the Participating Company.
• Senior Officer means all officers of the Company who report directly to the CEO, and all other officers of the Company whoare a Senior Vice President and above, or who are reporting officers under Section 16 of the Securities Exchange Act of1934.
• Shares means shares of PSX common stock.
2
• Stock Option means a right to purchase a specified number of Shares at a specified Grant Price pursuant to the applicableterms, conditions, and limitations established by the Authorized Party. Stock Options issued will be nonqualified, whichmeans they can be issued to Employees or members of the Board.
• Termination means cessation of employment with the Participating Companies, determined in accordance with the policiesand practices of the Participating Company for whom the Employee was last performing services.
• Termination Date is defined as the first date an Employee is no longer employed by and performing services for aParticipating Company.
I. GENERAL CONDITIONS1. The Committee, or to the extent authorized by the Committee, the CEO, or another designated individual or committee, shall
have the right to terminate, suspend, withdraw, amend, or modify the Program in whole or in part at any time. The CEO shallreview and approve this document and may amend it as necessary.
2. Awards are subject to forfeiture or recoupment, in whole or in part, under applicable law, including the Sarbanes-Oxley Act andthe Dodd-Frank Act. Awards are also subject to forfeiture or recoupment in the event a Participating Employee’s negligence ormisconduct results in materially misstated financial or other data, as determined by the Human Resources & CompensationCommittee and the Audit & Finance Committee of the Board. If the Authorized Party determines that, subsequent to the receiptof any Award, the Participating Employee has engaged or is engaging in any activity which, in the sole judgment of theAuthorized Party, is or may be detrimental to the Participating Company, the Authorized Party may cancel all or part of any orall Awards to that Participating Employee.
3. Upon any change in the outstanding stock of the Company by reason of any stock dividend, stock split, reverse stock split,recapitalization, reclassification, or other similar changes, the Committee shall make corresponding adjustments, as appropriate.
4. In addition to the terms and conditions described, Awards are subject to all other applicable provisions of the Plan. The decisionsof the Committee with respect to questions arising as to the interpretation of the Plan or the Award Agreement and as to findingsof fact shall be final, conclusive, and binding.
5. No provision of this document shall confer any right upon the Employee to continue employment with any ParticipatingCompany.
6. The Award Agreement shall be governed by, construed, and enforced in accordance with the laws of the State of Delaware.
7. Without the consent of the Employee, the Award Agreement may be amended or supplemented (i) to cure any ambiguity or tocorrect or supplement any provision which may be defective or inconsistent with any other provision, or (ii) to add to thecovenants and agreements of the Company for the benefit of an Employee or to add to the rights of an Employee or to surrenderany right or power reserved to or conferred upon the Company in
3
the Award Agreement, provided, in each case, that such changes or corrections shall not adversely affect the rights of theEmployee with respect to the grant of an Award evidenced without the Employee’s consent, or (iii) to make such other changesas the Company, upon advice of counsel, determines are necessary or advisable because of the adoption or promulgation of, orchange in the interpretation of, any law or governmental rule or regulation, including any applicable federal or state securities ortax laws.
II. PARTICIPATIONThe Authorized Party makes the determination of whom to provide Awards. In general, employees that are exempt from overtimeare eligible, provided they are in an eligible salary grade and do not participate in certain STI programs which state that participationin the STI program precludes their ability to receive an Award under this Program. It is not expected that the following will beconsidered eligible for an Award: members of collective bargaining units or works councils; temporary, inactive (unless on anapproved leave), or intermittent Employees; or independent contractors, employees of third parties providing services to theCompany or its subsidiaries, and consultants.
III. DETERMINATION OF AWARDThe Award shall be held in escrow by the Company until the lapsing of restrictions placed upon the Stock Options. Generally,restrictions shall lapse and Stock Options become exercisable to the extent that one third of the Stock Options (rounded down to thenearest whole share) shall be exercisable on the first anniversary of the Grant Date. On the second anniversary date of the GrantDate, an additional one third of the Stock Options (rounded down to the nearest whole share) shall become exercisable. On the thirdanniversary date of the Grant Date, the remaining Stock Options shall become exercisable. Stock Options granted under thisProcedure will be for a term of ten years. An Authorized Party may, however, designate another term, not in excess of ten years, withrespect to any Award. Participating Employees shall not have the right to sell, transfer, assign, or otherwise dispose of Stock Optionsuntil the escrow is terminated.
IV. EFFECT OF TERMINATION OF EMPLOYMENTThe following is meant to clarify what happens in the event of various Terminations for Participating Employees with Awards.
1. Death. If a Participating Employee dies while in the employ of a Participating Company, the Participating Employee’s rights toany Award will pass to the beneficiary on file with the third-party administrator, or in the absence of a designated beneficiary, tothe executor or administrator of the estate of the Participating Employee. However, the Award will be subject to the terms andconditions that applied to the Participating Employee before their death. Rights cannot be assigned or transferred other than bywill or the laws of descent and distribution. No transfer of an Award by the Participating Employee by will or by the laws ofdescent and distribution shall be effective to bind the Company unless the Company shall have been furnished with writtennotice thereof and a copy of the will and any other evidence as the Company may deem necessary to establish the validity of thetransfer and the acceptance by the transferee or transferees of the terms and conditions of the Award. In the
4
event that a beneficiary designation conflicts with an assignment by will or under the laws of descent and distribution, thebeneficiary designation will prevail.
2. Disability. If a Participating Employee terminates employment by reason of Disability and has Awards with restrictions, theParticipating Employee shall retain all rights provided by the Award at the time of Termination.
3. Layoff. The following details how Awards with restrictions are handled when a Participating Employee Terminates by reason ofLayoff:• If the Participating Employee’s employment with a Participating Company is terminated by reason of Layoff prior to a date
six months from Grant Date, the Award shall be canceled and all rights thereunder shall cease.• If the Participating Employee’s employment with a Participating Company is terminated by reason of Layoff on or after six
months from Grant Date, prior to a date one year from the Grant Date, and the Participating Employee completes the requiredRelease of Liability, then the Participating Employee shall retain a prorated portion of the Award. The percent of the Awardto be retained will be computed by multiplying the original number of Shares granted by a percentage. The calculation shallbe rounded to the nearest whole share. If a Participating Employee is terminated by reason of Layoff, but meets the definitionof Retirement, Retirement disposition prevails.
• If the Participating Employee’s employment with a Participating Company is terminated by reason of Layoff on or after oneyear from Grant Date and the Participating Employee completes the required Release of Liability, then the ParticipatingEmployee shall retain all rights provided by the Award at the time of the Termination.
4. Retirement. The following details how Awards with restrictions are handled when a Participating Employee Terminates byreason of Retirement:• If the Participating Employee’s employment with a Participating Company is terminated by reason of Retirement prior to a
date six months from Grant Date, the Award shall be canceled and all rights thereunder shall cease.• If the Participating Employee’s employment with a Participating Company is terminated by reason of Retirement on or after
a date six months from Grant Date, the Participating Employee shall retain all rights provided by the Award at the time ofTermination.
5. If the Participating Employee Terminates for any reason other than death, Disability, Layoff, or Retirement, the Award shall becanceled and all rights thereunder shall cease; however, the Authorized Party may, in its sole discretion, determine that all or anyportion of the Award shall not be cancelled due to Termination.
6. Leaves. Whether any leave of absence shall constitute Termination for the purposes of any Award granted under these Programsshall be determined by the Plan Administrator in each case in accordance with applicable law and by application of the policiesand procedures adopted by the Company in relation to such leave of absence.
5
7. Divestiture, Outsourcing or Move to Joint Venture. If, after the date the Award is granted, a Participating Employee ceases to beemployed by a Participating Company as a result of (a) the outsourcing of a function, (b) the sale or transfer of all or a portion ofthe equity interest of the Participating Company (removing it from the controlled group of companies of which the Company is apart), (c) the sale of all or substantially all of the assets of the Participating Company to another employer outside of thecontrolled group of corporations (whether the Participating Employee is offered employment or accepts employment with theother employer), (d) the Termination of the Participating Employee by a Participating Company followed by employment withina reasonable time with a company or other entity in which the Company owns, directly or indirectly, at least a 50% interest, or(e) any other sale of assets determined by the Authorized Party to be considered a divestiture under this Program, the Award shallbe forfeited unless (i) the Authorized Party may, in its or his sole discretion, determine that all or a portion of any Award shallnot be canceled or (ii) the Award is retained as a result of another provision of this Program.
8. Transfer. Transfer of employment between Participating Companies shall not constitute Termination for the purpose of anyAward granted under the Program.
9. Change in Control. If a Change in Control occurs and the Participating Employee is Terminated, all restrictions applicable to anyAward shall lapse and the Stock Options will remain exercisable for the rest of their term.
V. EXERCISE AND PAYMENT FOR SHARES1. Upon the vesting of restrictions, the Participating Employee can initiate exercising the Stock Options by contacting the third-
party administrator designated by the Plan Administrator.
2. In all cases, if a Participating Employee is subject to trading restrictions, authorization prior to exercising of Stock Options mustbe obtained by Senior Counsel SEC.
3. Upon exercise the Participating Employee is responsible for paying the cost of the Shares at Grant Price, along with applicabletaxes and fees (see Taxation of Distributions). The payment may be made in cash or by tendering Shares.
VI. TAX WITHHOLDING1. Exercise of a Participating Employee’s Award will generally result in required tax withholding or expatriate hypothetical tax
obligation. The Participating Employee is responsible for required withholding taxes associated with an exercise.
2. The Company will generally withhold Shares for taxes to meet tax obligations. The value of the Shares withheld for this purposeshall not exceed the minimum withholding amount required by applicable laws and regulations. With the Plan Administrator’sapproval, Participating Employees may request a different withholding rate.
3. If the Participating Employee spent time as an expatriate outside of their home country the Participating Employee will be taxequalized, with the intent that the Participating Employee
6
receives no adverse tax consequences for their expatriate service, which could be different depending upon each country. TheParticipating Employee’s distribution will reflect any expatriate hypothetical tax obligation.
4. The Company may take appropriate measures to ensure that corrective actions related to withholding tax obligations arecompleted in a timely manner. The Plan Administrator will take steps, as it deems necessary or desirable for the withholding ofany taxes that are required by laws or regulations of any governmental authority in connection with any distribution.
7
Exhibit 10.34
PHILLIPS 66
Terms & ConditionsFor
[ • ] Restricted Stock Program
Grant Date: [•]Grant Price US/UK: [•]Grant Price Global: [•]Vesting Schedule: Third Anniversary of Grant Date
This document applies to Awards made under the Restricted Stock Program (“Program”) provided under the 2013 Omnibus Stockand Performance Incentive Plan of Phillips 66 (“Plan”) or any successor to the Plan. Phillips 66 reserves the right to discontinue orchange this Program at any time.
Capitalized terms shall have the meaning designated in this Program. Capitalized terms not defined in this Program shall have themeaning set forth in the Plan.
• Authorized Party means the person who is authorized to approve an Award, exercise discretion, or take action under theProgram pursuant to the Plan. With regard to the CEO and Senior Officers, the Committee is the Authorized Party. Withregard to other Employees, the CEO is the Authorized Party, although the Committee may act concurrently as the AuthorizedParty.
• Award means cash, stock option, performance share unit, restricted stock unit or any other form of equity or cash pursuant tothe Program’s applicable terms, conditions and limitations as the Authorized Party may provide in order to fulfill theobjectives of the Program.
• Award Agreement means any written or electronic agreement setting forth, or incorporating by reference, the terms,conditions, and limitations applicable to an Award to a Participating Employee. An Award Agreement may be unilaterallyissued by the Company and need not be executed or countersigned by the Participating Employee.
• Board means the Board of Directors of Phillips 66.• CEO means the Chief Executive Officer of Phillips 66. Where applicable, CEO also refers to the person holding that title but
acting as a Special Equity Award Committee pursuant to the authority granted by the Board.• Committee means the Human Resources and Compensation Committee of the Board of Directors of the Company, or any
successor committee to it.
• Company means Phillips 66, a Delaware Corporation.• Disability means a disability for which the Employee in question has been determined to be entitled to either, (i) benefits
under the applicable long-term disability plan of the Participating Company or (ii) disability benefits under the SocialSecurity Act. In the absence of any determination, the Authorized Party may make a determination that the Employee has aDisability.
• Dividend Equivalents means, with respect to Restricted Stock Units, an amount equal to ordinary dividends that are payableto stockholders of record during the Restriction Period on a like number of Shares.
• Eligible Employee shall include Employees that meet the participation requirements for this Program. Being an EligibleEmployee does not guarantee an Award.
• Employee shall include employees of Phillips 66 and its subsidiaries, as designated in the records of the Company and itssubsidiaries.
• Fair Market Value means, as of a particular date, the mean between the highest and lowest sales price per share on theconsolidated transaction reporting system for the principal national securities exchange on which shares are listed on that daterounded to 5 decimals, or, if there is no sale reported on that date, on the next preceding date on which a sale is reported or, atthe discretion of the Committee, the price prevailing on the exchange at a designated time.
• Grant Date means the date the Award is granted.• Layoff means an applicable Termination due to layoff under the Phillips 66 Severance Pay Plan, Phillips 66 Executive
Severance Plan, or the Phillips 66 Key Employee Change in Control Severance Plan, or layoff or redundancy under anysimilar layoff or redundancy plan which the Participating Company may adopt from time to time. If all or any portion of thebenefits under the redundancy or layoff plan are contingent on the Employee’s signing a Release of Liability or covenant notto compete or both, the Termination shall not be considered as a “Layoff” for purposes of the Program unless the Employeeexecutes and does not revoke a Release of Liability, a covenant not to compete, or both, acceptable to the Company, underthe terms of the layoff or redundancy plan. To be considered a “Layoff” under this Program, a Termination must also beconsidered a Separation from Service.
• Participating Company includes Phillips 66 and its 100% owned subsidiaries, including both those directly owned and thoseowned through subsidiaries, whose participation has been approved by the Authorized Party.
• Participating Employee shall include Eligible Employee receiving an Award under this Program. Being a ParticipatingEmployee does not guarantee a distribution.
• Plan Administrator means the Phillips 66 Employee internally responsible for the administration of Programs.• Release of Liability is a form provided to an Employee upon Layoff. Unless the Participating Employee executes and does
not revoke the Release of Liability, the Participating Employee forfeits all Awards.• Restricted Stock Unit means a unit equal to one Share that is subject to forfeiture provisions or that has certain restrictions
attached to the ownership thereof. Restricted Stock Units do not have any voting rights or other rights generally associatedwith Shares, and are merely an obligation of the Company to register stock in accordance with the terms and conditionsapplicable to the Restricted Stock Units.
2
• Retirement means Termination at age 55 or older with a minimum of 5 years of service with a Participating Company;provided, however, that with regard to an Employee not on the United States payroll, the Authorized Party may approve theuse of a different definition. Service is defined by the policies of the Participating Company.
• Salary Grade means a classification level for Employees under the practices of the Participating Company.• Senior Officer means all officers of the Company who report directly to the CEO, and all other officers of the Company who
are a Senior Vice President and above, or who are reporting officers under Section 16 of the Securities Exchange Act of1934.
• Separation from Service means “separation from service” as that term is used in section 409A of the Internal Revenue Code.• Shares means shares of PSX common stock.• Termination means cessation of employment with the Participating Companies, determined in accordance with the policies
and practices of the Participating Company for whom the Employee was last performing services.• Termination Date is defined as the first date an Employee is no longer employed by and performing services for a
Participating Company.
I. GENERAL CONDITIONS1. The Committee, or to the extent authorized by the Committee, the CEO, or another designated individual or committee, shall
have the right to terminate, suspend, withdraw, amend, or modify the Program in whole or in part at any time. The CEO shallreview and approve this document and may amend it as necessary.
2. Awards are subject to forfeiture or recoupment, in whole or in part, under applicable law, including the Sarbanes-Oxley Act andthe Dodd-Frank Act. Awards are also subject to forfeiture or recoupment in the event a Participating Employee’s negligence ormisconduct results in materially misstated financial or other data, as determined by the Human Resources & CompensationCommittee and the Audit & Finance Committee of the Board. If the Authorized Party determines that, subsequent to the receiptof any Award, the Participating Employee has engaged or is engaging in any activity which, in the sole judgment of theAuthorized Party, is or may be detrimental to the Participating Company, the Authorized Party may cancel all or part of any orall Awards to that Participating Employee.
3. Upon any change in the outstanding stock of the Company by reason of any stock dividend, stock split, reverse stock split,recapitalization, reclassification, or other similar changes, the Committee shall make corresponding adjustments, as appropriate.
4. In addition to the terms and conditions described, Awards are subject to all other applicable provisions of the Plan. The decisionsof the Committee with respect to questions arising as to the interpretation of the Plan or the Award Agreement and as to findingsof fact shall be final, conclusive, and binding.
5. No provision of this document shall confer any right upon the Employee to continue employment with any ParticipatingCompany.
3
6. The Award Agreement shall be governed by, construed, and enforced in accordance with the laws of the State of Delaware.
7. Without the consent of the Employee, the Award Agreement may be amended or supplemented (i) to cure any ambiguity or tocorrect or supplement any provision which may be defective or inconsistent with any other provision, or (ii) to add to thecovenants and agreements of the Company for the benefit of an Employee or to add to the rights of an Employee or to surrenderany right or power reserved to or conferred upon the Company in the Award Agreement, provided, in each case, that suchchanges or corrections shall not adversely affect the rights of the Employee with respect to the grant of an Award evidencedwithout the Employee’s consent, or (iii) to make such other changes as the Company, upon advice of counsel, determines arenecessary or advisable because of the adoption or promulgation of, or change in the interpretation of, any law or governmentalrule or regulation, including any applicable federal or state securities or tax laws.
II. PARTICIPATIONThe Authorized Party makes the determination of whom to provide Awards. In general, employees that are exempt from overtimeare eligible, provided they are in an eligible salary grade and do not participate in certain STI programs which state that participationin the STI program precludes their ability to receive an Award under this Program. It is not expected that the following will beconsidered eligible for an Award: members of collective bargaining units or works councils; temporary, inactive (unless on anapproved leave), or intermittent Employees; or independent contractors, employees of third parties providing services to theCompany or its subsidiaries, and consultants.
III. DETERMINATION OF AWARDThe Award shall be held in escrow by the Company until the lapsing of restrictions placed upon the Restricted Stock Units.Generally, restrictions shall lapse on the third anniversary of the Grant Date. However, the Authorized Party may designate anotherterm. Participating Employees shall not have the right to sell, transfer, assign, or otherwise dispose of Restricted Stock Units until theescrow is terminated.
IV. EFFECT OF TERMINATION OF EMPLOYMENTThe following is meant to clarify Award treatment in the event of various Terminations for Participating Employees with Awards. Inall instances below except Layoff, Fair Market Value is calculated as of Termination Date.
1. Death. If a Participating Employee dies while in the employ of a Participating Company, the Participating Employee’s rights toany Award will pass to the beneficiary on file with the third-party administrator, or in the absence of a designated beneficiary, tothe executor or administrator of the estate of the Participating Employee. However, the Award will be subject to the terms andconditions that applied to the Participating Employee before their death. Rights cannot be assigned or transferred other than bywill or the laws of descent and
4
distribution. No transfer of an Award by the Participating Employee by will or by the laws of descent and distribution shall beeffective to bind the Company unless the Company shall have been furnished with written notice thereof and a copy of the willand any other evidence as the Company may deem necessary to establish the validity of the transfer and the acceptance by thetransferee or transferees of the terms and conditions of the Award. In the event that a beneficiary designation conflicts with anassignment by will or under the laws of descent and distribution, the beneficiary designation will prevail.
2. Disability. If a Participating Employee terminates employment by reason of Disability and has Awards with restrictions, theParticipating Employee shall retain all rights provided by the Award at the time of Termination.
3. Layoff. The following details how Awards with restrictions are handled when a Participating Employee Terminates by reason ofLayoff:• If the Participating Employee’s employment with a Participating Company is terminated by reason of Layoff prior to a date
six months from Grant Date, the Award shall be canceled and all rights thereunder shall cease.• If the Participating Employee’s employment with a Participating Company is terminated by reason of Layoff on or after six
months from Grant Date, prior to a date one year from the Grant Date, and the Participating Employee completes the requiredRelease of Liability, then the Participating Employee shall retain a prorated portion of the Award. The percent of the Awardto be retained will be computed by multiplying the original number of Shares granted by a percentage. The calculation shallbe rounded down to the nearest whole share. If a Participating Employee is terminated by reason of Layoff, but meets thedefinition of Retirement, Retirement disposition prevails.
• If the Participating Employee’s employment with a Participating Company is terminated by reason of Layoff on or after oneyear from Grant Date and the Participating Employee completes the required Release of Liability, then the ParticipatingEmployee shall retain all rights provided by the Award at the time of the Termination.
• In the case of Layoff, if a Participating Employee is eligible to retain an Award, the Fair Market Value will be determined asof:
◦ For US employees, the eighth day following the signed date of the Release of Liability.◦ For UK, Canada, Singapore, and Austria employees, Termination Date.
4. Retirement. The following details how Awards with restrictions are handled when a Participating Employee Terminates byreason of Retirement:• If the Participating Employee’s employment with a Participating Company is terminated by reason of Retirement prior to a
date six months from Grant Date, the Award shall be canceled and all rights thereunder shall cease.• If the Participating Employee’s employment with a Participating Company is terminated by reason of Retirement on or after
a date six months from Grant Date, the Participating Employee shall retain all rights provided by the Award at the time of theTermination.
5. If the Participating Employee Terminates for any reason other than death, Disability, Layoff, or Retirement, the Award shall becanceled and all rights thereunder shall cease; however, the
5
Authorized Party may, in its sole discretion, determine that all or any portion of the Award shall not be cancelled due toTermination.
6. Leaves. Whether any leave of absence shall constitute Termination for the purposes of any Award granted under these Programsshall be determined by the Plan Administrator in each case in accordance with applicable law and by application of the policiesand procedures adopted by the Company in relation to such leave of absence.
7. Divestiture, Outsourcing or Move to Joint Venture. If, after the date the Award is granted, a Participating Employee ceases to beemployed by a Participating Company as a result of (a) the outsourcing of a function, (b) the sale or transfer of all or a portion ofthe equity interest of the Participating Company (removing it from the controlled group of companies of which the Company is apart), (c) the sale of all or substantially all of the assets of the Participating Company to another employer outside of thecontrolled group of corporations (whether the Participating Employee is offered employment or accepts employment with theother employer), (d) the Termination of the Participating Employee by a Participating Company followed by employment withina reasonable time with a company or other entity in which the Company owns, directly or indirectly, at least a 50% interest, or(e) any other sale of assets determined by the Authorized Party to be considered a divestiture under this Program, the Award shallbe forfeited unless (i) the Authorized Party may, in its or his sole discretion, determine that all or a portion of any Award shallnot be canceled or (ii) the Award is retained as a result of another provision of this Program.
8. Transfer. Transfer of employment between Participating Companies shall not constitute Termination for the purpose of anyAward granted under the Program.
9. Change in Control. If a Change in Control occurs and the Participating Employee is Terminated, all restrictions applicable to anyAward shall lapse and the Shares will become immediately vested.
V. DISTRIBUTIONS1. Restricted Stock Units shall lapse on the third anniversary date of grant.
2. Restricted Stock Units granted to Participating Employees who are on the US/UK Payroll and are resident in the US/UK on theGrant Date shall be paid a Dividend Equivalent at the same times as an ordinary cash dividend is determined by the Company tobe paid, generally quarterly. Current tax law dictates these payments are taxable as compensation (ordinary income) in the yearthey are distributed. This payment will be paid through the standard payroll process and cannot be reinvested.
3. Restricted Stock Units granted to Participating Employees who are either not on the US/UK Payroll or are not resident in theUS/UK on the Grant Date, shall not accrue a Dividend Equivalent. The value of their Award is increased to reflect no payment ofa Dividend Equivalent.
6
4. Upon the lapsing of restrictions, the number of Shares registered to the Participating Employee will be equal to the RestrictedStock Units for which the restrictions have lapsed. Shares shall be registered no later than 2 ½ months after the end of thecalendar year in which the restrictions lapse.
5. If the Plan Administrator determines that registering the Shares is prohibited by law, regulation, or decree, or where the cost oflegal compliance to issue the Shares would be unreasonably expensive, the Fair Market Value of the Shares shall be paid in cashinstead of registering Shares. Cash payouts are only permitted where legal restrictions exist. Cash payout shall be made no laterthan 2 ½ months after the end of the calendar year in which the restrictions lapse.
6. No Award or distribution that is considered income pursuant to Section 409A of the Internal Revenue Code, shall be settled orpaid prior to six months after the Employee’s Termination from the Company and its subsidiaries (or, if earlier, the date ofdeath).
7. If applicable, court ordered garnishments or tax levies will be withheld.
8. The Participating Employee’s distribution, and any required taxation, will be communicated to the Participating Employee attime of the distribution.
VI. TAXATION OF DISTRIBUTIONS1. Distribution of a Participating Employee’s Award will reflect required tax withholding or expatriate hypothetical tax obligation.
The Participating Employee is responsible for required withholding taxes associated with a distribution.
2. If six months following Grant Date a Participating Employee is determined to be eligible for Retirement, the Award is consideredvested for FICA purposes because there is no longer a substantial risk of forfeiture. At this time, FICA tax and income tax relatedto the FICA withholding, will be paid by withholding Shares from the Award. Later, on the third anniversary of Grant Date, theremaining Award will lapse. At this time, the company will withhold Shares to cover the federal tax (and state and local tax,where applicable).
3. The Company will generally withhold Shares for taxes to meet tax obligations. The value of the Shares withheld for this purposeshall not exceed the minimum withholding amount required by applicable laws and regulations.
4. If the Participating Employee spent time as an expatriate outside of their home country the Participating Employee will be taxequalized, with the intent that the Participating Employee receives no adverse tax consequences for their expatriate service,which could be different depending upon each country. The Participating Employee’s distribution will reflect any expatriatehypothetical tax obligation.
5. The Company may take appropriate measures to ensure that corrective actions related to withholding tax obligations arecompleted in a timely manner. The Plan Administrator will
7
take steps, as it deems necessary or desirable for the withholding of any taxes that are required by laws or regulations of anygovernmental authority in connection with any distribution.
6. The Authorized Party may remove Award restrictions to provide Shares to satisfy withholding tax obligation.
8
Exhibit 10.35
PHILLIPS 66Terms & Conditions
ForPerformance Share Program - Performance Period –[ • ]
This document applies to Awards made under the Performance Share Program (“Program”) for the Performance Period ([•])provided under the 2013 Omnibus Stock and Performance Incentive Plan of Phillips 66 (“Plan”) or any successor to the Plan.Phillips 66 reserves the right to discontinue or change this Program at any time.
Capitalized terms shall have the meaning designated in this Program. Capitalized terms not defined in this Program shall have themeaning set forth in the Plan.
• Authorized Party means the person who is authorized to approve an Award, exercise discretion, or take action under theProgram pursuant to the Plan. With regard to the CEO and Senior Officers, the Committee is the Authorized Party. Withregard to other Employees, the CEO is the Authorized Party, although the Committee may act concurrently as the AuthorizedParty.
• Award means cash, stock option, performance share unit, restricted stock unit or any other form of equity or cash pursuant tothe Program’s applicable terms, conditions and limitations as the Authorized Party may provide in order to fulfill theobjectives of the Program.
• Award Agreement means any written or electronic agreement setting forth, or incorporating by reference, the terms,conditions, and limitations applicable to an Award to a Participating Employee. An Award Agreement may be unilaterallyissued by the Company and need not be executed or countersigned by the Participating Employee.
• Board means the Board of Directors of Phillips 66.• Cash Denominated Distribution means a full distribution made from the Program, paid to the Participating Employee in cash
.• CEO means the Chief Executive Officer of Phillips 66. Where applicable, CEO also refers to the person holding that title but
acting as a Special Equity Award Committee pursuant to the authority granted by the Board.• Committee means the Human Resources and Compensation Committee of the Board of Directors of the Company, or any
successor committee to it.• Company means Phillips 66, a Delaware Corporation.• Disability means a disability for which the Employee in question has been determined to be entitled to either, (i) benefits
under the applicable long-term disability plan of the Participating Company or (ii) disability benefits under the SocialSecurity Act. In the
absence of any determination, the Authorized Party may make a determination that the Employee has a Disability.• Distribution means the value that is given to the Participating Employee after approval by the Committee. In most cases,
Distributions will be made in the form of cash, however the Committee reserves the right to make Distributions in the form ofgrants of share-based Awards, or any other form the Committee determines appropriate.
• Eligible Employee shall include Employees that meet the participation requirements for this Program. Being an EligibleEmployee does not guarantee an Award.
• Employee shall include employees of Phillips 66 and its subsidiaries, as designated in the records of the Company and itssubsidiaries.
• Fair Market Value means, as of a particular date, the mean between the highest and lowest sales price per share on theconsolidated transaction reporting system for the principal national securities exchange on which shares are listed on that daterounded to 5 decimals, or, if there is no sale reported on that date, on the next preceding date on which a sale is reported or, atthe discretion of the Committee, the price prevailing on the exchange at a designated time.
• Layoff means an applicable Termination due to layoff under the Phillips 66 Severance Pay Plan, Phillips 66 ExecutiveSeverance Plan, or the Phillips 66 Key Employee Change in Control Severance Plan, or layoff or redundancy under anysimilar layoff or redundancy plan which the Participating Company may adopt from time to time. If all or any portion of thebenefits under the redundancy or layoff plan are contingent on the Employee’s signing a Release of Liability or covenant notto compete or both, the Termination shall not be considered as a “Layoff” for purposes of the Program unless the Employeeexecutes and does not revoke a Release of Liability, a covenant not to compete, or both, acceptable to the Company, underthe terms of the layoff or redundancy plan.
• Participating Company includes Phillips 66 and its 100% owned subsidiaries, including both those directly owned and thoseowned through subsidiaries, whose participation has been approved by the Authorized Party.
• Participating Employee shall include Eligible Employees receiving a Share Denominated Target. Being a ParticipatingEmployee does not guarantee a Distribution.
• Performance Measures means the performance criteria that will be used to value the performance of the Company at theconclusion of the Performance Period, prior to the Distribution.
• Performance Period means January 1, [•] through December 31, [•].• Plan Administrator means the Phillips 66 Employee, internally responsible for administration of Programs.• Release of Liability is a form provided to an Employee upon Layoff. Unless the Participating Employee executes and does
not revoke the Release of Liability, the Participating Employee forfeits all Awards.• Retirement means Termination at age 55 or older with a minimum of 5 years of service with a Participating Company;
provided, however, that with regard to an Employee not on the United States payroll, the Authorized Party may approve theuse of a different definition. Service is defined by the policies of the Participating Company.
2
• Salary means the annual base pay in effect on December 31st of the year preceding the beginning of the Performance Periodin which the Eligible Employee becomes a Participating Employee.
• Salary Grade means a classification level for Employees under the practices of the Participating Company.• Senior Officer means all officers of the Company who report directly to the CEO, and all other officers of the Company who
are a Senior Vice President and above, or who are reporting officers under Section 16 of the Securities Exchange Act of1934.
• Share Denominated Distribution , expressed as a number of shares, means the value of a Share Denominated Target if a fulldistribution was made from the Program and granted to the Participating Employee in equity. At the time of Distribution, theCommittee determines if the Share Denominated Distribution will be granted to the Participating Employee or if it will beconverted to a Cash Denominated Distribution.
• Share Denominated Target means the value calculated for a Participating Employee, denominated in shares. ShareDenominated Targets are evaluated based on Performance Measures at the conclusion of the Performance Period and thendistributed to the Participating Employee. Share Denominated Targets are rounded to the nearest whole share.
• Termination means cessation of employment with the Participating Companies, determined in accordance with the policiesand practices of the Participating Company for whom the Employee was last performing services.
I. GENERAL CONDITIONS1. The Committee, or to the extent authorized by the Committee, the CEO, or another designated individual or committee, shall
have the right to terminate, suspend, withdraw, amend, or modify the Program in whole or in part at any time. The CEO shallreview and approve this document and may amend it as necessary.
2. Awards are subject to forfeiture or recoupment, in whole or in part, under applicable law, including the Sarbanes-Oxley Act andthe Dodd-Frank Act. Awards are also subject to forfeiture or recoupment in the event a Participating Employee’s negligence ormisconduct results in materially misstated financial or other data, as determined by the Human Resources & CompensationCommittee and the Audit & Finance Committee of the Board. If the Authorized Party determines that, subsequent to the receiptof any Award, the Participating Employee has engaged or is engaging in any activity which, in the sole judgment of theAuthorized Party, is or may be detrimental to the Participating Company, the Authorized Party may cancel all or part of any orall Awards to that Participating Employee.
3. Upon any change in the outstanding stock of the Company by reason of any stock dividend, stock split, reverse stock split,recapitalization, reclassification, or other similar changes, the Committee shall make corresponding adjustments, as appropriate.
4. In addition to the terms and conditions described, Awards are subject to all other applicable provisions of the Plan. The decisionsof the Committee with respect to questions arising as
3
to the interpretation of the Plan or the Award Agreement and as to findings of fact shall be final, conclusive, and binding.
5. No provision of this document shall confer any right upon the Employee to continue employment with any ParticipatingCompany.
6. The Award Agreement shall be governed by, construed, and enforced in accordance with the laws of the State of Delaware.
7. Without the consent of the Employee, the Award Agreement may be amended or supplemented (i) to cure any ambiguity or tocorrect or supplement any provision which may be defective or inconsistent with any other provision, or (ii) to add to thecovenants and agreements of the Company for the benefit of an Employee or to add to the rights of an Employee or to surrenderany right or power reserved to or conferred upon the Company in the Award Agreement, provided, in each case, that suchchanges or corrections shall not adversely affect the rights of the Employee with respect to the grant of an Award evidencedwithout the Employee’s consent, or (iii) to make such other changes as the Company, upon advice of counsel, determines arenecessary or advisable because of the adoption or promulgation of, or change in the interpretation of, any law or governmentalrule or regulation, including any applicable federal or state securities or tax laws.
II. DETERMINATION OF SHARE DENOMINATED TARGETSShare Denominated Targets for Participating Employees under the Program are generally made annually at the beginning of thePerformance Period. Share Denominated Targets may, however, be provided to Participating Employees at other times during thePerformance Period. Salary, Salary Grade, Phillips 66 stock price, the length of time the Employee will be a Participating Employeein the Performance Period, and in some cases, historical performance are taken into consideration when determining the ShareDenominated Target. The Authorized Party shall have the authority to apply discretion as appropriate to increase or decrease theShare Denominated Target. Participating Employees that have a Salary Grade change during the Performance Period may have theirShare Denominated Target adjusted to reflect their change in responsibility.
III. EFFECT OF TERMINATION OF EMPLOYMENTThe following is meant to clarify what happens in the event of various Terminations for Participating Employees with a ShareDenominated Target. This action has no impact on the timing of the Distribution. Generally, Distributions will only be made at theconclusion of the Performance Period.
1. Death. If a Participating Employee dies during the Performance Period, the Share Denominated Target under the Program shallnot be reduced, regardless of the number of months during the Performance Period the Eligible Employee was a ParticipatingEmployee. The Participating Employee’s rights to any Share Denominated Target will pass to the designated beneficiary on filewith the third-party administrator or in the absence of a designated beneficiary, to the executor or administrator of the estate ofthe Participating
4
Employee. However, the Award will be subject to the terms and conditions that applied to the Participating Employee beforetheir death. No transfer of a Share Denominated Target by the Participating Employee by will or by the laws of descent anddistribution shall be effective to bind the Company unless the Company shall have been furnished with written notice thereof anda copy of the will and any other evidence as the Company may deem necessary to establish the validity of the transfer and theacceptance by the transferee or transferees of the terms and conditions of the Share Denominated Target. In the event that abeneficiary designation conflicts with an assignment by will or under the laws of descent and distribution, the beneficiarydesignation will prevail.
2. Disability. If a Participating Employee terminates employment by reason of Disability during the Performance Period and has aShare Denominated Target under the Program, the Share Denominated Target shall not be reduced, regardless of the number ofmonths during the Performance Period the Eligible Employee was a Participating Employee. The Participating Employee shallretain all rights provided by the Award at the time of Termination.
3. Retirement or Layoff, at least 12 months. Provided the Participating Employee has completed at least 12 months of thePerformance Period, if Termination occurs prior to the conclusion of the Performance Period as a result of Retirement or Layoff,the Participating Employee’s Share Denominated Target shall be prorated by a fraction, the numerator of which is the number offull calendar months of participation during the Performance Period completed prior to the applicable event and the denominatoris the number of calendar months in the Performance Period.
4. Retirement or Layoff, less than 12 months. Provided the Participating Employee has not completed at least 12 months of thePerformance Period, if Termination occurs prior to the conclusion of the Performance Period as a result of Retirement or Layoff,the Participating Employee’s Share Denominated Target shall be reduced to zero.
5. If the Participating Employee Terminates for any reason other than death, Disability, Layoff, or Retirement, the ShareDenominated Target shall be canceled and all rights thereunder shall cease.
6. Leaves. Whether any leave of absence shall constitute Termination for the purposes of any Share Denominated Target grantedunder these Programs shall be determined by the Plan Administrator. The determination will be made in each case in accordancewith applicable law and by application of the policies and procedures adopted by the Company in relation to such leave ofabsence.
7. Divestiture, Outsourcing or Move to Joint Venture. If, after the date a Share Denominated Target is granted, a ParticipatingEmployee ceases to be employed by a Participating Company as a result of (a) the outsourcing of a function, (b) the sale ortransfer of all or a portion of the equity interest of the Participating Company (removing it from the controlled group ofcompanies of which the Company is a part), (c) the sale of all or substantially all of the assets of the Participating Company toanother employer outside of the controlled group
5
of corporations (whether the Participating Employee is offered employment or accepts employment with the other employer), (d)the Termination of the Participating Employee by a Participating Company followed by employment within a reasonable timewith a company or other entity in which the Company owns, directly or indirectly, at least a 50% interest, or (e) any other sale ofassets determined by the Authorized Party to be considered a divestiture under this Program, the Share Denominated Target shallbe forfeited unless the Share Denominated Target is retained as a result of another provision of this Program.
8. Transfer. Transfer of employment between Participating Companies shall not constitute Termination for the purpose of thisProgram.
9. Change in Control. If a Change in Control occurs the Authorized Party has discretion to determine the effect on ShareDenominated Targets.
IV. PERFORMANCE EVALUATION OF SHARE DENOMINATED TARGETAt the completion of the Performance Period, the Committee will review the results achieved under the Performance Measuresapproved by the Committee and, in its sole judgment, adjust the Share Denominated Target by a percentage deemed appropriate, atwhich point the Share Denominated Target will be known as the Share Denominated Distribution. Relative Performance Measureswill be compared to a peer group of companies as determined by the Committee.
The Committee may change the weighting to be applied to Performance Measures at any time during the Performance Period. Inaddition, the Committee may, in its sole discretion, add or delete Performance Measures at the beginning or during the PerformancePeriod. In so doing, the Committee shall specify the weighting to be applied to any additional Performance Measures included in theProgram.
V. DISTRIBUTIONSIt is anticipated that Distributions made from the Program will be made as Cash Denominated Distributions. However, theCommittee retains the authority to make Distributions in the form of grants of share-based Awards, or any other form the Committeedetermines appropriate.
1. Cash Denominated Distributions provided under this Program will be settled in the form of cash, to be paid out as soon asadministratively feasible after the date approved by the Authorized Party, provided that the cash payment be made no later than2½ months after the end of the calendar year in which the Authorized Party has approved the Cash Denominated Distribution.• The value of a Cash Denominated Distribution shall be determined by multiplying the Share Denominated Distribution by an
average of the Fair Market Value of Phillips 66 stock for the last 20 trading days of the Performance Period.
2. If applicable, court ordered garnishments or tax levies will be withheld.
6
3. The Participating Employee’s Distribution, and any required taxation, will be communicated to the Participating Employee attime of the Distribution.
VI. TAXATION OF DISTRIBUTIONS1. In all cases the Participating Employee will be responsible to pay all required withholding taxes associated with a Distribution.
This withholding tax obligation includes, but is not limited to, federal, state, and local taxes, including applicable non-U.S. taxessuch as U.K. PAYE.
2. The Company may take appropriate measures to ensure that corrective actions related to withholding tax obligations arecompleted in a timely manner. The Plan Administrator will take the steps, as it deems necessary or desirable for the withholdingof any taxes that are required by laws or regulations of any governmental authority in connection with any Distribution.
3. If the Participating Employee spent time as an expatriate outside of their home country the Participating Employee will be taxequalized, with the intent that the Participating Employee receives no adverse tax consequences for their expatriate service,which could be different depending upon each country. The Participating Employee’s Distribution will reflect any expatriatehypothetical tax obligation.
7
Exhibit 21
SUBSIDIARY LISTING OF PHILLIPS 66At December 31, 2018
Company NameIncorporation
LocationAsamera Oil (US) Inc. MontanaC.S. Land, Inc. CaliforniaDanube Limited BermudaDouglas Oil Company of California CaliforniaGray Oak Holdings LLC DelawareJET Energy Trading GmbH GermanyJET Petrol Limited Northern IrelandJET Petroleum Limited EnglandJET Tankstellen Austria GmbH AustriaJET Tankstellen Deutschland GmbH (CPGG) GermanyKansas City Retail and Convenience LLC DelawareKayo Oil Company DelawareKHQ LLC DelawareLinden Urban Renewal Limited Partnership New JerseyMerey Sweeny LLC DelawareNJB Enterprise Limited EnglandNJB Services Limited EnglandOK CNG 5, LLC OklahomaPhillips 66 Alliance Dock LLC DelawarePhillips 66 Asia Ltd. BermudaPhillips 66 Asia Pacific Investments Ltd. BermudaPhillips 66 Aviation LLC DelawarePhillips 66 Canada Ltd. AlbertaPhillips 66 Carrier LLC DelawarePhillips 66 Central Europe Inc. DelawarePhillips 66 Communications Inc. DelawarePhillips 66 Company DelawarePhillips 66 Continental Holding GmbH GermanyPhillips 66 Crude Condensate Pipeline A LLC DelawarePhillips 66 Crude Condensate Pipeline B LLC DelawarePhillips 66 Crude Condensate Pipeline LLC DelawarePhillips 66 CS Limited EnglandPhillips 66 DAPL Holdings LLC DelawarePhillips 66 ETCO Holdings LLC DelawarePhillips 66 European Power Limited EnglandPhillips 66 Export Terminal Alpha LLC DelawarePhillips 66 Export Terminal Bravo LLC DelawarePhillips 66 Export Terminal Charlie LLC DelawarePhillips 66 Export Terminal Delta LLC DelawarePhillips 66 Export Terminal LLC DelawarePhillips 66 Funding Ltd. Cayman
1
Exhibit 21
Phillips 66 GmbH SwitzerlandPhillips 66 Gulf Coast Pipeline LLC DelawarePhillips 66 Gulf Coast Properties Alpha LLC DelawarePhillips 66 Gulf Coast Properties Bravo LLC DelawarePhillips 66 Gulf Coast Properties LLC DelawarePhillips 66 International Holdings Company DelawarePhillips 66 International Inc. DelawarePhillips 66 International Investments Ltd. CaymanPhillips 66 International Trading Pte. Ltd. SingaporePhillips 66 Ireland Pension Trust Limited IrelandPhillips 66 LCR Isomerization LLC DelawarePhillips 66 Limited EnglandPhillips 66 Partners Finance Corporation DelawarePhillips 66 Partners GP LLC DelawarePhillips 66 Partners Holdings LLC DelawarePhillips 66 Partners LP DelawarePhillips 66 Payment Systems LLC DelawarePhillips 66 Pension Plan Trustee Limited EnglandPhillips 66 Pipeline LLC DelawarePhillips 66 Polypropylene Canada Inc. DelawarePhillips 66 Power Holdings Ltd. CaymanPhillips 66 Project Development Inc. DelawarePhillips 66 Sand Hills LLC DelawarePhillips 66 Southern Hills LLC DelawarePhillips 66 Spectrum Corporation DelawarePhillips 66 Stillwater Retail Corporation DelawarePhillips 66 Sweeny Crude Export LLC DelawarePhillips 66 Sweeny Frac 2 A LLC DelawarePhillips 66 Sweeny Frac 2 B LLC DelawarePhillips 66 Sweeny Frac 2 C LLC DelawarePhillips 66 Sweeny Frac 2 LLC DelawarePhillips 66 Sweeny Frac LLC DelawarePhillips 66 Sweeny-Freeport 2 Pipeline LLC DelawarePhillips 66 Sweeny-Freeport A LLC DelawarePhillips 66 Sweeny-Freeport B LLC DelawarePhillips 66 Sweeny-Freeport LLC DelawarePhillips 66 Trading Limited EnglandPhillips 66 Treasury Limited EnglandPhillips 66 TS Limited EnglandPhillips 66 UK Development Limited EnglandPhillips 66 UK Funding Limited EnglandPhillips 66 UK Holdings Limited EnglandPhillips 66 WRB Partner LLC DelawarePhillips Chemical Holdings LLC DelawarePhillips Gas Company LLC DelawarePhillips Gas Company Shareholder, Inc. DelawarePhillips Gas Pipeline Company Delaware
2
Exhibit 21
Phillips Utility Gas Corporation DelawarePioneer Investments Corp. DelawarePioneer Pipe Line Company DelawareQingdao Phillips 66 Energy Co. Ltd. ChinaR.A.Z. Properties, Inc. CaliforniaRadius Insurance Company CaymanSalt Lake Terminal Company DelawareSeagas Pipeline Company DelawareSentinel Transportation, LLC DelawareSHC Insurance Company TexasSpirit Insurance Company VermontSweeny Cogeneration LLC DelawareWesTTex 66 Pipeline LLC Delaware
Certain subsidiaries are not listed since, considered in the aggregate as a single subsidiary, they would not constitute a significant subsidiary atDecember 31, 2018 .
3
Exhibit 23.1
CONSENT OF INDEPENDENT REGISTERED PUBLIC ACCOUNTING FIRM
We consent to the incorporation by reference in the following Registration Statements:
(1) Registration Statement (Form S-8 No. 333-181080), as amended, pertaining to the Phillips 66 Savings Plan,
(2) Registration Statement (Form S-8 No. 333-188564) pertaining to the 2013 Omnibus Stock and Performance Incentive Plan of Phillips 66, thePhillips 66 U.K. Share Incentive Plan, and the Phillips 66 Ireland Share Participation Plan, and
(3) Registration Statement (Form S-3 No. 333-181079) of Phillips 66;
of our reports dated February 22, 2019 , with respect to the consolidated financial statements of Phillips 66 and the effectiveness of internal control overfinancial reporting of Phillips 66 included in this Annual Report (Form 10-K) of Phillips 66 for the year ended December 31, 2018 .
/s/ Ernst & Young LLP
Houston, TexasFebruary 22, 2019
Exhibit 31.1
CERTIFICATION
I, Greg C. Garland, certify that:
1. I have reviewed this Annual Report on Form 10-K of Phillips 66;
2. Based on my knowledge, this report does not contain any untrue statement of a material fact or omit to state a material fact necessary to make thestatements made, in light of the circumstances under which such statements were made, not misleading with respect to the period covered by thisreport;
3. Based on my knowledge, the financial statements, and other financial information included in this report, fairly present in all material respects thefinancial condition, results of operations and cash flows of the registrant as of, and for, the periods presented in this report;
4. The registrant's other certifying officer and I are responsible for establishing and maintaining disclosure controls and procedures (as defined inExchange Act Rules 13a-15(e) and 15d-15(e)) and internal control over financial reporting (as defined in Exchange Act Rules 13a-15(f) and 15d-15(f)) for the registrant and have:
(a) Designed such disclosure controls and procedures, or caused such disclosure controls and procedures to be designed under our supervision, toensure that material information relating to the registrant, including its consolidated subsidiaries, is made known to us by others within thoseentities, particularly during the period in which this report is being prepared;
(b) Designed such internal control over financial reporting, or caused such internal control over financial reporting to be designed under oursupervision, to provide reasonable assurance regarding the reliability of financial reporting and the preparation of financial statements forexternal purposes in accordance with generally accepted accounting principles;
(c) Evaluated the effectiveness of the registrant's disclosure controls and procedures and presented in this report our conclusions about theeffectiveness of the disclosure controls and procedures, as of the end of the period covered by this report based on such evaluation; and
(d) Disclosed in this report any change in the registrant's internal control over financial reporting that occurred during the registrant's most recentfiscal quarter (the registrant's fourth fiscal quarter in the case of an annual report) that has materially affected, or is reasonably likely tomaterially affect, the registrant's internal control over financial reporting; and
5. The registrant's other certifying officer and I have disclosed, based on our most recent evaluation of internal control over financial reporting, to theregistrant's auditors and the audit committee of the registrant's board of directors (or persons performing the equivalent functions):
(a) All significant deficiencies and material weaknesses in the design or operation of internal control over financial reporting which arereasonably likely to adversely affect the registrant's ability to record, process, summarize and report financial information; and
(b) Any fraud, whether or not material, that involves management or other employees who have a significant role in the registrant's internalcontrol over financial reporting.
Date: February 22, 2019
/s/ Greg C. Garland Greg C. Garland
Chairman of the Board of Directors and
Chief Executive Officer
Exhibit 31.2
CERTIFICATION
I, Kevin J. Mitchell, certify that:
1. I have reviewed this Annual Report on Form 10-K of Phillips 66;
2. Based on my knowledge, this report does not contain any untrue statement of a material fact or omit to state a material fact necessary to make thestatements made, in light of the circumstances under which such statements were made, not misleading with respect to the period covered by thisreport;
3. Based on my knowledge, the financial statements, and other financial information included in this report, fairly present in all material respects thefinancial condition, results of operations and cash flows of the registrant as of, and for, the periods presented in this report;
4. The registrant's other certifying officer and I are responsible for establishing and maintaining disclosure controls and procedures (as defined inExchange Act Rules 13a-15(e) and 15d-15(e)) and internal control over financial reporting (as defined in Exchange Act Rules 13a-15(f) and 15d-15(f)) for the registrant and have:
(a) Designed such disclosure controls and procedures, or caused such disclosure controls and procedures to be designed under our supervision, toensure that material information relating to the registrant, including its consolidated subsidiaries, is made known to us by others within thoseentities, particularly during the period in which this report is being prepared;
(b) Designed such internal control over financial reporting, or caused such internal control over financial reporting to be designed under oursupervision, to provide reasonable assurance regarding the reliability of financial reporting and the preparation of financial statements forexternal purposes in accordance with generally accepted accounting principles;
(c) Evaluated the effectiveness of the registrant's disclosure controls and procedures and presented in this report our conclusions about theeffectiveness of the disclosure controls and procedures, as of the end of the period covered by this report based on such evaluation; and
(d) Disclosed in this report any change in the registrant's internal control over financial reporting that occurred during the registrant's most recentfiscal quarter (the registrant's fourth fiscal quarter in the case of an annual report) that has materially affected, or is reasonably likely tomaterially affect, the registrant's internal control over financial reporting; and
5. The registrant's other certifying officer and I have disclosed, based on our most recent evaluation of internal control over financial reporting, to theregistrant's auditors and the audit committee of the registrant's board of directors (or persons performing the equivalent functions):
(a) All significant deficiencies and material weaknesses in the design or operation of internal control over financial reporting which arereasonably likely to adversely affect the registrant's ability to record, process, summarize and report financial information; and
(b) Any fraud, whether or not material, that involves management or other employees who have a significant role in the registrant's internalcontrol over financial reporting.
Date: February 22, 2019
/s/ Kevin J. Mitchell Kevin J. Mitchell
Executive Vice President, Finance
and Chief Financial Officer
Exhibit 32
CERTIFICATIONS PURSUANT TO 18 U.S.C. SECTION 1350
In connection with the Annual Report of Phillips 66 (the Company) on Form 10-K for the year ended December 31, 2018 , as filed with the U.S.Securities and Exchange Commission on the date hereof (the Report), each of the undersigned hereby certifies, pursuant to 18 U.S.C. Section 1350, asadopted pursuant to Section 906 of the Sarbanes-Oxley Act of 2002, that to their knowledge:
(1) The Report fully complies with the requirements of Sections 13(a) or 15(d) of the Securities Exchange Act of 1934; and
(2) The information contained in the Report fairly presents, in all material respects, the financial condition and results of operations of theCompany.