This is an electronic reprint of the original article. This reprint may differ from the original in pagination and typographic detail. Powered by TCPDF (www.tcpdf.org) This material is protected by copyright and other intellectual property rights, and duplication or sale of all or part of any of the repository collections is not permitted, except that material may be duplicated by you for your research use or educational purposes in electronic or print form. You must obtain permission for any other use. Electronic or print copies may not be offered, whether for sale or otherwise to anyone who is not an authorised user. Phiri, Josphat; Gane, Patrick; Maloney, Thaddeus High-concentration shear-exfoliated colloidal dispersion of surfactant–polymer-stabilized few- layer graphene sheets Published in: Journal of Materials Science DOI: 10.1007/s10853-017-1049-y Published: 04/04/2017 Document Version Peer reviewed version Published under the following license: Unspecified Please cite the original version: Phiri, J., Gane, P., & Maloney, T. (2017). High-concentration shear-exfoliated colloidal dispersion of surfactant–polymer-stabilized few-layer graphene sheets. Journal of Materials Science, 52(13), 8321. https://doi.org/10.1007/s10853-017-1049-y
Transcript
This is an electronic reprint of the original article.This reprint may differ from the original in pagination and typographic detail.
Powered by TCPDF (www.tcpdf.org)
This material is protected by copyright and other intellectual property rights, and duplication or sale of all or part of any of the repository collections is not permitted, except that material may be duplicated by you for your research use or educational purposes in electronic or print form. You must obtain permission for any other use. Electronic or print copies may not be offered, whether for sale or otherwise to anyone who is not an authorised user.
High Concentration Shear Exfoliated Colloidal Dispersion of Surfactant-Polymer Stabilized Few-Layer Graphene Sheets Josphat Phiri1*; Patrick Gane1, 2; Thad C. Maloney1* 1School of Chemical Engineering, Department of Bioproducts and Biosystems, Aalto University, P.O. Box 16300, 00076 Aalto, Finland 2Omya International AG, CH-4665 Oftringen, Switzerland
To exploit the remarkable properties of graphene fully, an efficient large-scale production method is required. Sonication assisted liquid phase exfoliation of graphite, for example, has been extensively used for the production of few-layer graphene sheets, but suffers from low efficiency and high energy consumption, and thus is not viable for large scale production. Here we demonstrate a method that is more efficient and has higher scalability potential than sonication. We show that a few-layer graphene at high concentration of up to 1.1 mg ml-1 can be achieved in aqueous based medium by highly efficient shear exfoliation of graphite in a processing time of just 2 h. The exfoliation process was carried out in a commercially available high shear colloidal mixer fixed with a three stage rotor-stator shear generator for optimum exfoliation with a continuous circulation system. The high efficiency and significant improvement over sonication adopting our method was demonstrated by the fact that the conversion to few-layer graphene sheets produced after just 30 min by shear exfoliation required, in contrast, hundreds of hours by sonication. High concentration defect-free few-layer graphene in aqueous medium, produced at short shearing time, demonstrates that this method has high potential for large-scale production. The produced graphene films exhibit additionally a high electrical conductivity of about 29 000 S m-1.
Graphene is a 2-dimensional material, defined by planar sp2 hybridized carbon atoms, which are arranged in a honey-comb lattice, and has become one of the most studied laminar materials in the last decade or so due to its extraordinary properties. Graphene can be considered as a building block of carbon allotropes; it can be wrapped to form zero-dimension fullerenes, rolled to form one-dimensional carbon nanotubes and stacked to form three-dimensional graphite. The first successful exfoliation of free-standing graphene was achieved by Novoselov et al.[1] in 2004, and this led to the beginning of the so-called graphene revolution that has prompted growing interest from both academia and industry in graphene research. This huge interest is unsurprising considering the material properties exhibited by graphene. Graphene is synonymous with material of superlative functionality. Free-standing single graphene sheets possess an extremely high electron mobility, having values in excess of 200 000 cm2 V-1 s-1 at room temperature [2, 3], which is much greater than in semiconductors or metals [4]. Graphene is also one of the strongest materials known, with a Young’s modulus of 1 100 GPa (~200 times stronger than steel) and fracture strength of about 125 GPa [5]. Graphene has also a theoretical specific surface area [6] of 2 630 m2 g-1, thermal conductivity [7] of 5 000 W m-1 K-1, and excellent gas barrier properties [8]. Due to these properties, graphene has huge potential for application in energy storage devices [9-11], polymer nanocomposites [12-15], sensors [16, 17], solar cells [18], printable electronics [19, 20] and catalysts [21], for example. However, most of these applications require defect-free graphene produced in large quantities.
4
Several different methods exist for graphene production and each presents its own challenges. Micromechanical cleavage [22] is the popular choice for many, not surprising given that it led to the ‘birth’ of graphene. Despite the high quality graphene flakes that can be produced by this method, low yield and process expandability still remain the main drawbacks. Graphene grown on metal substrates, via methods such as epitaxial growth or chemical vapor deposition [23-25], involves not only high energy consumption but also requires subsequent transfer of graphene to other target substrates for a variety of applications, thus limiting the general applicability. Chemical reduction of graphite oxide (GO) [26-29] is one of the widely used methods for the production of graphene and has shown high scalability potential. However, such harsh chemical treatment of graphite introduces hydroxyl or epoxide groups in the basal plane and carbonyl and carboxylic moieties on the edges [30], which in turn disrupt the electronic structure of graphene [28], and makes GO essentially a semiconductor. Furthermore, it is impossible to remove all the defects completely by any known method [31]. Therefore, reduced graphene oxide still retains some defects [29]. Direct exfoliation of graphite was first carried out by Coleman et al. using the liquid phase exfoliation (LPE) method via sonication of graphite in organic solvents [32]. Polymers [33, 34] and surfactants [35-38] have also been used to enhance the exfoliation process and prevent against re-aggregation of the exfoliated sheets in LPE systems. LPE encompasses mainly two different approaches for exfoliation of graphite; cavitation and shear forces in sonication and high shear mixing, respectively. Compared to other methods, LPE is a simple method with high potential for large scale production of graphene. The basic equipment needed for sonication or shear processing of graphite is generally available, and, besides, LPE does not require high temperature or vacuum
5
systems. However, large scale application of sonication assisted LPE of graphite has been hindered due to high energy consumption and low concentration of produced graphene. For example, in the work made by Coleman and coworkers [35], they could only manage to produce a graphene dispersion with a concentration of 0.3 mg ml-1 after 400 h of bath sonication. Moreover, particularly, organic solvents [39] that have been shown to aid exfoliation of graphite to graphene under sonication assisted LPE are required at sufficiently high concentrations to be effective, e.g. N-methyl-pyrrolidone (NMP) [32] and N,N-dimethylformamide (DMF) [40] are not only considered toxic but expensive, making them inappropriate for large scale industrial production. Low energy consumption and easy availability of shear mixers, has meant that shear exfoliation of graphite is increasingly being considered as an alternative to sonication for large scale production of graphene dispersions [41, 42]. Shear mixing is an old technique that has been widely used in colloidal science, mostly for disintegration of agglomerates during dispersion. A few reports have also been shown where shear mixing has been incorporated into delamination of layered materials [43, 44]. However, most of these applications first involve intercalation of 2-dimensional materials with oxidants, sulfate ions etc., which induces swelling of the material followed by shear exfoliation into individual layers. The intercalation step also hinders the potential for large scale graphene production. Recently, it has been shown that shear mixing can be used for direct exfoliation of graphite without any intercalation [41, 45]. However, despite the potential for upscaling, Coleman and coworkers [41] could only manage to produce graphene dispersions with a concentration of up to 0.07 mg ml-1, which is very low and disadvantageous for most applications. It is evident, therefore, that both current sonication and shear-assisted LPE methodologies have limitations when considering them for large scale production of graphene,
6
with the main drawbacks hindering their development being the low concentration of the resulting graphene dispersion and high energy consumption by sonication and environmentally questionable chemical aid consumption by shear-induced exfoliation. Here we demonstrate a simple and effective method based on shear-induced exfoliation for the production of high concentrated few-layer graphene dispersions in aqueous solutions of polymer and surfactant. The exfoliation process is achieved using a commercially available high shear colloidal mixer. Exfoliation and stabilization of few-layer graphene is simultaneously achieved using poly(vinyl pyrrolidone) (PVP) and a surfactant, sodium cholate (SC), in aqueous medium. Compared to the commonly used organic solvents, aqueous based media for graphene dispersions are not only low cost but also eco-friendly, thus making them a viable option for sustainable large scale production. PVP is a non-ionic and biocompatible macromolecule that is highly soluble in water and has a strong affinity to graphene/graphite surfaces, and contains an N-substituted pyrrolidone ring structure that resembles that of NMP solvent, which explains in part why it should be considered an effective substitute for NMP [32] as an exfoliant of graphene as it has already been utilized to stabilize carbon nanotubes [46]. SC is already a well-known bile salt anionic surfactant that has also been widely used for carbon nanotubes stabilization [47-49]. In this study, we also show that high concentration graphene dispersions can be achieved at much shorter times using high shear colloidal mixing, proving that this method can be used for large scale industrial production of few-layer graphene sheets. By using scanning electron microscopy (SEM), atomic force microscopy (AFM) and Raman spectroscopy, we show that the shear exfoliated graphene dispersion consisting of few-layer graphene sheets is essentially free from defects.
7
2. EXPERIMENTAL 2.1. Materials
Graphite natural flakes with particle size +100 mesh (> 75 %) Product Number: 332461, poly(vinyl pyrrolidone) (PVP) (MW: 10 000 g mol-1), and sodium cholate (SC) were purchased from Sigma Aldrich and used without any modification. Distilled water was used throughout the experiments. 2.2. Preparation of graphene dispersions
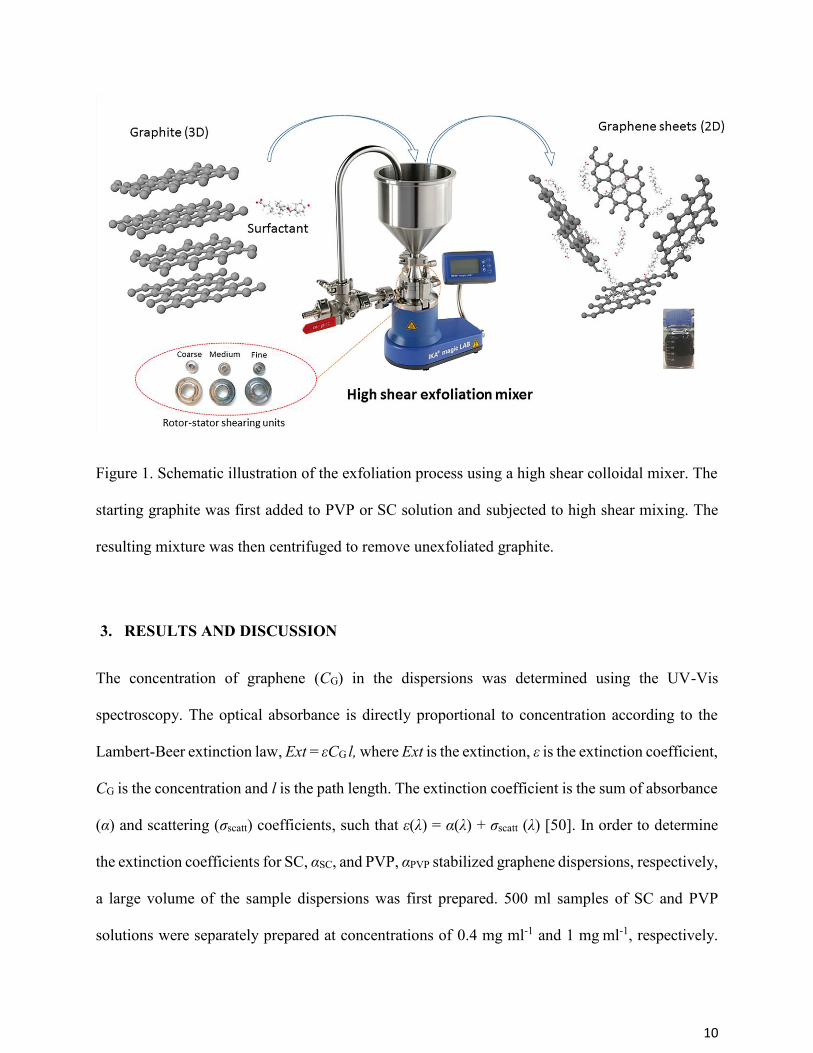
Shear exfoliation was performed using an IKA Magic Lab (1-l Module MICRO-PLANT equipped with a single walled open 1 l vessel) high shear mixing equipment with a maximum flow rate of 80 l h-1 shown in Figure 1. All experiments were conducted at a rotation speed of 20 000 min-1 (rpm) for the predetermined time. The equipment was equipped with a three stage rotor-stator shear generator system, Coarse-Medium-Fine arranged in series for optimum performance. Graphite natural flakes were dispersed in aqueous solutions at a concentration of 40 mg ml-1 for all experiments. High concentration of starting graphite was used to maximize resulting graphene concentration. Aqueous solutions of polymer and surfactant were made by dissolving PVP and SC in distilled water, respectively, at predetermined concentrations, covering the ranges: PVP concentration 1, 5, 15, 20 mg ml-1 and SC 0.4, 1, 2, 3 mg ml-1. The IKA Magic Lab was cooled with cold running water during the whole duration of the experiments to keep the dispersion temperature around room temperature. A starting graphite dispersion of 500 ml was prepared for all experiments. About 100 ml of graphene dispersions were collected after 15, 30, 60, 90 and 120 min of shear-induced exfoliation. The dispersions were kept overnight to allow the bigger particles to settle down and then centrifuged for 60 min at a rotation speed of 4 700 rpm in a Thermo
8
Scientific centrifuge SL40FR to remove all unexfoliated graphite flakes. The supernatant was carefully collected and used for further analysis. 2.3. Equipment and techniques
2.3.1. Vacuum filtration To calculate the concentration of graphene, a known volume of graphene dispersion was filtered on a filter paper with a pore size of 20 nm. The mass of the filter paper was measured before and after filtration after drying in a vacuum at 40 oC for 24 h. The filtered films were also used for Raman and SEM analyses. 2.3.2. UV-Vis spectroscopy To correlate the concentration of graphene and extinction in graphene dispersion using the Lambert-Beer law, UV-Vis measurements were carried out using a Shimadzu UV-Vis spectrophotometer 2550 at wavelengths 200 – 800 nm. The dispersions were controllably diluted before the measurements. The extinction of graphene dispersed in PVP and SC was measured at the wavelength of 660 nm at which the effects of PVP and SC are negligible. 2.3.3. Atomic force microscopy (AFM) AFM images were recorded with a Multimode 8 atomic force microscope equipped with a NanoScope V controller (Bruker Corporation, Billerica, MA), operating in tapping mode on Si substrates. Samples for AFM images were prepared by drop-casting a high diluted dispersion on Si wafers and left to dry in ambient conditions. The wafers were further dried in a vacuum oven at 60 0C for 24 h. Before deposition, the Si wafers were bath sonicated in distilled water for 10 min
9
and subsequently dried with nitrogen. This was then followed by UV radiation treatment for 30 min. 2.3.4. Raman spectroscopy Raman spectra were measured using a WITec alpha300 R Raman microscope (alpha 300, WITec, Ulm, Germany) equipped with a piezoelectric scanner using a 532 nm linear polarized excitation laser. The vacuum filtered films prepared from graphene dispersions were used for Raman analysis. 2.3.5. Scanning electron microscopy (SEM) The structure of the filtered films was recorded using a Zeiss Sigma VP scanning electron microscope at 1–2 kV acceleration voltage. The films were first sputtered with a ~4 nm platinum film. 2.3.6. Particle sizing The ensemble average hydrodynamic equivalent spherical diameter of graphene sheets in the dispersion was measured using Malvern Zetasizer Nano-ZS90 based on the dynamic light scattering (photon correlation) technique.
2.3.7. Electrical conductivity
Electrical conductivity was measured with a four-point probe method (Jandel RM3000: Jandel Engineering Ltd.). The measured resistance was converted to sheet resistance, Rs Ω sq.-1. The specific resistance, ρ, was then calculated from ρ = Rs × t, where t is the film thickness in cm, such that the corresponding electrical conductivity, σ = 1/ρ (S cm−1). The electrical conductivity was also measured after annealing the films at 400 oC in nitrogen atmosphere for 2 h.
10
Figure 1. Schematic illustration of the exfoliation process using a high shear colloidal mixer. The starting graphite was first added to PVP or SC solution and subjected to high shear mixing. The resulting mixture was then centrifuged to remove unexfoliated graphite. 3. RESULTS AND DISCUSSION
The concentration of graphene (CG) in the dispersions was determined using the UV-Vis spectroscopy. The optical absorbance is directly proportional to concentration according to the Lambert-Beer extinction law, Ext = εCG l, where Ext is the extinction, ε is the extinction coefficient, CG is the concentration and l is the path length. The extinction coefficient is the sum of absorbance (α) and scattering (σscatt) coefficients, such that ε(λ) = α(λ) + σscatt (λ) [50]. In order to determine the extinction coefficients for SC, αSC, and PVP, αPVP stabilized graphene dispersions, respectively, a large volume of the sample dispersions was first prepared. 500 ml samples of SC and PVP solutions were separately prepared at concentrations of 0.4 mg ml-1 and 1 mg ml-1, respectively.
11
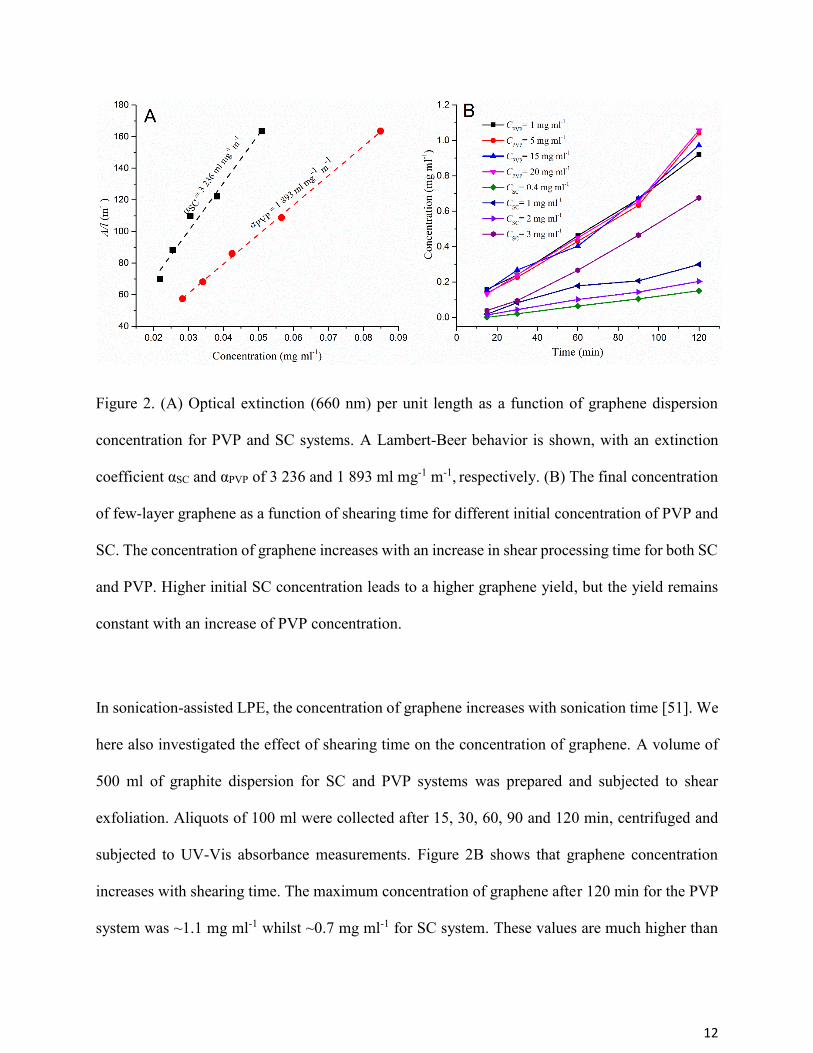
Powder natural graphite flakes were mixed into each solution (2 mg ml-1) and subjected to shear-induced exfoliation in an IKA Magic Lab for 60 min at 20 000 min-1 (rpm). The resulting particulate dispersion was then centrifuged at 4 700 min-1 for 60 min to remove unexfoliated graphite flakes. The resulting stable and homogenous supernatant was used to determine the extinction coefficients of SC- and PVP-graphene dispersions. The concentrations of SC and PVP were chosen as low as possible to minimize the effect of adsorbed polymer and surfactant on the final graphene concentration. The extinction of an extracted sample of each system was measured at 660 nm in a cell having a defined path length geometry of 10 mm. A known volume of dispersion was then vacuum filtered on an alumina membrane of known mass. The resulting filter residue film was repeatedly washed with about 3 000 ml of water to remove excess polymer or surfactant followed by vacuum drying overnight. The graphene solids concentration, CG, was thus determined using a high precision microbalance, assuming that any irreversibly adsorbed polymer or surfactant on the graphene surface contributed negligibly to the sample weight. The TGA analysis (not shown) showed that the filtered films contained about 12 % of residual surfactant. This was then taken into account for the final calculation of graphene concentration and determination of extinction coefficient. The extinction coefficients were determined using the calibration curves for SC and PVP stabilized systems shown in Figure 2A. It is clear from Figure 2A that both SC and PVP stabilized graphene dispersions obey the Lambert–Beer law as evidenced by the linear relationship between extinction and concentration. The calculated mean values of α for the SC and PVP stabilized systems were αSC= 3 236 and αPVP = 1 893 ml mg-1 m-1, respectively. These values were then used to calculate the concentration of graphene in all subsequent colloidal dispersions.
12
Figure 2. (A) Optical extinction (660 nm) per unit length as a function of graphene dispersion concentration for PVP and SC systems. A Lambert-Beer behavior is shown, with an extinction coefficient αSC and αPVP of 3 236 and 1 893 ml mg-1 m-1, respectively. (B) The final concentration of few-layer graphene as a function of shearing time for different initial concentration of PVP and SC. The concentration of graphene increases with an increase in shear processing time for both SC and PVP. Higher initial SC concentration leads to a higher graphene yield, but the yield remains constant with an increase of PVP concentration. In sonication-assisted LPE, the concentration of graphene increases with sonication time [51]. We here also investigated the effect of shearing time on the concentration of graphene. A volume of 500 ml of graphite dispersion for SC and PVP systems was prepared and subjected to shear exfoliation. Aliquots of 100 ml were collected after 15, 30, 60, 90 and 120 min, centrifuged and subjected to UV-Vis absorbance measurements. Figure 2B shows that graphene concentration increases with shearing time. The maximum concentration of graphene after 120 min for the PVP system was ~1.1 mg ml-1 whilst ~0.7 mg ml-1 for SC system. These values are much higher than
13
those reported for sonication exfoliation. For example, 0.3 mg ml-1 after 430 h of sonication [35], 0.09 mg ml-1 after 1 h of tip sonication [52] for SC systems, whilst 0.42 mg ml-1 and 0.1 mg ml-1 after 6 h of bath sonication for PVP systems [33, 34] and 1.2 mg ml-1 in NMP after 270 h of bath sonication [51]. We also studied the dependence of graphene concentration on the initial concentration of PVP and SC as shown in Figure 2B. For the PVP system, the initial concentration has little effect on the final concentration of graphene. These findings slightly differ from the study of Wajid et al. [33] where they found graphene concentration, CG, to be dependent on PVP concentration up to 10 mg ml-1, but, beyond that, CG remained constant despite increasing PVP concentration further. However, for SC systems, there is a strong dependence of CG on initially added SC concentration. CG increased significantly with an increase in the initial SC concentration. In this context it is important to note that the stabilization mechanisms of graphene in dispersions for PVP and SC are different. For PVP systems, steric repulsion plays a major role [53]. On the one hand, the PVP used in this study with Mw: 10 000 g mol-1 has long chain molecules with lengths greater than the attraction range of the van der Waals force. Therefore, when PVP is adsorbed onto the surface of graphene sheets, it forms a coating with several tails extending from the surface that creates a repulsive force between graphene sheets, and the long molecule chains also prevent the particles from getting close enough to each other for the van der Waals force to be effective. This prevents re-aggregation of graphene sheets and thus supports a stable dispersion. On the other hand, graphene stabilization in SC systems is achieved via the electrostatic charge effect [37], i.e. the charged SC molecules adsorb onto the surface of graphene leading to the formation of an electrical double layer and the resulting Coulomb repulsion that prevents aggregation of graphene sheets.
14
The Hildebrand solubility parameters have been used to determine suitable solvents for graphene dispersions. It has been shown that the good dispersion media for graphene is characterized by a Hildebrand solubility parameter of δT ~ 23 MPa1/2, and Hansen solubility parameters of δD ~ 18 MPa1/2, δP ~ 9.3 MPa1/2 and δH ~ 7.7 MPa1/2 [54]. These criteria are very useful when finding solvents for forming suitable dispersions of graphene. However, application of the Hildebrand solubility parameter has some limitations. For instance, the Hildebrand solubility parameter is most suitable for nonpolar and systems without hydrogen bonding and it is used predominantly for polymer solutes, however, graphene is distinctive in its interaction with various solvents [55] . Therefore, the Hildebrand solubility parameters in relation to graphene, dispersed in polymer and surfactants polar systems that are used in this study are not discussed further.
Figure 3. UV-Vis extinction spectra of graphene dispersion at different shear times for (A) PVP system (CPVP=1 mg ml-1), (B) SC system (CSC=0.4 mg ml-1) with the inserts showing the optical changes in relation to shearing time
15
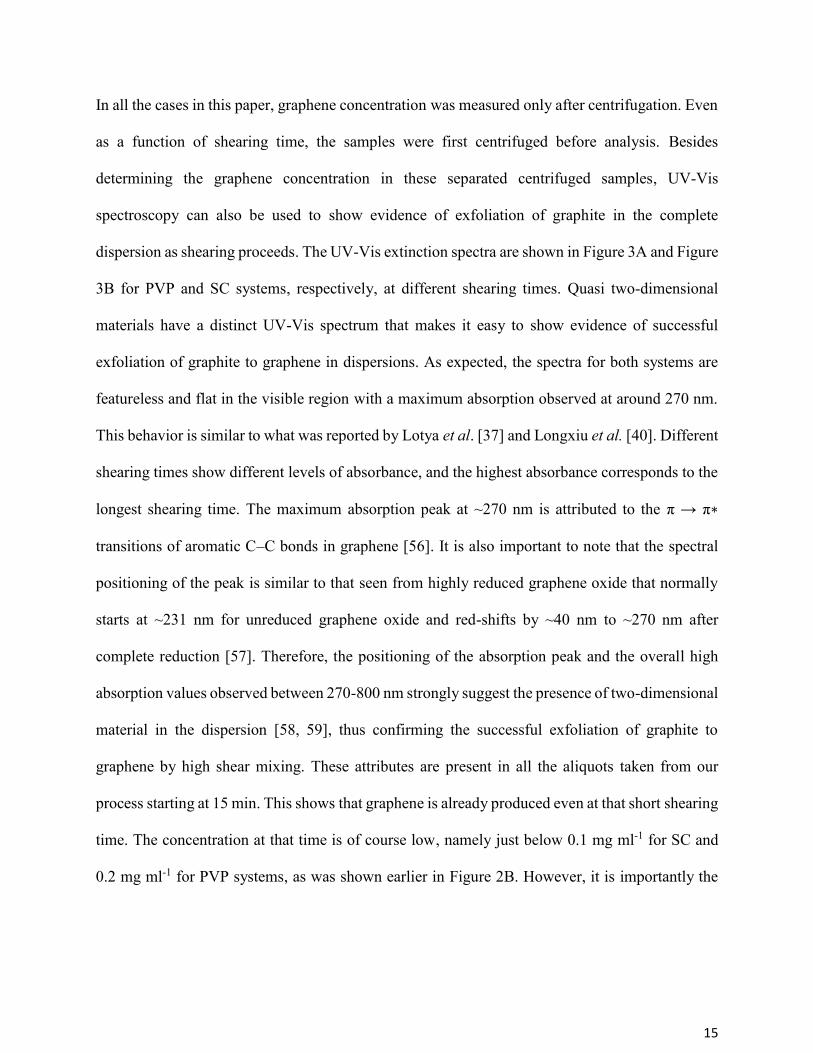
In all the cases in this paper, graphene concentration was measured only after centrifugation. Even as a function of shearing time, the samples were first centrifuged before analysis. Besides determining the graphene concentration in these separated centrifuged samples, UV-Vis spectroscopy can also be used to show evidence of exfoliation of graphite in the complete dispersion as shearing proceeds. The UV-Vis extinction spectra are shown in Figure 3A and Figure 3B for PVP and SC systems, respectively, at different shearing times. Quasi two-dimensional materials have a distinct UV-Vis spectrum that makes it easy to show evidence of successful exfoliation of graphite to graphene in dispersions. As expected, the spectra for both systems are featureless and flat in the visible region with a maximum absorption observed at around 270 nm. This behavior is similar to what was reported by Lotya et al. [37] and Longxiu et al. [40]. Different shearing times show different levels of absorbance, and the highest absorbance corresponds to the longest shearing time. The maximum absorption peak at ~270 nm is attributed to the π → π∗ transitions of aromatic C–C bonds in graphene [56]. It is also important to note that the spectral positioning of the peak is similar to that seen from highly reduced graphene oxide that normally starts at ~231 nm for unreduced graphene oxide and red-shifts by ~40 nm to ~270 nm after complete reduction [57]. Therefore, the positioning of the absorption peak and the overall high absorption values observed between 270-800 nm strongly suggest the presence of two-dimensional material in the dispersion [58, 59], thus confirming the successful exfoliation of graphite to graphene by high shear mixing. These attributes are present in all the aliquots taken from our process starting at 15 min. This shows that graphene is already produced even at that short shearing time. The concentration at that time is of course low, namely just below 0.1 mg ml-1 for SC and 0.2 mg ml-1 for PVP systems, as was shown earlier in Figure 2B. However, it is importantly the
16
case that, when compared to other reported values after sonication for many hours these values even at 15 min are significantly higher. Additionally, as the shearing time increases so does the concentration of dispersed graphene sheets in the dispersion and also this helps to break down thick graphene stacks into individual layers, thus increasing the final concentration of separated graphene sheets. This is indicated by the increasing peak intensities at 270 nm with shearing time as depicted in Figure 3A and Figure 3B, with the inserts showing the optical changes of dispersion with increasing shearing time. The optical density is dependent on the concentration of graphene dispersions. As the shearing time is increased, the number of graphene particles in the dispersion increases, and thus the absorbance and scattering are depicted by a continuous increase of extinction as a function of shearing time in Figure 3. That the maximum of the peak increases in relation to the remaining spectrum faster the longer the shearing time, we can conclude that the process is efficient throughout, in that the separation of the layers runs according to the power law expected, i.e. the graphite stacks disintegrate into finer stacks, which, in turn, then continue to delaminate and finally exfoliate into few-layer graphene, such that the remaining graphite concentration declines as a negative power law. Visual observation of the inserts in Figure 3 confirms the earlier investigation in Figure 2B, in that few-layer graphene in the PVP-containing aqueous medium is more concentrated than in the SC-containing. The inserts in Figure 3 also show that the produced dispersions are homogeneous and stable without any visible sedimentation even after a few weeks. In comparison to similar methods for mechanical exfoliation of graphene that have been reported in the literature, as shown in Figure 4 and Table 1, it is clear that the method that has been utilized
17
in this work is able to produce high concentrations of graphene dispersions more efficiently. These other methods require hundreds of hours of processing to reach similar concentrations, and thus are not considered viable for large-scale industrial application.
Figure 4 Comparison of this work with reported literature data for the concentration of mechanically exfoliated graphene as a function of processing/exfoliating timea.
18
Table 1 Comparison of literature data with this work for the concentration of mechanically produced graphene in relation to exfoliation time and stabilizers
No. on graph
Method Exfoliation medium Timea, h
Concentration, mg ml-1
Ref.
1 Sonication ortho-dichlorobenzene (o-DCB)
8 0.0065 [60]
2 Bath sonication
Water-sodium cholate solution
430 0.3 [35]
3 Sonication N-methyl-pyrrolidone (NMP)
460 1.2 [51]
4 Bath sonication
N-methyl-pyrrolidone 0.5 0.01 [32]
5 Shear exfoliation
N-methyl-pyrrolidone 2 0.0045 [41]
6 Sonication Water -Triton X-100 solution
12 0.7 [61]
7 Shear and sonication
ortho-dichlorobenzene 1.5 0.03 [62]
8 Sonication Water-Sodium cholate 12 0.25 [63] 9 Tip
sonication Polyvinylpyrrolidone solution
1 0.42 [33]
10 sonication Low boiling point solvents
48 0.5 [64]
11 Ultrasonic bath
N-methyl-pyrrolidone (NMP)
6 0.085 [65]
12 Shear exfoliation
Water-sodium cholate solution
2 1.1 This work
13 Shear exfoliation
polyvinylpyrrolidone 2 0.7 This work
19
Evidence of exfoliation can also be provided by Raman spectroscopy. Raman spectroscopy is one of the most useful nondestructive methods for characterization of carbon based materials. Raman spectroscopy makes it possible not only to estimate the thickness of graphene sheets [52, 66] but also the quality of deposited graphene layers [51, 62]. Raman spectra were collected on vacuum filtered films that were thoroughly washed with distilled water to remove free PVP and SC. Several measurements were conducted on each single film followed by averaging and normalizing to the G-band intensity. Raman spectra of graphite as a reference together with PVP and SC stabilized few-layer graphene are shown in Figure 5. It is clearly evident that all the typical Raman spectra of graphitic materials are present: the D-band (~1 582 cm-1), G-band (~1 350 cm-1) and 2D-band (~2 700 cm-1) [66]. The G and 2D band are prominent graphene bands and are always present while the presence of the D band depends on the quality of graphene. The D band, also known as the defect band, is due to the breathing mode of the sp2 carbon atoms and is only activated in the presence of disorder in the graphene structure. The intensity of the D band increases with the defect level of the material. The G band appears as a result of first order scattering of an E2g mode of graphene and is related to the in-plane vibration mode of sp2 bonded carbon atoms. The 2D band is the second order two phonon process of the D band and does not require defects to be activated and is always prominent even in the absence of the D band. The deconvolution of the 2D band in Raman spectra of SC and PVP stabilized graphene, shown in the Figure 5B, revealed that few-layer graphene sheets of less than five layers were formed.
20
Figure 5. (A) Raman spectra at 532 nm for graphite powder and PVP and SC exfoliated graphene for 120 min shearing at different additive concentrations. The spectra are normalized to the G-band intensity. The graphite spectrum is shown as reference and compared to the SC and PVP stabilized graphene sheets at different concentrations. The D band intensity is seen to increase showing that some defects are induced in the structure by shearing. (B) Corresponding magnified 2D-bands showing 2D band maximum shift for PVP and SC stabilized graphene dispersions. The maximum shift is attributed to the reduction of graphene layers. The shape and maximum shift of the 2D band are consistent with few-layer graphene sheets and the Lorentz peak fitting of the 2D peak corresponds to few-layer graphene flakes.
21
The shape of the 2D band can be used to identify the number of graphene layers [66, 67]. For few-layer graphene sheets, the shape of this band is considerably different from that of graphite, as shown in Figure 5B. None of the samples measured for both SC and PVP stabilized few-layer graphene showed graphite-like character, but rather were consistent with few-layer graphene sheets similar to that which was observed by Hernandez et al. [32]. The 2D band in the spectra is also broader than what is expected from single graphene sheets [52], suggesting that the dispersions consists of few-layer graphene. It has also been shown that the 2D maximum shifts to the lower value as the number of layers is reduced [66]. This behavior is clearly evident in Figure 5B for both SC and PVP systems. The 2D band in the spectra for SC and PVP stabilized graphene displayed characteristics that are typical of few-layer graphene sheets of not more than 5 layers [66, 68]. It is important to note that the difference of the 2D band in the spectra for graphite and few-layer graphene for filtered films indicates that even though aggregation occurs during filtration, the aggregation is not the same stacking Bernal AB type as in graphite, but rather random stacking of graphene sheets as shown by the SEM image in Figure 6. Therefore, the randomly stacked few-layer graphene sheets maintain the same electronic structure as in freestanding exfoliated sheets, and this is evident in the Raman spectra of the filtered films. For single layer graphene, the Raman 2D band is symmetrical and is fitted with only one Lorentzian peak which shows one π electron valence band and π* conduction band structure that
means that one Raman scattering cycle is excited at the K and K’ points. The full width at half-maximum (FWHM) of the 2D band is found to be a quantitative guide to distinguish the number of graphene layers of up to five layers. The FWHM (2D) for single graphene sheets is ~30 cm-1. The FWHM of graphene increases with an increase in the number of layers. In few-layer graphene,
22
due to the π electron interaction under AB stacking, the electronic bands split into dispersive
configurations [69] and, therefore, the more resonant phonons with different frequencies contribute to the widening and lower intensity of the 2D bands. The average FWHM for the 2D band for both PVP and SC stabilized graphene was found to be 59.23 cm-1 (see Figure 5), which is the range for few-layer graphene sheets. These values are consistent with that which has been reported for few-layer graphene sheets in the range between 50-66 cm-1 [66, 70]. The calculated FWHM (G) for graphite from the Raman spectrum is 16 cm-1. This value does not change for defect-free single layer graphene. However, a noticeable increase to an average of 30 cm-1 is observed in our samples for both SC and PVP stabilized graphene. This increase in the FWHM (G) is caused by the sample edges. This is true because the position of the G peak did not shift, which would be the case if the widening is caused by the structural basal plane defects [71, 72].
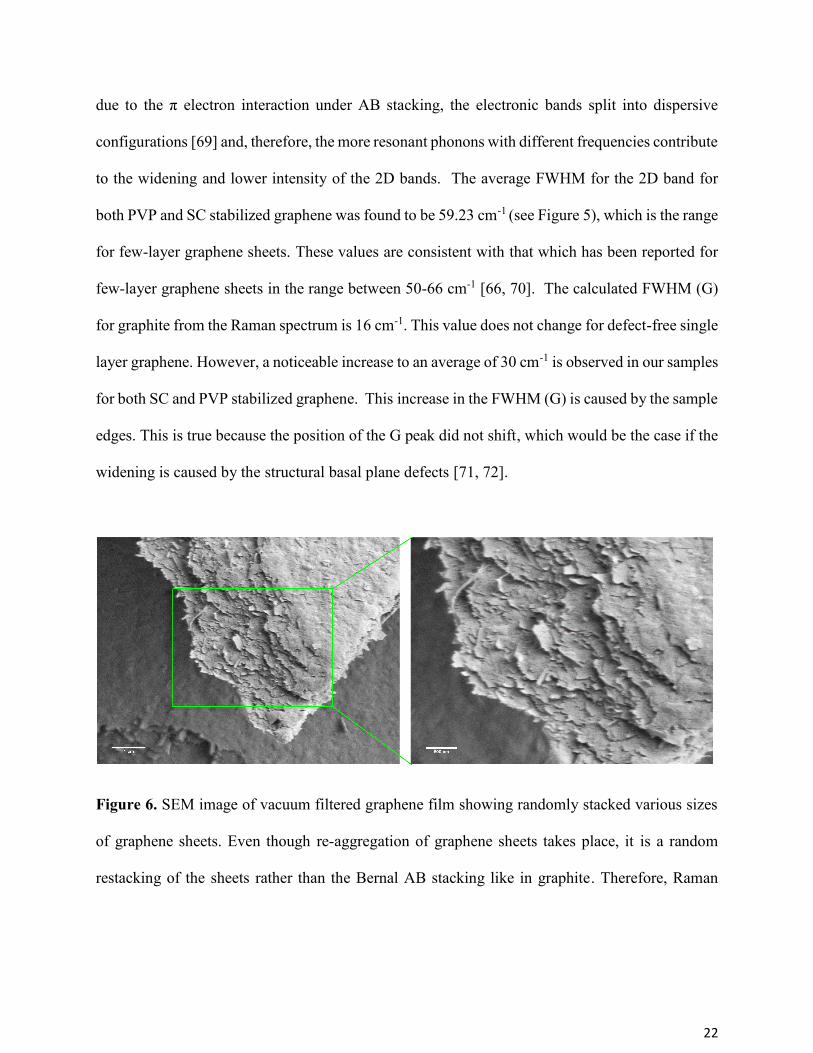
Figure 6. SEM image of vacuum filtered graphene film showing randomly stacked various sizes of graphene sheets. Even though re-aggregation of graphene sheets takes place, it is a random restacking of the sheets rather than the Bernal AB stacking like in graphite. Therefore, Raman
23
analysis on the surface of the films is able to distinguish between graphite and exfoliated few layer graphene sheets. The quality of exfoliated graphene sheets can be determined by Raman analysis. As already stated, the intensity of the D band is related to the defects content and these defects can either be topological or the edges of graphene sheets [73]. It is worth noting that the starting natural graphite flakes display a small amount of defect content shown by the slightly visible D band intensity (Figure 5A). The quantity/content of defects can be identified by the intensity ratio of the D band and G band, ID/IG (Figure 7). We investigated the effect of shearing time after 60 and 120 min on the amount of defects induced for SC and PVP systems for different concentrations, as shown in Figure 7. The intensity of the D band from graphite gradually increases with shearing time for both SC and PVP systems, indicating that shear exfoliation induces some defects into the graphene sheets (Figure 5). However, we did not find any correlation between initial concentration of SC and PVP and the amount of defects induced. It is also important to know the type of defects induced whether they are basal plane defects or edge defects. Basal planes defects usually result in a broadening of the G band, and the intensity of the D band is generally higher than the G band, as is usually the case for graphene oxide or reduced graphene oxide [28]. The D band for both SC and PVP systems at 60 and 120 min shearing time (Figure 5) is both narrow and less intense than the reported values for graphene oxide, and, besides, the typical broadening of the G band is also not observed. This indicates that the defects induced by shear exfoliation are not basal plane defects.
24
However, the introduction of the edge defects is inevitable because the size of the flakes is reduced by shearing and the total edge length increases with the reduction of flake sizes. This was confirmed by the light scattering measurements in Figure 8A, which show that the sizes of graphene flakes are reduced with shearing time, and thus total edge length increases with the reduction of flake size. Moreover, the spot size of the spectral laser illumination, 1-2 µm, suggests that the Raman beam will always cover a large quantity of graphene sheet edges in the filtered film, since the average flake size is much smaller than the laser spot size. The small intensity of the D band and lack of broadening of the G band, as in the case of graphene oxide, is compelling evidence that the defects induced in the graphene sheets are attributable to the edge defects rather than basal plane defects. Also, the intensity ratio of ID/IG for both our systems is in the range of 0.1 - 0.3, significantly lower than that reported for graphene oxide with basal plane defects (>1) [28] and for sonication dispersed graphene (~0.6) [36, 51]. This study for defect quantification by Raman analysis is thus in agreement with reported analyses [37, 41, 51, 66]. These values, therefore, confirm that the high shear mechanism for exfoliation of graphite used in this study produces high quality few-layer graphene sheets free from basal plane defects.
25
Figure 7. Quantification of defects level by intensity ratio of ID/IG as a function of shearing time for (A) SC system and (B) PVP system. The ID/IG intensity ratio increases with shearing time as more edges are introduced due to the reduction of flake sizes during shear exfoliation, and thus, some grinding. The initial concentration of SC and PVP have no apparent effect on the amount of defects induced by shear exfoliation.
26
Figure 8. (A) Average flake size as function of shearing time measured by dynamic light scattering. The size of the flakes decreases with an increase in shearing time. (B) The dependence of ID/IG ratio on graphene flake size. The defect content increases with the reduction of flake size because more edges are introduced with the reduction of flake sizes by shearing. Evidence of exfoliation can also be provided by showing the thickness of exfoliated graphene sheets. AFM is one of the most implemented methods for quantifying the degree of exfoliation of graphene sheets [74]. Graphene dispersions were deposited on Si/SiO2 wafers then washed in water to partially remove some of the excess dispersant. It is important to note, that the re-aggregation of the graphene sheets occurs when the surfactant or polymer is washed off, therefore the AFM measurement does not necessarily depict the actual state of graphene sheets suspended in the dispersion. When doing statistical calculation, we only considered sheets that clearly showed no signs of re-aggregation for the final quantity count. One other thing to consider is that it is impossible to remove completely all the surfactant or polymer from the graphene sheets, therefore
27
AFM thickness measurements normally show the apparent thickness rather than the actual real thickness of the deposited graphene sheets [41]. The graphene dispersion was diluted before deposition in an attempt to minimize this effect. A large numbers of flakes with different sizes can be seen from the AFM image of deposited SC stabilized graphene on Si/SiO2 wafers (Figure 9A). The majority of the observed sheets were few-layer graphene flakes although we also observed aggregates with thickness over 15 nm. Some examples of individual few-layer graphene sheets are shown in Figure 9B and Figure 9C with corresponding height profiles. The majority of the observed flakes were typical of few-layer graphene sheets.
Figure 9. AFM images of SC stabilized graphene sheets on Si wafers. (A) 5 x 5 µm2 area showing a large number of graphene sheets with different sizes (B) and (C) magnified images of individual flakes with corresponding height profiles.
28
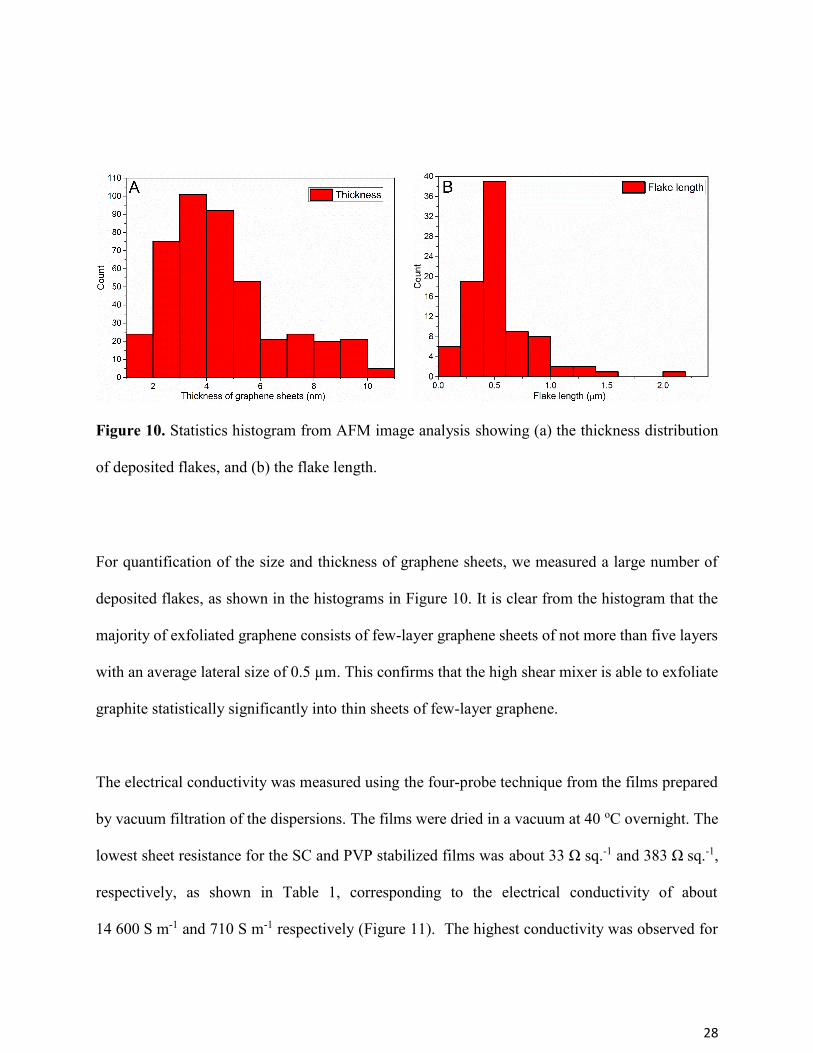
Figure 10. Statistics histogram from AFM image analysis showing (a) the thickness distribution of deposited flakes, and (b) the flake length. For quantification of the size and thickness of graphene sheets, we measured a large number of deposited flakes, as shown in the histograms in Figure 10. It is clear from the histogram that the majority of exfoliated graphene consists of few-layer graphene sheets of not more than five layers with an average lateral size of 0.5 µm. This confirms that the high shear mixer is able to exfoliate graphite statistically significantly into thin sheets of few-layer graphene. The electrical conductivity was measured using the four-probe technique from the films prepared by vacuum filtration of the dispersions. The films were dried in a vacuum at 40 oC overnight. The lowest sheet resistance for the SC and PVP stabilized films was about 33 Ω sq.-1 and 383 Ω sq.-1, respectively, as shown in Table 1, corresponding to the electrical conductivity of about 14 600 S m-1 and 710 S m-1 respectively (Figure 11). The highest conductivity was observed for
29
the films with the lowest initial polymer or surfactant. The presence of residual surfactant or polymer is higher in the films prepared with the highest initial concentrations. This greatly affects the film properties as the trapped polymer or surfactant between the graphene sheets is impossible to remove by simple washing. However, the conductivity of these films, especially for SC stabilized graphene, is much higher than that which was achieved from similar systems 35 S m-1 before annealing and 1 500 S m-1 after annealing at 250 oC for 2 h [37], and 7000 S m-1 before annealing, rising to 17 500 S m-1 after annealing at 500 oC for 2 h. These values are also higher than the films prepared from reduced graphene oxide, which were reported as having conductivities ranging from 7 000 S m-1 to 10 000 S m-1 [29, 57]. After annealing the films at 400 oC for 2 h, a significant decrease of sheet resistance was observed especially for the PVP stabilized samples, with an average 38 Ω sq.-1, equivalent to an electrical conductivity of about 8 000 S m-1
(Figure 12B). However, for the SC stabilized films, the electrical conductivity rose to about 29 000 S m-1 after annealing (Figure 12A).
Figure 12. Electrical conductivity as a function of concentration for (a) sodium cholate suspensions (b) PVP suspensions for graphene films before and after annealing
30
Table 2. The dependence of sheet resistance graphene films on the initial PVP and SC concentration
This study has shown that shear exfoliation is an effective method for exfoliation of few layer graphene sheets confirming the similar study by Coleman and his group [41]. However, the major drawback of this method is low efficiency and low concentration of produced graphene, which makes it impractical for various applications at industrial scale and also in applications that require a large amount of graphene. In this study however, a high concentration of few-layer graphene was achieved at a short processing time which is much higher than any reported work of the similar systems. Therefore, due to the high efficiency, quality and concentration of the produced few-layer graphene sheets, this method has high potential for large scale application. CONCLUSIONS We have reported a highly efficient, facile and feasible method for production of high concentration few-layer graphene dispersions with high scalability potential. We have shown that by using a commercially available high shear colloidal mixer, it is possible to produce high
Stabilizing agent Concentration, mg ml-1
Sheet resistance, ohm sq.-1 Before annealing After annealing
NaC 1 33 18 2 48 21 3 92 34
PVP 1 383 32 5 580 45 20 765 36
31
concentration dispersions of few-layer graphene sheets with solid content of up to 1.1 mg ml-1 after just 120 min of high shear mixing in aqueous based medium. This method is more efficient than sonication in terms of yield and energy consumption. AFM and Raman analyses confirmed that the dispersions contain a large number of few-layer graphene sheets. The high shear mixing process can be easily scaled up to produce few-layer graphene dispersions in large volumes. We also showed that the produced few-layer graphene sheets are of high quality and without having made, or containing, any chemical modifications. These dispersions can be used for applications such as solar cells, energy storage devices, nanocomposites etc. Since a high concentration of defect-free few-layer graphene sheets can be obtained in a short time using eco-friendly material additives, this method has real potential for mass production of few-layer graphene. ACKNOWLEDGEMENT The authors appreciate financial support from Omya International AG. Also support from the Finnish academy, POROFIBRE project (No. 279255). This work made use of the Aalto University Nanomicroscopy Center (Aalto-NMC) for SEM imaging. COMPLIANCE WITH ETHICAL STANDARDS CONFLICT OF INTEREST The authors declare that they have no conflict of interest.
32
REFERENCES 1. Novoselov KS, Geim AK, Morozov SV, Jiang D, Zhang Y, Dubonos SV, Grigorieva IV, Firsov AA (2004) Electric Field Effect in Atomically Thin Carbon Films. Science 306:666-669 2. Bolotin KI, Sikes KJ, Jiang Z, Klima M, Fudenberg G, Hone J, Kim P, Stormer HL (2008) Ultrahigh electron mobility in suspended graphene. Solid State Commun 146:351-355 3. Morozov SV, Novoselov KS, Katsnelson MI, Schedin F, Elias DC, Jaszczak JA, Geim AK (2008) Giant Intrinsic Carrier Mobilities in Graphene and Its Bilayer. Phys Rev Lett 100 4. Dürkop T, Getty SA, Cobas E, Fuhrer MS (2004) Extraordinary Mobility in Semiconducting Carbon Nanotubes. Nano Lett 4:35-39 5. Lee C, Wei X, Kysar JW, Hone J (2008) Measurement of the Elastic Properties and Intrinsic Strength of Monolayer Graphene. Science 321:385-388 6. Peigney A, Laurent C, Flahaut E, Bacsa RR, Rousset A (2001) Specific surface area of carbon nanotubes and bundles of carbon nanotubes. Carbon 39:507-514 7. Balandin AA, Ghosh S, Bao W, Calizo I, Teweldebrhan D, Miao F, Lau CN (2008) Superior Thermal Conductivity of Single-Layer Graphene. Nano Lett 8:902-907 8. Bunch JS, Verbridge SS, Alden JS, van der Zande AM, Parpia JM, Craighead HG, McEuen PL (2008) Impermeable atomic membranes from graphene sheets. Nano Lett 8:2458-2462 9. Stoller MD, Park S, Zhu Y, An J, Ruoff RS (2008) Graphene-based ultracapacitors. Nano Lett 8:3498-3502 10. Zhu Y, Murali S, Stoller MD, Ganesh KJ, Cai W, Ferreira PJ, Pirkle A, Wallace RM, Cychosz KA, Thommes M, Su D, Stach EA, Ruoff RS (2011) Carbon-Based Supercapacitors Produced by Activation of Graphene. Science 332:1537-1541 11. Wei D, Kivioja J (2013) Graphene for energy solutions and its industrialization. Nanoscale 5:10108-10126 12. Zhao X, Zhang Q, Chen D, Lu P (2010) Enhanced Mechanical Properties of Graphene-Based Poly(vinyl alcohol) Composites. Macromolecules 43:2357-2363 13. Bao Q (2010) Graphene-polymer nanofiber membrane for ultrafast photonics. Adv Funct Mater 20:782-791 14. Hu K, Kulkarni DD, Choi I, Tsukruk VV (2014) Graphene-polymer nanocomposites for structural and functional applications. Prog Polym Sci 39:1934-1972
33
15. Istrate OM, Paton KR, Khan U, O’Neill A, Bell AP, Coleman JN (2014) Reinforcement in melt-processed polymer–graphene composites at extremely low graphene loading level. Carbon 78:243-249 16. Keeley GP, O'Neill A, McEvoy N, Peltekis N, Coleman JN, Duesberg GS (2010) Electrochemical ascorbic acid sensor based on DMF-exfoliated graphene. J Mater Chem 20:7864-7869 17. Tian H, Shu Y, Cui YL, Mi WT, Yang Y, Xie D, Ren TL (2014) Scalable fabrication of high-performance and flexible graphene strain sensors. Nanoscale 6:699-705 18. Kavan L, Yum JH, Gratzel M (2011) Optically transparent cathode for dye-sensitized solar cells based on graphene nanoplatelets. ACS Nano 5:165-172 19. Torrisi F, Hasan T, Wu W, Sun Z, Lombardo A, Kulmala TS, Hsieh GW, Jung S, Bonaccorso F, Paul PJ, Chu D, Ferrari AC (2012) Inkjet-printed graphene electronics. ACS Nano 6:2992-3006 20. Gao Y, Shi W, Wang W, Leng Y, Zhao Y (2014) Inkjet Printing Patterns of Highly Conductive Pristine Graphene on Flexible Substrates. Ind Eng Chem Res 53:16777-16784 21. Scheuermann GM, Rumi L, Steurer P, Bannwarth W, Mulhaupt R (2009) Palladium nanoparticles on graphite oxide and its functionalized graphene derivatives as highly active catalysts for the Suzuki-Miyaura coupling reaction. J Am Chem Soc 131:8262-8270 22. Novoselov KS, Jiang D, Schedin F, Booth TJ, Khotkevich VV, Morozov SV, Geim AK (2005) Two-dimensional atomic crystals. Proceedings of the National Academy of Sciences of the United States of America 102:10451-10453 23. Hu B, Ago H, Ito Y, Kawahara K, Tsuji M, Magome E, Sumitani K, Mizuta N, Ikeda K-, Mizuno S (2012) Epitaxial growth of large-area single-layer graphene over Cu(1 1 1)/sapphire by atmospheric pressure CVD. Carbon 50:57-65 24. Berger C, Song Z, Li X, Wu X, Brown N, Naud C, Mayou D, Li T, Hass J, Marchenkov AN, Conrad EH, First PN, de Heer WA (2006) Electronic Confinement and Coherence in Patterned Epitaxial Graphene. Science 312:1191-1196 25. Chen B, Huang H, Ma X, Huang L, Zhang Z, Peng LM (2014) How good can CVD-grown monolayer graphene be?. Nanoscale 6:15255-15261 26. Park S, Ruoff RS (2009) Chemical methods for the production of graphenes. Nat Nanotechnol 4:217-224
34
27. Park S, An J, Jung I, Piner RD, An SJ, Li X, Velamakanni A, Ruoff RS (2009) Colloidal suspensions of highly reduced graphene oxide in a wide variety of organic solvents. Nano Lett 9:1593-1597 28. Stankovich S, Dikin DA, Piner RD, Kohlhaas KA, Kleinhammes A, Jia Y, Wu Y, Nguyen ST, Ruoff RS (2007) Synthesis of graphene-based nanosheets via chemical reduction of exfoliated graphite oxide. Carbon 45:1558-1565 29. Becerril HA, Mao J, Liu Z, Stoltenberg RM, Bao Z, Chen Y (2008) Evaluation of solution-processed reduced graphene oxide films as transparent conductors. ACS Nano 2:463-470 30. Bonaccorso F, Lombardo A, Hasan T, Sun Z, Colombo L, Ferrari AC (2012) Production and processing of graphene and 2d crystals. Mater Today 15:564-589 31. Phiri J, Gane P, Maloney TC (2017) General overview of graphene: Production, properties and application in polymer composites. Mater Sci Eng , B 215:9-28 32. Hernandez Y, Nicolosi V, Lotya M, Blighe FM, Sun Z, De S, McGovern IT, Holland B, Byrne M, Gun'Ko YK, Boland JJ, Niraj P, Duesberg G, Krishnamurthy S, Goodhue R, Hutchison J, Scardaci V, Ferrari AC, Coleman JN (2008) High-yield production of graphene by liquid-phase exfoliation of graphite. Nat Nanotechnol 3:563-568 33. Wajid AS, Das S, Irin F, Ahmed HST, Shelburne JL, Parviz D, Fullerton RJ, Jankowski AF, Hedden RC, Green MJ (2012) Polymer-stabilized graphene dispersions at high concentrations in organic solvents for composite production. Carbon 50:526-534 34. Bourlinos AB, Georgakilas V, Zboril R, Steriotis TA, Stubos AK, Trapalis C (2009) Aqueous-phase exfoliation of graphite in the presence of polyvinylpyrrolidone for the production of water-soluble graphenes. Solid State Commun 149:2172-2176 35. Lotya M, King PJ, Khan U, De S, Coleman JN (2010) High-concentration, surfactant-stabilized graphene dispersions. ACS Nano 4:3155-3162 36. Guardia L, Fernández-Merino MJ, Paredes JI, Solís-Fernández P, Villar-Rodil S, Martínez-Alonso A, Tascón JMD (2011) High-throughput production of pristine graphene in an aqueous dispersion assisted by non-ionic surfactants. Carbon 49:1653-1662 37. Lotya M, Hernandez Y, King PJ, Smith RJ, Nicolosi V, Karlsson LS, Blighe FM, De S, Wang Z, McGovern IT, Duesberg GS, Coleman JN (2009) Liquid phase production of graphene by exfoliation of graphite in surfactant/water solutions. J Am Chem Soc 131:3611-3620 38. Notley SM (2012) Highly concentrated aqueous suspensions of graphene through ultrasonic exfoliation with continuous surfactant addition. Langmuir 28:14110-14113
35
39. Xu J, Dang DK, Tran VT, Liu X, Chung JS, Hur SH, Choi WM, Kim EJ, Kohl PA (2014) Liquid-phase exfoliation of graphene in organic solvents with addition of naphthalene. J Colloid Interface Sci 418:37-42 40. Zhu L, Zhao X, Li Y, Yu X, Li C, Zhang Q (2013) High-quality production of graphene by liquid-phase exfoliation of expanded graphite. Mater Chem Phys 137:984-990 41. Paton KR, Varrla E, Backes C, Smith RJ, Khan U, O'Neill A, Boland C, Lotya M, Istrate OM, King P, Higgins T, Barwich S, May P, Puczkarski P, Ahmed I, Moebius M, Pettersson H, Long E, Coelho J, O'Brien SE, McGuire EK, Sanchez BM, Duesberg GS, McEvoy N, Pennycook TJ, Downing C, Crossley A, Nicolosi V, Coleman JN (2014) Scalable production of large quantities of defect-free few-layer graphene by shear exfoliation in liquids. Nat Mater 13:624-630 42. Yi M, Shen Z (2014) Kitchen blender for producing high-quality few-layer graphene. Carbon 78:622-626 43. Walker GF, Garrett WG (1967) Chemical Exfoliation of Vermiculite and the Production of Colloidal Dispersions. Science 156:385-387 44. Shinde DB, Brenker J, Easton CD, Tabor RF, Neild A, Majumder M (2016) Shear Assisted Electrochemical Exfoliation of Graphite to Graphene. Langmuir 32:3552-3559 45. Chen X, Dobson JF, Raston CL (2012) Vortex fluidic exfoliation of graphite and boron nitride. Chem Commun (Camb) 48:3703-3705 46. Li L, Nicholas RJ, Chen C, Darton RC, Baker SC (2005) Comparative study of photoluminescence of single-walled carbon nanotubes wrapped with sodium dodecyl sulfate, surfactin and polyvinylpyrrolidone. Nanotechnology 16:S202-S205 47. Hertel T, Hagen A, Talalaev V, Arnold K, Hennrich F, Kappes M, Rosenthal S, McBride J, Ulbricht H, Flahaut E (2005) Spectroscopy of single- and double-wall carbon nanotubes in different environments. Nano Lett 5:511-514 48. Sun Z, Nicolosi V, Rickard D, Bergin SD, Aherne D, Coleman JN (2008) Quantitative Evaluation of Surfactant-stabilized Single-walled Carbon Nanotubes: Dispersion Quality and Its Correlation with Zeta Potential. J Phys Chem C 112:10692-10699 49. Lin S, Blankschtein D (2010) Role of the bile salt surfactant sodium cholate in enhancing the aqueous dispersion stability of single-walled carbon nanotubes: a molecular dynamics simulation study. J Phys Chem B 114:15616-15625
36
50. Backes C, Paton KR, Hanlon D, Yuan S, Katsnelson MI, Houston J, Smith RJ, McCloskey D, Donegan JF, Coleman JN (2016) Spectroscopic metrics allow in situ measurement of mean size and thickness of liquid-exfoliated few-layer graphene nanosheets. Nanoscale 8:4311-4323 51. Khan U, O'Neill A, Lotya M, De S, Coleman JN (2010) High-Concentration Solvent Exfoliation of Graphene. Small 6:864-871 52. Green AA, Hersam MC (2009) Solution phase production of graphene with controlled thickness via density differentiation. Nano Lett 9:4031-4036 53. Xu L, McGraw J, Gao F, Grundy M, Ye Z, Gu Z, Shepherd JL (2013) Production of High-Concentration Graphene Dispersions in Low-Boiling-Point Organic Solvents by Liquid-Phase Noncovalent Exfoliation of Graphite with a Hyperbranched Polyethylene and Formation of Graphene/Ethylene Copolymer Composites. J Phys Chem C 117:10730-10742 54. Hernandez Y, Lotya M, Rickard D, Bergin SD, Coleman JN (2010) Measurement of Multicomponent Solubility Parameters for Graphene Facilitates Solvent Discovery. Langmuir 26:3208-3213 55. Wei Y, Sun Z (2015) Liquid-phase exfoliation of graphite for mass production of pristine few-layer graphene 20:311-321 56. Wang X, Zhi L, Tsao N, Tomović Ž, Li J, Müllen K (2008) Transparent Carbon Films as Electrodes in Organic Solar Cells. Angew Chem Int Ed Engl 47:2990-2992 57. Li D, Muller MB, Gilje S, Kaner RB, Wallace GG (2008) Processable aqueous dispersions of graphene nanosheets. Nat Nanotechnol 3:101-105 58. Fernández-Merino MJ, Guardia L, Paredes JI, Villar-Rodil S, Solís-Fernández P, Martínez-Alonso A, Tascón JMD (2010) Vitamin C Is an Ideal Substitute for Hydrazine in the Reduction of Graphene Oxide Suspensions. J Phys Chem C 114:6426-6432 59. Lee S, Lim S, Lim E, Lee KK (2010) Synthesis of aqueous dispersion of graphenes via reduction of graphite oxide in the solution of conductive polymer. J Phys Chem Solids 71:483-486 60. Gayathri S, Jayabal P, Kottaisamy M, Ramakrishnan V (2014) Synthesis of few layer graphene by direct exfoliation of graphite and a Raman spectroscopic study 4:027116 61. Buzaglo M, Shtein M, Kober S, Lovrincic R, Vilan A, Regev O (2013) Critical parameters in exfoliating graphite into graphene. Phys Chem Chem Phys 15:4428-4435 62. Hamilton CE, Lomeda JR, Sun Z, Tour JM, Barron AR (2009) High-yield organic dispersions of unfunctionalized graphene. Nano Lett 9:3460-3462
37
63. Shahil KM, Balandin AA (2012) Graphene-multilayer graphene nanocomposites as highly efficient thermal interface materials. Nano Lett 12:861-867 64. O’Neill A, Khan U, Nirmalraj PN, Boland J, Coleman JN (2011) Graphene Dispersion and Exfoliation in Low Boiling Point Solvents 115:5422-5428 65. Haar S, Gemayel M, Shin Y, Melinte G, Squillaci MA, Ersen O, Casiraghi C, Ciesielski A, Samori P (2015) Enhancing the Liquid-Phase Exfoliation of Graphene in Organic Solvents upon Addition of n-Octylbenzene. Scientific Reports 5:16684 66. Ferrari AC, Meyer JC, Scardaci V, Casiraghi C, Lazzeri M, Mauri F, Piscanec S, Jiang D, Novoselov KS, Roth S, Geim AK (2006) Raman Spectrum of Graphene and Graphene Layers. Phys Rev Lett 97 67. Malard LM, Pimenta MA, Dresselhaus G, Dresselhaus MS (2009) Raman spectroscopy in graphene. Phys Rep 473:51-87 68. Duhee Y, Hyerim M, Hyeonsik C, JinSik C, JungAe C, BaeHo P (2009) Variations in the Raman Spectrum as a Function of the Number of Graphene Layers. J Korean Phys Soc 55:1299-1303 69. Gruneis A, Attaccalite C, Wirtz L, Shiozawa H, Saito R, Pichler T, Rubio A (2008) Tight-binding description of the quasiparticle dispersion of graphite and few-layer graphene 78:205425 70. Hao Y, Wang Y, Wang L, Ni Z, Wang Z, Wang R, Koo CK, Shen Z, Thong JTL (2010) Probing Layer Number and Stacking Order of Few-Layer Graphene by Raman Spectroscopy 6:195-200 71. Casiraghi C, Pisana S, Novoselov KS, Geim AK, Ferrari AC (2007) Raman fingerprint of charged impurities in graphene. Appl Phys Lett 91:233108 72. Ferrari AC, Robertson J (2000) Interpretation of Raman spectra of disordered and amorphous carbon 61:14095-14107 73. Casiraghi C, Hartschuh A, Qian H, Piscanec S, Georgi C, Fasoli A, Novoselov KS, Basko DM, Ferrari AC (2009) Raman spectroscopy of graphene edges. Nano Lett 9:1433-1441 74. Niyogi S, Bekyarova E, Itkis ME, McWilliams JL, Hamon MA, Haddon RC (2006) Solution properties of graphite and graphene. J Am Chem Soc 128:7720-7721