Phosphate-Based Cathode Materials for Rechargeable Batteries A thesis presented for the award of the degree of Doctor of Philosophy from University of Technology Sydney by Katja Ramona Kretschmer, Dipl. Ing. May, 2018
Transcript
Phosphate-Based Cathode Materials for Rechargeable Batteries
A thesis presented for the award of the degree of
Doctor of Philosophy
from
University of Technology Sydney
by
Katja Ramona Kretschmer, Dipl. Ing.
May, 2018
I
CERTIFICATE OF ORIGINAL AUTHORSHIP
I, Katja Ramona Kretschmer, certify that the work presented in this thesis has not
previously been submitted for a degree nor has been submitted as part of
requirements for a degree except as fully acknowledged within the text.
I also certify that the thesis has been written by me. Any help that I have received
in my research work and the preparation of the thesis itself has been
acknowledged. In addition, I certify that all information sources and literature used
are indicated in the thesis.
Katja Ramona Kretschmer
Sydney, Australia
May, 2018
Production Note:Signature removed prior to publication.
II
DEDICATION
This thesis is dedicated to my family. Thank you for all your love and support.
III
ACKNOWLEDGEMENTS
Firstly, I would like to thank my supervisor and co-supervisor, Professor Guoxiu
Wang and Dr. Bing Sun, for their encouraging and continuous support and
invaluable advice throughout my Ph.D. studies.
I would also like to acknowledge Dr. Jane Yao for her assistance and support
essential to my laboratory work and professional development.
I gratefully acknowledge the friendship and joint professional accomplishments of
my past and present colleagues at the University of Technology Sydney, Dr.
Xiuqiang Xie, Dr. Jinqiang Zhang, Dr Yufei Zhao, Dr. Anjon Kumar Mondal, Dr Ying
Wang, Dr. Shuangqiang Chen, Dr. Hao Liu, Dr. Zhimin Ao, Dr. Devaraj
Shanmukaraj, Dr. Dawei Su, Mr. Xin Guo, Mr. Jianjun Song, Mr. Kefei Li, Miss Jing
Xu, and Mr. Weizhai Bao.
In addition, I appreciate the administrative and technical support I received from Dr.
Ronald Shimmon, Dr. Linda Xiao, Katie McBean, Mark Berkahn, Sarah King,
Emaly Black, and Elizabeth Gurung Tamang.
The financial support from UTS and AutoCRC 2020 (now Excellerate Australia)
throughout my Ph.D. studies are highly appreciated.
And finally, I would like to thank my parents, my partner, and family in Germany
and Australia for continuously supporting me throughout all my personal and
Table 1-1. Nominal power (MW) of planned installations of large-scale energy storage listed by technology group and selected project location. Adapted from the World Energy Resources E-Storage Report 2016 of the World Energy Council, UK, London.[4] ................... 3
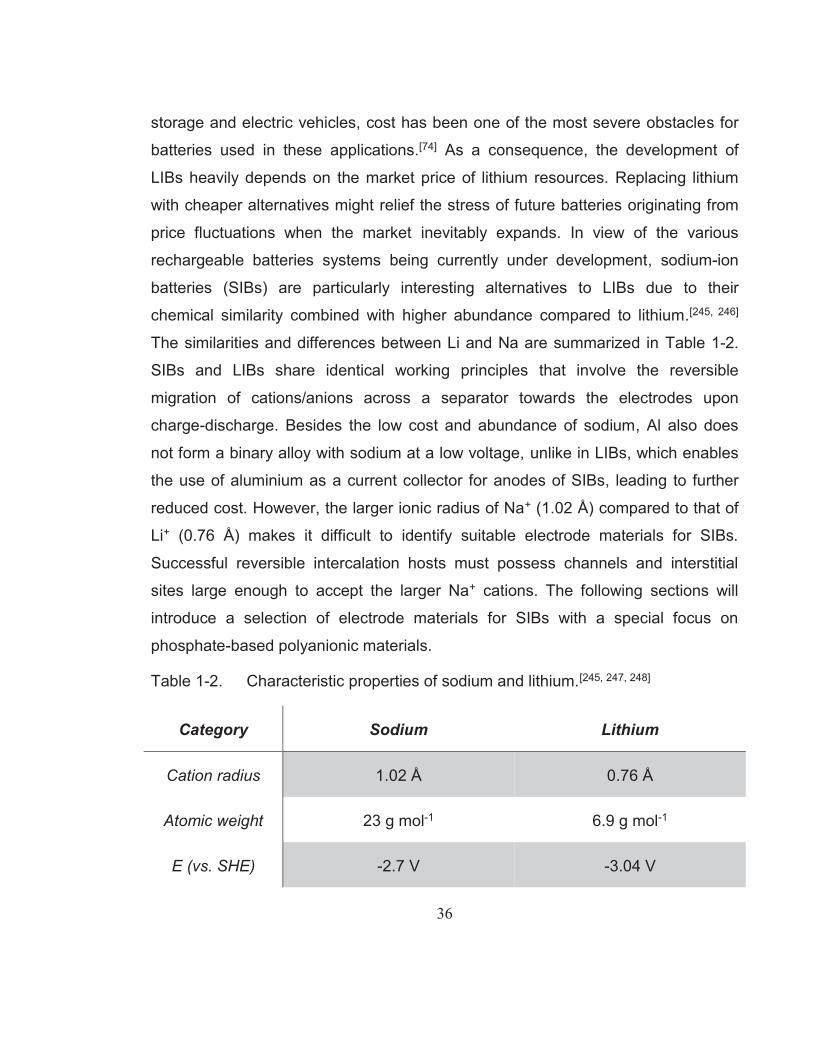
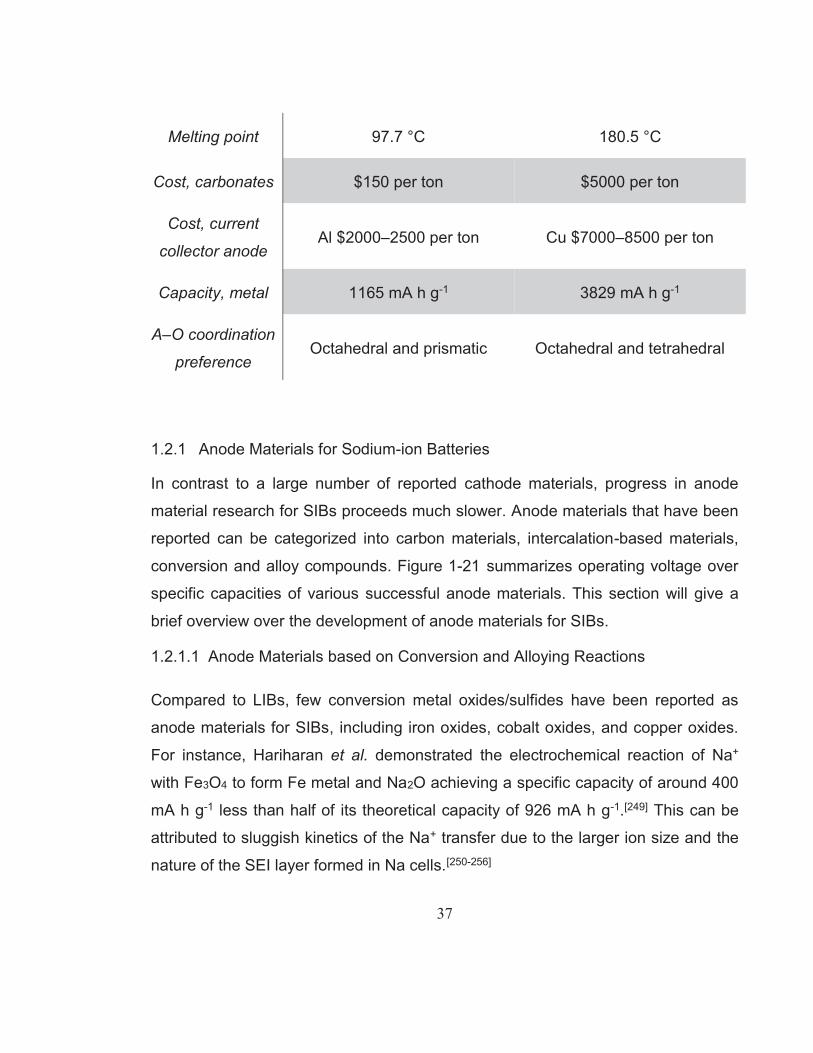
Table 1-2. Characteristic properties of sodium and lithium.[245, 247, 248] ................ 36Table 1-3. Summary of properties of typical metal, metalloid, and non-metal
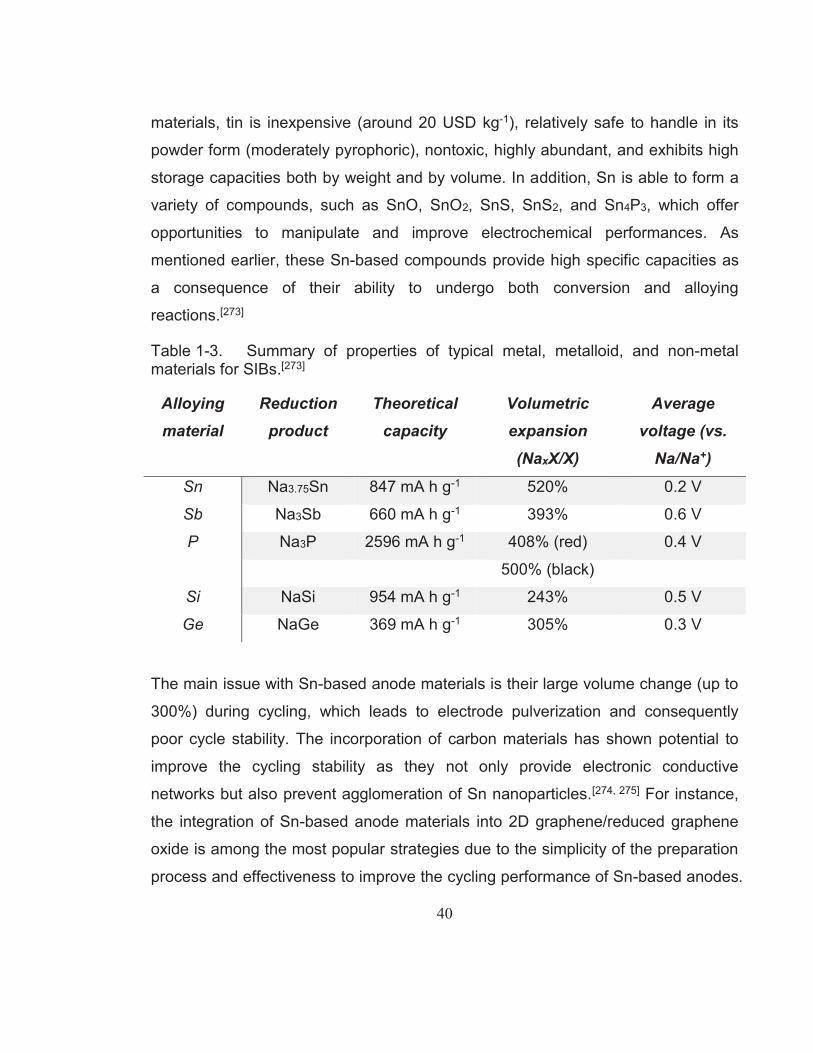
materials for SIBs.[273] ........................................................................ 40Table 1-4. A selection of reported MAX phases.[309] ........................................... 43Table 2-1. List of chemicals used in this research project. ................................. 54Table 4-1. Rate performance and cycling stability test results of LiFePO4
prepared for the feed rate optimization (top 3) and the samples
XI
prepared for the inlet temperature optimization (bottom 3). Marked in green are the best results of each starting material. ...................... 94
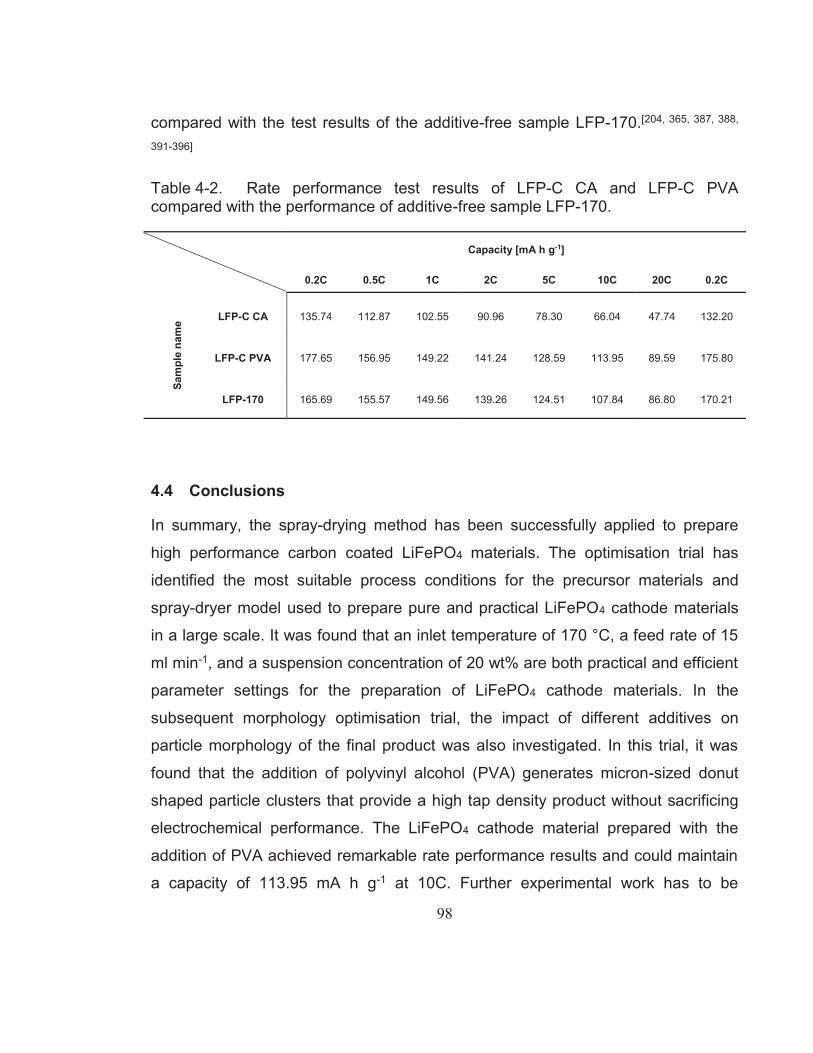
Table 4-2. Rate performance test results of LFP-C CA and LFP-C PVA compared with the performance of additive-free sample LFP-170. ... 98
LIST OF FIGURES
Figure 1-1. (a) Categorisation of available energy storage technologies. (CAES is Compressed Air Energy Storage, LAES is Liquid Air Energy Storage, SNG is Synthetic Natural Gas) Adapted from the World Energy Resources E-Storage Report 2016 of the World Energy Council, UK, London.[4] (b) General comparison of discharge time and power rating for various EES technologies.[2-5] (SMES is Superconducting Magnetic Energy Storage) The comparison is indicative only as several technologies may provide broader power ratings and longer discharge times. Reproduced with permission.[3] Copyright 2017, Woodbank Communications Ltd, Chester (UK). ................................................................................ 2
Figure 1-2. (a) Schematic diagram of the lithium intercalation–de-intercalation reaction mechanism in rechargeable LIBs containing solid electrodes and a liquid electrolyte. (b) Relative energy diagram of electrode potentials and electrolyte energy gap in LIBs. Reproduced with permission.[15] Copyright 2015, The Royal Chemical Society. ................................................................................ 5
Figure 1-3. Diagram illustrating the average capacities and electrochemical potentials of important cathode and anode materials with respect to Li metal and the cell voltage of LIBs. The electrode materials are represented based on their reaction mechanism in the presence of Li+.[17] ................................................................................ 6
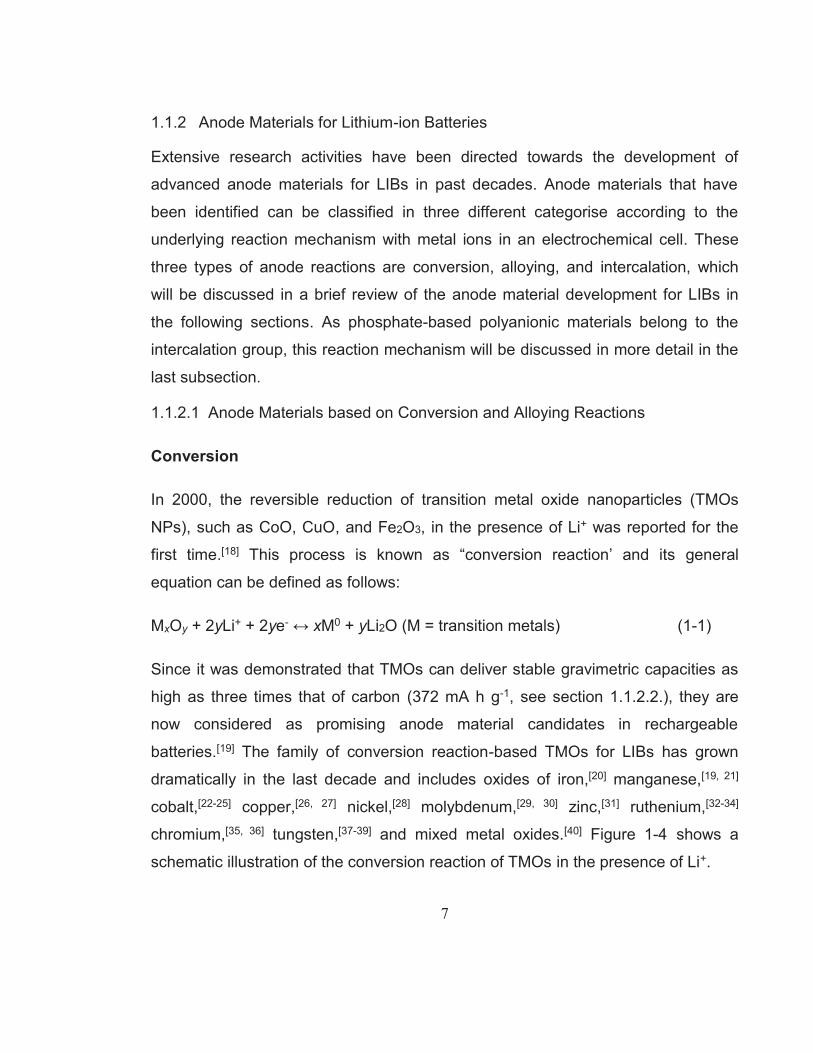
Figure 1-4. Schematic illustration of the conversion reaction of a transition metal oxide in LIBs. Reproduced with permission.[40] Copyright 2016, WILEY-VCH Verlag GmbH & Co. KGaA, Weinheim. ................. 8
Figure 1-5. (a) Availability and (b) capacities of elements that may host Li as electrodes. Elements with abundance (as fraction of Earth's crust) below 10−5 are slightly faded, and elements below 10−7 are faded further. Gravimetric and volumetric capacities are theoretical values calculated based on delithiated mass and lithiated volume.[17] .......................................................................................... 10
Figure 1-6. Schematic representation showing insertion/extraction of Li+ during discharge/charge. Adapted and reproduced with permission.[74] Copyright 2008, Nature Publishing Group. ................. 11
XII
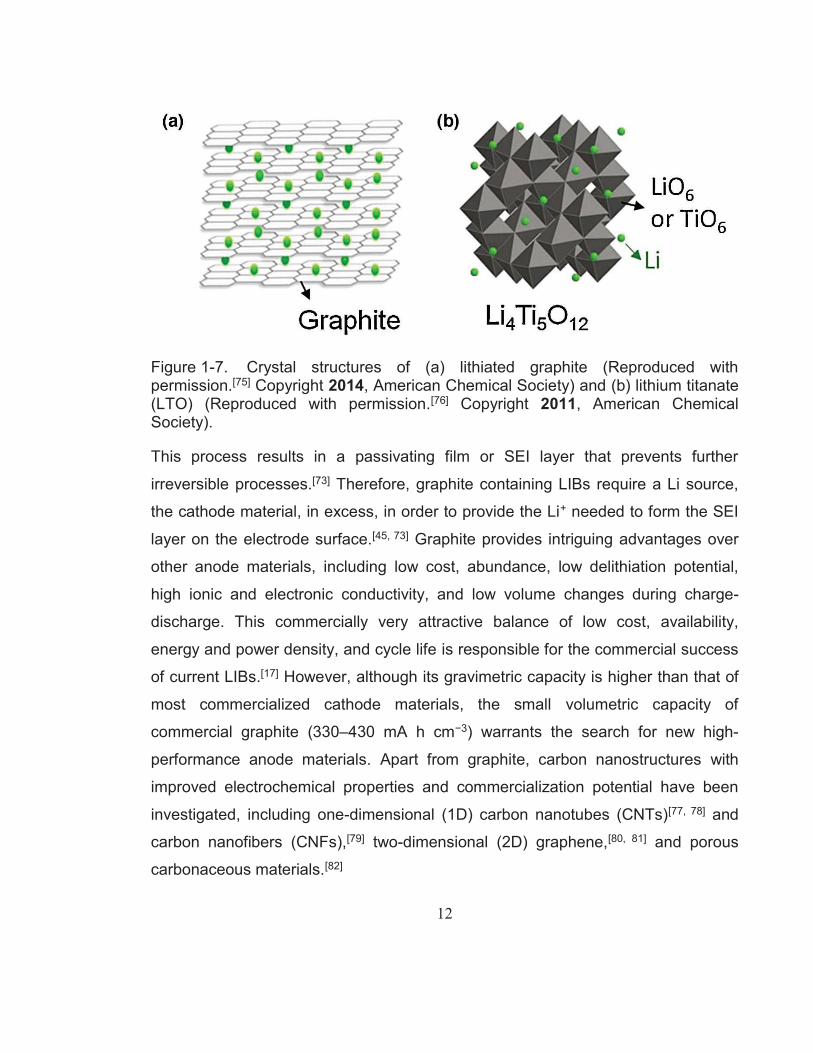
Figure 1-7. Crystal structures of (a) lithiated graphite (Reproduced with permission.[75] Copyright 2014, American Chemical Society) and (b) lithium titanate (LTO) (Reproduced with permission.[76] Copyright 2011, American Chemical Society). .................................. 12
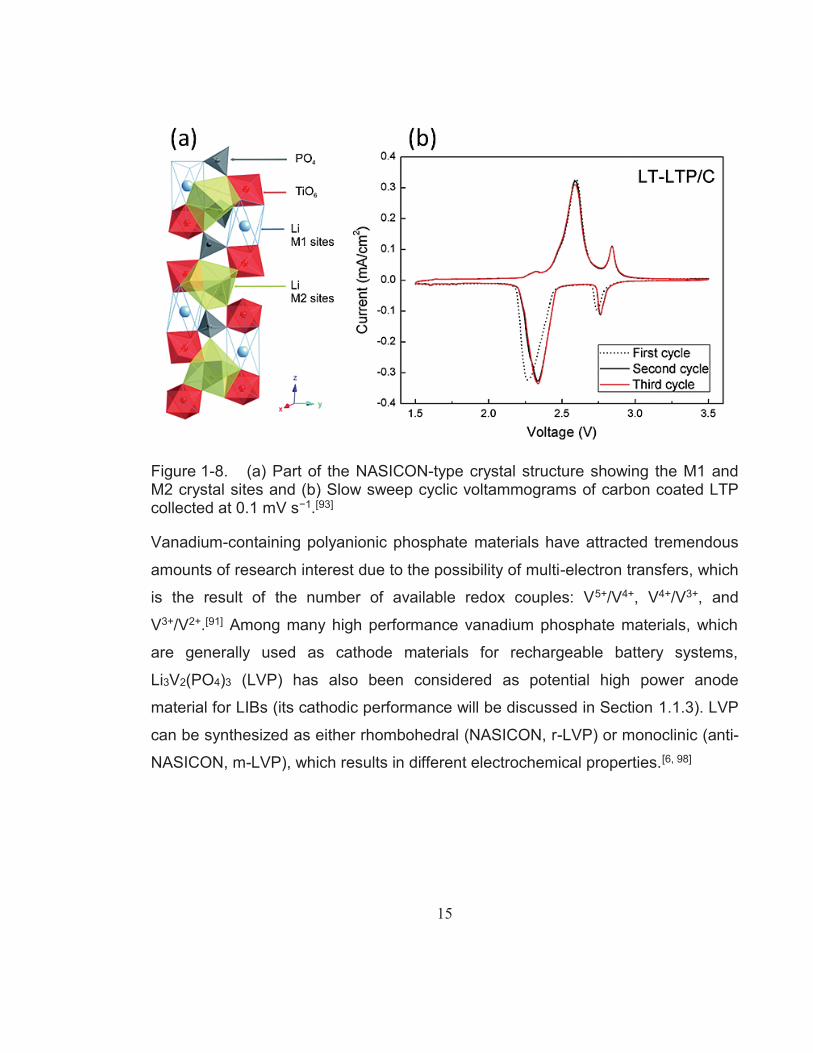
Figure 1-8. (a) Part of the NASICON-type crystal structure showing the M1 and M2 crystal sites and (b) Slow sweep cyclic voltammograms of carbon coated LTP collected at 0.1 mV s−1.[93]................................... 15
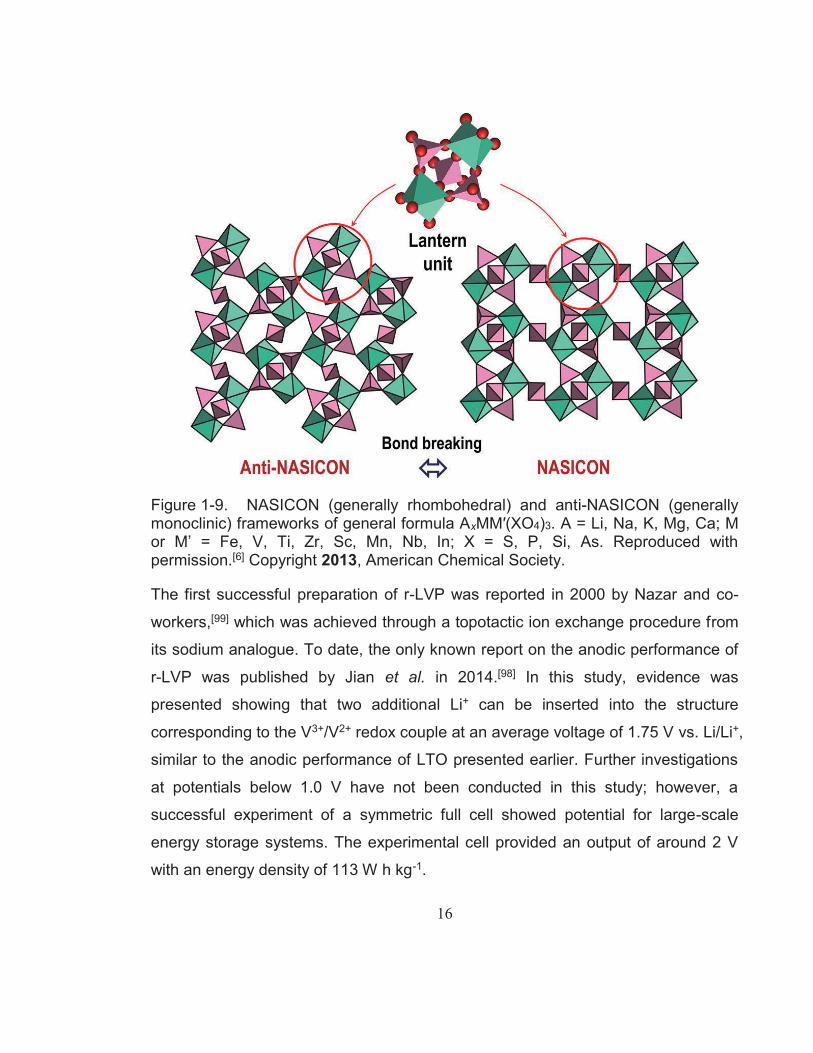
Figure 1-9. NASICON (generally rhombohedral) and anti-NASICON (generally monoclinic) frameworks of general formula AxMM(XO4)3. A = Li, Na, K, Mg, Ca; M or M’ = Fe, V, Ti, Zr, Sc, Mn, Nb, In; X = S, P, Si, As. Reproduced with permission.[6] Copyright 2013, American Chemical Society. .................................................... 16
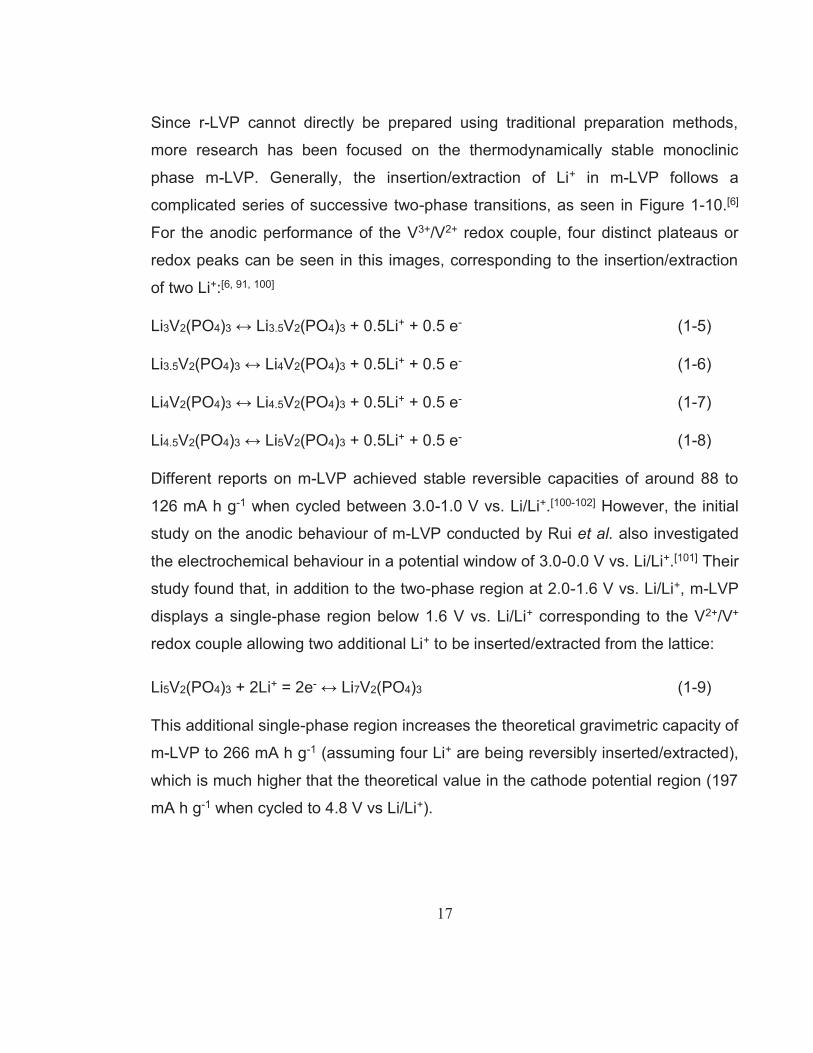
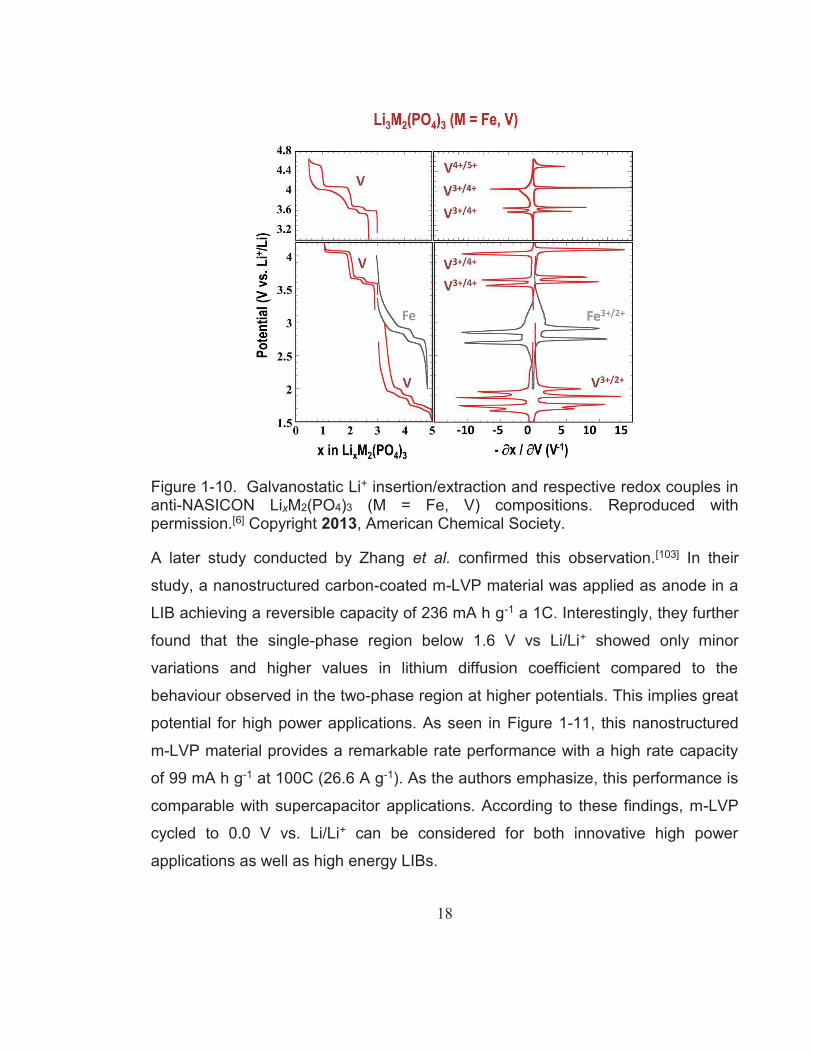
Figure 1-10. Galvanostatic Li+ insertion/extraction and respective redox couples in anti-NASICON LixM2(PO4)3 (M = Fe, V) compositions. Reproduced with permission.[6] Copyright 2013, American Chemical Society. .............................................................................. 18
Figure 1-11. Rate performance of m-LVP cycled in the potential range of 3.0–0.0 V vs. Li/Li+. (a) Delithiation capacity retention. (b) Corresponding potential profiles.[103] .................................................. 19
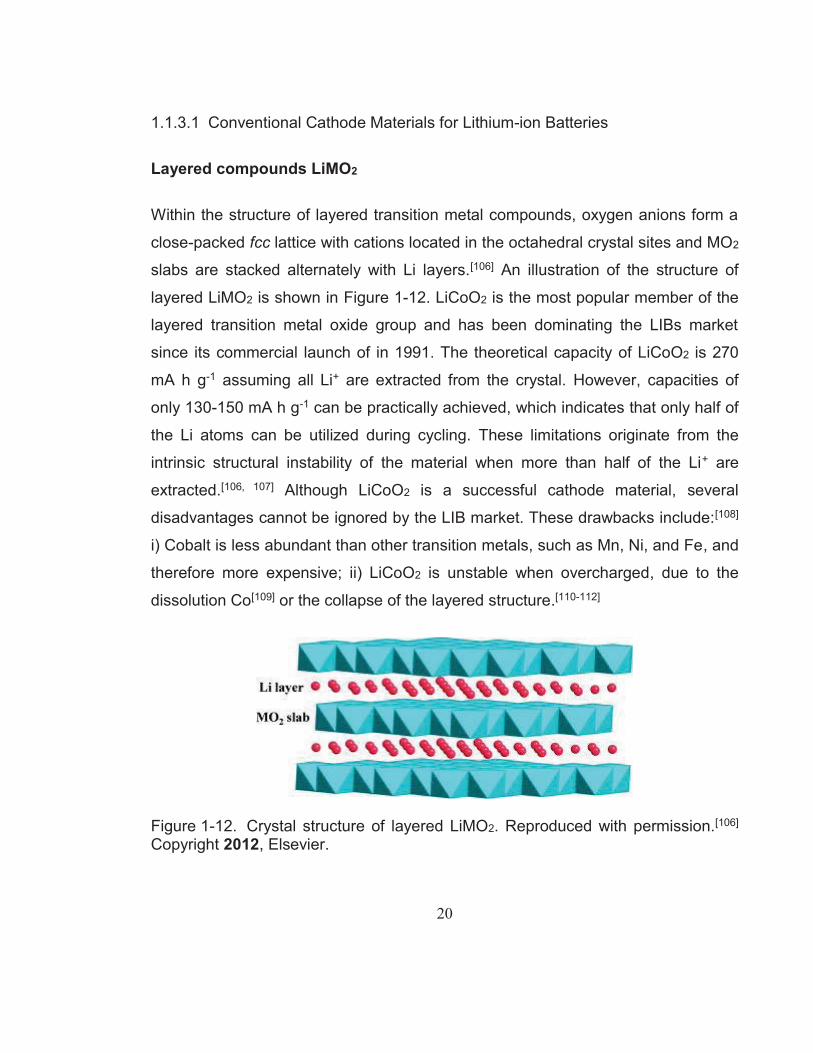
Figure 1-12. Crystal structure of layered LiMO2. Reproduced with permission.[106] Copyright 2012, Elsevier. .......................................... 20
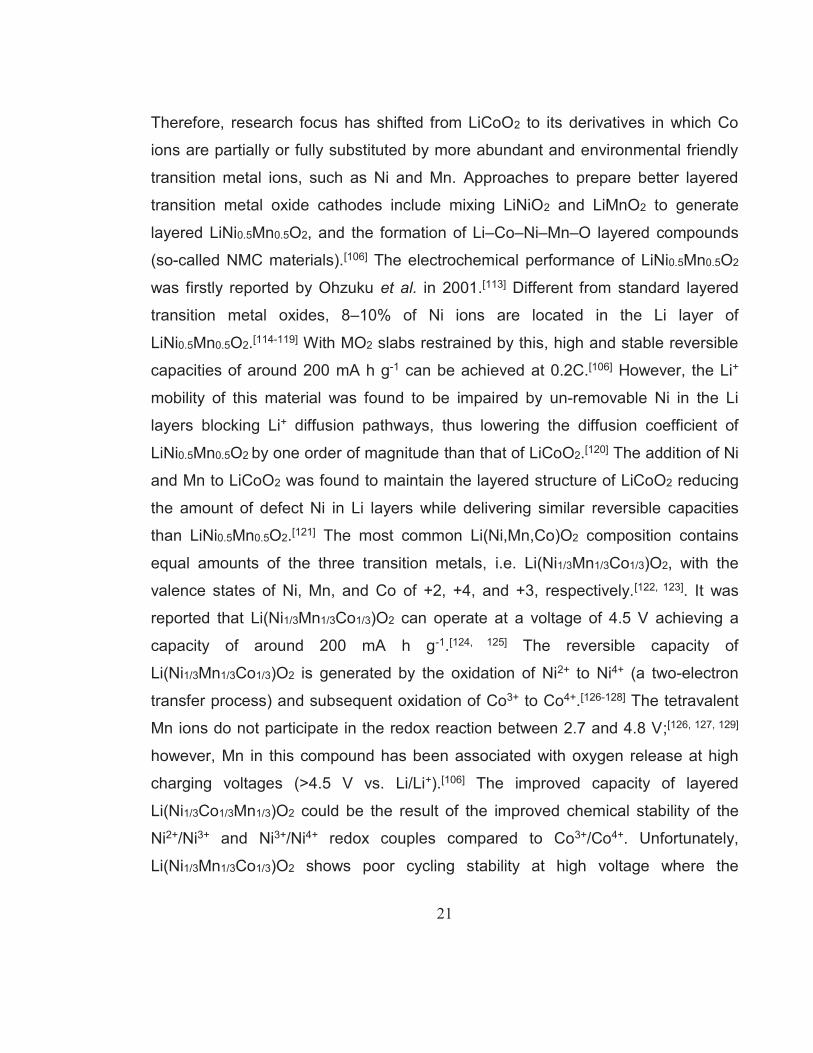
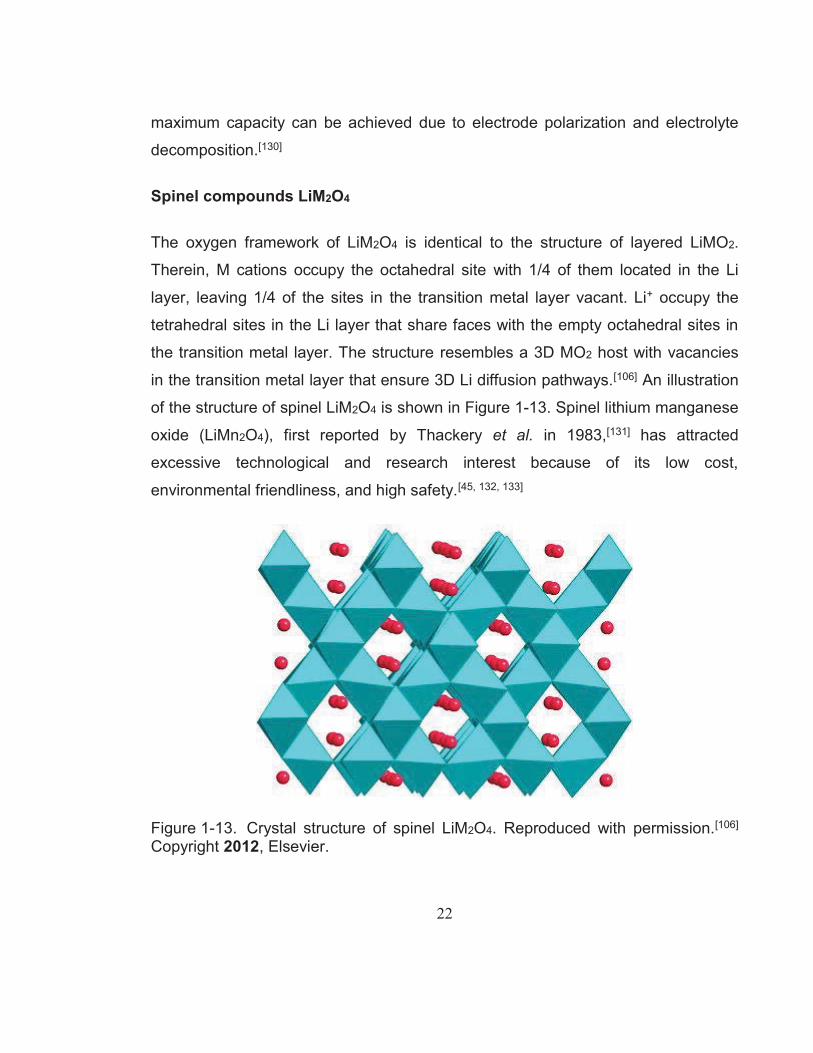
Figure 1-13. Crystal structure of spinel LiM2O4. Reproduced with permission.[106] Copyright 2012, Elsevier. .......................................... 22
Figure 1-15. Illustration of the monoclinic LiMBO3 (M = 3d metals) family crystal structure showing corrugated MO5 chains along c-axis connected by planar BO3 units. Reproduced with permission.[173] Copyright 2015, Springer Berlin Heidelberg. ...................................................... 26
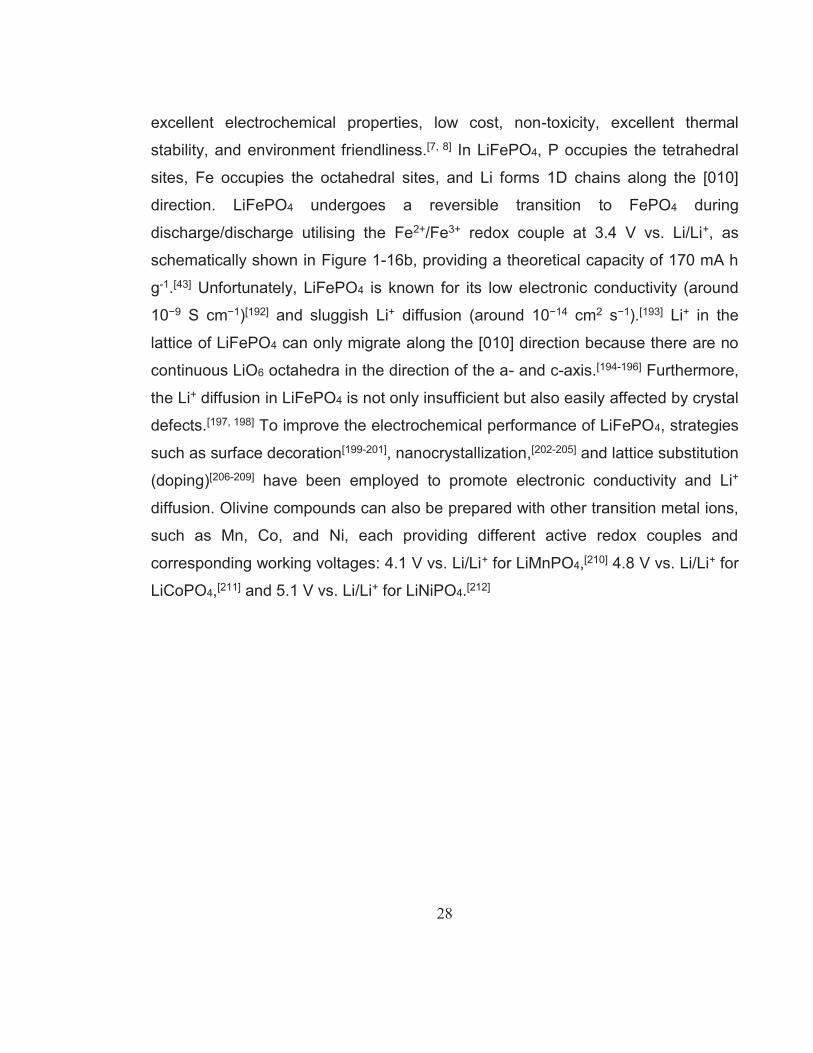
Figure 1-16. (a) Crystal structure of olivine LiMPO4 (blue: transition metal ions; yellow: P ions; red: Li ions) Reproduced with permission.[106] Copyright 2012, Elsevier. (b) Schematic representation of the processes during charge/discharge of LiFePO4. Reproduced with permission.[43] Copyright 2008, WILEY-VCH Verlag GmbH & Co. KGaA, Weinheim. .............................................................................. 29
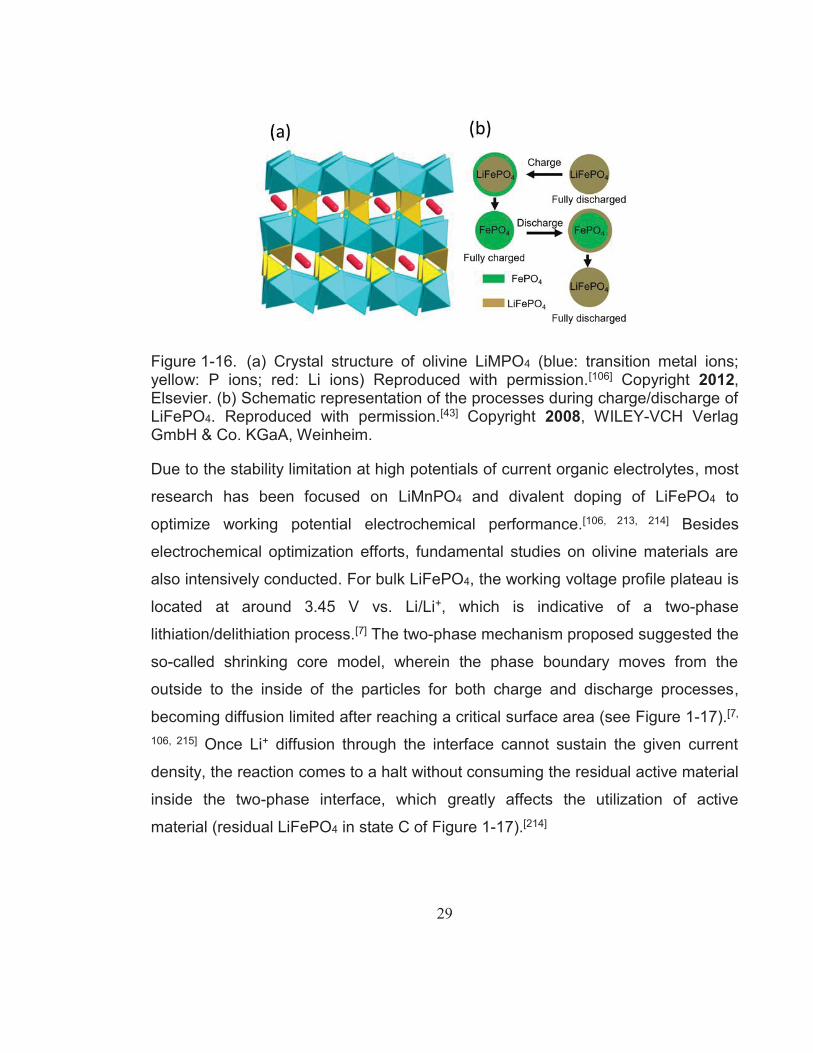
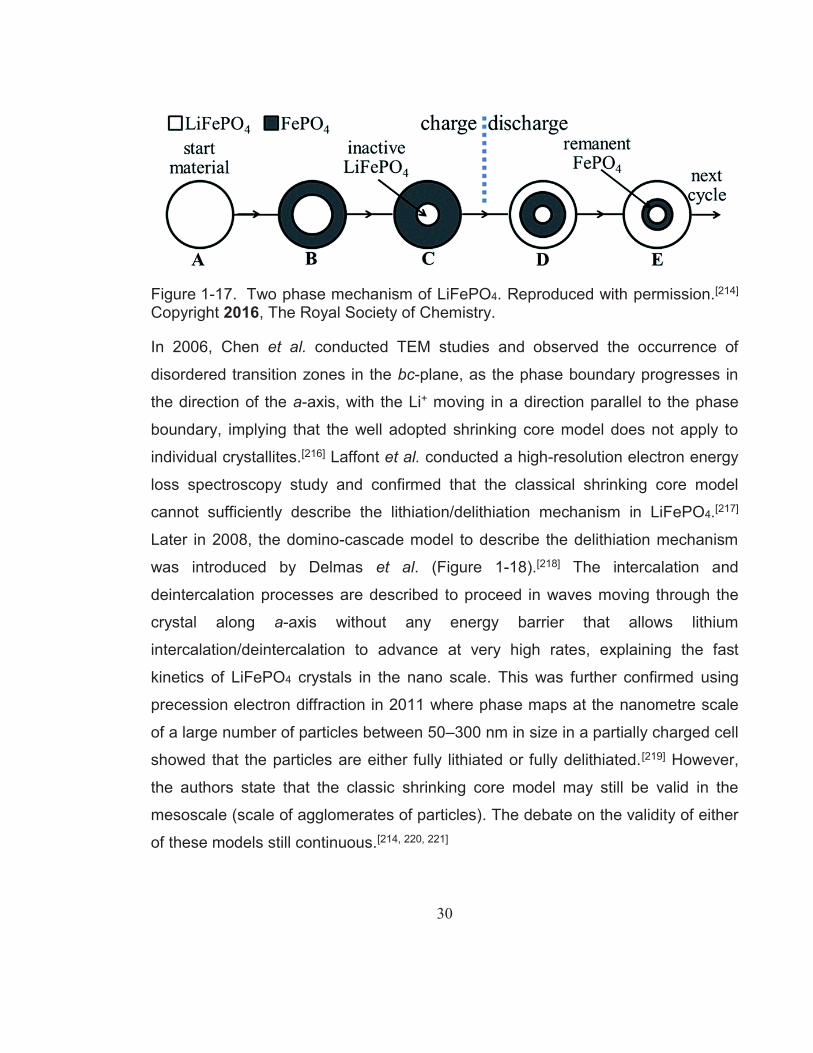
Figure 1-17. Two phase mechanism of LiFePO4. Reproduced with permission.[214] Copyright 2016, The Royal Society of Chemistry. ..... 30
Figure 1-18. (a) Scheme showing a view of the strains occurring during lithium deintercalation. (b) Layered view of the lithium deintercalation/intercalation mechanism in a LiFePO4 crystallite.
XIII
Reproduced with permission. [218] Copyright 2008, Nature Publishing Group. .............................................................................. 31
Figure 1-19. Schematic illustration of the tavorite structure along the b-crystallographic direction. Reproduced with permission.[222] Copyright 2013, American Chemical Society. .................................... 32
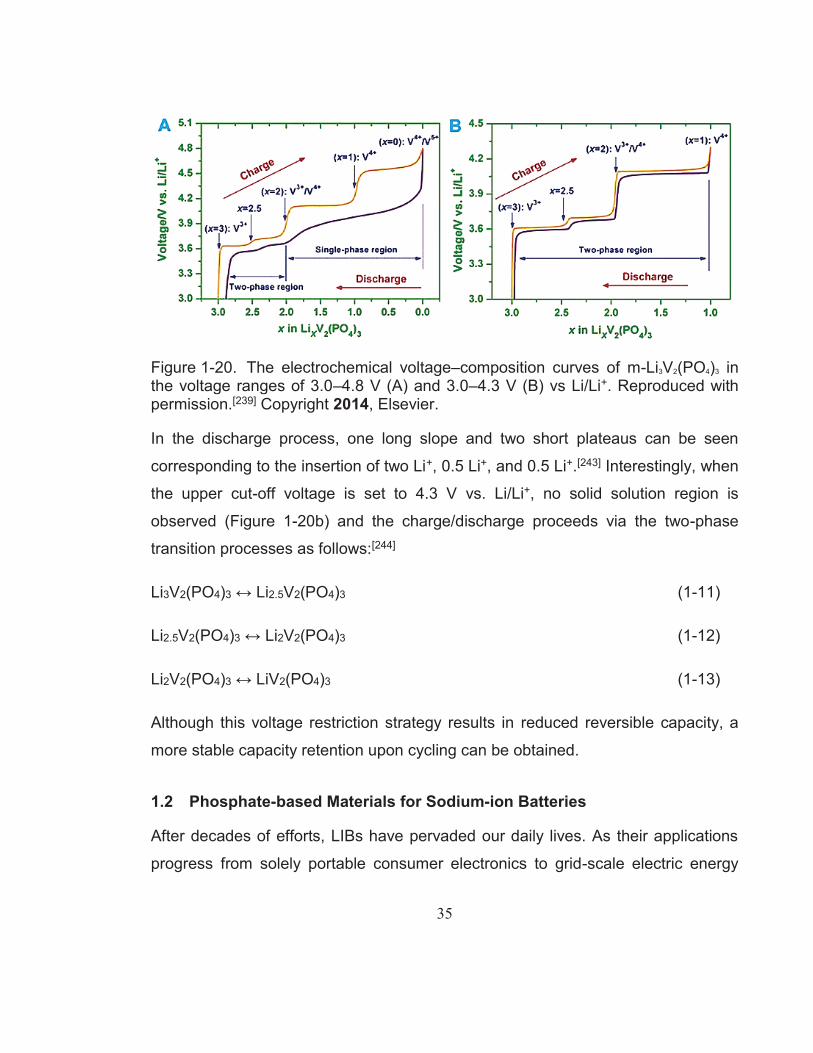
Figure 1-20. The electrochemical voltage–composition curves of m-Li3V2(PO4)3 in the voltage ranges of 3.0–4.8 V (A) and 3.0–4.3 V (B) vs Li/Li+. Reproduced with permission.[239] Copyright 2014, Elsevier. .............. 35
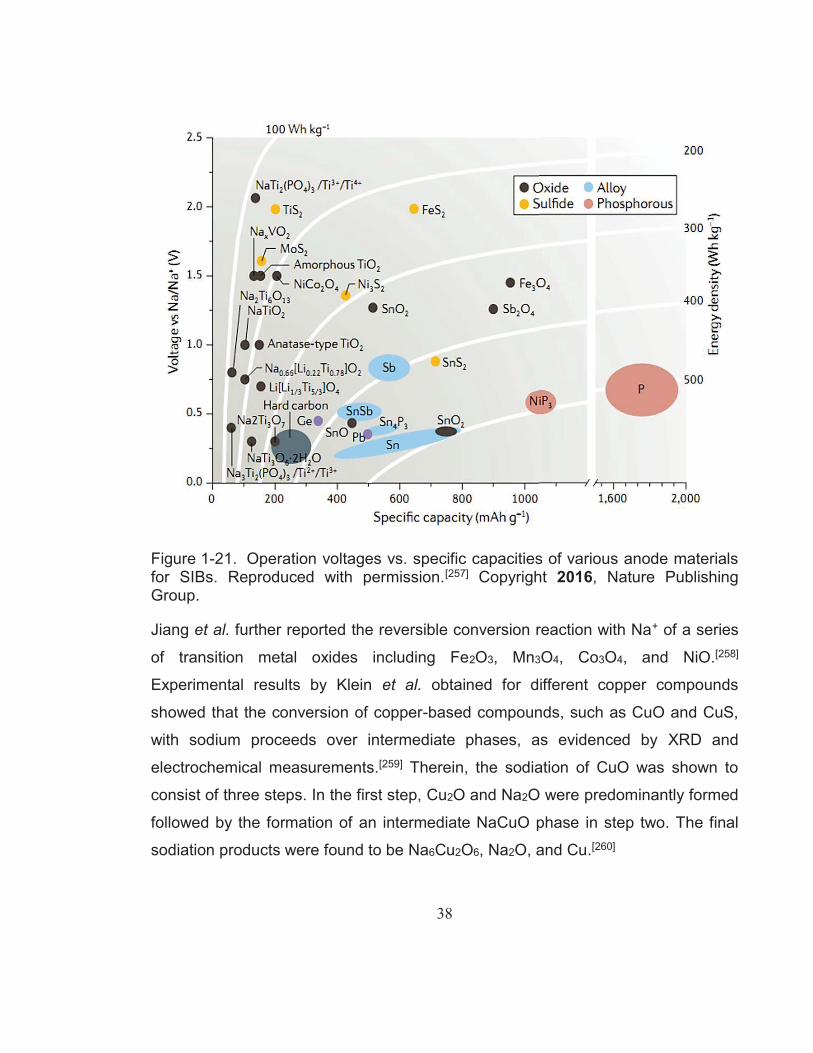
Figure 1-21. Operation voltages vs. specific capacities of various anode materials for SIBs. Reproduced with permission.[257] Copyright 2016, Nature Publishing Group. ........................................................ 38
Figure 1-22. Calculated sodiation voltage profile (red dotted line) of Na3V2(PO4)3 in comparison to the experimentally determined voltage profile (blue solid line). Reproduced with permission.[320] Copyright 2015, Royal Society of Chemistry. .................................... 45
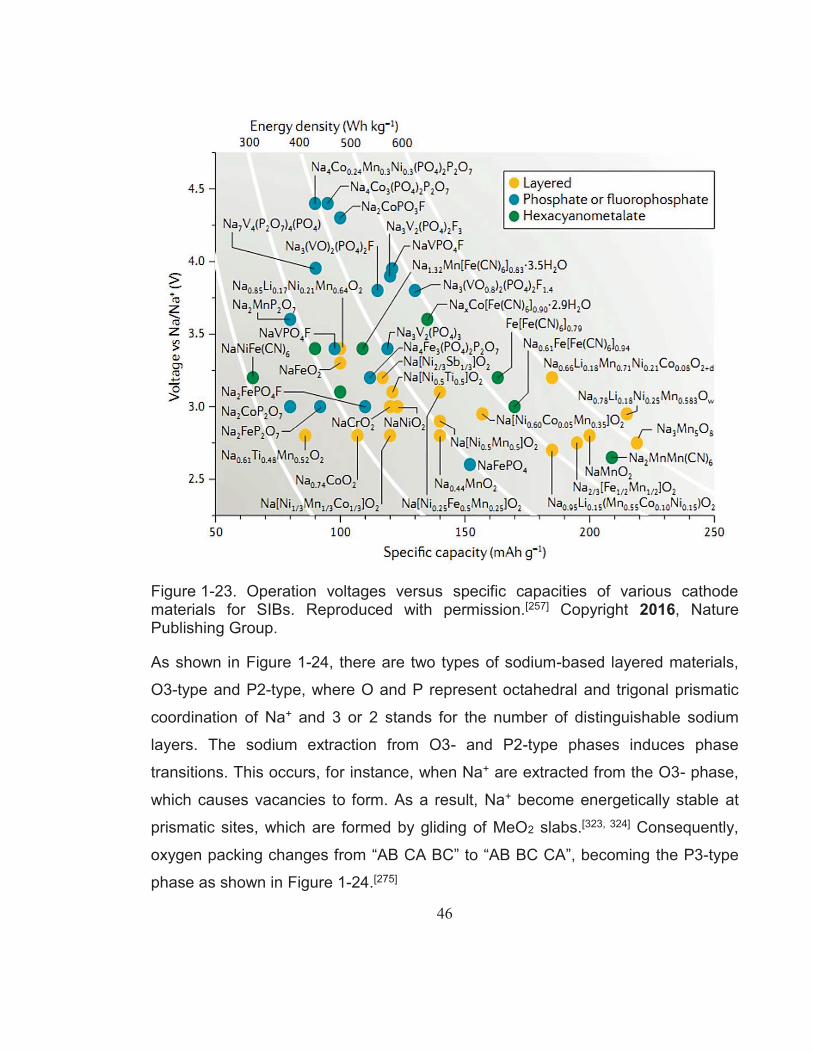
Figure 1-23. Operation voltages versus specific capacities of various cathode materials for SIBs. Reproduced with permission.[257] Copyright 2016, Nature Publishing Group. ........................................................ 46
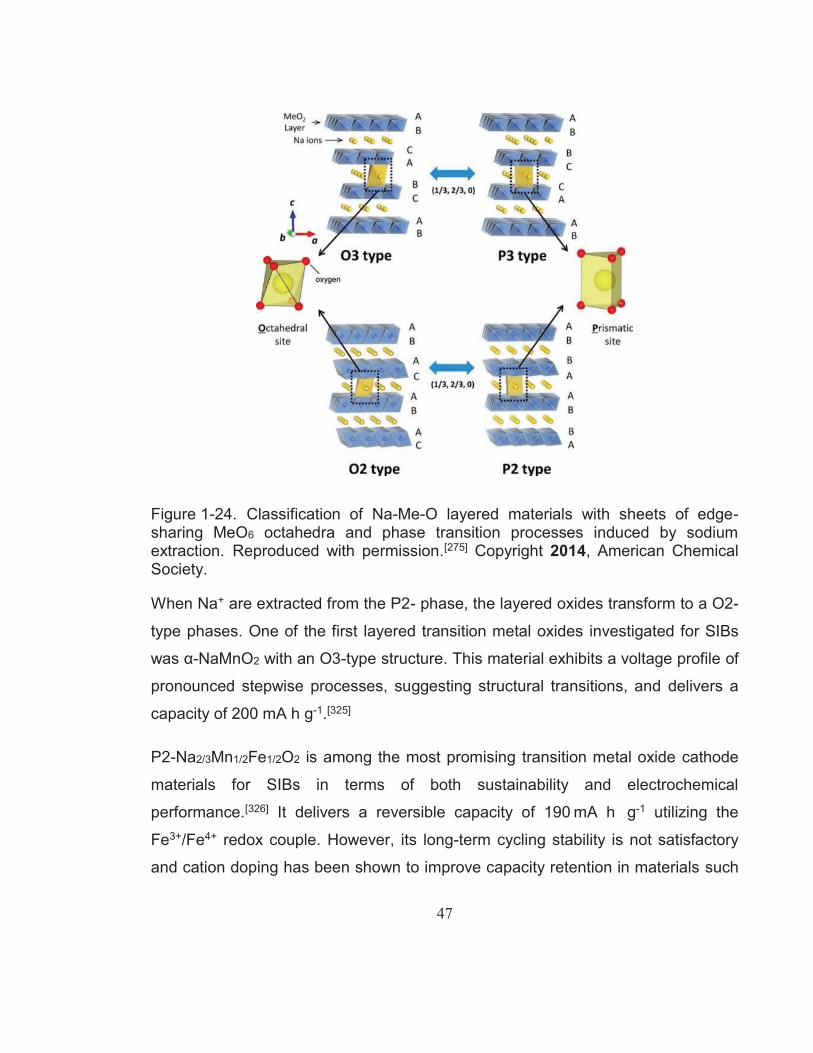
Figure 1-24. Classification of Na-Me-O layered materials with sheets of edge-sharing MeO6 octahedra and phase transition processes induced by sodium extraction. Reproduced with permission.[275] Copyright 2014, American Chemical Society. .................................................... 47
Figure 1-25. Framework of Prussian blue analogues. Reproduced with permission.[330] Copyright 2012, Royal Society of Chemistry. ............ 48
Figure 2-1. Experimental methods used in this research project ......................... 53Figure 2-2. Schematic Nyquist plot of the impedance spectrum obtained for
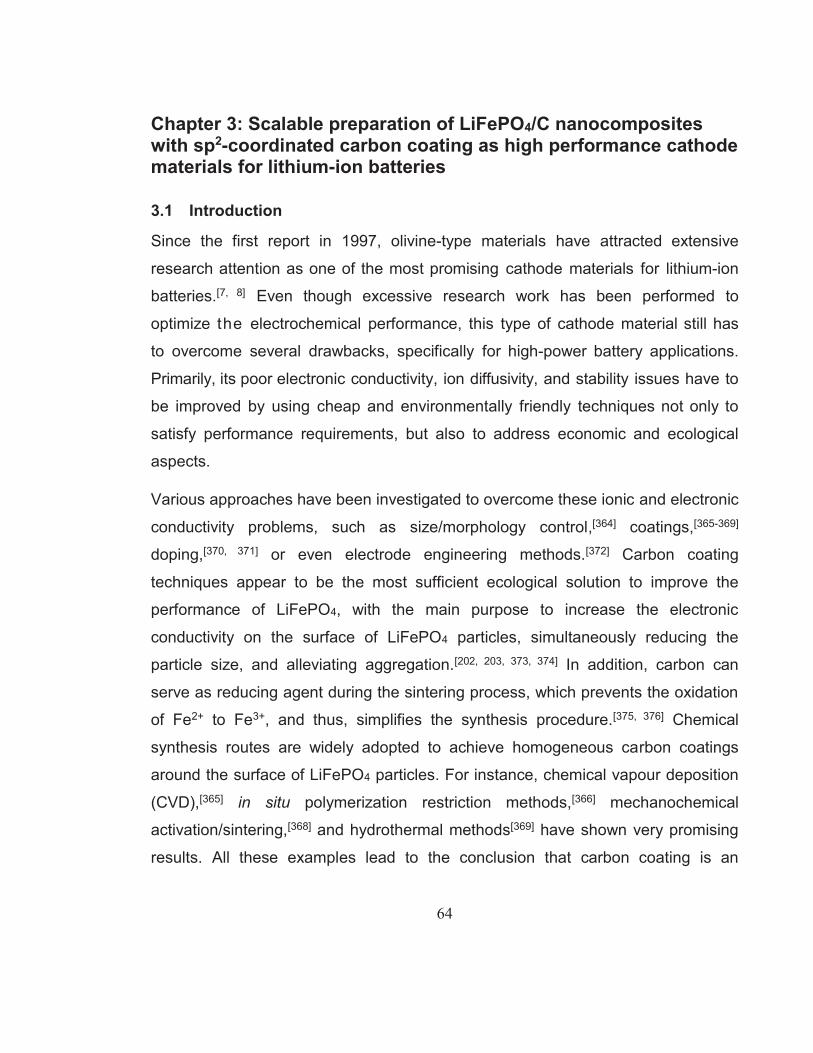
Figure 3-1. SEM images of LiFePO4/C prepared with (a) 5 wt%; (b) 8 wt%; (c) 10 wt%; (d) 15 wt%; (e) 18.5 wt%; (f) 20 wt% soluble starch. Marked with white arrows are some obvious agglomerations. ........... 68
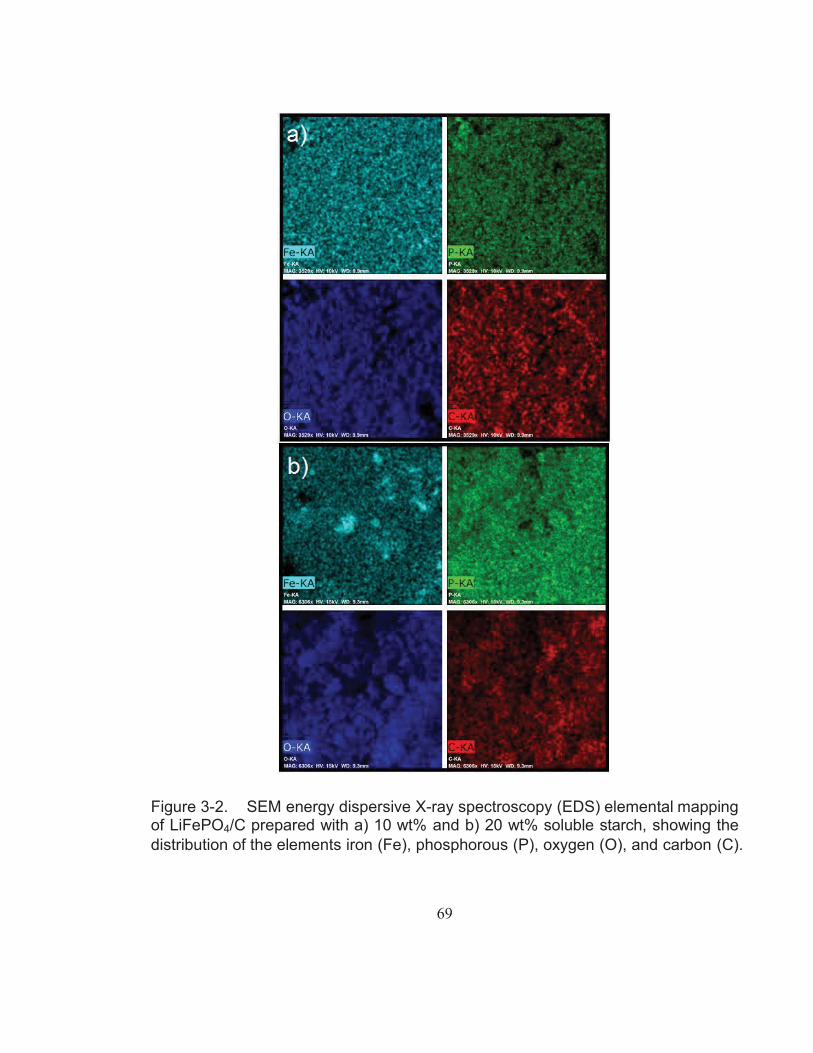
Figure 3-2. SEM energy dispersive X-ray spectroscopy (EDS) elemental mapping of LiFePO4/C prepared with a) 10 wt% and b) 20 wt% soluble starch, showing the distribution of the elements iron (Fe), phosphorous (P), oxygen (O), and carbon (C). .................................. 69
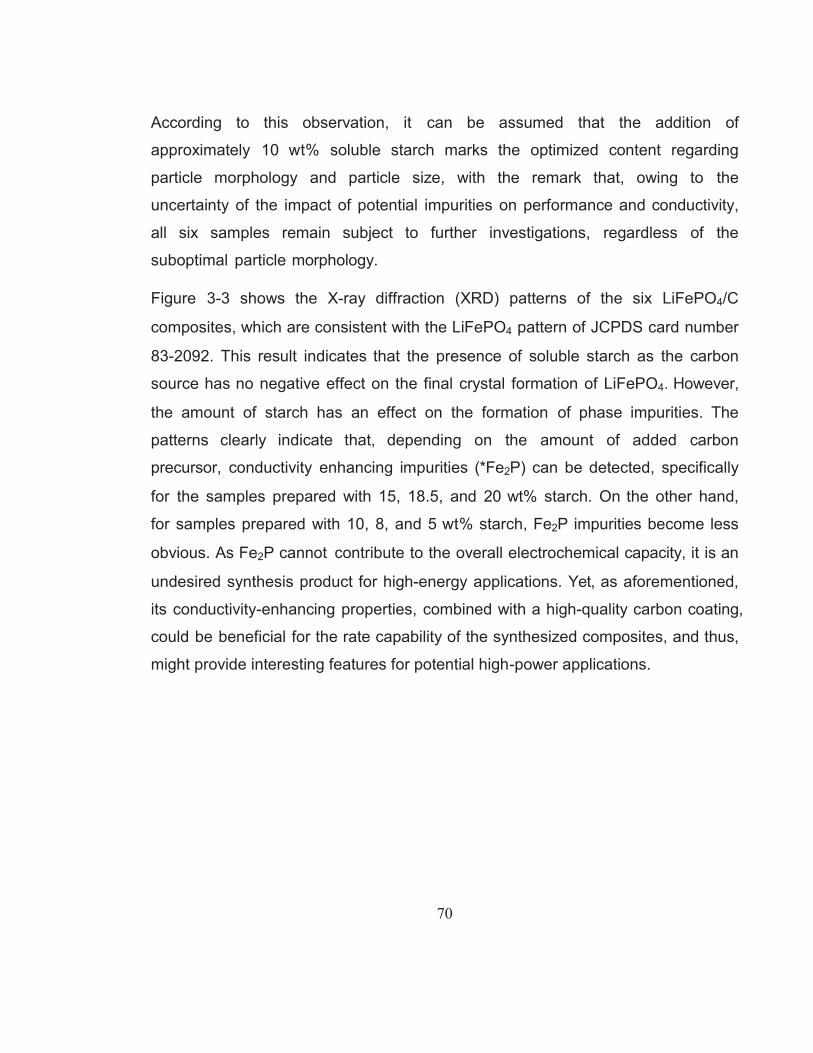
Figure 3-3. XRD patterns of LiFePO4/C prepared with 5-20 wt% soluble starch compared with calculated patterns of Fe2P and LiFePO4 (JPDS card number 83-2092). ........................................................... 71
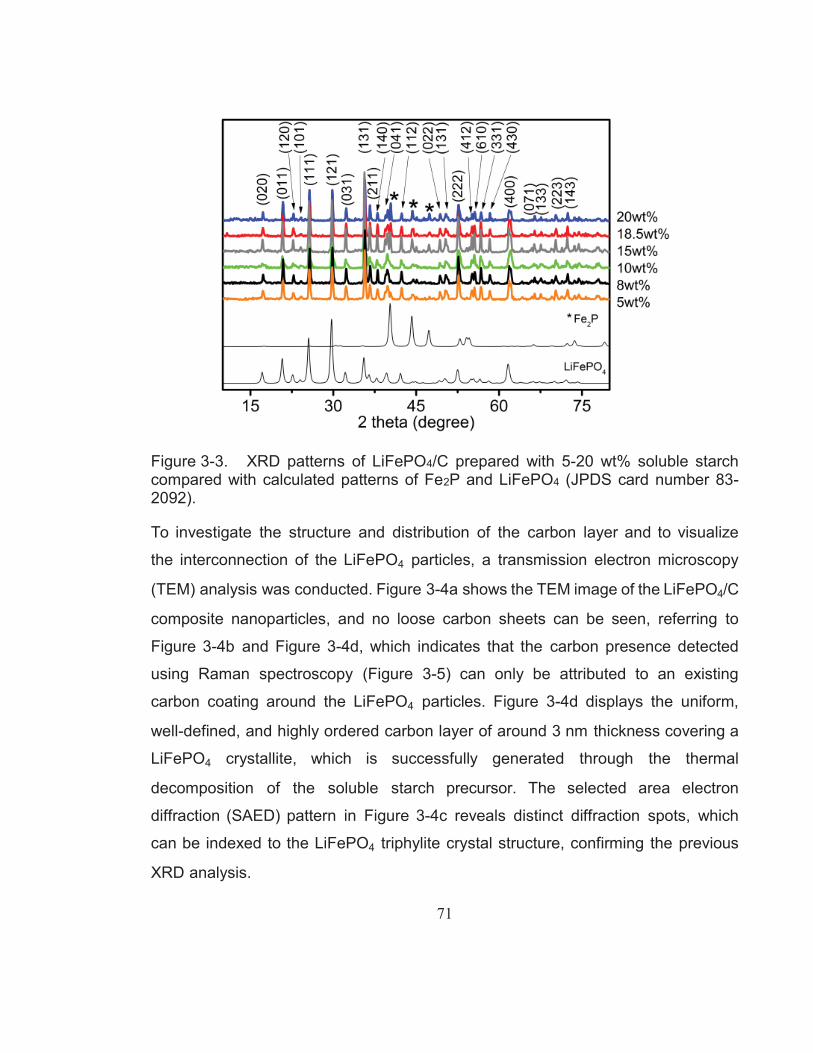
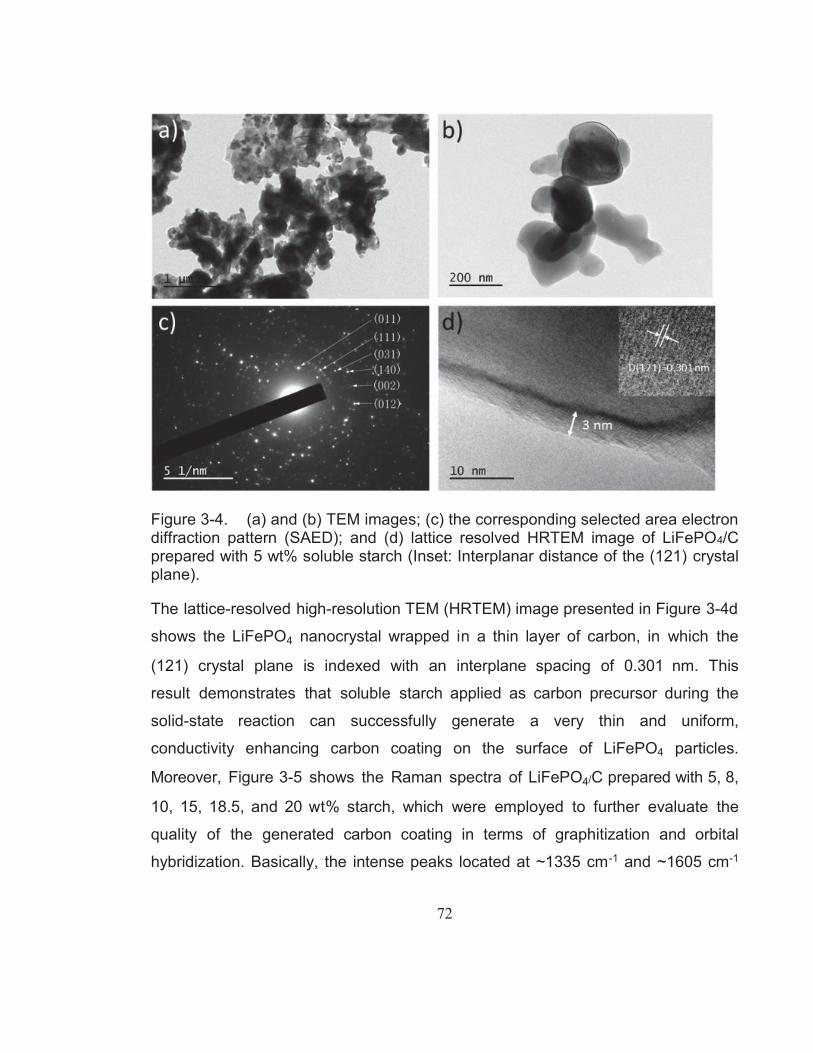
Figure 3-4. (a) and (b) TEM images; (c) the corresponding selected area electron diffraction pattern (SAED); and (d) lattice resolved
XIV
HRTEM image of LiFePO4/C prepared with 5 wt% soluble starch (Inset: Interplanar distance of the (121) crystal plane). ...................... 72
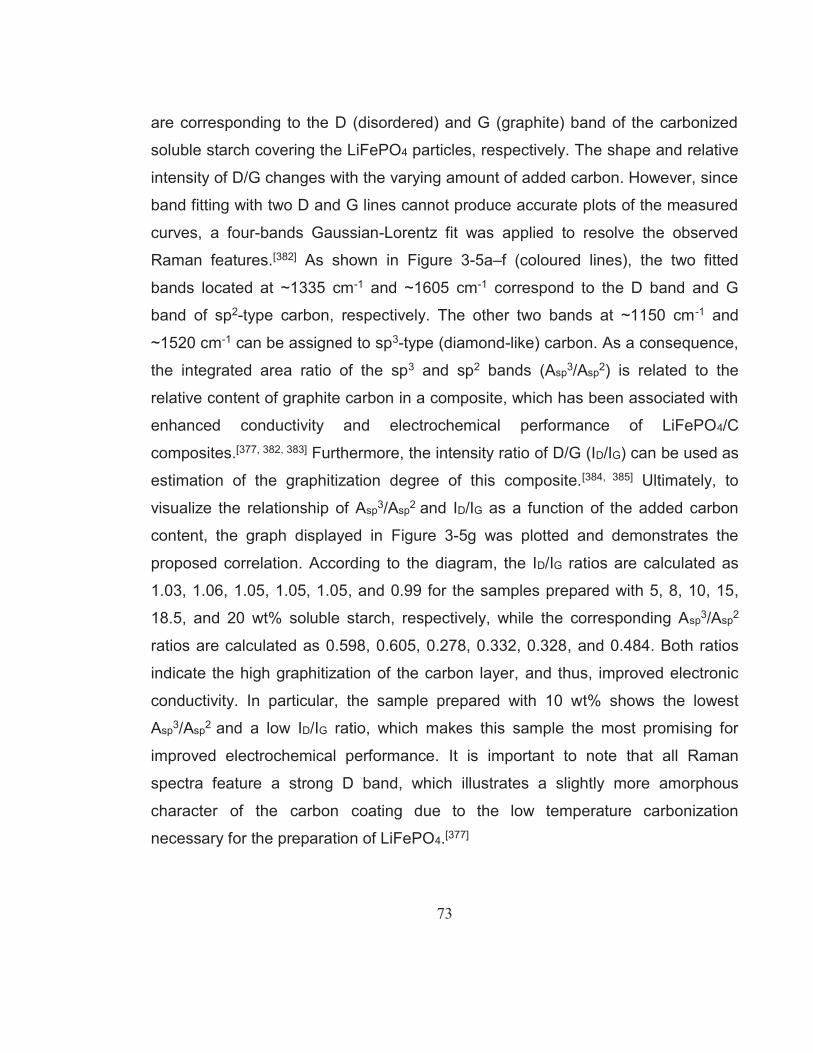
Figure 3-5. Raman spectra of LiFePO4/C prepared with (a) 5 wt%, (b) 8 wt%, (c) 10 wt%, (d) 15 wt%, (e) 18.5 wt%, and (f) 20 wt% soluble starch as carbon source. The two broad bands are resolved into four coloured lines; (g) shows the Asp3/Asp2 and ID/IG values as a function of the amount of added carbon precursor. ........................... 74
Figure 3-6. (a) Charge-discharge curves; (b) differential capacity analysis of LiFePO4/C prepared with 5-20 wt% soluble starch as carbon source (insets: differential capacity analysis in the voltage range 3.35 to 3.51 V and a list of the corresponding over-potential values for all six samples). ................................................................. 76
Figure 3-7. (a) Rate performance of LiFePO4/C prepared with 5-20 wt% soluble starch as the carbon source; (b) Specific energy and specific power of the sample prepared with 10 wt% soluble starch at different current rates; (c) Cycling performance of the sample prepared with 10, 15, and 18.5 wt% soluble starch (dis)charged at 10C for 300 cycles. ............................................................................ 78
Figure 3-8. The charge-discharge voltage curves of LiFePO4/C prepared with (a) 5 wt%, (b) 8 wt%, (c) 10 wt%, (d) 15 wt%, (e) 18.5 wt%, and (f) 20 wt% soluble starch as carbon source in the voltage range from 2.0 to 4.25 V at different current rates................................................. 80
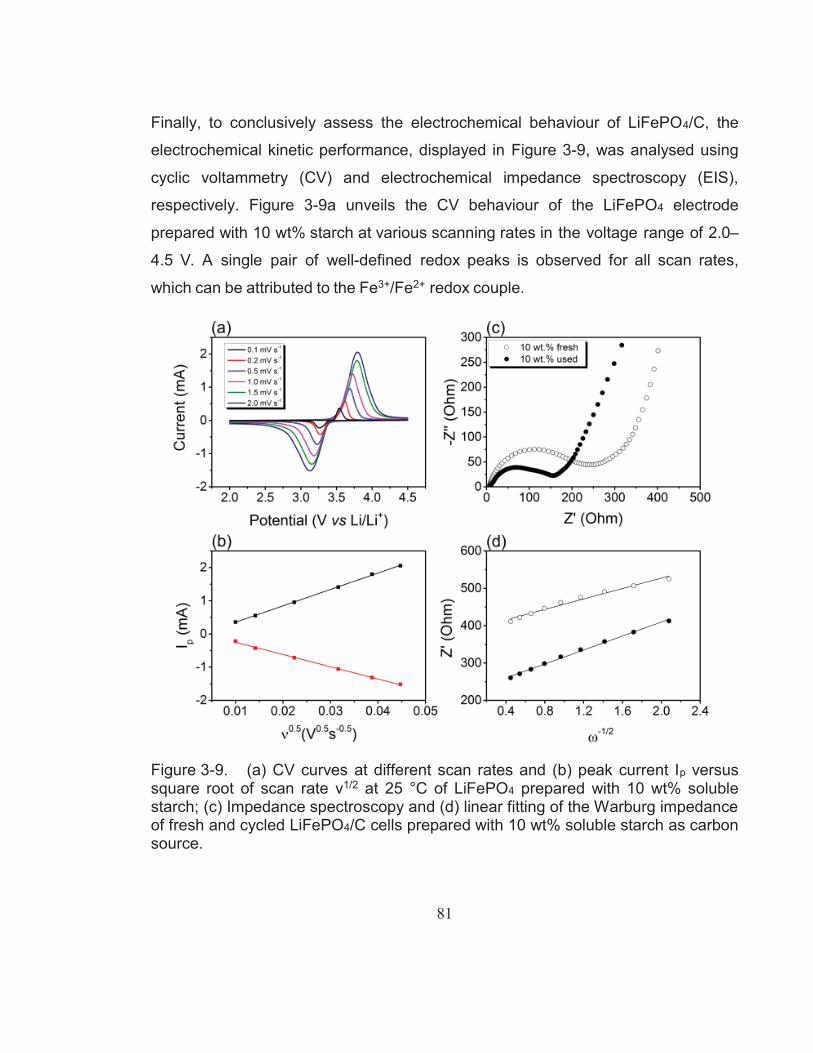
Figure 3-9. (a) CV curves at different scan rates and (b) peak current Ip versus square root of scan rate ν1/2 at 25 °C of LiFePO4 prepared with 10 wt% soluble starch; (c) Impedance spectroscopy and (d) linear fitting of the Warburg impedance of fresh and cycled LiFePO4/C cells prepared with 10 wt% soluble starch as carbon source. ............................................................................................... 81
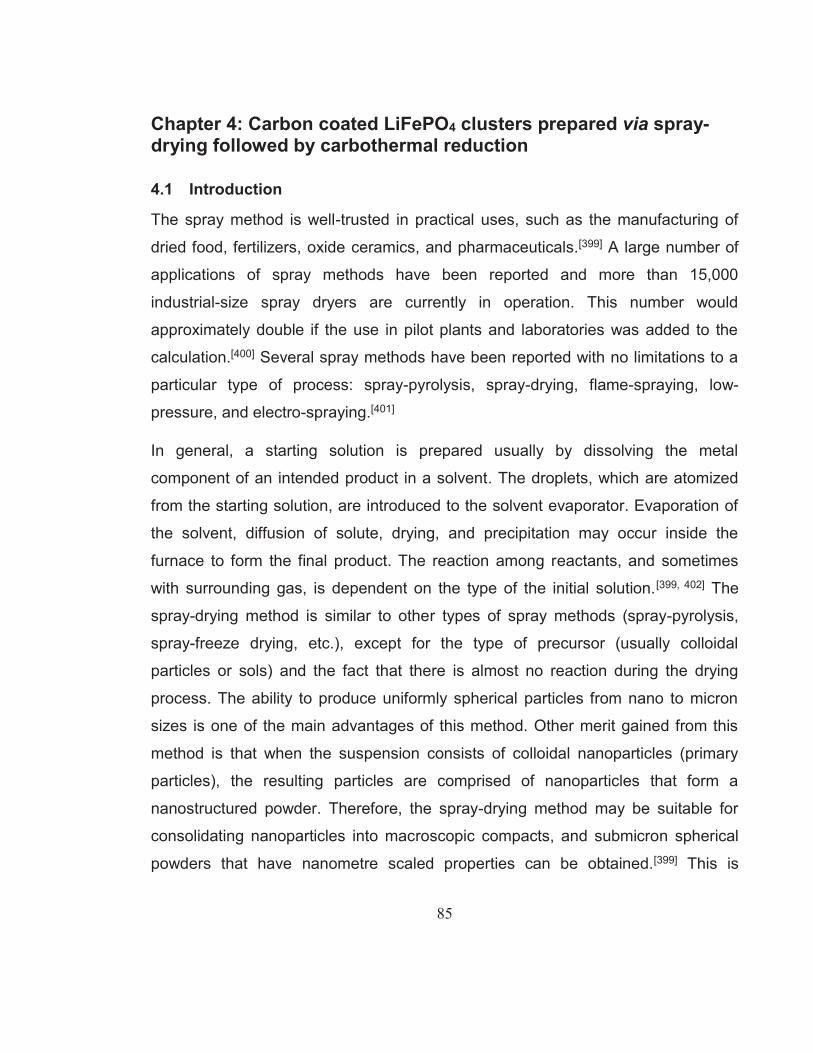
Figure 4-1. XRD patterns of (a) LFP-A10 – LFP-A60 and (b) LFP-150 – LFP-200. Both compared with the calculated pattern of JCPDS card number 83-2092 and Fe2P................................................................. 90
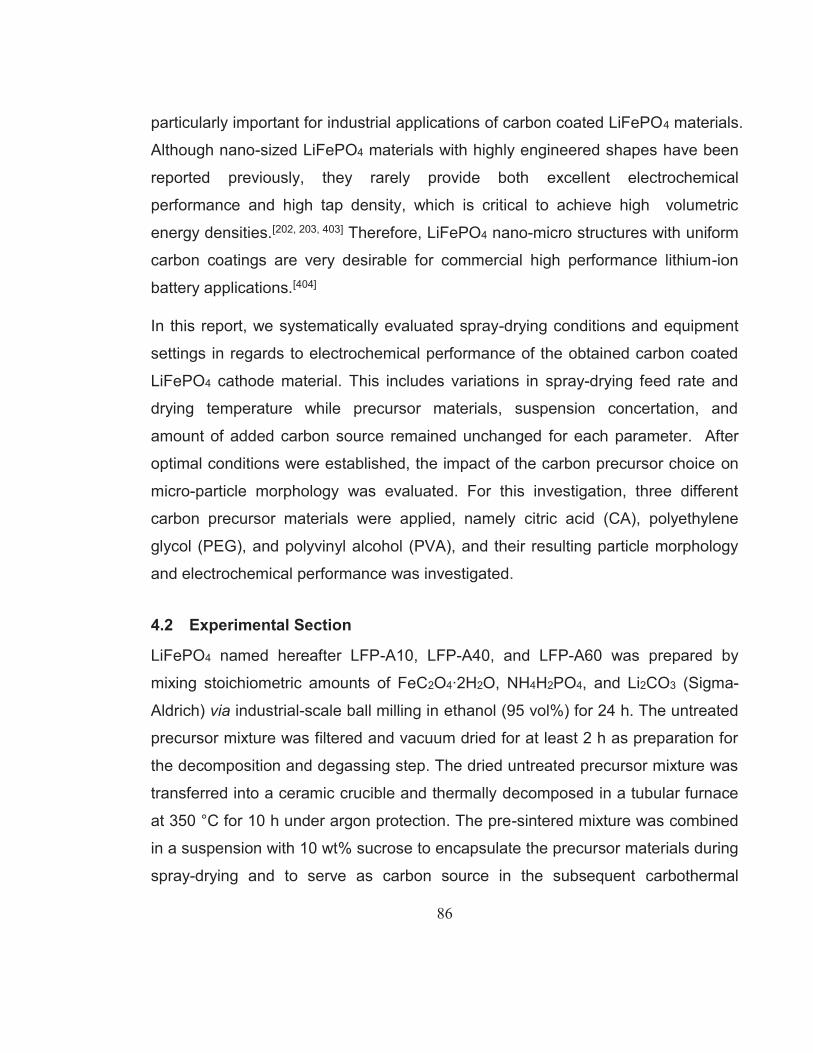
Figure 4-2. TGA curves of LFP-A60 compared to the TGA result of a carbon free LiFePO4 sample. ........................................................................ 90
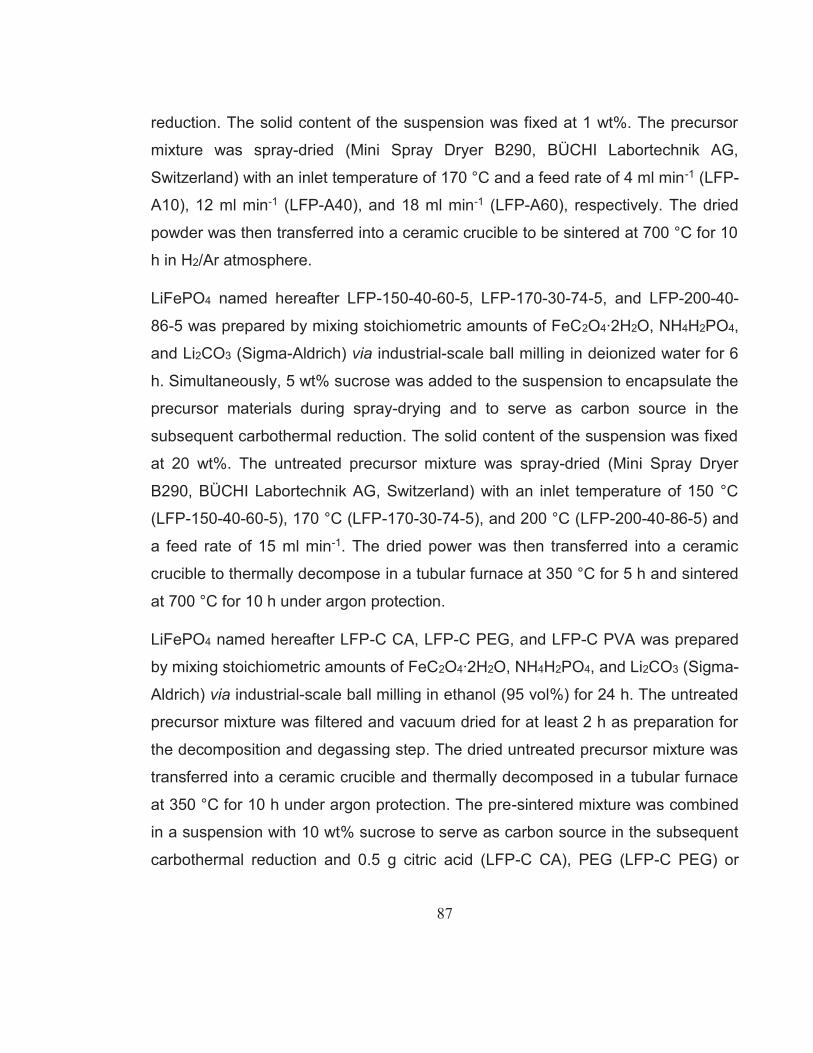
Figure 4-3. SEM images of (a) LFP-A10, (b) LFP-A40, (c) LFP-A60, (d) LFP-150-40-60-5, (e) LFP-170-30-74-5, and (f) LFP-200-40-86-5. Some obvious open pores are marked with white arrows. ................. 92
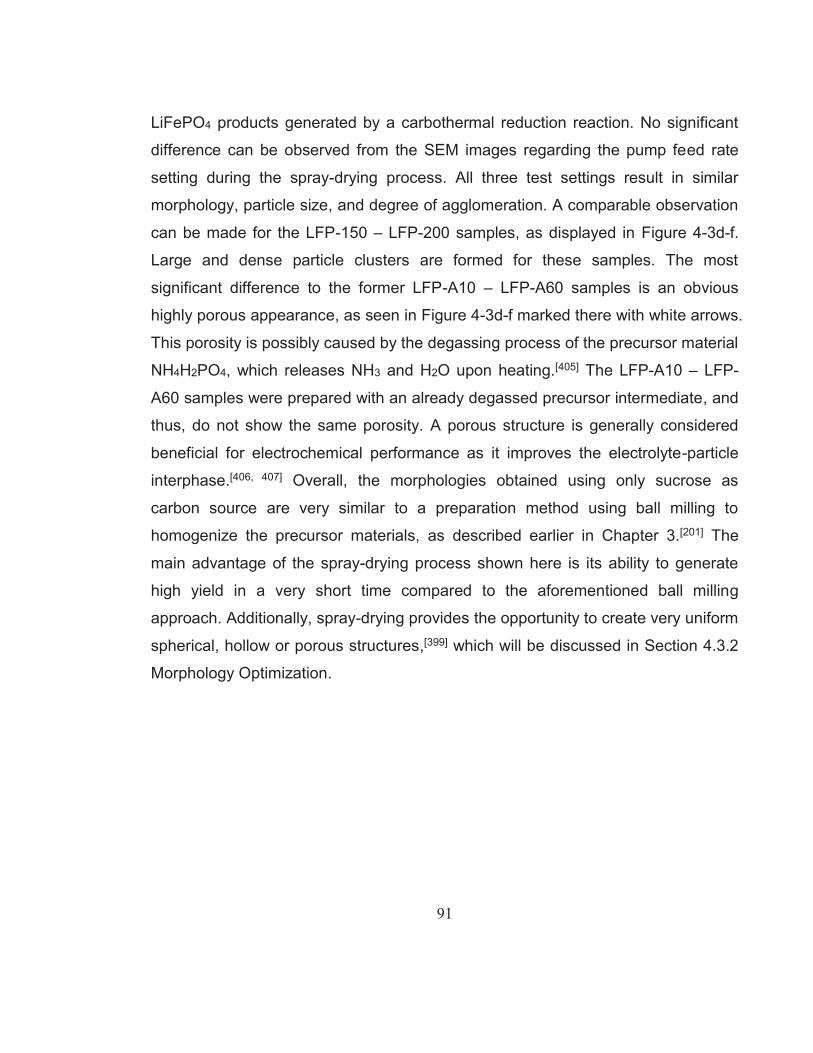
Figure 4-4. Rate performance results of (a) LFP-A10 – LFP-A60 and (c) LFP-150 – LFP-200 cycled at current densities from 0.2C to 20C in the voltage range of 2.0 – 4.25 V. Cycling stability test of (b) LFP-A10 – LFP-A60 and (d) LFP-150 – LFP-200 for 500 cycles at 10C in the voltage range of 2.0 – 4.25 V. ...................................................... 93
XV
Figure 4-5. XRD patterns of LFP-C CA, LFP-C PEG, and LFP-C PVA compared with the calculated pattern of JCPDS card number 83-2092 and Fe2P. .................................................................................. 95
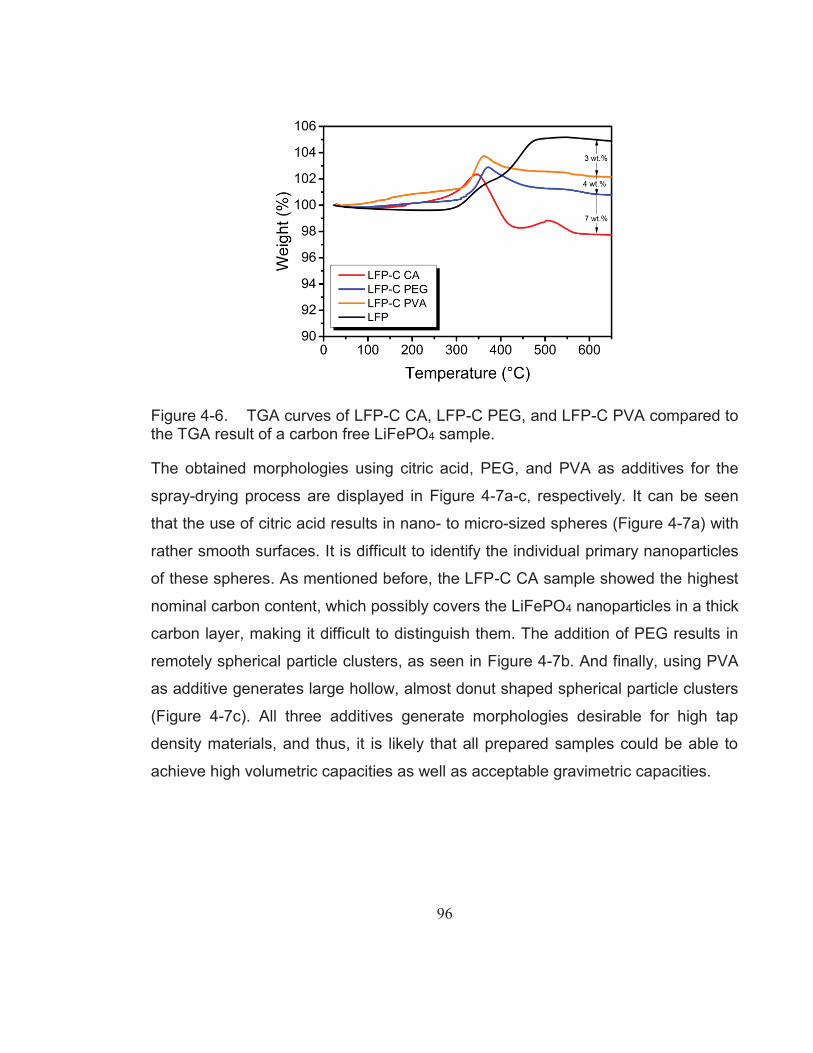
Figure 4-6. TGA curves of LFP-C CA, LFP-C PEG, and LFP-C PVA compared to the TGA result of a carbon free LiFePO4 sample. ......... 96
Figure 4-7. SEM images of (a) LFP-C CA, (b) LFP-C PEG, and (c) LFP-C PVA. .................................................................................................. 97
Figure 4-8. Rate performance results of LFP-C CA and LFP-C PVA cycled at current densities from 0.2 to 20C in the voltage range of 2.0 – 4.25 V. ............................................................................................... 97
Figure 5-1. Schematic illustration of the LiFePO4@CP hybrid electrode preparation process. ........................................................................ 105
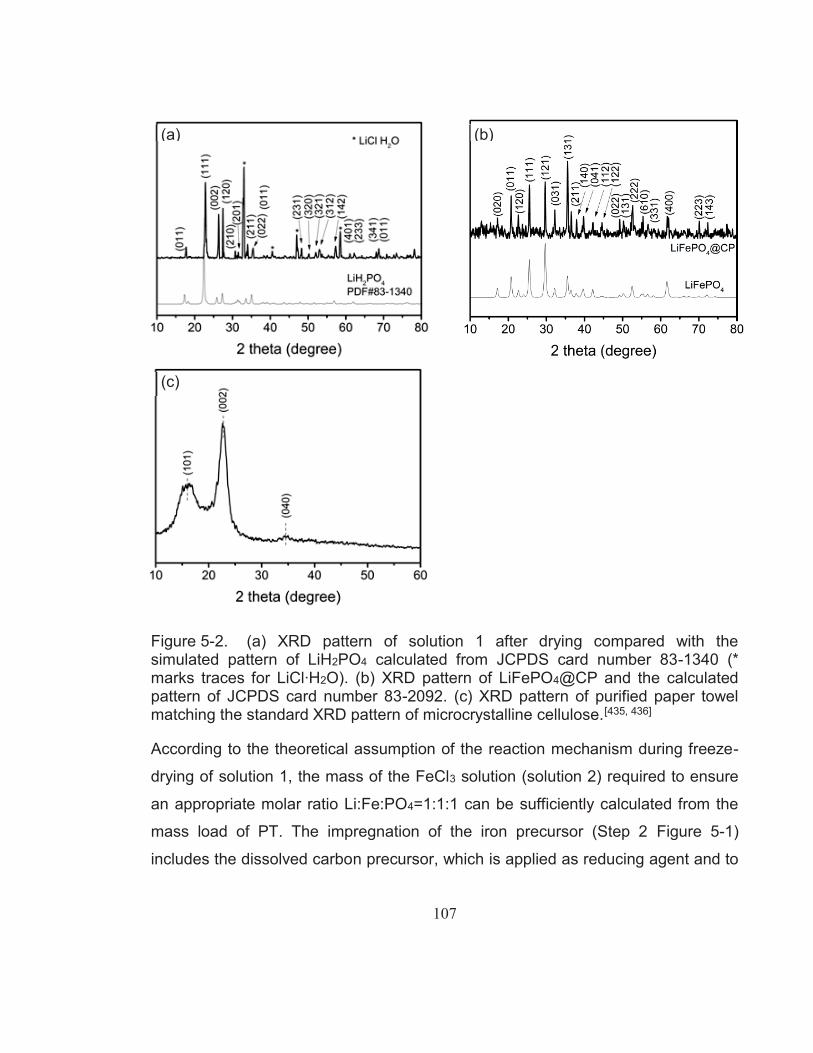
Figure 5-2. (a) XRD pattern of solution 1 after drying compared with the simulated pattern of LiH2PO4 calculated from JCPDS card number 83-1340 (* marks traces for LiCl∙H2O). (b) XRD pattern of LiFePO4@CP and the calculated pattern of JCPDS card number 83-2092. (c) XRD pattern of purified paper towel matching the standard XRD pattern of microcrystalline cellulose.[435, 436] .............. 107
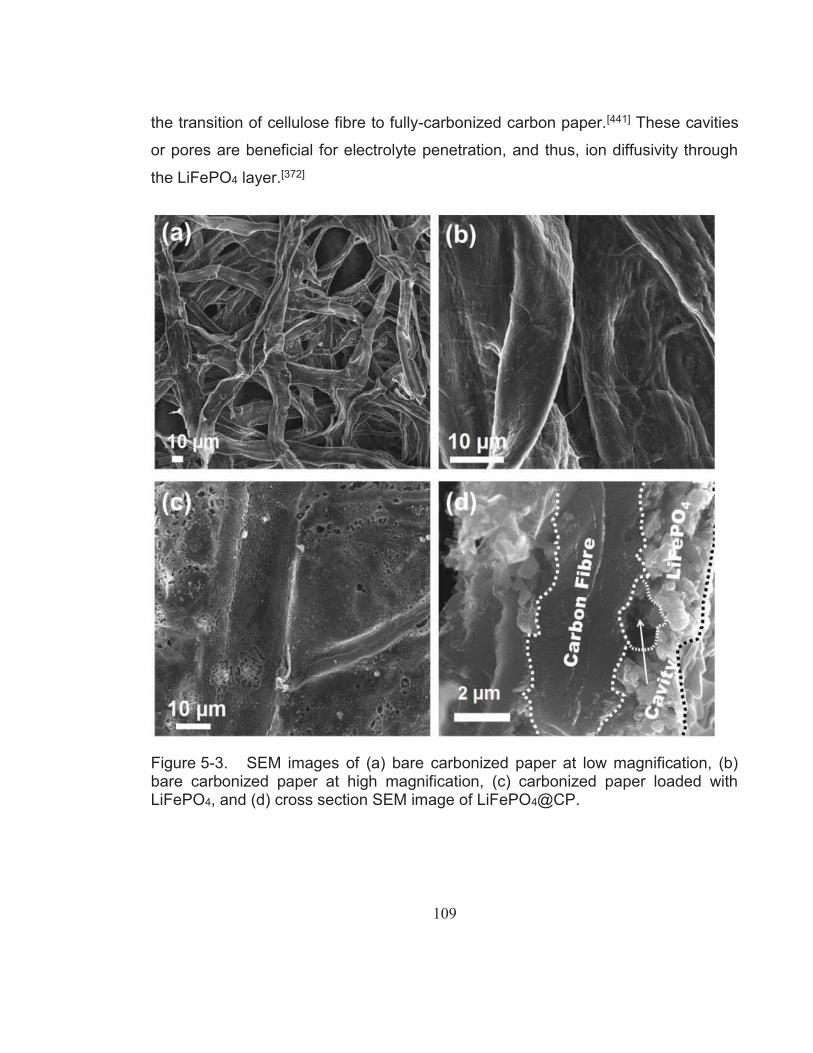
Figure 5-3. SEM images of (a) bare carbonized paper at low magnification, (b) bare carbonized paper at high magnification, (c) carbonized paper loaded with LiFePO4, and (d) cross section SEM image of LiFePO4@CP................................................................................... 109
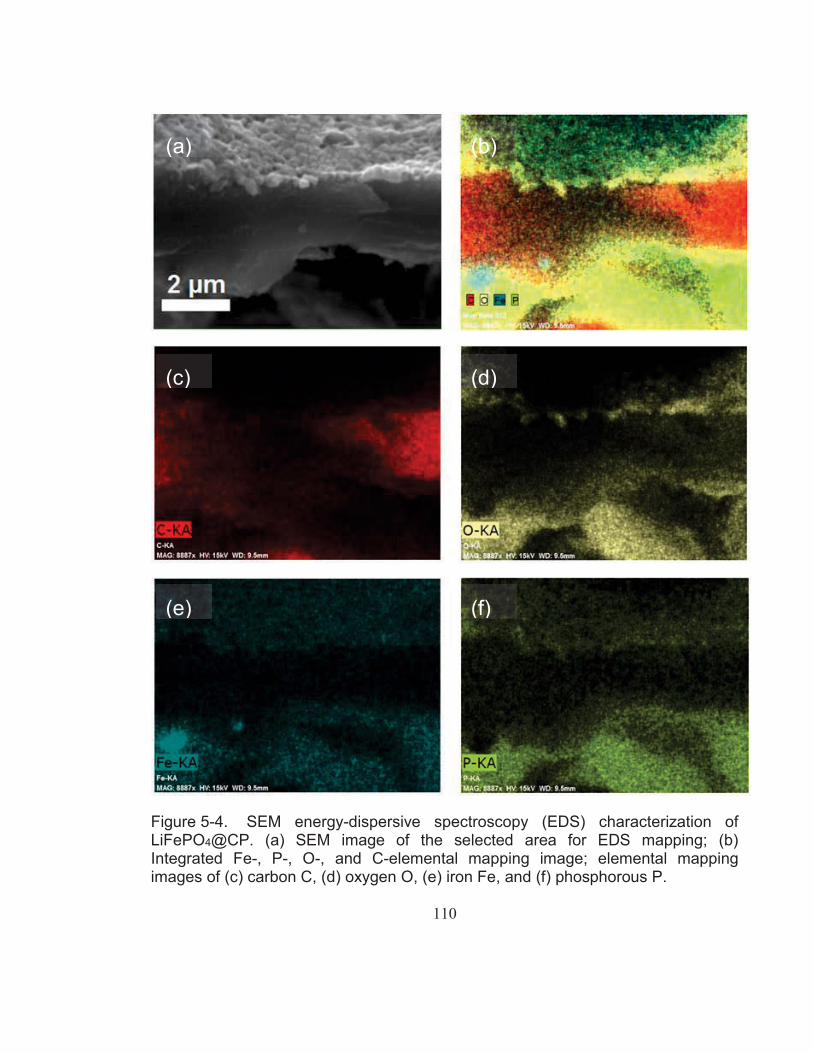
Figure 5-4. SEM energy-dispersive spectroscopy (EDS) characterization of LiFePO4@CP. (a) SEM image of the selected area for EDS mapping; (b) Integrated Fe-, P-, O-, and C-elemental mapping image; elemental mapping images of (c) carbon C, (d) oxygen O, (e) iron Fe, and (f) phosphorous P. .................................................. 110
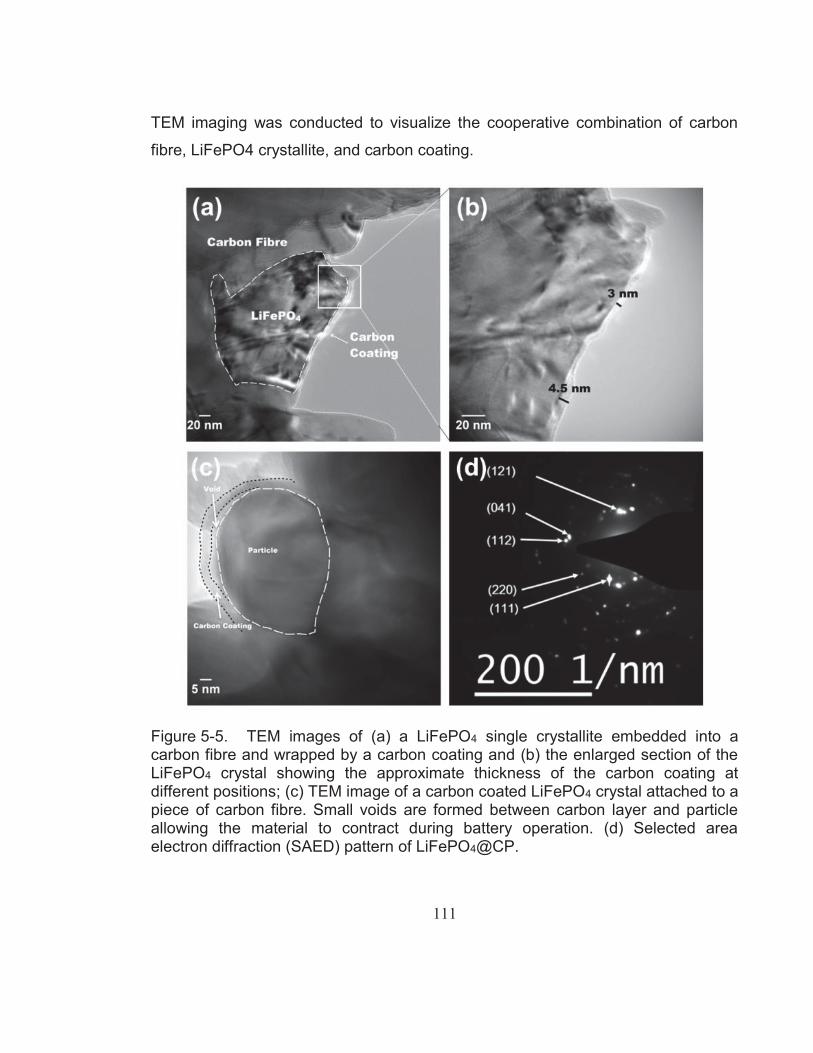
Figure 5-5. TEM images of (a) a LiFePO4 single crystallite embedded into a carbon fibre and wrapped by a carbon coating and (b) the enlarged section of the LiFePO4 crystal showing the approximate thickness of the carbon coating at different positions; (c) TEM image of a carbon coated LiFePO4 crystal attached to a piece of carbon fibre. Small voids are formed between carbon layer and particle allowing the material to contract during battery operation. (d) Selected area electron diffraction (SAED) pattern of LiFePO4@CP................................................................................... 111
Figure 5-6. TGA curve of LiFePO4@CP and carbon free LiFePO4 from room temperature to 700 °C in air. ............................................................ 113
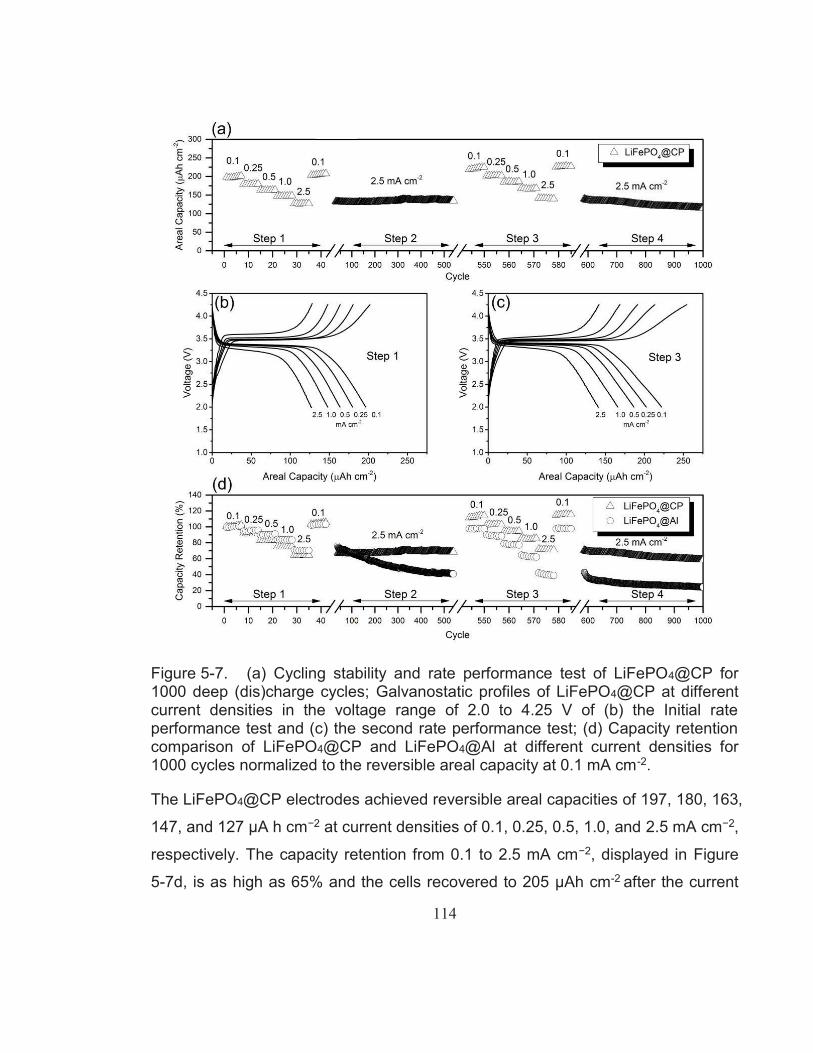
Figure 5-7. (a) Cycling stability and rate performance test of LiFePO4@CP for 1000 deep (dis)charge cycles; Galvanostatic profiles of LiFePO4@CP at different current densities in the voltage range of 2.0 to 4.25 V of (b) the Initial rate performance test and (c) the
XVI
second rate performance test; (d) Capacity retention comparison of LiFePO4@CP and LiFePO4@Al at different current densities for 1000 cycles normalized to the reversible areal capacity at 0.1 mA cm-2. ................................................................................................. 114
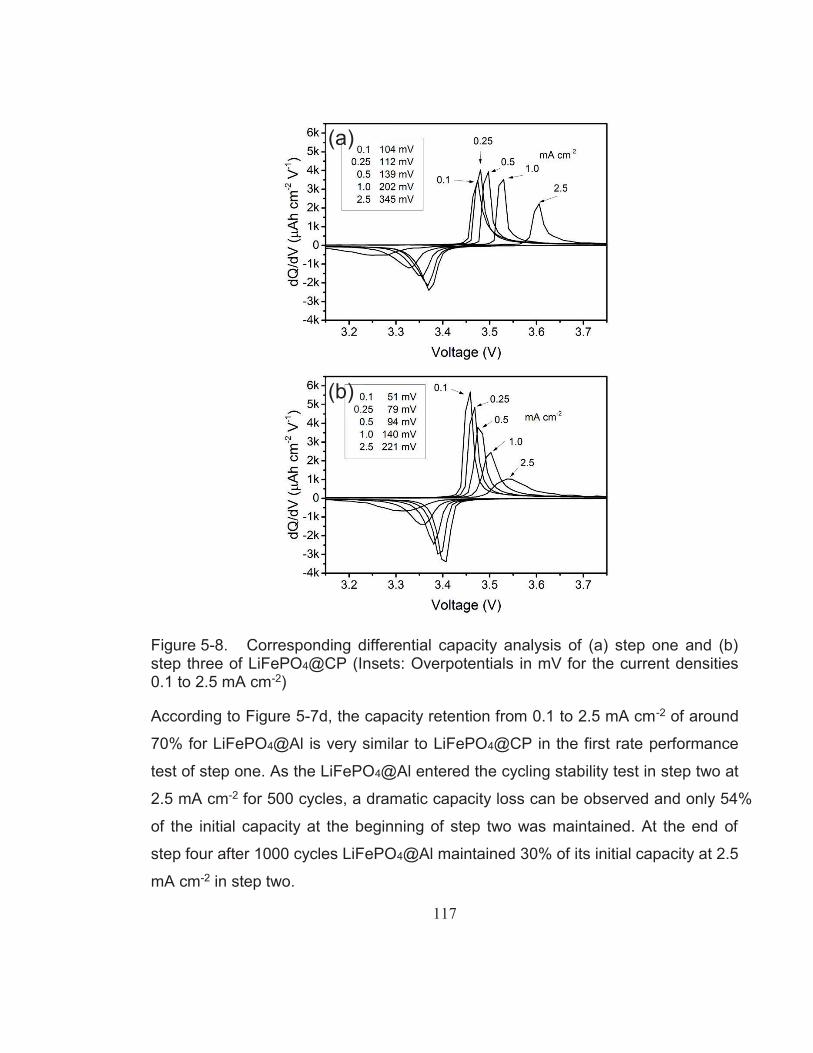
Figure 5-8. Corresponding differential capacity analysis of (a) step one and (b) step three of LiFePO4@CP (Insets: Overpotentials in mV for the current densities 0.1 to 2.5 mA cm-2) ............................................... 117
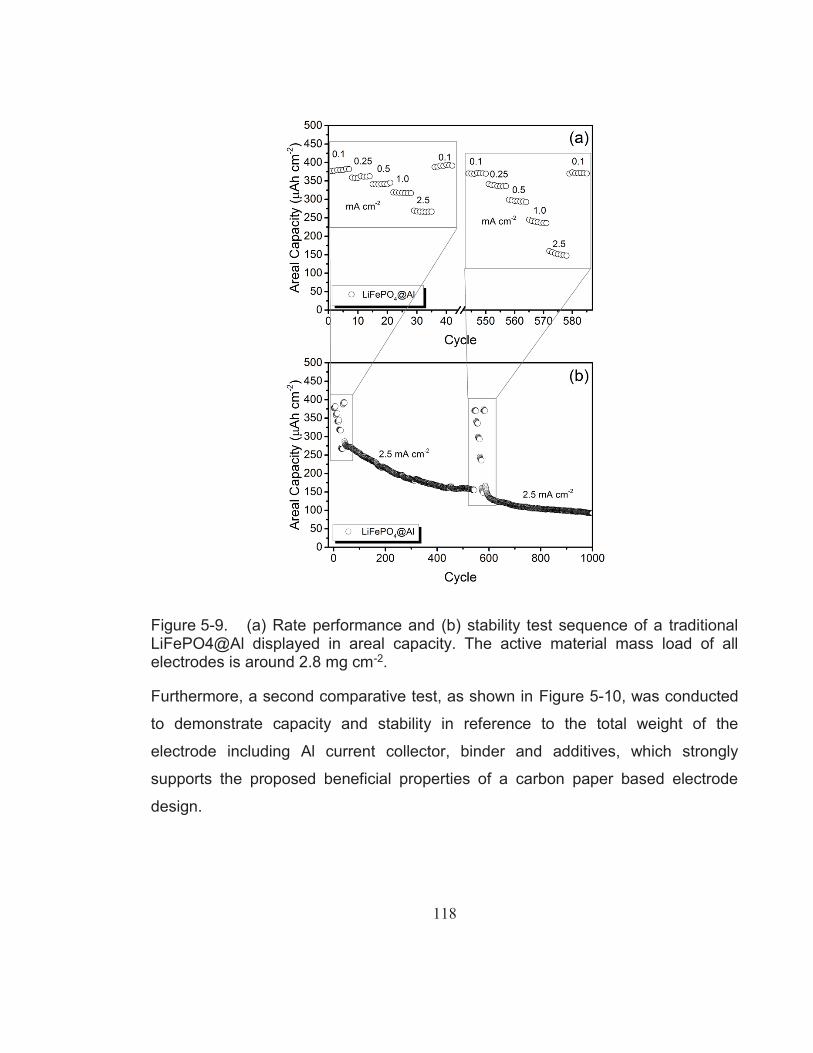
Figure 5-9. (a) Rate performance and (b) stability test sequence of a traditional LiFePO4@Al displayed in areal capacity. The active material mass load of all electrodes is around 2.8 mg cm-2. ............ 118
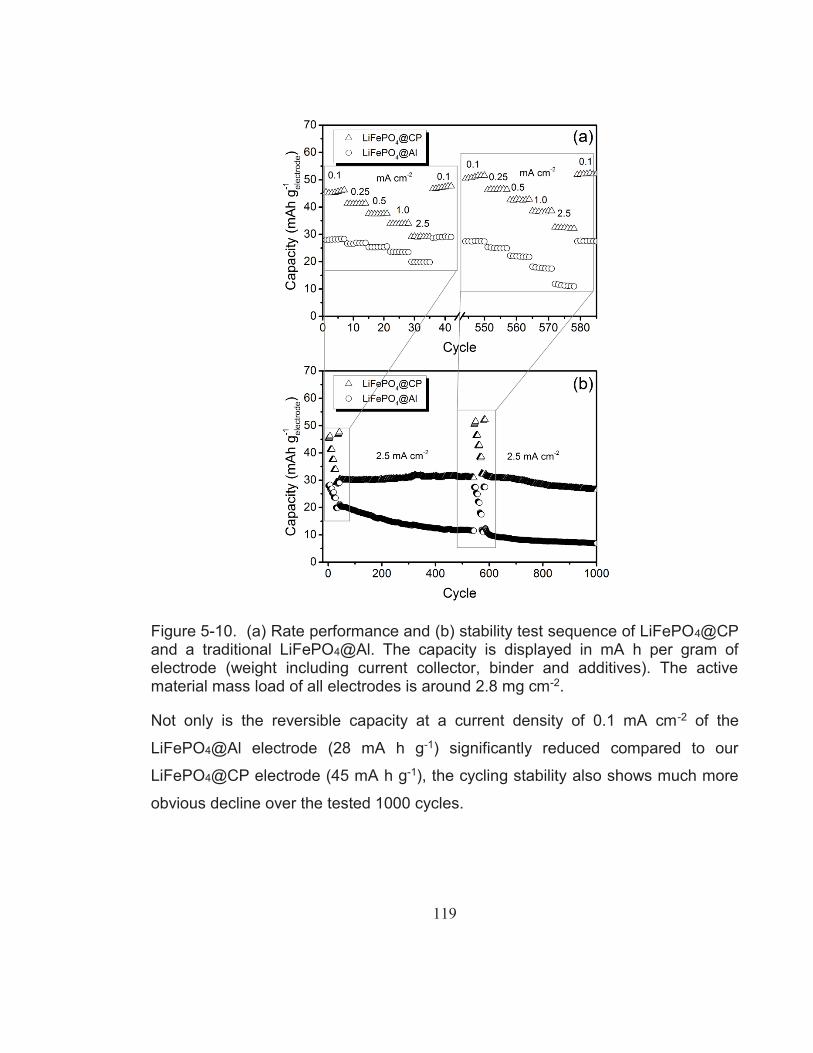
Figure 5-10. (a) Rate performance and (b) stability test sequence of LiFePO4@CP and a traditional LiFePO4@Al. The capacity is displayed in mA h per gram of electrode (weight including current collector, binder and additives). The active material mass load of all electrodes is around 2.8 mg cm-2. ............................................... 119
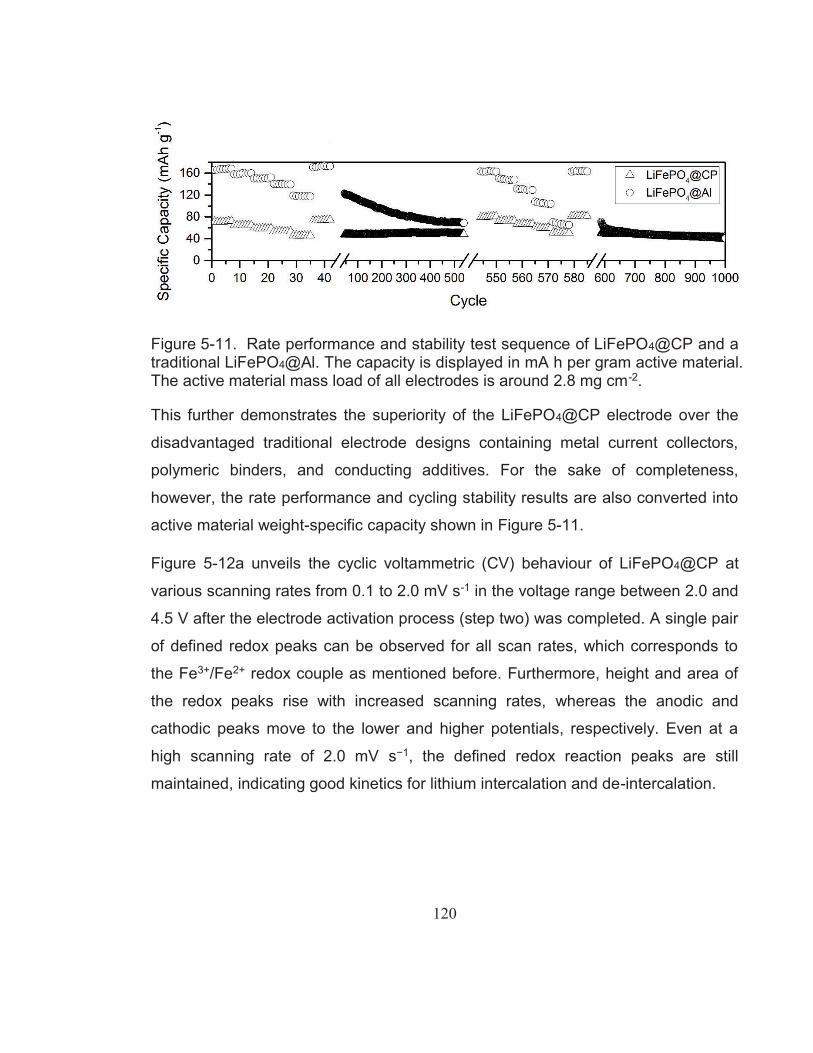
Figure 5-11. Rate performance and stability test sequence of LiFePO4@CP and a traditional LiFePO4@Al. The capacity is displayed in mA h per gram active material. The active material mass load of all electrodes is around 2.8 mg cm-2. .................................................... 120
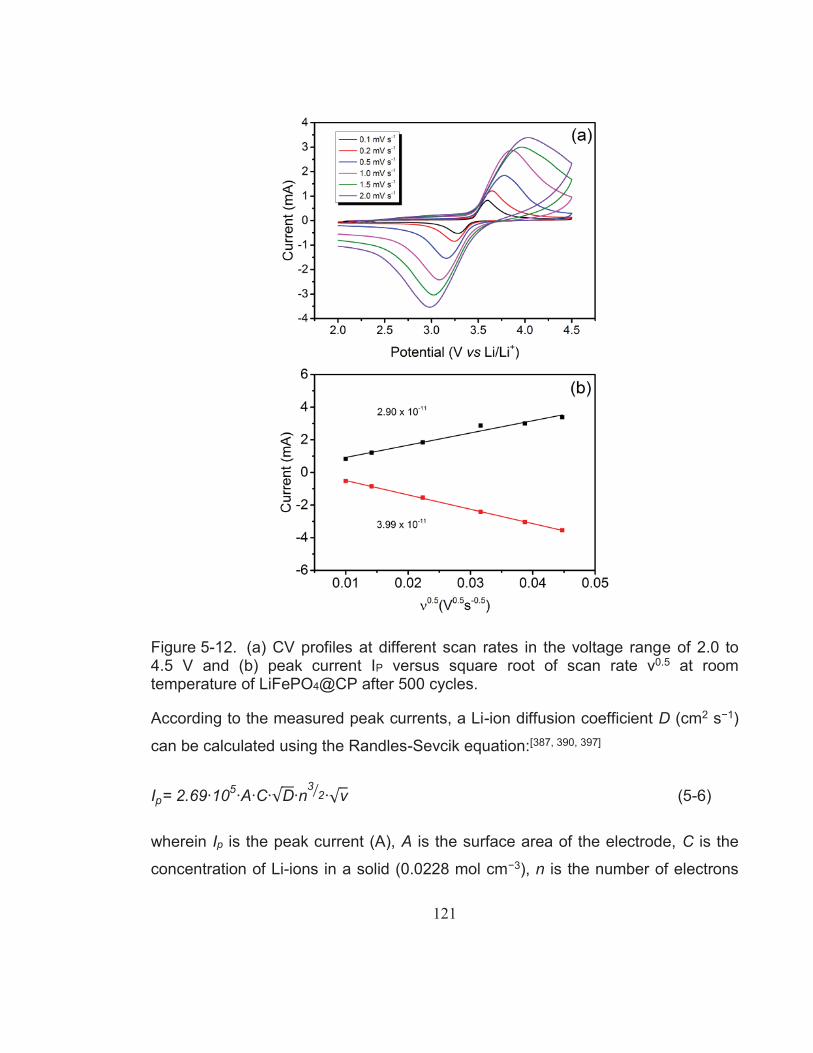
Figure 5-12. (a) CV profiles at different scan rates in the voltage range of 2.0 to 4.5 V and (b) peak current IP versus square root of scan rate ν0.5 at room temperature of LiFePO4@CP after 500 cycles. .................. 121
Figure 5-13. (a) Electrochemical impedance spectra and (b) linear fit of the Warburg impedance of a LiFePO4@CP cell fresh and cycled for 500 cycles. ....................................................................................... 123
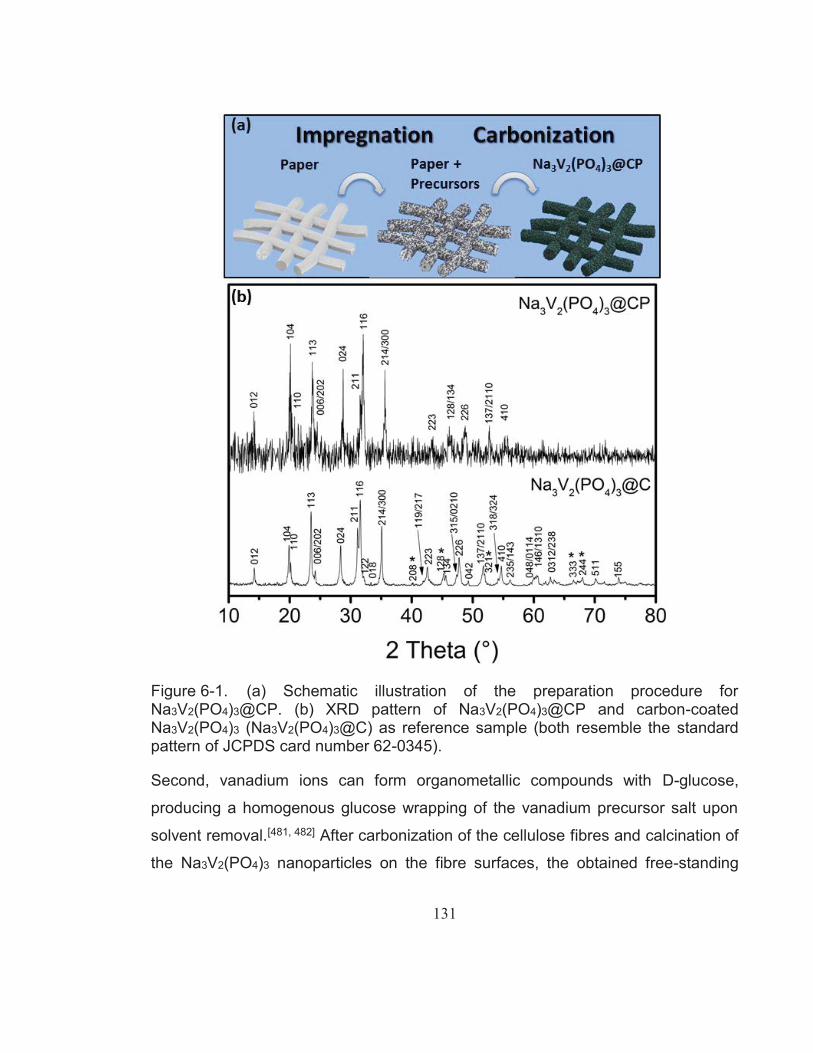
Figure 6-1. (a) Schematic illustration of the preparation procedure for Na3V2(PO4)3@CP. (b) XRD pattern of Na3V2(PO4)3@CP and carbon-coated Na3V2(PO4)3 (Na3V2(PO4)3@C) as reference sample (both resemble the standard pattern of JCPDS card number 62-0345). ............................................................................ 131
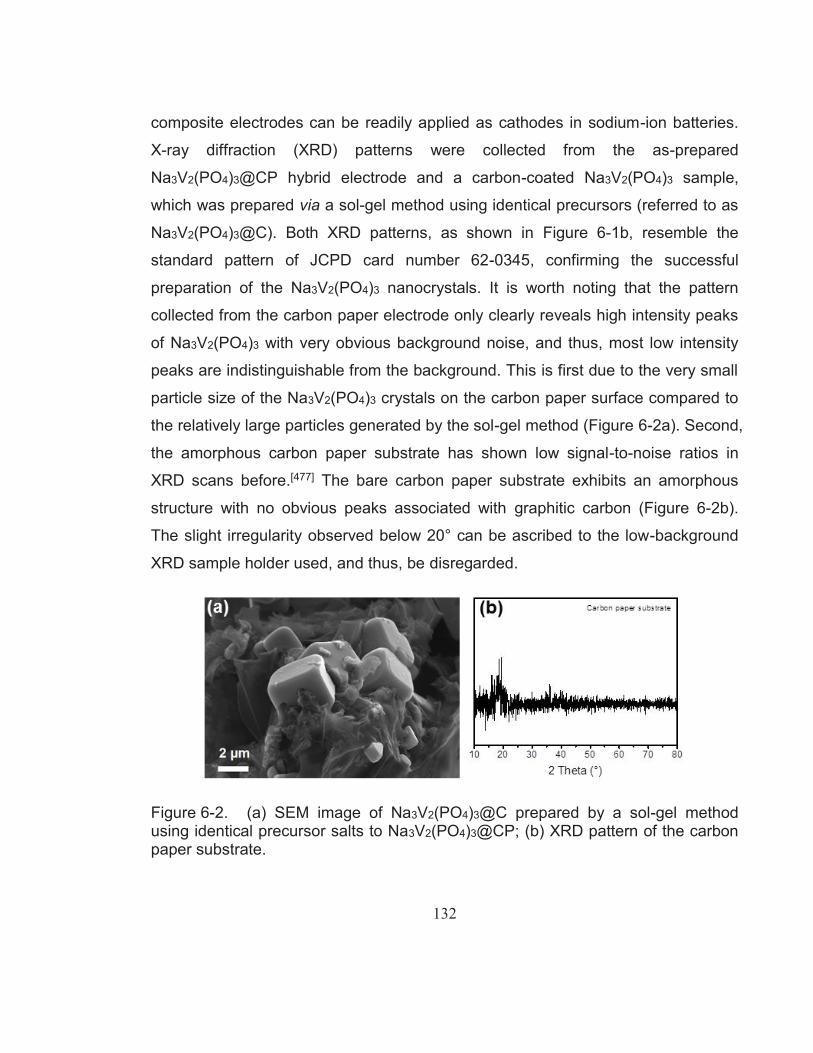
Figure 6-2. (a) SEM image of Na3V2(PO4)3@C prepared by a sol-gel method using identical precursor salts to Na3V2(PO4)3@CP; (b) XRD pattern of the carbon paper substrate. ............................................. 132
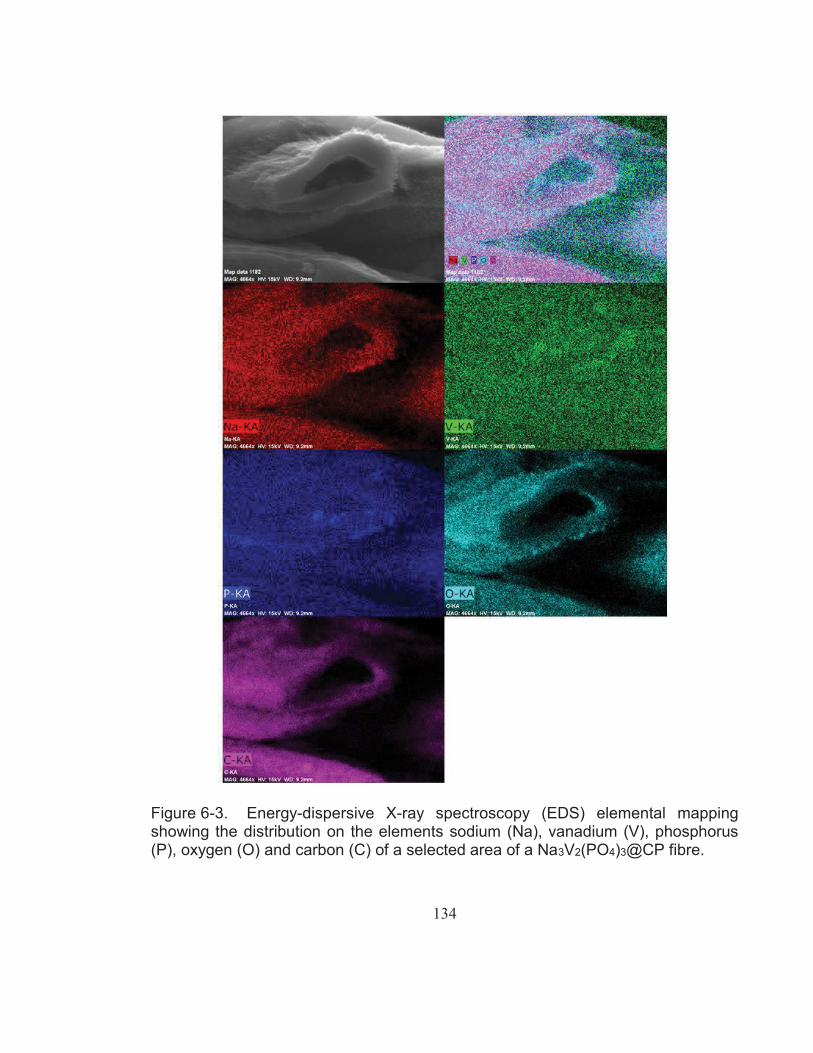
Figure 6-3. Energy-dispersive X-ray spectroscopy (EDS) elemental mapping showing the distribution on the elements sodium (Na), vanadium (V), phosphorus (P), oxygen (O) and carbon (C) of a selected area of a Na3V2(PO4)3@CP fibre. .................................................... 134
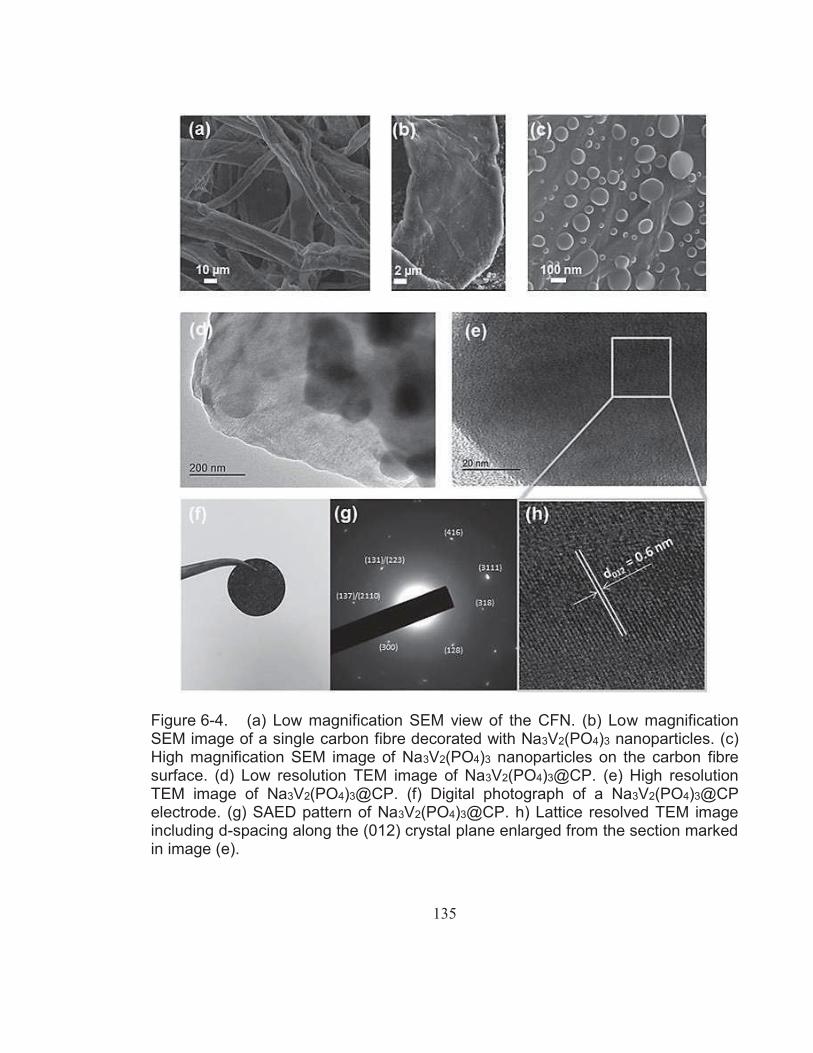
Figure 6-4. (a) Low magnification SEM view of the CFN. (b) Low magnification SEM image of a single carbon fibre decorated with Na3V2(PO4)3 nanoparticles. (c) High magnification SEM image of Na3V2(PO4)3 nanoparticles on the carbon fibre surface. (d) Low resolution TEM image of Na3V2(PO4)3@CP. (e) High resolution
XVII
TEM image of Na3V2(PO4)3@CP. (f) Digital photograph of a Na3V2(PO4)3@CP electrode. (g) SAED pattern of Na3V2(PO4)3@CP. h) Lattice resolved TEM image including d-spacing along the (012) crystal plane enlarged from the section marked in image (e). ........................................................................ 135
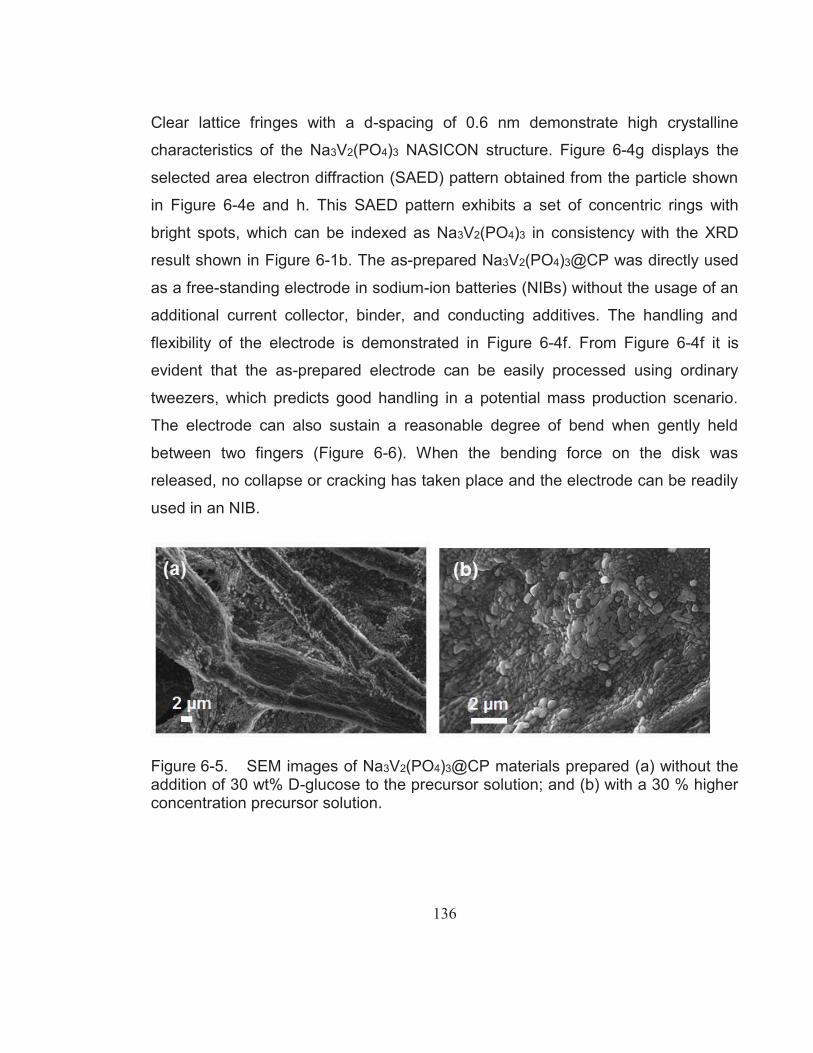
Figure 6-5. SEM images of Na3V2(PO4)3@CP materials prepared (a) without the addition of 30 wt% D-glucose to the precursor solution; and (b) with a 30 % higher concentration precursor solution. ...................... 136
Figure 6-6. Digital photograph of the Na3V2(PO4)3@CP hybrid electrode slightly bent to demonstrate its structural integrity under stress. ..... 137
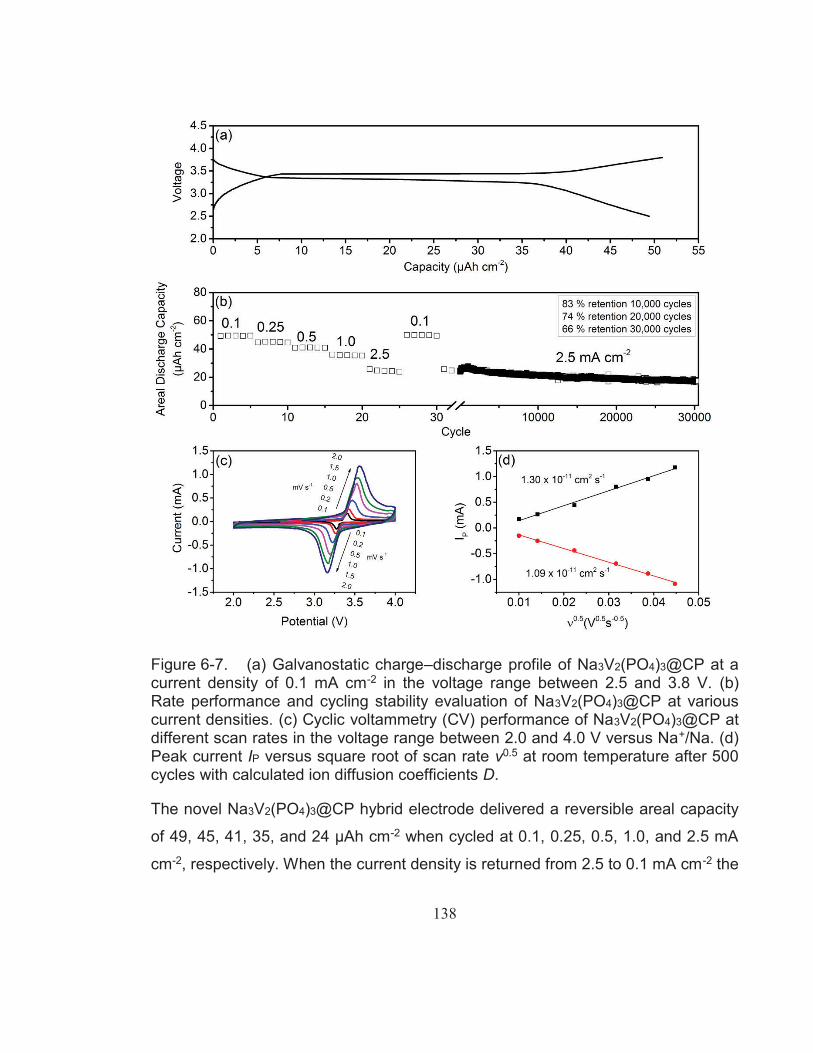
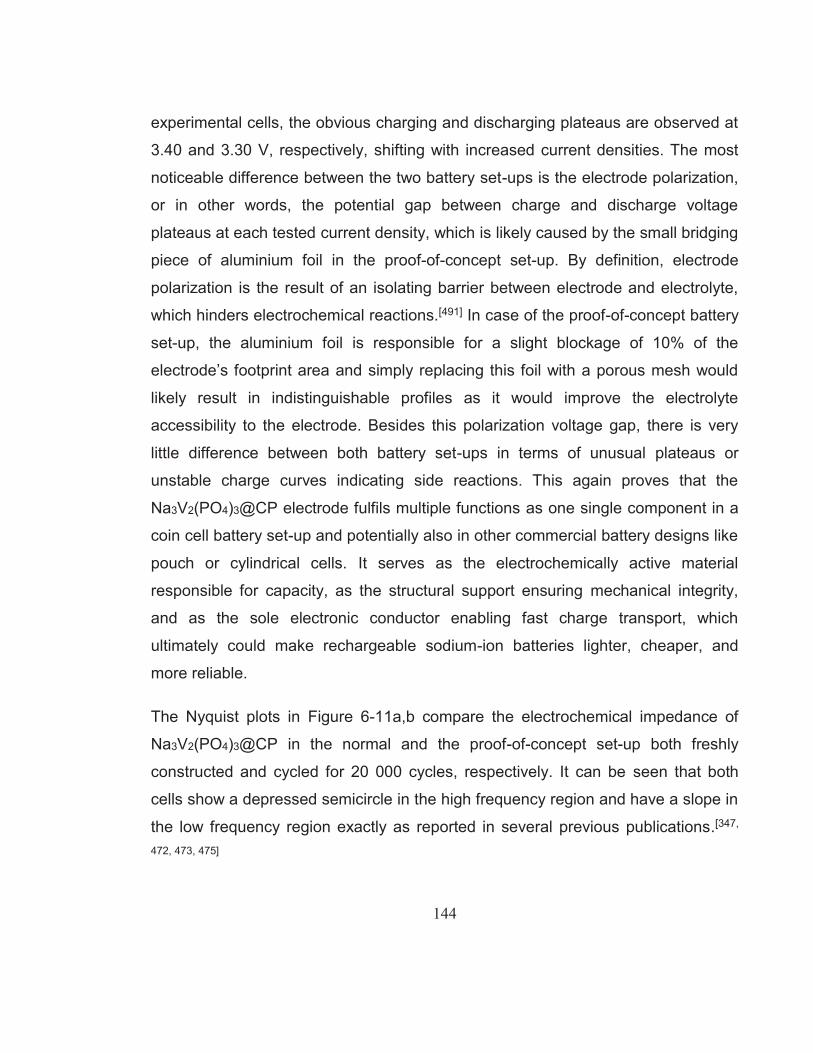
Figure 6-7. (a) Galvanostatic charge–discharge profile of Na3V2(PO4)3@CP at a current density of 0.1 mA cm-2 in the voltage range between 2.5 and 3.8 V. (b) Rate performance and cycling stability evaluation of Na3V2(PO4)3@CP at various current densities. (c) Cyclic voltammetry (CV) performance of Na3V2(PO4)3@CP at different scan rates in the voltage range between 2.0 and 4.0 V versus Na+/Na. (d) Peak current IP versus square root of scan rate ν0.5 at room temperature after 500 cycles with calculated ion diffusion coefficients D. .................................................................................. 138
Figure 6-8. Cycling performance of the sample prepared with a 30% higher concentration precursor solution (~32 wt% carbon). ........................ 139
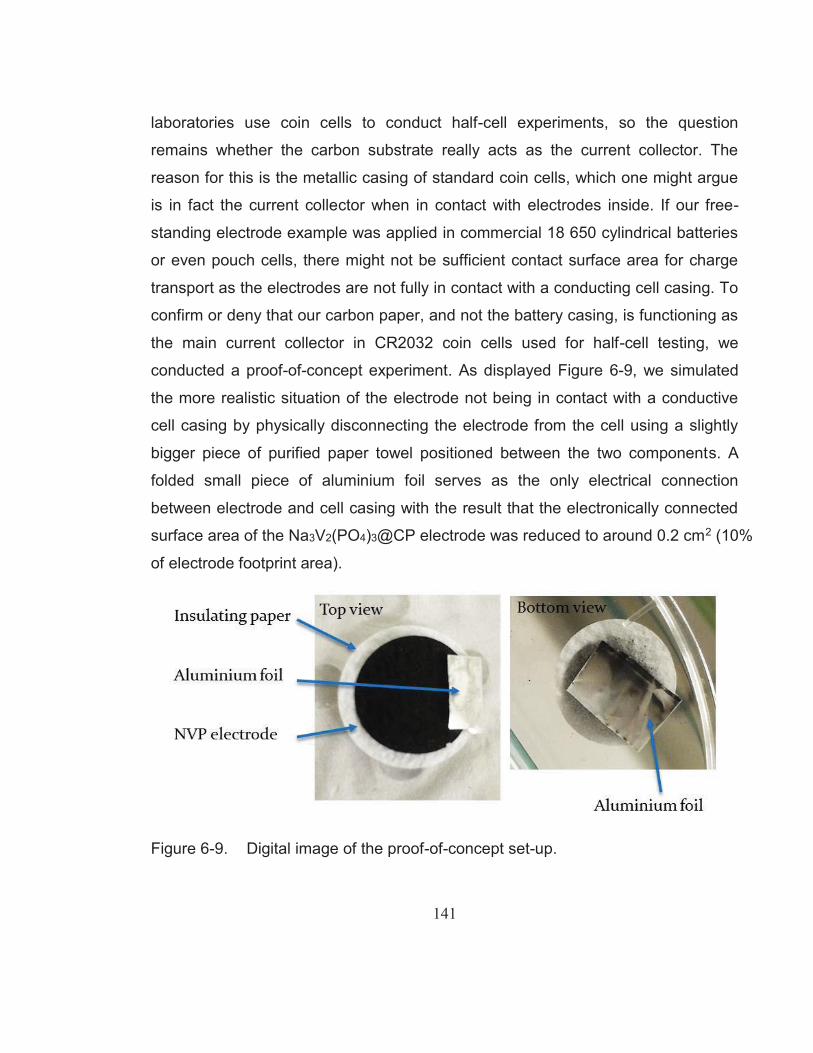
Figure 6-9. Digital image of the proof-of-concept set-up. ................................... 141Figure 6-10. (a) Rate performance and cycling stability of Na3V2(PO4)3@CP
and the modified proof-of-concept cell assembly with Na3V2(PO4)3@CP at various current densities; Galvanostatic charge–discharge profiles of Na3V2(PO4)3@CP at various current densities in the voltage range between 2.5 and 3.8 V. (b) The modified proof-of-concept cell assembly and (c) Na3V2(PO4)3@CP.......................................................................................................... 142
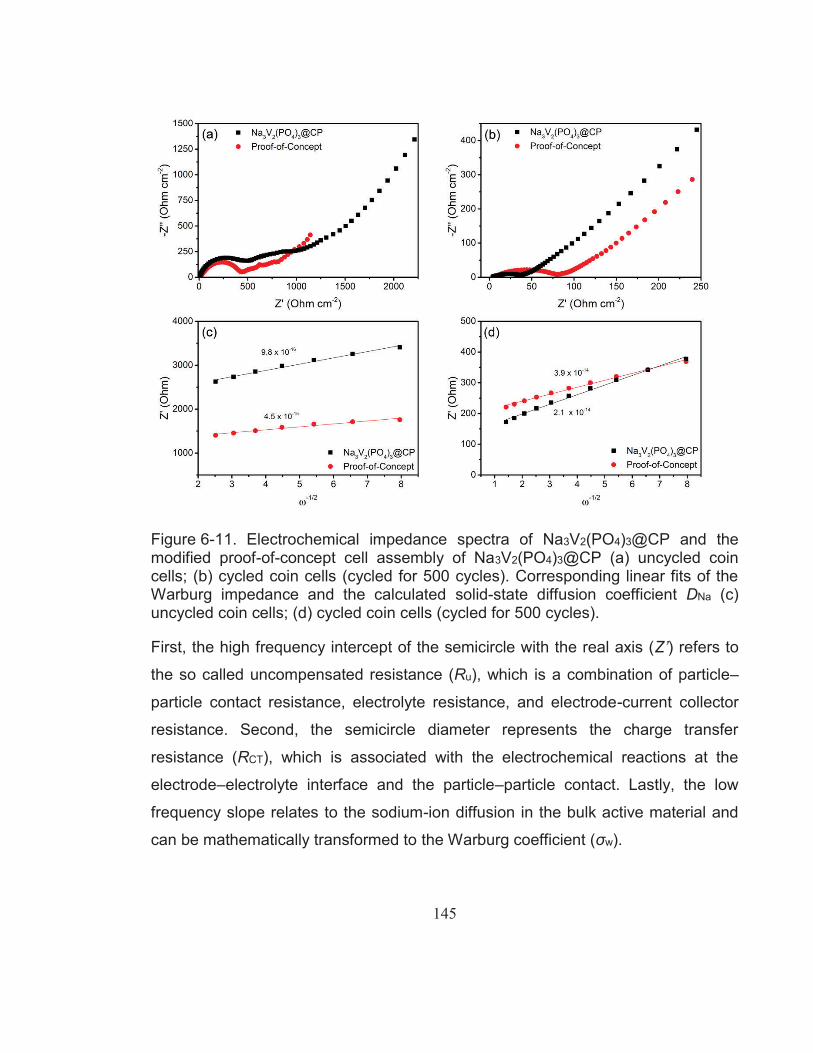
Figure 6-11. Electrochemical impedance spectra of Na3V2(PO4)3@CP and the modified proof-of-concept cell assembly of Na3V2(PO4)3@CP (a) uncycled coin cells; (b) cycled coin cells (cycled for 500 cycles). Corresponding linear fits of the Warburg impedance and the calculated solid-state diffusion coefficient DNa (c) uncycled coin cells; (d) cycled coin cells (cycled for 500 cycles). ........................... 145
XVIII
ABSTRACT
The design of electrode materials depends critically on understanding the
underlying electrochemical processes. Material composition, morphology, structure,
and preparation method affect and can alter electrochemical performance of
electrochemically active materials. In this research project, a series of phosphate-
based polyanionic electrode materials have been fabricated and their
electrochemical properties for the use in lithium-ion and sodium-ion batteries are
evaluated.
We successfully prepared carbon-coated LiFePO4 cathode materials by industrial
ball milling and a solid-state reaction with Li2CO3, NH4H2PO4, and FeC2O4·2H2O as
starting materials. Soluble starch as the primary carbon source was investigated
for its capability of generating a highly graphitic carbon coating, whilst sufficiently
controlling the crystal growth of LiFePO4. XRD analysis, Raman spectroscopy, and
electrochemical testing revealed the significant impact of the amount of starch
added to the pre-sintered precursor on phase purity, carbon quality, and
electrochemical performance of the final LiFePO4/C composite. The optimum
soluble starch content to achieve a highly sp2-coordinated carbon coating is 10
wt%, which enabled our LiFePO4/C composite to achieve competitive reversible
capacities as well as improved rate performance
The spray method is well-trusted in practical applications, such as food
manufacturing, fertilizers, oxide ceramics, and pharmaceuticals. The ability to
produce uniformly spherical particle clusters ranging from nano- to micrometre in
size is one of the main advantages of this method, which is immensely important
for large scale production of electrochemically active materials for the energy
storage market. In this report, we systematically evaluated spray-drying conditions
and equipment settings in regards to electrochemical performance of carbon
coated LiFePO4 cathode materials. In an optimisation trial, the most suitable
process conditions for the precursor materials and spray-dryer model used to
prepare pure and practical LiFePO4 cathode materials were identified. The impact
XIX
of different organic additives on the resulting particle morphology of the final
product was also investigated. It was found that the addition of polyvinyl alcohol
(PVA) generates particle clusters that provide a high tap density product without
sacrificing electrochemical performance. The LiFePO4 cathode material prepared
with the addition of PVA achieved remarkable rate performance results and could
maintain a capacity of 113.95 mA h g-1 at 10C.
Lithium-ion batteries (LIBs) are widely implemented to power portable electronic
devices and are increasingly in demand for large-scale applications. One of the
major obstacles for this technology is still the low cost-efficiency of its
electrochemical active materials and production processes. In this work, we
present a novel impregnation–carbothermal reduction method to generate a
LiFePO4–carbon paper hybrid electrode, which does not require a metallic current
collector, polymeric binder or conducting additives to function as a cathode
material in a LIB system. A shell of LiFePO4 crystals was grown in situ on carbon
fibres during the carbonization of microcrystalline cellulose. The LiFePO4–carbon
paper electrode achieved an initial reversible areal capacity of 197 μA h cm−2
increasing to 222 μA h cm−2 after 500 cycles at a current density of 0.1 mA cm−2.
The hybrid electrode also demonstrated a superior cycling performance for up to
1000 cycles. The free-standing electrode could be potentially applied for flexible
lithium-ion batteries.
Sodium-ion batteries (NIBs) are an emerging technology, which can meet
increasing demands for large-scale energy storage. One of the most promising
cathode material candidates for sodium-ion batteries is Na3V2(PO4)3 due to its high
capacity, thermal stability, and sodium (Na) superionic conductor 3D (NASICON)-
type framework. In this work, the authors have significantly improved
electrochemical performance and cycling stability of Na3V2(PO4)3 by introducing a
3D interconnected conductive network in the form of carbon fibre derived from
ordinary paper towel. The free-standing Na3V2(PO4)3-carbon paper
(Na3V2(PO4)3@CP) hybrid electrodes do not require a metallic current collector,
polymeric binder, or conducting additives to function as a cathode material in an
XX
NIB system. The Na3V2(PO4)3@CP cathode demonstrates extraordinary long-term
cycling stability for 30 000 deep charge– discharge cycles at a current density of
2.5 mA cm-2. Such outstanding cycling stability can meet the stringent
requirements for renewable energy storage.
XXI
INTRODUCTION
Current estimations of population growth and consequential increased energy
demand predict that we will consume 2.2 tons of oil equivalents (TOE) per capita
by 2030. With our current means of using fossil fuels, this will release
unsustainable amounts of greenhouse gases in addition to the fact that these
sources of energy will be depleted eventually. It is generally accepted that
advanced renewable energy technologies are urgently needed to support current
population growth and to maintain energy security for generations to come.
Current integration of renewable energy sources, such as wind or solar energy,
present the problem of reliability if directly fed into the grid. The demand for energy
by households or industry and the production of energy are not naturally in synch.
In the course of a day, these renewable sources might not be available or are
producing an oversupply when not needed causing instability within the power grid,
which is the main reason why they are not widely implemented in Australia.
Large-scale energy storage systems are believed to be the solution to this critical
issue as they are able to buffer peak load energy and output fluctuations by storing
and releasing energy as demand and supply are changing during the day.
Lithium-ion batteries (LIBs), as one possible energy storage system, now surpass
other battery systems, such as lead–acid or nickel metal hydride batteries, in terms
of energy density. Their current applications range from electric vehicles (EV) and
hybrid electric vehicles (HEV) to portable devices, such as mobile phones and
laptops. Although substantial progress has been made to improve LIBs, significant
enhancements in energy density, cost, and cyclability are still required. The
performance of LIBs is critically affected by the performance of the electrode
materials used in the electrochemical cell, especially on the cathode side. This
research project focuses on the development of different advanced LiFePO4
cathode materials prepared by different industry-ready and low-cost preparation
methods.
XXII
Furthermore, sodium-ion batteries (SIBs) have attracted attention as a low-cost
alternative to LIBs because sodium is the fourth most abundant element in the
earth’s crust with widespread distribution of sodium minerals. With a working
principle similar to that of the lithium system, SIBs are in the early stage of
development with one prototype battery entering the market in 2015. Due to the
larger atomic radius of the Na+, finding suitable materials that can accommodate
and tolerate electrochemical reactions with sodium is challenging. In this project,
one vanadium- and phosphate-based polyanionic cathode material, Na3V2(PO4)3,
is investigated.
For both LIBs and SIBs, the electrochemical reaction occurs at the electrode
surface and requires the transport of ions into the electrode material. Consequently,
electrode material design is vital to achieve high performance batteries.
Methodologies such as optimization of the preparation process, material
composition, and morphology as well as harmonious hybridization between each
component were applied in this work to fabricate advanced electrode materials for
LIBs and SIBs.
Each chapter therefore is outlined as follows:
1) Chapter 1 reviews the development of LIBs and SIBs electrode materials, with
special attention given to phosphate-based polyanionic material candidates. The
working principle, development of selected anode and cathode materials are
presented. For sodium-ion batteries, the comparison to lithium-ion batteries is
given and advances in cathode materials and anodes are summarized.
2) Chapter 2 presents the experimental methods used during this research project
including material preparation, physiochemical characterizations, and
electrochemical investigations. The main method to prepare the electrode
materials in this work are solid-state reaction and hydrothermal synthesis.
Structural and morphological investigations are carried out using X-ray diffraction
(XRD), field emission scanning electron microscopy (FESEM), transmission
electron microscopy (TEM), nitrogen adsorption-desorption, Raman spectroscopy,
XXIII
and thermogravimetric analysis. Electrode fabrication and cell assembly protocols
as well as electrochemical characterisation techniques are also presented.
3) Chapter 3 presents a carbon-coated LiFePO4 cathode material prepared
through industrial ball milling and solid-state reaction by using Li2CO3, NH4H2PO4,
FeC2O4·2 H2O, and soluble starch as a carbon source to generate highly graphitic
carbon coatings. Special attention has been paid to the correlation between the
applied amount of carbon and the sp2-coordinated carbon generation, as low-
temperature sintering usually yields more disordered carbons.
4) Chapter 4 systematically evaluates spray-drying conditions and equipment
settings in regards to electrochemical performance of the obtained carbon coated
LiFePO4 cathode material. This includes variations in spray-drying feed rate and
drying temperature while precursor materials, suspension concertation, and
amount of added carbon source remained unchanged for each parameter. After
optimal conditions were established, the impact of the carbon precursor choice
(namely citric acid, polyethylene glycol, and polyvinyl alcohol) on micro-particle
morphology was evaluated.
5) Chapter 5 presents the design of a unique preparation method to generate a
free-standing, binder-free, and metallic current collector-free LiFePO4 cathode. The
simultaneous carbonization of microcrystalline cellulose and the in situ crystal
growth of LiFePO4 nanoparticles achieved by a novel impregnation–carbothermal
reduction technique to create an innovative LiFePO4–carbon paper (LiFePO4@CP)
hybrid electrode is demonstrated. The hybrid LiFePO4@CP electrode consists of a
carbon fibre network core, which allows fast electron transport and provides a
porous structure for electrolyte penetration. The thin LiFePO4 shell enables fast ion
diffusion over a large surface area.
6) Chapter 6 reports the development of a unique free-standing, binder-free and
metallic current collector-free Na3V2(PO4)3-carbon paper (Na3V2(PO4)3@CP)
cathode for SIBs. This hybrid electrode consists of an interconnected 3D carbon
fibre network (CFN) enabling fast electron transport and providing a porous
XXIV
structure for electrolyte diffusion. The Na3V2(PO4)3 nanoparticles decorated on the
carbon fibre network facilitate fast ion diffusion over a large surface area achieving
exceptional cycle life of over 30 000 cycles.
7) Chapter 7 briefly summarizes the research outcomes of this research project
and future scope of related research is also presented.
1
1 Chapter 1: Literature Review
During unexpected weather events in the Australian summer 2016/2017, the
federal state of South Australia experienced several consecutive and at times long-
lasting electricity blackouts. These events sparked a debate on South Australia’s
integration of renewable energy sources and consequential grid reliability issues
due to the lack of adequate support infrastructures.[1] Although major blackouts are
not limited to areas of high renewable energy integration as cases from the
Northeast of the USA in 2003 and Southern California to Mexico in 2011 show,
they highlight very complex issues associated with electricity production and
consumption.[2] Furthermore, it is widely recognized that reliable and affordable
electricity is vital for economic growth and development. Along the way to a
decreased dependence on fossil fuels and reduction of associated greenhouse gas
emissions to a full integration of renewable energy sources, large-sale energy
storage systems have been identified to be essential to improve and maintain grid
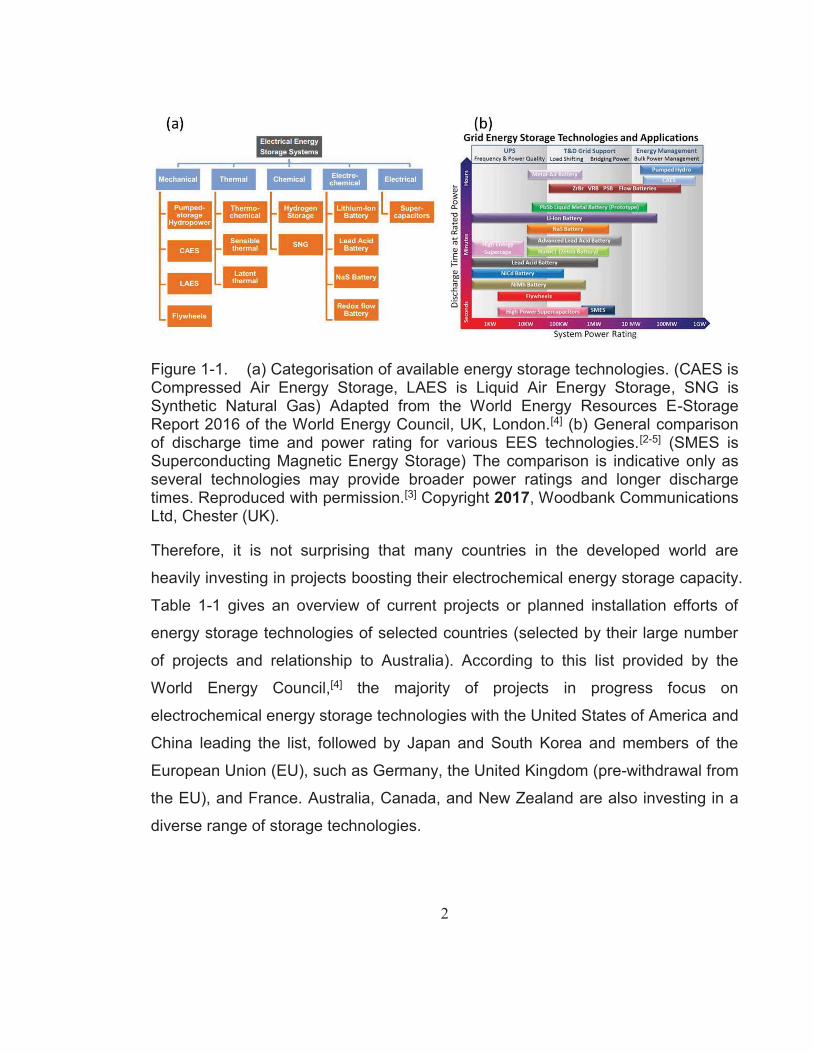
reliability.[3] As shown in Figure 1-1a, large-scale energy storage technologies can
be divided into five categories, each containing their own subcategories of
available and recognised systems, wherein the pumped hydro storage accounts for
more than 95% of the global energy storage capacity.[2-4] However, the pumped
hydro system cannot provide appropriate infrastructure for some crucial grid
applications, such as uninterrupted power supply (UPS) and transmission and
distribution (T&D) support, to maintain grid reliability. As Figure 1-1b shows,
different technologies can be further categorized in terms of discharge time and
storage capacity (power rating) and it becomes obvious that the metal-ion battery
(displayed as Li-Ion Battery) provides the widest range of possible applications in
this comparison.
2
Figure 1-1. (a) Categorisation of available energy storage technologies. (CAES is Compressed Air Energy Storage, LAES is Liquid Air Energy Storage, SNG is Synthetic Natural Gas) Adapted from the World Energy Resources E-Storage Report 2016 of the World Energy Council, UK, London.[4] (b) General comparison of discharge time and power rating for various EES technologies.[2-5] (SMES is Superconducting Magnetic Energy Storage) The comparison is indicative only as several technologies may provide broader power ratings and longer discharge times. Reproduced with permission.[3] Copyright 2017, Woodbank Communications Ltd, Chester (UK).
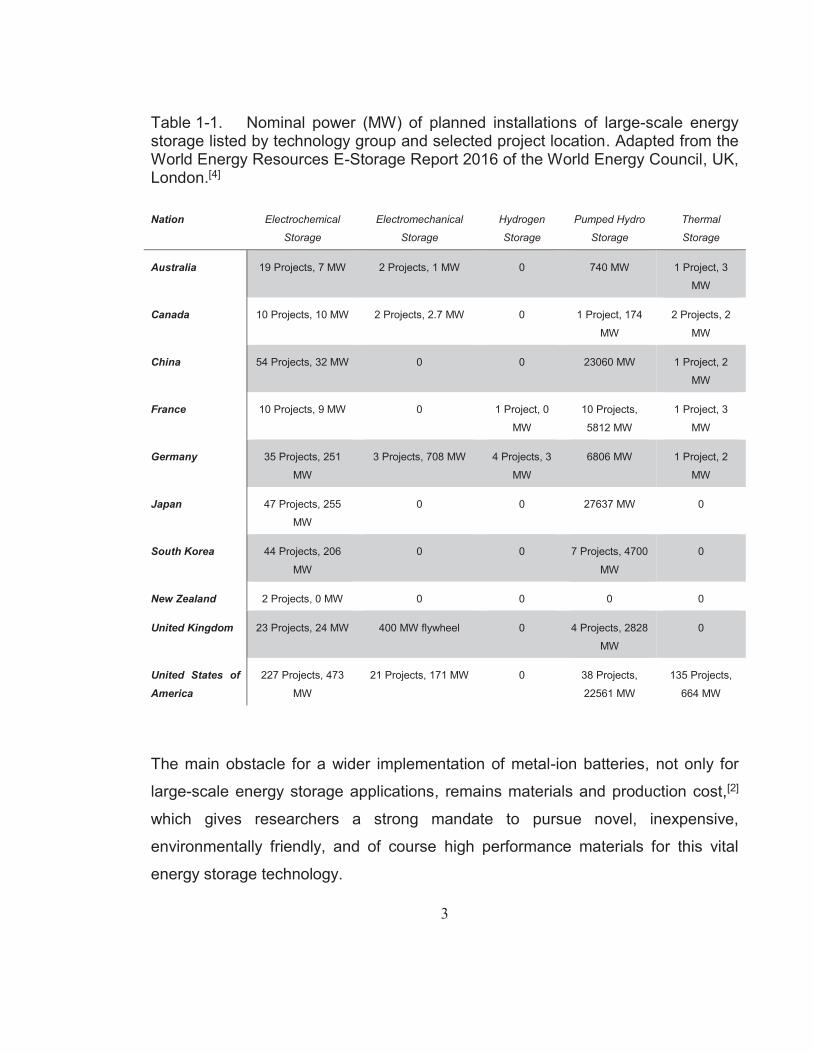
Therefore, it is not surprising that many countries in the developed world are
heavily investing in projects boosting their electrochemical energy storage capacity.
Table 1-1 gives an overview of current projects or planned installation efforts of
energy storage technologies of selected countries (selected by their large number
of projects and relationship to Australia). According to this list provided by the
World Energy Council,[4] the majority of projects in progress focus on
electrochemical energy storage technologies with the United States of America and
China leading the list, followed by Japan and South Korea and members of the
European Union (EU), such as Germany, the United Kingdom (pre-withdrawal from
the EU), and France. Australia, Canada, and New Zealand are also investing in a
diverse range of storage technologies.
3
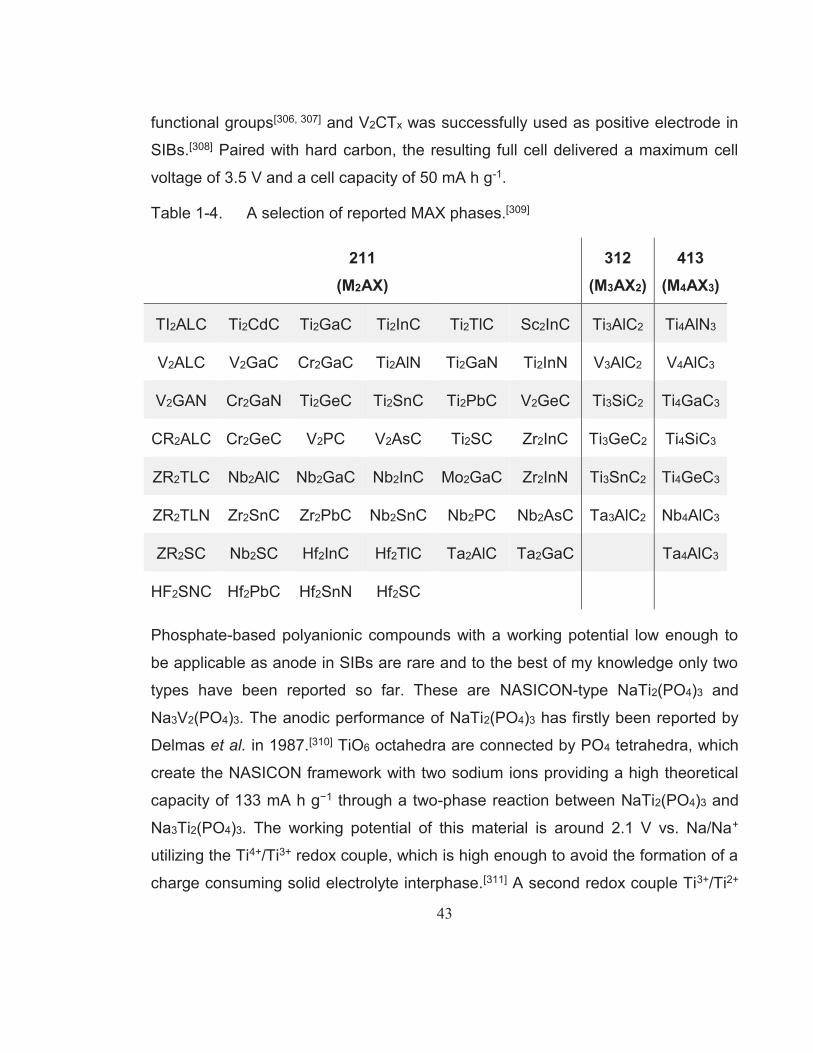
Table 1-1. Nominal power (MW) of planned installations of large-scale energy storage listed by technology group and selected project location. Adapted from the World Energy Resources E-Storage Report 2016 of the World Energy Council, UK, London.[4]
The main obstacle for a wider implementation of metal-ion batteries, not only for
large-scale energy storage applications, remains materials and production cost,[2]
which gives researchers a strong mandate to pursue novel, inexpensive,
environmentally friendly, and of course high performance materials for this vital
energy storage technology.
4
1.1 Phosphate-based Materials for Lithium-ion Batteries
The commercial and technological success of lithium-ion batteries (LIBs) can
mostly be ascribed to the realization of positive electrodes based on transition
metal oxides, such as LixMO2 (M = Co, Ni, Mn), LixMn2O4, LixV2O5, or LixV3O8.[6]
However, three-dimensional (3D) framework materials based on transition metals
and polyanions (XO4)n- have gained global attention due to the discovery and
triumph of LiFePO4.[6-9] Besides their obvious disadvantage in regards to
gravimetric capacity due to the heavy polyanion group, these materials provide
intriguing advantages, such as structural stability, high working potential, and
versatility in atomic arrangement and crystal structure.[6] Therefore, this section will
provide an overview of conducting polyanionic framework materials containing
phosphate groups (PO4)3- for LIBs as well as an introduction into the
electrochemistry of this type of rechargeable battery itself.
1.1.1 Electrochemistry of Lithium-ion Batteries
The alkali metal lithium is classified as the lightest metal in the periodic table,
providing the lowest electrochemical potential (-3.05 vs. SHE), and thus, the
largest gravimetric energy density of all metals.[10-12] However, efforts to develop
rechargeable lithium metal batteries have been plagued by problems of dendrite
formation during repeated stripping/plating and electrolyte decomposition, which
impose serious safety concerns and result in poor cycling efficiency.[12] Therefore,
research efforts have shifted towards non-metallic lithium batteries using lithium
ions provided by either the anode or the cathode material. A breakthrough for LIBs
was accomplished in 1991 when the first LIB was commercialized by Sony.[13] After
decades of intensive research and development, LIBs are now widely established
as the power source of choice for portable electronics and are beginning to further
dominate the markets of electric vehicle (EV) propulsion and residential solar
battery storage.[14]
5
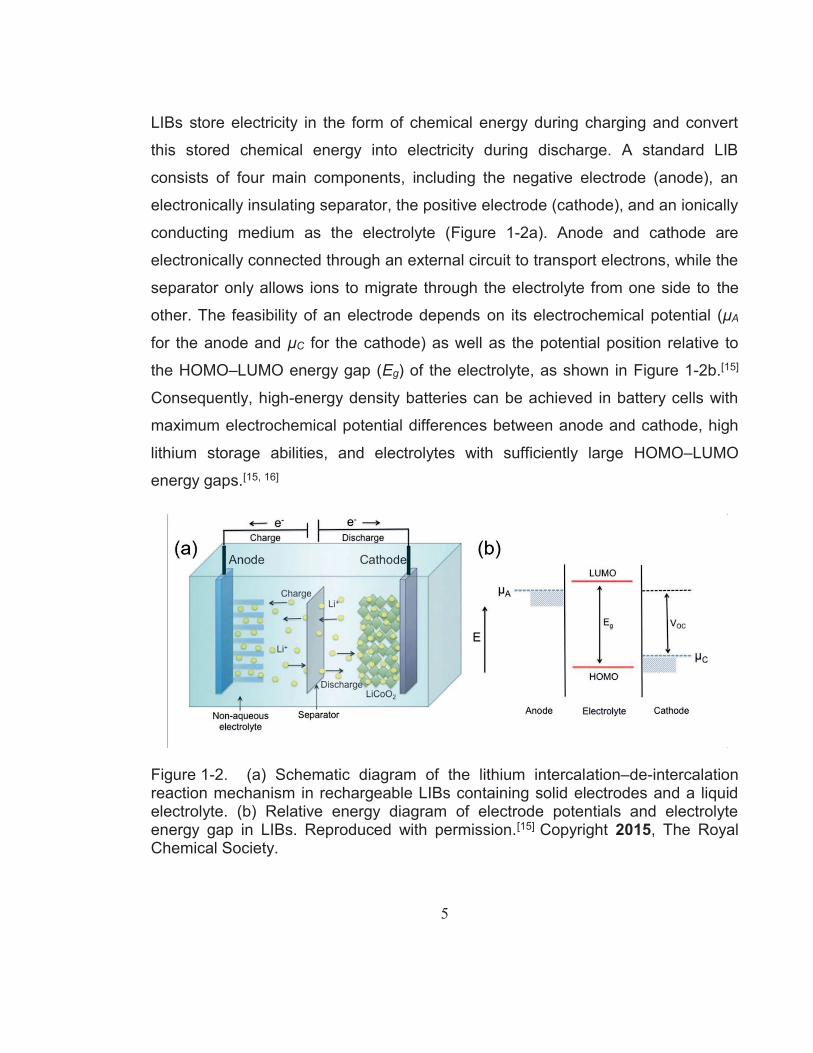
LIBs store electricity in the form of chemical energy during charging and convert
this stored chemical energy into electricity during discharge. A standard LIB
consists of four main components, including the negative electrode (anode), an
electronically insulating separator, the positive electrode (cathode), and an ionically
conducting medium as the electrolyte (Figure 1-2a). Anode and cathode are
electronically connected through an external circuit to transport electrons, while the
separator only allows ions to migrate through the electrolyte from one side to the
other. The feasibility of an electrode depends on its electrochemical potential (μA
for the anode and μC for the cathode) as well as the potential position relative to
the HOMO–LUMO energy gap (Eg) of the electrolyte, as shown in Figure 1-2b.[15]
Consequently, high-energy density batteries can be achieved in battery cells with
maximum electrochemical potential differences between anode and cathode, high
lithium storage abilities, and electrolytes with sufficiently large HOMO–LUMO
energy gaps.[15, 16]
Figure 1-2. (a) Schematic diagram of the lithium intercalation–de-intercalation reaction mechanism in rechargeable LIBs containing solid electrodes and a liquid electrolyte. (b) Relative energy diagram of electrode potentials and electrolyte energy gap in LIBs. Reproduced with permission.[15] Copyright 2015, The Royal Chemical Society.
6
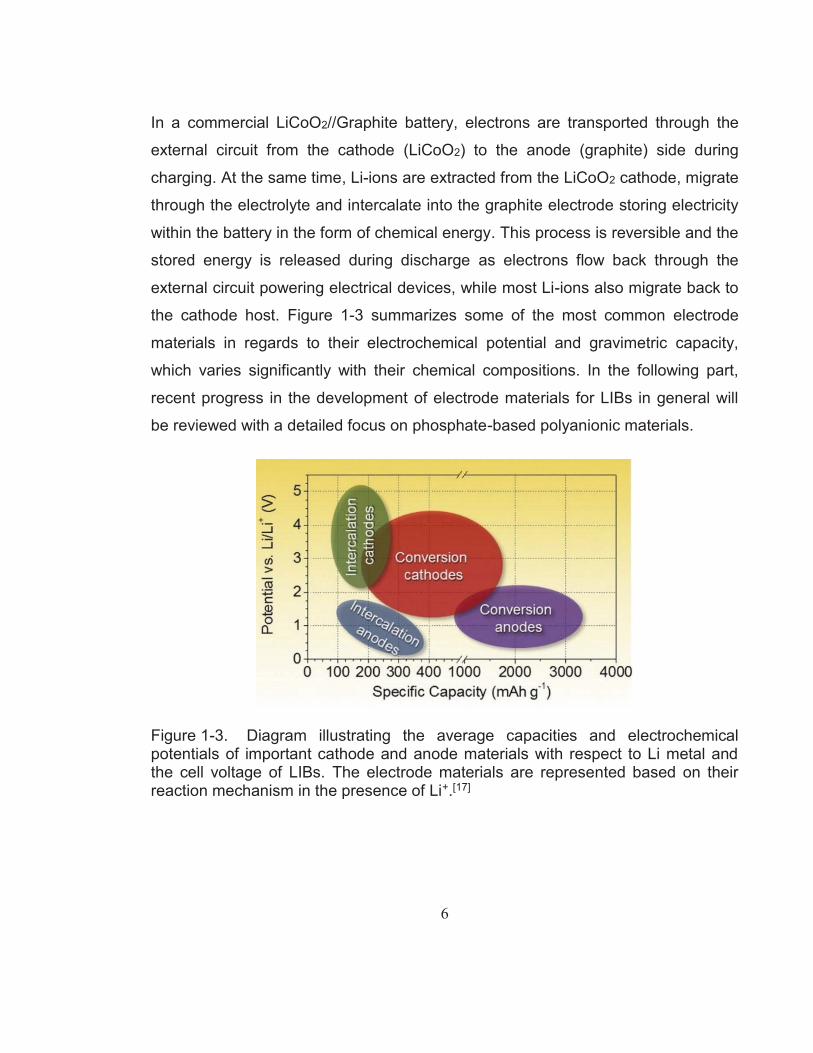
In a commercial LiCoO2//Graphite battery, electrons are transported through the
external circuit from the cathode (LiCoO2) to the anode (graphite) side during
charging. At the same time, Li-ions are extracted from the LiCoO2 cathode, migrate
through the electrolyte and intercalate into the graphite electrode storing electricity
within the battery in the form of chemical energy. This process is reversible and the
stored energy is released during discharge as electrons flow back through the
external circuit powering electrical devices, while most Li-ions also migrate back to
the cathode host. Figure 1-3 summarizes some of the most common electrode
materials in regards to their electrochemical potential and gravimetric capacity,
which varies significantly with their chemical compositions. In the following part,
recent progress in the development of electrode materials for LIBs in general will
be reviewed with a detailed focus on phosphate-based polyanionic materials.
Figure 1-3. Diagram illustrating the average capacities and electrochemical potentials of important cathode and anode materials with respect to Li metal and the cell voltage of LIBs. The electrode materials are represented based on their reaction mechanism in the presence of Li+.[17]
7
1.1.2 Anode Materials for Lithium-ion Batteries
Extensive research activities have been directed towards the development of
advanced anode materials for LIBs in past decades. Anode materials that have
been identified can be classified in three different categorise according to the
underlying reaction mechanism with metal ions in an electrochemical cell. These
three types of anode reactions are conversion, alloying, and intercalation, which
will be discussed in a brief review of the anode material development for LIBs in
the following sections. As phosphate-based polyanionic materials belong to the
intercalation group, this reaction mechanism will be discussed in more detail in the
last subsection.
1.1.2.1 Anode Materials based on Conversion and Alloying Reactions
Conversion
In 2000, the reversible reduction of transition metal oxide nanoparticles (TMOs
NPs), such as CoO, CuO, and Fe2O3, in the presence of Li+ was reported for the
first time.[18] This process is known as “conversion reaction’ and its general
chromium,[35, 36] tungsten,[37-39] and mixed metal oxides.[40] Figure 1-4 shows a
schematic illustration of the conversion reaction of TMOs in the presence of Li+.
8
Figure 1-4. Schematic illustration of the conversion reaction of a transition metal oxide in LIBs. Reproduced with permission.[40] Copyright 2016, WILEY-VCH Verlag GmbH & Co. KGaA, Weinheim.
From Equation (1-1), 2y Li+ per formula unit of TMO can be stored through a
conversion reaction, which causes structural change and amorphization of the
TMO, and consequently, large volume expansions (Figure 1-4).[40] Nanoscale
transition metal clusters are embedded in the lithium oxide (Li2O) matrix after the
initial lithiation is completed. During delithiation, these transition metal clusters are
then oxidized to form amorphous TMOs as delithiation often results in a different,
more kinetically favourable metal oxide phase.[41] Several issues that keep these
compounds from commercial success still have to be resolved. Among those, the
most relevant are i) the strong structural re-organization inducing large volume
changes that result in electrode pulverization and poor cycling performance, ii)
large voltage hysteresis between discharge and charge processes, iii) low initial
Coulombic efficiency.[19, 40, 41] Nanostructured TMOs anode materials with different
morphologies have been intensively investigated to minimize the strain derived
from the volume change, which also improved electrode-electrolyte contact and
diffusion lengths for Li+ in the active materials, leading to high rate capabilities.[21,
42-45] Furthermore, reports of reversible conversion reactions in binary M–X
compounds with X = N,[46-48] F,[49, 50] S,[51-54] P,[55-57] and H[19] have proven that the
conversion reaction concept is not limited to only the TMO group.
9
Alloying
Like conversion reaction materials, alloying anode materials undergo a solid-state
redox reaction during lithiation/delithiation. This reaction is accompanied by
changes in crystalline structure that result in breaking and recombining of chemical
bonds. Therefore, the alloying reaction in the presence of Li+ can also be referred
to as Type B conversion corresponding to the following equation:[17]
yLi + X ↔ LiyX (1-2)
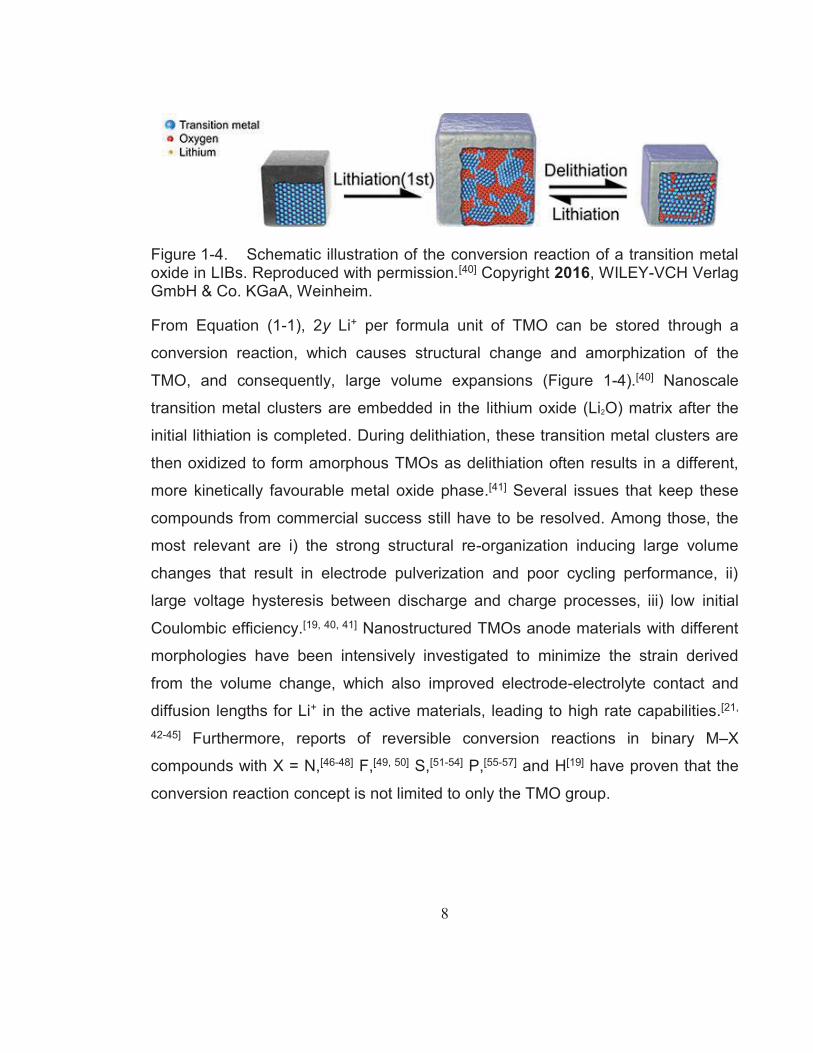
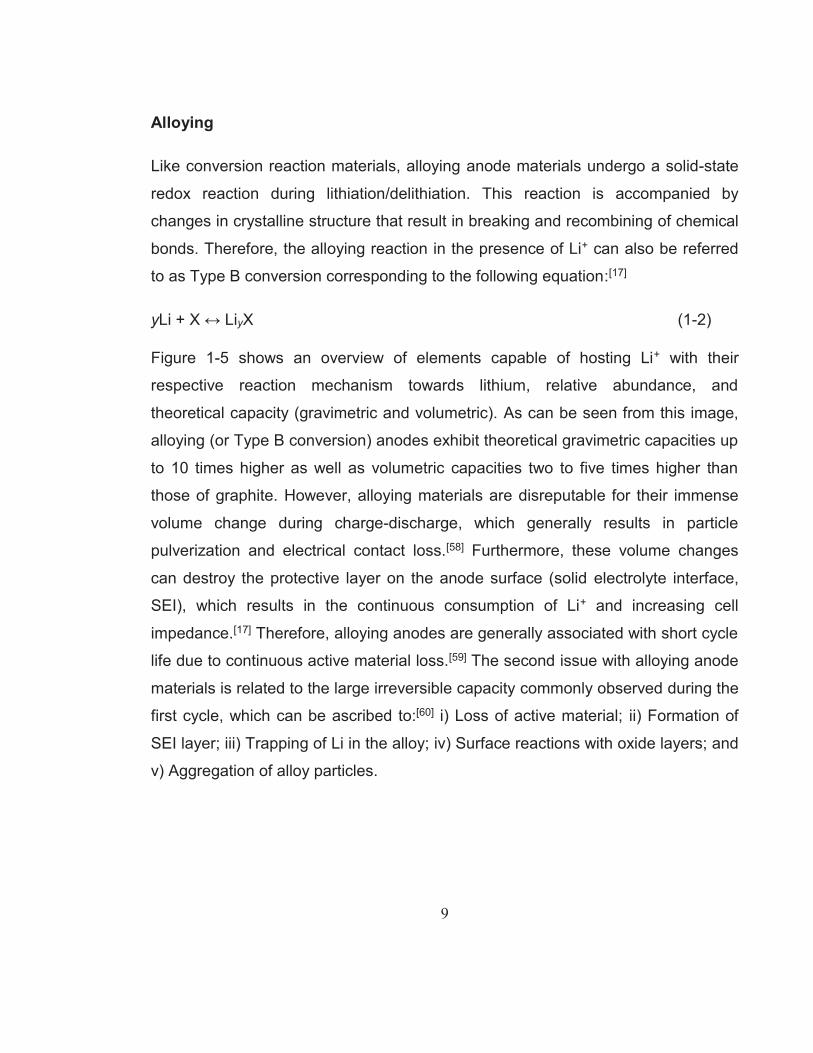
Figure 1-5 shows an overview of elements capable of hosting Li+ with their
respective reaction mechanism towards lithium, relative abundance, and
theoretical capacity (gravimetric and volumetric). As can be seen from this image,
alloying (or Type B conversion) anodes exhibit theoretical gravimetric capacities up
to 10 times higher as well as volumetric capacities two to five times higher than
those of graphite. However, alloying materials are disreputable for their immense
volume change during charge-discharge, which generally results in particle
pulverization and electrical contact loss.[58] Furthermore, these volume changes
can destroy the protective layer on the anode surface (solid electrolyte interface,
SEI), which results in the continuous consumption of Li+ and increasing cell
impedance.[17] Therefore, alloying anodes are generally associated with short cycle
life due to continuous active material loss.[59] The second issue with alloying anode
materials is related to the large irreversible capacity commonly observed during the
first cycle, which can be ascribed to:[60] i) Loss of active material; ii) Formation of
SEI layer; iii) Trapping of Li in the alloy; iv) Surface reactions with oxide layers; and
v) Aggregation of alloy particles.
10
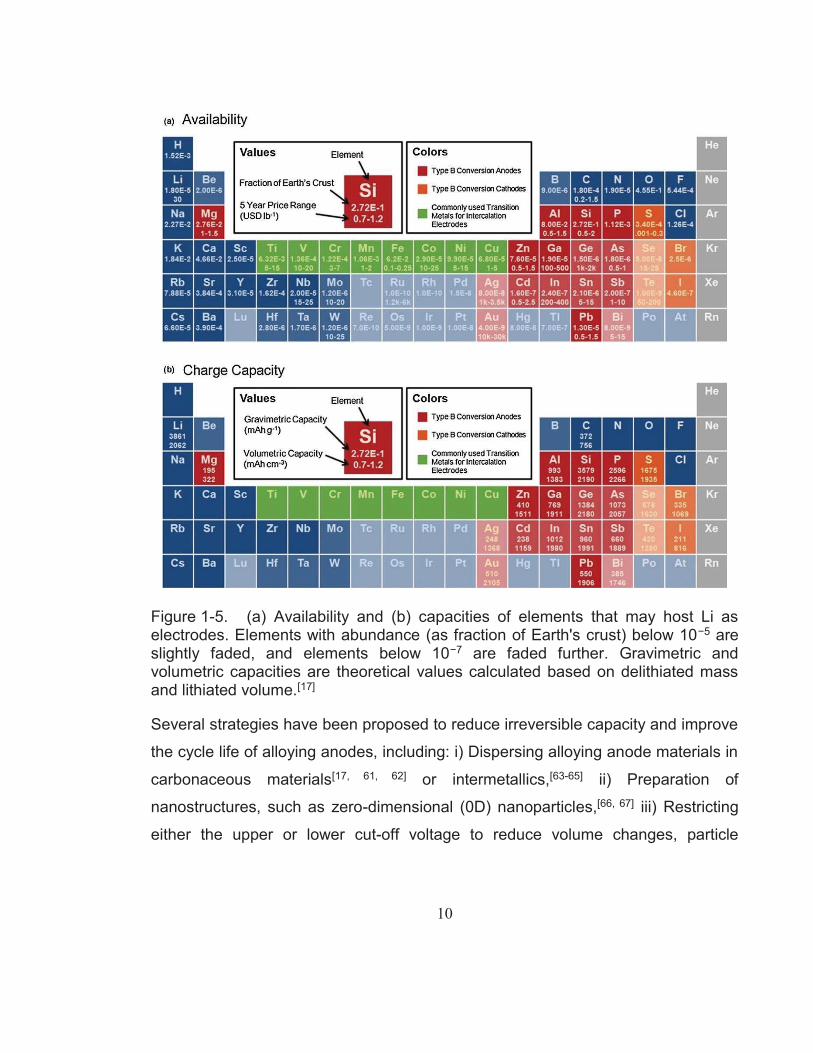
Figure 1-5. (a) Availability and (b) capacities of elements that may host Li as electrodes. Elements with abundance (as fraction of Earth's crust) below 10−5 are slightly faded, and elements below 10−7 are faded further. Gravimetric and volumetric capacities are theoretical values calculated based on delithiated mass and lithiated volume.[17]
Several strategies have been proposed to reduce irreversible capacity and improve
the cycle life of alloying anodes, including: i) Dispersing alloying anode materials in
carbonaceous materials[17, 61, 62] or intermetallics,[63-65] ii) Preparation of
nanostructures, such as zero-dimensional (0D) nanoparticles,[66, 67] iii) Restricting
either the upper or lower cut-off voltage to reduce volume changes, particle
11
aggregation, and structural changes,[68, 69] and iv) Optimization of applied binder
materials and electrolyte composition.[70]
1.1.2.2 Anode Materials based on Intercalation
In chemistry, the term intercalation describes the reversible insertion of a guest
species (Li+ in the case of LIBs) into a laminar host structure without compromising
the structural features of the host (Figure 1-6).[71] The most significant intercalation
anode materials for LIBs are graphite and Li4Ti5O12 (LTO). The crystal structures of
their respective intercalated phases are shown in Figure 1-7.
The intercalation of Li+ into graphite proceeds in stages through phase transition
reactions[72] and can be described using the following general equation:[73]
C6 + Li+ + e- ↔ LiC6 (1-3)
A first polarization of graphite electrodes in polar aprotic Li salt electrolytes
consumes irreversible charge for the reduction of solution species.
Figure 1-6. Schematic representation showing insertion/extraction of Li+ during discharge/charge. Adapted and reproduced with permission.[74] Copyright 2008, Nature Publishing Group.
12
Figure 1-7. Crystal structures of (a) lithiated graphite (Reproduced with permission.[75] Copyright 2014, American Chemical Society) and (b) lithium titanate (LTO) (Reproduced with permission.[76] Copyright 2011, American Chemical Society).
This process results in a passivating film or SEI layer that prevents further
irreversible processes.[73] Therefore, graphite containing LIBs require a Li source,
the cathode material, in excess, in order to provide the Li+ needed to form the SEI
layer on the electrode surface.[45, 73] Graphite provides intriguing advantages over
other anode materials, including low cost, abundance, low delithiation potential,
high ionic and electronic conductivity, and low volume changes during charge-
discharge. This commercially very attractive balance of low cost, availability,
energy and power density, and cycle life is responsible for the commercial success
of current LIBs.[17] However, although its gravimetric capacity is higher than that of
most commercialized cathode materials, the small volumetric capacity of
commercial graphite (330–430 mA h cm−3) warrants the search for new high-
performance anode materials. Apart from graphite, carbon nanostructures with
improved electrochemical properties and commercialization potential have been
investigated, including one-dimensional (1D) carbon nanotubes (CNTs)[77, 78] and
carbon nanofibers (CNFs),[79] two-dimensional (2D) graphene,[80, 81] and porous
carbonaceous materials.[82]
13
Li4Ti5O12 (LTO) owes its commercial success to a combination of superior thermal
stability, high rate capabilities, relatively high theoretical volumetric capacity (600
mA h cm−3), and long cycle life.[83] However, the higher cost of Ti, high working
potential ( 1.55 V vs. Li/Li+) and thus reduced cell voltage, and low theoretical
gravimetric capacity (175 mA h g−1) are disadvantageous to some degree.[17] Its
high rate capabilities and superior cycling stability originate from a “zero strain” Li+
intercalation mechanism combined with a lithiation potential higher than the
reduction potentials of most relevant aprotic electrolyte solutions.[84] Initially
conceived as disadvantage, a higher lithiation potential (>1 V vs. Li/Li+) largely
avoids the formation and growth of a passivating SEI layer to the benefit of reaction
kinetics and preservation of the Li+ reservoir.[85] However, surface reactions may
not be completely avoidable. LIBs containing LTO as anode material suffer from
severe gassing due to a reaction between the organic electrolyte and the LTO
active material,[86] which can be suppressed by the introduction of a carbon coating
sacrificing some thermal stability of the active material.[87] Furthermore, LTO
greatly benefits from a carefully engineered carbon coating showing a dramatic
increase in rate performance compared to carbon-free LTO electrodes.[88]
Therefore, LTO is considered a practical anode material choice for lower energy
but high power LIBs with a long cycle life.[17, 85]
The first report on the Li+ storage properties of rhombohedral LiTi2(PO4)3 (LTP)
was published by Delma and co-workers in 1988.[89] The crystal structure of LTP
consists of PO4 tetrahedra and TiO6 octahedra with large channels that provide two
types of interstitial sites, which are generally referred to as M1 and M2, as shown
in Figure 1-8a.[90] Li+ in LTP selectively occupy the M1 sites whereas Li+
intercalation occurs by filling of the M2 cavities. This involves the cooperative
migration of Li+ from the M1 to the M2 sites until the Li3Ti2(PO4)3 phase is
established.[6, 90] With two Li+ being inserted into the structure, a significant
increase in the c/a ratio of the hexagonal unit cell occurs due to stronger
14
electrostatic repulsion between [Ti2(PO4)3] lanterns along [001] when the M1 sites
are being emptied, which results in the loss of the R3c symmetry.[91] A new pair of
tetrahedral sites occupied by Li+, which are referred to as M3’ and M3”, were found.
With the M3’ and M3” sites being included within the M2 cavity they are believed to
play a vital role in the Li+ diffusion process.[92] The expected insertion product is
Li3Ti2(PO4)3, corresponding to a two-ion insertion at a voltage plateau of 2.48 V vs.
Li/Li+ corresponding to the redox couple of Ti4+/Ti3+:[6, 91]
LiTi2(PO4)3 + 2Li+ + 2e- ↔ Li3Ti2(PO4)3 (1-4)
However, several reports have shown an additional redox couple located at around
2.8 V, as seen in Figure 1-8b.[93-95] According to a study conducted by Hany El-
Shinawi and Jürgen Janek,[93] this phenomenon suggests that the M1 sites of LTP
are partially empty due to a disorder of lithium over the M1 and M2 sites. They
explain that the reduction peak observed at around 2.75 V corresponds to the filling
of the M1 sites by incoming Li+, whereas the second reduction peak at 2.35 V
correlates to the insertion of excess Li+ into the M2 site. The specific capacity
gained by this additional reduction process accounts for approximately 17% of the
total gravimetric capacity or 0.38 Li per unit formula. LTP provides a satisfactory
theoretical capacity of 138 mA h g-1 and high ionic conductivity of ≈10−6 S cm−1 but
might remain only potentially viable in organic electrolyte systems for niche
applications, such as monolithic integration of thin-film solar cells and LIBs.[90]
However, LTP can be applied as anode material in aqueous LIB systems due its
stability towards the LUMO of water. Successful aqueous full battery assemblies
include the combination of LTP with cathode materials such as LiMn2O4[96] and
LiFePO4.[97]
15
Figure 1-8. (a) Part of the NASICON-type crystal structure showing the M1 and M2 crystal sites and (b) Slow sweep cyclic voltammograms of carbon coated LTP collected at 0.1 mV s−1.[93]
Vanadium-containing polyanionic phosphate materials have attracted tremendous
amounts of research interest due to the possibility of multi-electron transfers, which
is the result of the number of available redox couples: V5+/V4+, V4+/V3+, and
V3+/V2+.[91] Among many high performance vanadium phosphate materials, which
are generally used as cathode materials for rechargeable battery systems,
Li3V2(PO4)3 (LVP) has also been considered as potential high power anode
material for LIBs (its cathodic performance will be discussed in Section 1.1.3). LVP
can be synthesized as either rhombohedral (NASICON, r-LVP) or monoclinic (anti-
NASICON, m-LVP), which results in different electrochemical properties.[6, 98]
16
Figure 1-9. NASICON (generally rhombohedral) and anti-NASICON (generally monoclinic) frameworks of general formula AxMM′(XO4)3. A = Li, Na, K, Mg, Ca; M or M’ = Fe, V, Ti, Zr, Sc, Mn, Nb, In; X = S, P, Si, As. Reproduced with permission.[6] Copyright 2013, American Chemical Society.
The first successful preparation of r-LVP was reported in 2000 by Nazar and co-
workers,[99] which was achieved through a topotactic ion exchange procedure from
its sodium analogue. To date, the only known report on the anodic performance of
r-LVP was published by Jian et al. in 2014.[98] In this study, evidence was
presented showing that two additional Li+ can be inserted into the structure
corresponding to the V3+/V2+ redox couple at an average voltage of 1.75 V vs. Li/Li+,
similar to the anodic performance of LTO presented earlier. Further investigations
at potentials below 1.0 V have not been conducted in this study; however, a
successful experiment of a symmetric full cell showed potential for large-scale
energy storage systems. The experimental cell provided an output of around 2 V
with an energy density of 113 W h kg-1.
17
Since r-LVP cannot directly be prepared using traditional preparation methods,
more research has been focused on the thermodynamically stable monoclinic
phase m-LVP. Generally, the insertion/extraction of Li+ in m-LVP follows a
complicated series of successive two-phase transitions, as seen in Figure 1-10.[6]
For the anodic performance of the V3+/V2+ redox couple, four distinct plateaus or
redox peaks can be seen in this images, corresponding to the insertion/extraction
Different reports on m-LVP achieved stable reversible capacities of around 88 to
126 mA h g-1 when cycled between 3.0-1.0 V vs. Li/Li+.[100-102] However, the initial
study on the anodic behaviour of m-LVP conducted by Rui et al. also investigated
the electrochemical behaviour in a potential window of 3.0-0.0 V vs. Li/Li+.[101] Their
study found that, in addition to the two-phase region at 2.0-1.6 V vs. Li/Li+, m-LVP
displays a single-phase region below 1.6 V vs. Li/Li+ corresponding to the V2+/V+
redox couple allowing two additional Li+ to be inserted/extracted from the lattice:
Li5V2(PO4)3 + 2Li+ = 2e- ↔ Li7V2(PO4)3 (1-9)
This additional single-phase region increases the theoretical gravimetric capacity of
m-LVP to 266 mA h g-1 (assuming four Li+ are being reversibly inserted/extracted),
which is much higher that the theoretical value in the cathode potential region (197
mA h g-1 when cycled to 4.8 V vs Li/Li+).
18
Figure 1-10. Galvanostatic Li+ insertion/extraction and respective redox couples in anti-NASICON LixM2(PO4)3 (M = Fe, V) compositions. Reproduced with permission.[6] Copyright 2013, American Chemical Society.
A later study conducted by Zhang et al. confirmed this observation.[103] In their
study, a nanostructured carbon-coated m-LVP material was applied as anode in a
LIB achieving a reversible capacity of 236 mA h g-1 a 1C. Interestingly, they further
found that the single-phase region below 1.6 V vs Li/Li+ showed only minor
variations and higher values in lithium diffusion coefficient compared to the
behaviour observed in the two-phase region at higher potentials. This implies great
potential for high power applications. As seen in Figure 1-11, this nanostructured
m-LVP material provides a remarkable rate performance with a high rate capacity
of 99 mA h g-1 at 100C (26.6 A g-1). As the authors emphasize, this performance is
comparable with supercapacitor applications. According to these findings, m-LVP
cycled to 0.0 V vs. Li/Li+ can be considered for both innovative high power
applications as well as high energy LIBs.
19
Figure 1-11. Rate performance of m-LVP cycled in the potential range of 3.0–0.0 V vs. Li/Li+. (a) Delithiation capacity retention. (b) Corresponding potential profiles.[103]
1.1.3 Cathode Materials for Lithium-ion Batteries
The role of the positive electrode in modern LIBs has been dominantly filled by
LiCoO2 since it was firstly demonstrated as a possible cathode material for
rechargeable lithium batteries in 1980.[104] Following this discovery, transition metal
intercalation oxides have been extensively investigated;[105] however, an increasing
number of new potential cathode materials have emerged since. Conventional
cathode materials can be categorized by their respective structure and those
Since then, Li2MnSiO4 cathode materials have been widely investigated with many
failed experimental efforts to achieve good electrochemical performances, which is
due to their inherent disadvantages:[163] i) Low electronic conductivity (less than
10−14 S cm−1);[164-166] ii) Jahn–Teller distortion of Mn3+ ions and Mn dissolution;[167,
168] iii) Li+ and Mn2+ become site-exchanged during delithiation, which leads to large
electrode polarization and structure destabilization;[169] and iv) inactive impurity
phases, such as MnO and Li2SiO3.[170] More research is needed to improve
physical and electrochemical properties of silicate-based materials by optimizing
their structure, synthesis procedures, and morphology. Interestingly, recent reports
on the performance of silicate-based materials as negative electrode in LIBs have
emerged.[171, 172] Both studies report reversible discharge capacities of 450-550 mA
h g-1 for Fe- and Mn-containing silicates. The authors proposed that the silicates
undergo a highly reversible conversion reaction at low potentials, similar to that of
transition metal oxide anode materials, which also requires further investigation.
Borate compounds LiMBO3
As polyanionic materials generally come with a weight penalty in form of reduced
energy density due to the heavy polyanion group, LiMBO3 compounds have
attracted interest because of the light borate (BO33-) group.[173] The crystal structure
of monoclinic LiMBO3 is illustrated in Figure 1-15. In 2001, Legagneur et al. first
reported the electrochemical properties of LiMBO3 (M = Mn, Fe, Co) showing very
poor electrochemical activity (only 0.04Li per formula, or 9 mA h g-1), whereas the
theoretical capacity was calculated to be as high as 220 mA h g-1.[174] The redox
couple Fe3+/Fe2+ in the voltage window of 2.9–3.1 V vs Li/Li+ was proposed, which
implies superior energy density of around 660 W h kg-1. Until 2010, all attempts to
improve the electrochemical performance of borate-based cathode materials
remained unsatisfactory and their poor conductivity and kinetic limitations were
blamed for their poor performance.[106, 175-177]
26
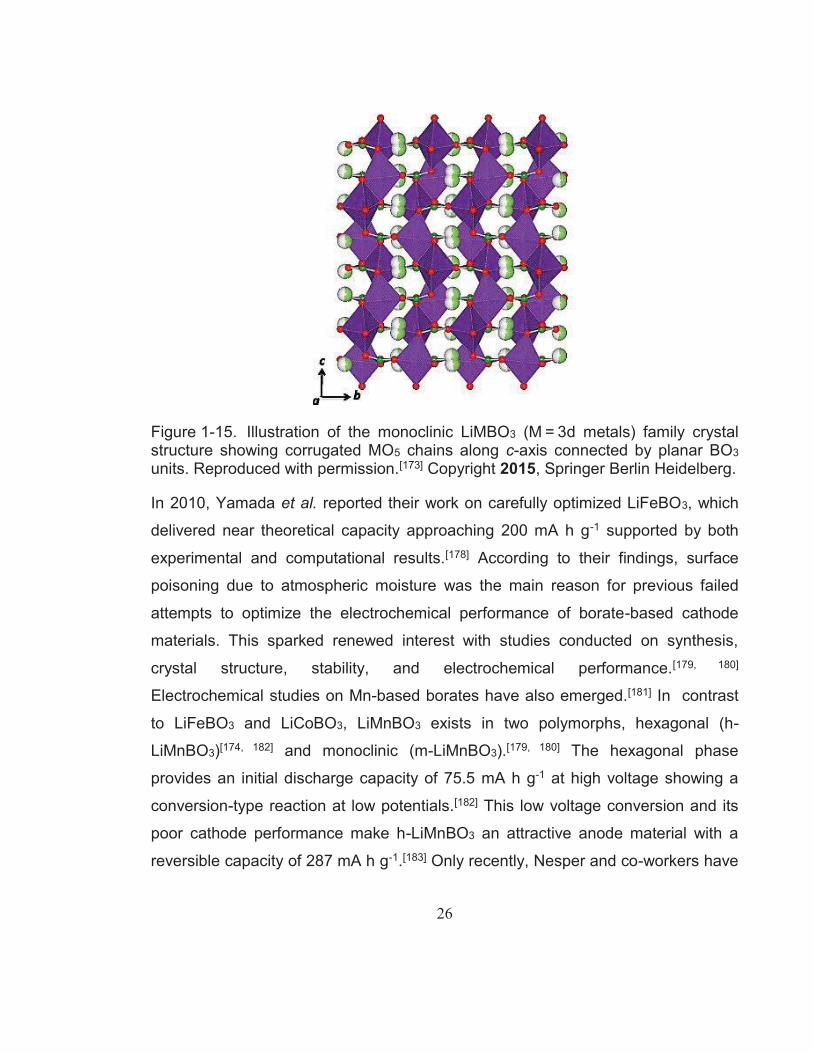
Figure 1-15. Illustration of the monoclinic LiMBO3 (M = 3d metals) family crystal structure showing corrugated MO5 chains along c-axis connected by planar BO3 units. Reproduced with permission.[173] Copyright 2015, Springer Berlin Heidelberg.
In 2010, Yamada et al. reported their work on carefully optimized LiFeBO3, which
delivered near theoretical capacity approaching 200 mA h g-1 supported by both
experimental and computational results.[178] According to their findings, surface
poisoning due to atmospheric moisture was the main reason for previous failed
attempts to optimize the electrochemical performance of borate-based cathode
materials. This sparked renewed interest with studies conducted on synthesis,
crystal structure, stability, and electrochemical performance.[179, 180]
Electrochemical studies on Mn-based borates have also emerged.[181] In contrast
to LiFeBO3 and LiCoBO3, LiMnBO3 exists in two polymorphs, hexagonal (h-
LiMnBO3)[174, 182] and monoclinic (m-LiMnBO3).[179, 180] The hexagonal phase
provides an initial discharge capacity of 75.5 mA h g-1 at high voltage showing a
conversion-type reaction at low potentials.[182] This low voltage conversion and its
poor cathode performance make h-LiMnBO3 an attractive anode material with a
reversible capacity of 287 mA h g-1.[183] Only recently, Nesper and co-workers have
27
succeeded in enabling the h-LiMnBO3 polymorphs capabilities by nanoparticle
engineering delivering a discharge capacity of around 140 mA h g-1 with good
cycling stability.[184, 185] For the monoclinic phase, electrochemical performances
were first shown in 2011.[179, 180] Although a capacity of around 100 mA h g-1 was
achieved, large polarization and improved performance at elevated temperatures
indicate intrinsic kinetic limitations. Chemical analysis of partially oxidized Li1-
xMnBO3 suggests that progressive delithiation induces structural disintegration and
phase decomposition.[173] Furthermore, irreversible Mn dissolution originating from
the chemical instability of Mn3+ in Li1-xMnII/IIIBO3 may occur.[179, 186] In recent years,
some groups have reported the usage of mixtures of both polymorphs (m + h-
LiMnBO3) as cathode candidate produced by several different preparation
methods.[187-190] This approach generated m + h-LiMnBO3 compounds achieving a
reversible capacity of over 170 mA h g-1, close to the theoretical capacity for
LiMnBO3 of 222 mA h g-1. The last member of the LiMBO3 family is LiCoBO3. With
a theoretical capacity of 215 mA h g-1 and working potential of 4 V vs Li/Li+ utilizing
the Co3+/Co2+ redox couple, this material can provide a theoretical energy density
of 860 Wh kg-1.[191] However, efforts to enhance electronic conductivity, Li diffusivity,
and mechanical stability have been widely unsuccessful and LiCoBO3 remains the
least explored and most challenging member of the LiMBO3 family.[173]
1.1.3.2 Phosphate-based Cathode Materials for Lithium-ion Batteries
Olivine compounds LiMPO4
Olivine LiMPO4 materials have received tremendous research attention because of
the stability of the polyanion group, which minimizes oxygen loss observed in
traditional layered and spinel oxides.[106] The crystal structure of olivine LiMPO4 is
displayed in Figure 1-16a. Since it was first reported by Goodenough and co-
workers, olivine LiFePO4 has received the most research attention due to its
stability, and environment friendliness.[7, 8] In LiFePO4, P occupies the tetrahedral
sites, Fe occupies the octahedral sites, and Li forms 1D chains along the [010]
direction. LiFePO4 undergoes a reversible transition to FePO4 during
discharge/discharge utilising the Fe2+/Fe3+ redox couple at 3.4 V vs. Li/Li+, as
schematically shown in Figure 1-16b, providing a theoretical capacity of 170 mA h
g-1.[43] Unfortunately, LiFePO4 is known for its low electronic conductivity (around
10−9 S cm−1)[192] and sluggish Li+ diffusion (around 10−14 cm2 s−1).[193] Li+ in the
lattice of LiFePO4 can only migrate along the [010] direction because there are no
continuous LiO6 octahedra in the direction of the a- and c-axis.[194-196] Furthermore,
the Li+ diffusion in LiFePO4 is not only insufficient but also easily affected by crystal
defects.[197, 198] To improve the electrochemical performance of LiFePO4, strategies
such as surface decoration[199-201], nanocrystallization,[202-205] and lattice substitution
(doping)[206-209] have been employed to promote electronic conductivity and Li+
diffusion. Olivine compounds can also be prepared with other transition metal ions,
such as Mn, Co, and Ni, each providing different active redox couples and
corresponding working voltages: 4.1 V vs. Li/Li+ for LiMnPO4,[210] 4.8 V vs. Li/Li+ for
LiCoPO4,[211] and 5.1 V vs. Li/Li+ for LiNiPO4.[212]
29
Figure 1-16. (a) Crystal structure of olivine LiMPO4 (blue: transition metal ions; yellow: P ions; red: Li ions) Reproduced with permission.[106] Copyright 2012, Elsevier. (b) Schematic representation of the processes during charge/discharge of LiFePO4. Reproduced with permission.[43] Copyright 2008, WILEY-VCH Verlag GmbH & Co. KGaA, Weinheim.
Due to the stability limitation at high potentials of current organic electrolytes, most
research has been focused on LiMnPO4 and divalent doping of LiFePO4 to
optimize working potential electrochemical performance.[106, 213, 214] Besides
electrochemical optimization efforts, fundamental studies on olivine materials are
also intensively conducted. For bulk LiFePO4, the working voltage profile plateau is
located at around 3.45 V vs. Li/Li+, which is indicative of a two-phase
lithiation/delithiation process.[7] The two-phase mechanism proposed suggested the
so-called shrinking core model, wherein the phase boundary moves from the
outside to the inside of the particles for both charge and discharge processes,
becoming diffusion limited after reaching a critical surface area (see Figure 1-17).[7,
106, 215] Once Li+ diffusion through the interface cannot sustain the given current
density, the reaction comes to a halt without consuming the residual active material
inside the two-phase interface, which greatly affects the utilization of active
material (residual LiFePO4 in state C of Figure 1-17).[214]
30
Figure 1-17. Two phase mechanism of LiFePO4. Reproduced with permission.[214] Copyright 2016, The Royal Society of Chemistry.
In 2006, Chen et al. conducted TEM studies and observed the occurrence of
disordered transition zones in the bc-plane, as the phase boundary progresses in
the direction of the a-axis, with the Li+ moving in a direction parallel to the phase
boundary, implying that the well adopted shrinking core model does not apply to
individual crystallites.[216] Laffont et al. conducted a high-resolution electron energy
loss spectroscopy study and confirmed that the classical shrinking core model
cannot sufficiently describe the lithiation/delithiation mechanism in LiFePO4.[217]
Later in 2008, the domino-cascade model to describe the delithiation mechanism
was introduced by Delmas et al. (Figure 1-18).[218] The intercalation and
deintercalation processes are described to proceed in waves moving through the
crystal along a-axis without any energy barrier that allows lithium
intercalation/deintercalation to advance at very high rates, explaining the fast
kinetics of LiFePO4 crystals in the nano scale. This was further confirmed using
precession electron diffraction in 2011 where phase maps at the nanometre scale
of a large number of particles between 50–300 nm in size in a partially charged cell
showed that the particles are either fully lithiated or fully delithiated.[219] However,
the authors state that the classic shrinking core model may still be valid in the
mesoscale (scale of agglomerates of particles). The debate on the validity of either
of these models still continuous.[214, 220, 221]
31
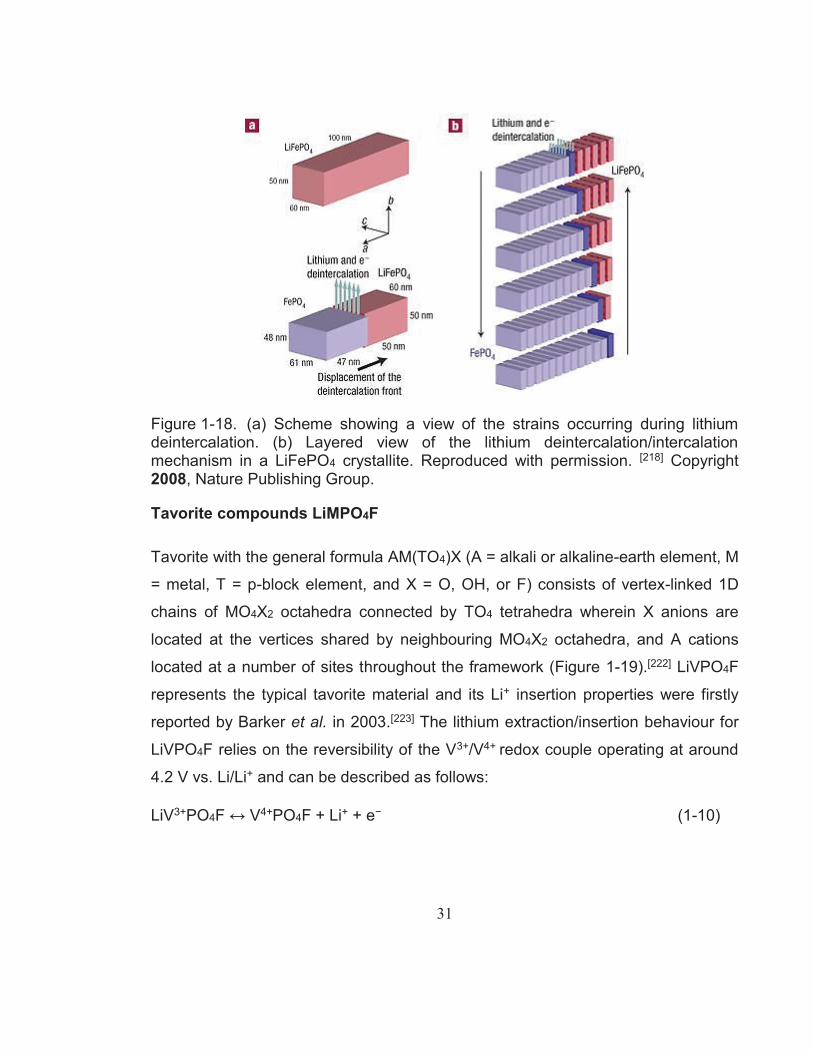
Figure 1-18. (a) Scheme showing a view of the strains occurring during lithium deintercalation. (b) Layered view of the lithium deintercalation/intercalation mechanism in a LiFePO4 crystallite. Reproduced with permission. [218] Copyright 2008, Nature Publishing Group.
Tavorite compounds LiMPO4F
Tavorite with the general formula AM(TO4)X (A = alkali or alkaline-earth element, M
= metal, T = p-block element, and X = O, OH, or F) consists of vertex-linked 1D
chains of MO4X2 octahedra connected by TO4 tetrahedra wherein X anions are
located at the vertices shared by neighbouring MO4X2 octahedra, and A cations
located at a number of sites throughout the framework (Figure 1-19).[222] LiVPO4F
represents the typical tavorite material and its Li+ insertion properties were firstly
reported by Barker et al. in 2003.[223] The lithium extraction/insertion behaviour for
LiVPO4F relies on the reversibility of the V3+/V4+ redox couple operating at around
4.2 V vs. Li/Li+ and can be described as follows:
LiV3+PO4F ↔ V4+PO4F + Li+ + e− (1-10)
32
Figure 1-19. Schematic illustration of the tavorite structure along the b-crystallographic direction. Reproduced with permission.[222] Copyright 2013, American Chemical Society.
Later studies improved phase purity and electrochemical performance, which
achieved discharge capacities around 140 mA h g-1 (approaching the theoretical
capacity of 156 mA h g-1) combined with reasonable cycling stability (90% capacity
retention after 400 cycles at 0.5C) suggesting excellent structural stability.[224, 225]
Furthermore, two distinct lithium insertion/extraction potentials at 1.8 and 4.2 V vs.
Li/Li+ allows this material to be used in symmetric cells containing LiVPO4F as both
positive and negative electrodes with an average voltage output of 2.4 V,[226]
comparable to the performance of LiFePO4/Li4Ti5O12 high-power full cells.[227]
Multidimensional Li+ diffusion pathways that allow for high rate capabilities in the
micron/submicron size realm combined with excellent structural and thermal
stability make this material of interest for future LIBs.[228] LiFePO4F is another
member of the tavorite class receiving some attention, providing a theoretical
capacity of 152 mA h g-1 at a working potential of 2.9 V vs. Li/Li+.[229]
33
Interestingly, LiFePO4F is in its charged state and is subsequently discharged to
form Li2FePO4F, which is different to the behaviour of other intercalation
materials.[230] It was first synthesized in 2007 by Barker et al.[231] and Ramesh et al.
reported its fully lithiated structure in 2010 with a reversible capacity of around 145
mA·h·g−1.[229] However, additional investigations encountered challenges for the
preparation a high-purity LiFePO4F and substantial optimization is needed to
advance this material further.[181]
NASICON compounds LixM2(PO4)3
Phosphate-based NASICON compounds as possible LIB cathode materials have
not been studied widely although many different compositions may exist
theoretically.[232, 233] The two most studied examples of phosphate-based
NASICON cathode materials are iron-based Li3Fe2(PO4)3 and vanadium-based
Li3V2(PO4)3. Li3Fe2(PO4)3 has been reported to exist in two polymorph structures,
monoclinic and rhombohedral, exhibiting very distinct electrochemical properties.
The monoclinic phase of Li3Fe2(PO4)3 consists of corner-sharing PO4 tetrahedra
and FeO6 octahedra, where Li+ occupy two distinct 5-coordinate sites and a single
4-coordinate site.[234] The theoretical capacity of m-Li3Fe2(PO4)3 is 128 mA h g–1 at
a working voltage of 2.8 V vs. Li/Li+ using the Fe2+/Fe3+ redox couple
corresponding to the insertion of two additional Li+. The monoclinic phase displays
two distinct intercalation plateaus at voltages between 2.9 and 2.6 V vs. Li/Li+
suggesting the existence of an intermediate composition Li4Fe2(PO4)3.[9] Its initially
poor Li+ diffusion properties have been addressed using traditional particle size
control and coating techniques.[235, 236] The rhombohedral phase of Li3Fe2(PO4)3
can be prepared from the monoclinic sodium compound Na3Fe2(PO4)3 by ion
exchange in a LiNO3 melt or in a concentrated aqueous solution.[9] Its structure
consists of PO4 tetrahedra and FeO6 octahedra connected through their vertices,
forming [Fe2(PO4)3] lantern units stacked along the [001] direction.[237, 238] Two
34
extra Li+ can be inserted to form Li3+xFe2(PO4)3; however, different to the
monoclinic phase, the insertion occurs in one continuous step or one sloping
plateau at around 2.8 V vs. Li/Li+.[9] Apart from early fundamental studies, both
polymorphs have not received much research interest, possibly due to their low
operating voltage and theoretical capacity. In contrast, Li3V2(PO4)3 has been
studied intensively both as anode (see Section 1.1.2.2) and cathode material due
the series of vanadium redox couples at different voltage regions. For instance,
Li3V2(PO4)3 as a cathode exhibits a capacity of 197 mA h g−1 with the two redox
couples, V5+/V4+ and V4+/V3+, operating at high working potentials.[91, 239] As
mentioned earlier, LVP exists in two polymorph structures, rhombohedral and
monoclinic, which exhibit very different voltage–composition curves as a result of
their structural differences. The rhombohedral structure displays only one voltage
plateau at around 3.7 V vs. Li/Li+ corresponding to the V3+/V4+ redox couple and a
two-phase transition between Li3V2(PO4)3 and Li1V2(PO4)3.[239] The monoclinic
phase, where all three Li are mobile, exhibits better electrochemical properties than
the rhombohedral phase. The thermodynamically stable monoclinic form of
Li3V2(PO4)3 provides three Li+ occupying different lattice sites, where Li1 is located
at the tetrahedral site, and Li2 and Li3 occupy different pseudotetrahedral sites. All
three Li+ are mobile resulting in a theoretical capacity of 197 mA h g-1 and multi-
plateau potential profiles, depending on the cut-off voltage window applied.[91, 239]
As seen in Figure 1-20a, there are four plateaus in the charge profile located at
around 3.6, 3.7, 4.1, and 4.6 V vs. Li/Li+, corresponding to a sequence of phase
transition processes between the single phases of LixV2(PO4)3 (x = 3.0, 2.5, 2.0,
1.0, and 0).[240-242]
35
Figure 1-20. The electrochemical voltage–composition curves of m-Li3V2(PO4)3 in the voltage ranges of 3.0–4.8 V (A) and 3.0–4.3 V (B) vs Li/Li+. Reproduced with permission.[239] Copyright 2014, Elsevier.
In the discharge process, one long slope and two short plateaus can be seen
corresponding to the insertion of two Li+, 0.5 Li+, and 0.5 Li+.[243] Interestingly, when
the upper cut-off voltage is set to 4.3 V vs. Li/Li+, no solid solution region is
observed (Figure 1-20b) and the charge/discharge proceeds via the two-phase
transition processes as follows:[244]
Li3V2(PO4)3 ↔ Li2.5V2(PO4)3 (1-11)
Li2.5V2(PO4)3 ↔ Li2V2(PO4)3 (1-12)
Li2V2(PO4)3 ↔ LiV2(PO4)3 (1-13)
Although this voltage restriction strategy results in reduced reversible capacity, a
more stable capacity retention upon cycling can be obtained.
1.2 Phosphate-based Materials for Sodium-ion Batteries
After decades of efforts, LIBs have pervaded our daily lives. As their applications
progress from solely portable consumer electronics to grid-scale electric energy
36
storage and electric vehicles, cost has been one of the most severe obstacles for
batteries used in these applications.[74] As a consequence, the development of
LIBs heavily depends on the market price of lithium resources. Replacing lithium
with cheaper alternatives might relief the stress of future batteries originating from
price fluctuations when the market inevitably expands. In view of the various
rechargeable batteries systems being currently under development, sodium-ion
batteries (SIBs) are particularly interesting alternatives to LIBs due to their
chemical similarity combined with higher abundance compared to lithium.[245, 246]
The similarities and differences between Li and Na are summarized in Table 1-2.
SIBs and LIBs share identical working principles that involve the reversible
migration of cations/anions across a separator towards the electrodes upon
charge-discharge. Besides the low cost and abundance of sodium, Al also does
not form a binary alloy with sodium at a low voltage, unlike in LIBs, which enables
the use of aluminium as a current collector for anodes of SIBs, leading to further
reduced cost. However, the larger ionic radius of Na+ (1.02 Å) compared to that of
Li+ (0.76 Å) makes it difficult to identify suitable electrode materials for SIBs.
Successful reversible intercalation hosts must possess channels and interstitial
sites large enough to accept the larger Na+ cations. The following sections will
introduce a selection of electrode materials for SIBs with a special focus on
phosphate-based polyanionic materials.
Table 1-2. Characteristic properties of sodium and lithium.[245, 247, 248]
Category Sodium Lithium
Cation radius 1.02 Å 0.76 Å
Atomic weight 23 g mol-1 6.9 g mol-1
E (vs. SHE) -2.7 V -3.04 V
37
Melting point 97.7 °C 180.5 °C
Cost, carbonates $150 per ton $5000 per ton
Cost, current
collector anode Al $2000–2500 per ton Cu $7000–8500 per ton
Capacity, metal 1165 mA h g-1 3829 mA h g-1
A–O coordination
preference Octahedral and prismatic Octahedral and tetrahedral
1.2.1 Anode Materials for Sodium-ion Batteries
In contrast to a large number of reported cathode materials, progress in anode
material research for SIBs proceeds much slower. Anode materials that have been
reported can be categorized into carbon materials, intercalation-based materials,
conversion and alloy compounds. Figure 1-21 summarizes operating voltage over
specific capacities of various successful anode materials. This section will give a
brief overview over the development of anode materials for SIBs.
1.2.1.1 Anode Materials based on Conversion and Alloying Reactions
Compared to LIBs, few conversion metal oxides/sulfides have been reported as
anode materials for SIBs, including iron oxides, cobalt oxides, and copper oxides.
For instance, Hariharan et al. demonstrated the electrochemical reaction of Na+
with Fe3O4 to form Fe metal and Na2O achieving a specific capacity of around 400
mA h g-1 less than half of its theoretical capacity of 926 mA h g-1.[249] This can be
attributed to sluggish kinetics of the Na+ transfer due to the larger ion size and the
nature of the SEI layer formed in Na cells.[250-256]
38
Figure 1-21. Operation voltages vs. specific capacities of various anode materials for SIBs. Reproduced with permission.[257] Copyright 2016, Nature Publishing Group.
Jiang et al. further reported the reversible conversion reaction with Na+ of a series
of transition metal oxides including Fe2O3, Mn3O4, Co3O4, and NiO.[258]
Experimental results by Klein et al. obtained for different copper compounds
showed that the conversion of copper-based compounds, such as CuO and CuS,
with sodium proceeds over intermediate phases, as evidenced by XRD and
electrochemical measurements.[259] Therein, the sodiation of CuO was shown to
consist of three steps. In the first step, Cu2O and Na2O were predominantly formed
followed by the formation of an intermediate NaCuO phase in step two. The final
sodiation products were found to be Na6Cu2O6, Na2O, and Cu.[260]
39
Metal sulfides have attracted attention as potential anode materials for SIBs
because of their unique layered structure which is favourable for ion
intercalation/de-intercalation during the initial discharge process. The subsequent
conversion reaction can then generate high theoretical capacities. Molybdenum
disulfide (MoS2), for instance, consists of a lamellar structure. Within this structure,
Na+ intercalation leads to a series of two-phase structural transitions from 2H-MoS2
to 1T-MoS2.[261] Depending on the depth of intercalation, the structure of MoS2 can
be partially recovered (to 1T-MoS2) during the subsequent charge process if less
than 1.5 Na+ per formula of MoS2 were intercalated. Nevertheless, its structure
cannot be restored once it was fully converted to NaxS and metallic Mo.
Incorporating MoS2 into a carbon matrices showed promise in enhancing its
electrochemical properties;[262-268] however, large irreversible capacities in the first
cycle and a lack of understanding of possible interactions between MoS2 and
carbon still hinder a wider implementation of MoS2 as anode material for SIBs. As
another member of the metal sulphide family, SnS2 has been identified as one of
the highest capacity anode materials for SIBs because it undergoes a combination
of both conversion and alloying reaction during cycling.[269] Meng and co-workers
investigated the sodiation/desodiation process of SnS2/reduced graphene oxide
composites and discovered that Na2S2 was formed instead of Na2S at the fully
discharged state.[270] The as-formed Na2S2 functions as a matrix to relieve the
strain caused by the volume expansion of the Na-Sn alloy reaction. Upon
completion of a full cycle its crystal structure could not be retained and amorphous
SnS2 is formed. Furthermore, efforts have been devoted to develop freestanding
SnS2-based electrode materials with the aim to improve electrochemical
performances and durability this material.[271, 272]
Alloy anodes, mainly Group IVa and Va elements, accommodate Na+ by forming
alloys with sodium at low potentials, which generates high theoretical specific
capacities as summarized in Table 1-3. Among all reported alloying anode
40
materials, tin is inexpensive (around 20 USD kg-1), relatively safe to handle in its
powder form (moderately pyrophoric), nontoxic, highly abundant, and exhibits high
storage capacities both by weight and by volume. In addition, Sn is able to form a
variety of compounds, such as SnO, SnO2, SnS, SnS2, and Sn4P3, which offer
opportunities to manipulate and improve electrochemical performances. As
mentioned earlier, these Sn-based compounds provide high specific capacities as
a consequence of their ability to undergo both conversion and alloying
reactions.[273]
Table 1-3. Summary of properties of typical metal, metalloid, and non-metal materials for SIBs.[273]
Alloying material
Reduction product
Theoretical capacity
Volumetric expansion (NaxX/X)
Average voltage (vs.
Na/Na+)
Sn Na3.75Sn 847 mA h g-1 520% 0.2 V
Sb Na3Sb 660 mA h g-1 393% 0.6 V
P Na3P 2596 mA h g-1 408% (red) 0.4 V
500% (black)
Si NaSi 954 mA h g-1 243% 0.5 V
Ge NaGe 369 mA h g-1 305% 0.3 V
The main issue with Sn-based anode materials is their large volume change (up to
300%) during cycling, which leads to electrode pulverization and consequently
poor cycle stability. The incorporation of carbon materials has shown potential to
improve the cycling stability as they not only provide electronic conductive
networks but also prevent agglomeration of Sn nanoparticles.[274, 275] For instance,
the integration of Sn-based anode materials into 2D graphene/reduced graphene
oxide is among the most popular strategies due to the simplicity of the preparation
process and effectiveness to improve the cycling performance of Sn-based anodes.
41
For example, Wang et al. reported ultrafine SnO2 nanoparticles (around 5 nm) on a
reduced graphene oxide framework using a simply hydrothermal method, which
delivered a reversibly capacity of 330 mA h g−1 and an outstanding capacity
retention of 81.3% over 150 cycles.[276] Furthermore, highly effective wet-
mechanochemical processes[251] and ice-templated preparation methods[277] have
been proposed to prepare high performance Sn- and carbon-based anode
materials for SIBs.
1.2.1.2 Anode Materials based on Intercalation
In contrast to the difficulties associated with graphitic carbons,[278-282] the Na+
storage in non-graphitic carbon materials (i.e. hard carbon, soft carbon, and
amorphous carbon) is thermodynamically feasible. The extent of Na intercalation
depends critically on the microstructure and the particle size of the carbon used.[283]
Among them, hard carbon has been widely studied as a promising anode. The
storage mechanism of Na+ in hard carbons can be described using a so-called
“card-house” model: i) Na+ intercalation between graphene sheets (corresponding
to the sloping-voltage region) and (ii) Na+ filling in the pores between nano-
graphitic domains (corresponding to the plateau region).[284] Therein, the number of
defect sites in hard carbon strongly affect the Na storage capacity in the slope-
voltage region;[285] however, there is no consensus on the Na storage mechanism
in the low-voltage plateau region with the debate focusing on whether Na metal
nanoclusters are formed in this region.[286-288]
Ti-based oxides have been widely investigated as anode materials for Na
intercalation because of their low cost and environmental benignity. Pioneering
work by Xiong et al. reported amorphous TiO2 nanotubes as anodes in the voltage
range between 0.9 and 2.5 V.[289] This work ignited further investigations of Ti-
based oxides with different polymorphs and nanostructures as intercalation
materials for SIBs utilizing the Ti3+/Ti4+ redox couple.[290] Na insertion into TiO2
42
proceeds as follows: i) pseudo-capacitive reactions during the initial discharge
process, ii) structural rearrangement, iii) a disproportionation reaction and
formation of Ti0 and O2 during further discharge, and iv) reversible Na de/insertion
in Nax(TiO2) (0.28 ≤ x ≤ 0.69).[291] Furthermore, Li4Ti5O12 has also been found to
accommodate Na+, delivering a reversible capacity of about 150 mA h g-1.[292]
Since the Na+ diffusion coefficient of Li4Ti5O12 is 5 orders of magnitude smaller
than its Li+ diffusion coefficient, research efforts have been focused on the
development of nanosized Li4Ti5O12 to improve its electrochemical performance in
SIBs.[293] Sodium titanium oxides, such as Na2Ti3O7,[294] Na2Ti2O5,[295] layered
NaTiO2,[296] Na2Ti6O13,[297] and Na2Ti7O15,[298] have also been investigated as
anode materials for SIBs.
Two-dimensional (2D) metal carbides, carbonitrides, and nitrides, denoted as
MXenes, were first reported by Naguib et al. in 2011.[299] MXenes feature a 2D
structure similar to that of graphene and are of the general formula Mn+1XnTx (M =
transition metal, X = carbon or nitrogen, T = surface terminations such as OH, O,
and F) with n values varying from 1 to 3. MXenes are prepared from their
corresponding MAX phases (A is mainly a group IIIa or IVa element), which are
layered hexagonal with A slaps sandwiched between M and X layers. The known
MAX phases are listed in Table 1-4. In MAX phases, the M–A bonds are weaker
than the M–X bonds, which allows the selective etching of the A layers. MXenes
successfully prepared from the corresponding MAX phases include Ti2C, Nb2C,
V2C, Mo2C, Ti3C2, Ti3CN, Mo2TiC2, Mo2Ti2C3, and Ti4N3.[300-303] When applied as
anode material for SIBs, multilayered Ti2CTx MXene delivered a reversible capacity
of 175 mA h g-1 at a current density of 20 mA g-1 and showed good rate capabilities
even at a current density of 5000 mA g-1. Furthermore, multilayered Ti3C2Tx has
also been investigated as potential negative electrode for SIBs and exhibited a
capacity around 100 mA h g-1.[304, 305] It was also found that the Na+ insertion
potentials of MXenes can be tuned by changing the transition metal and surface
43
functional groups[306, 307] and V2CTx was successfully used as positive electrode in
SIBs.[308] Paired with hard carbon, the resulting full cell delivered a maximum cell
voltage of 3.5 V and a cell capacity of 50 mA h g-1.
Table 1-4. A selection of reported MAX phases.[309]
Phosphate-based polyanionic compounds with a working potential low enough to
be applicable as anode in SIBs are rare and to the best of my knowledge only two
types have been reported so far. These are NASICON-type NaTi2(PO4)3 and
Na3V2(PO4)3. The anodic performance of NaTi2(PO4)3 has firstly been reported by
Delmas et al. in 1987.[310] TiO6 octahedra are connected by PO4 tetrahedra, which
create the NASICON framework with two sodium ions providing a high theoretical
capacity of 133 mA h g−1 through a two-phase reaction between NaTi2(PO4)3 and
Na3Ti2(PO4)3. The working potential of this material is around 2.1 V vs. Na/Na+
utilizing the Ti4+/Ti3+ redox couple, which is high enough to avoid the formation of a
charge consuming solid electrolyte interphase.[311] A second redox couple Ti3+/Ti2+
44
at around 0.4 V s Na/Na+ has also been identified allowing for a high reversible
capacity of 208 mA h g-1 when both redox couples are utilized.[312] Although a large
number of publications investigate the performance of NaTi2(PO4)3 in aqueous SIB
systems due to its high operating potential,[311] its performance in organic SIBs has
also been studied in recent years. The main focus in these studies, however, is to
improve the inherent low electronic conductivity induced by the phosphate group.
Strategies to accomplish this include carbon coatings,[313-315] transition metal oxide
coatings,[316] and nanostructuring.[317] Na3V2(PO4)3 can be applied as anode for
SIBs by utilizing the sodiation voltage plateau at 1.6 V vs. Na/Na+, which
corresponds to the insertion of one Na+ to form Na4V2(PO4)3.[318, 319] However, this
reaction results in a capacity half of that of its cathode reaction at a potential of
around 3.4 V vs Na/Na+. As discussed in section 1.1.2.2, rhombohedral
Li3V2(PO4)3 can accommodate two additional Li+ when applied as anode material
for LIBs with a capacity of around 120 mA h g-1. Furthermore, Na3V2(PO4)3 and
Li3V2(PO4)3 share the same skeleton structure of V2(PO4)3 consisting of corner-
shared VO6 octahedra and PO4 tetrahedra differing in the occupancies of Na+ and
Li+. For Na3V2(PO4)3, two Na+ occupy the 18e sites and one Na+ occupies the 6b
site, while all three Li+ occupy the 18f sites of Li3V2(PO4)3. During lithiation,
Li3V2(PO4)3 accommodates two Li+ in the 3a (0.5 Li), 3b (0.5 Li), and 6c (1 Li) sites,
respectively.[98] Na3V2(PO4)3, on the other hand, accommodates one Na+ in the last
empty 18e site, which results in a voltage plateau at 1.6 V vs. Na/Na+ while the 6a
site was found to accommodate one additional Na+ at a potential of around 0.3 V
vs. Na/Na+.[320] Figure 1-22 shows the calculated sodiation voltage profile (red
dotted line) of Na3V2(PO4)3 compared to an experimentally determined voltage
profile (blue solid line). This results in theoretical capacity of 117 mA h g-1 for the
anodic performance of Na3V2(PO4)3 which is identical to its cathodic capacity and
makes this material of high interest for the construction of symmetric SIB cells.[321,
322]
45
Figure 1-22. Calculated sodiation voltage profile (red dotted line) of Na3V2(PO4)3 in comparison to the experimentally determined voltage profile (blue solid line). Reproduced with permission.[320] Copyright 2015, Royal Society of Chemistry.
1.2.2 Cathode Materials for Sodium-ion Batteries
A large number of potential cathode materials for SIBs has been identified as
summarized in Figure 1-23. These cathode materials can be categorized into three
main categories: layered transition-metal oxides, Prussian blue, and polyanionic
(phosphates, fluorophosphates, pyrophosphates, fluorosulfates, and sulfates)
cathodes. This section will briefly introduce a selection of conventionally used
cathode materials for SIBs and will then give a more detailed overview over
cathode materials based on polyanionic frameworks at the end of this chapter.
1.2.2.1 Commonly used Cathode Materials for Sodium-ion Batteries
Layered sodium transition-metal oxides
The most common layered structures are composed of a sheet of edge-sharing
MeO6 octahedra (Me = 3d transition metals), which are stacked along the c-axis
direction hosting Na+ in between the MeO2 motifs.
46
Figure 1-23. Operation voltages versus specific capacities of various cathode materials for SIBs. Reproduced with permission.[257] Copyright 2016, Nature Publishing Group.
As shown in Figure 1-24, there are two types of sodium-based layered materials,
O3-type and P2-type, where O and P represent octahedral and trigonal prismatic
coordination of Na+ and 3 or 2 stands for the number of distinguishable sodium
layers. The sodium extraction from O3- and P2-type phases induces phase
transitions. This occurs, for instance, when Na+ are extracted from the O3- phase,
which causes vacancies to form. As a result, Na+ become energetically stable at
prismatic sites, which are formed by gliding of MeO2 slabs.[323, 324] Consequently,
oxygen packing changes from “AB CA BC” to “AB BC CA”, becoming the P3-type
phase as shown in Figure 1-24.[275]
47
Figure 1-24. Classification of Na-Me-O layered materials with sheets of edge-sharing MeO6 octahedra and phase transition processes induced by sodium extraction. Reproduced with permission.[275] Copyright 2014, American Chemical Society.
When Na+ are extracted from the P2- phase, the layered oxides transform to a O2-
type phases. One of the first layered transition metal oxides investigated for SIBs
was α-NaMnO2 with an O3-type structure. This material exhibits a voltage profile of
pronounced stepwise processes, suggesting structural transitions, and delivers a
capacity of 200 mA h g-1.[325]
P2-Na2/3Mn1/2Fe1/2O2 is among the most promising transition metal oxide cathode
materials for SIBs in terms of both sustainability and electrochemical
performance.[326] It delivers a reversible capacity of 190 mA h g-1 utilizing the
Fe3+/Fe4+ redox couple. However, its long-term cycling stability is not satisfactory
and cation doping has been shown to improve capacity retention in materials such
48
as P2-Na0.8[Li0.12Ni0.22Mn0.66]O2,[327] P2-Na0.67Mn1-yMgyO2 (y = 0, 0.05, 0.1, 0.2),[328]
and NaFe1-yNiyO2 (0.5< y <0.7).[329]
Prussian blue cathodes
The large atomic radius of the sodium ion requires cathode materials with open
host frameworks containing suitable transition metal ions to host Na+. Prussian
blue analogues (PBAs) provide a cubic structure consisting of Fe2+ and Fe3+ sitting
on alternate corners of corner-shared Fe octahedra bridged by cyano (C≡N)-
ligands (Figure 1-25).[330] Their open-framework contains channels (3.2 Å) and
interstitial sites (4.6 Å) that allow fast solid-state diffusion of Na+.[331] The most
intensively investigated PBA is hexacyanoferrate due to its low cost and simplistic
synthesis. The pioneering work conducted by Goodenough and co-workers
showed that the insertion of Na+ into KFe2(CN)6 resulted in a reversible capacity
around 100 mA h g-1 with no significant capacity fading after 30 cycles.[330] The
KFe2(CN)6 cathode utilizes the high-spin Fe3+/Fe2+ redox couple bonding to N at
around 2.97/2.92 V vs. Na/Na+ and the low-spin Fe3+/Fe2+ couple bonding to C at
around 3.69/3.58 V vs. Na/Na+.
Figure 1-25. Framework of Prussian blue analogues. Reproduced with permission.[330] Copyright 2012, Royal Society of Chemistry.
49
However, low coulombic efficiency in the initial cycle has been observed for
KFe2(CN)6, which could be the result of residual crystal water within this PBA
compound.[330]
1.2.2.2 Phosphate-based and other Polyanionic Cathode Materials for Sodium-ion
Batteries
In addition to layered oxide and Prussian blue materials, a large number of
polyanionic sodium compounds, such as phosphates, fluorophosphates,
fluorosulfates, and sulfates, have been investigated as cathode materials for SIBs.
Advantages of sodium polyanions for SIBs include:[331] i) Diverse open-framework
structures; ii) Presence of low-energy Na+ migration pathways; iii) possibilities of
tuning the operating voltage by modifying the local environments; iv) structural
energetics for a flat voltage response; and v) thermal and oxidative stability at high
potentials due to robust covalent frameworks.
Olivine and Maricite Structures
As LiFePO4 has been commercialized as a cathode material for LIBs, its sodium
analogue, olivine NaFePO4, has also attracted interest due to its high theoretical
specific capacity (154 mA h g–1) and relatively high working potential (around 2.8 V
vs. Na/Na+).[332] However, direct high-temperature synthesis cannot produce
olivine-phase NaFePO4 and a thermodynamically favoured maricite phase is
formed instead. The maricite phase is believed to provide poor electrochemical
activity because of its one-dimensional, edge-sharing FeO6 octahedrons that form
slow Na+ pathways.[333-335] The first report on the Na+ insertion capabilities of
olivine FePO4 was reported by Le Poul et al. and showed that 0.65 Na can be
inserted to form Na0.65FePO4.[335] This discovery ignited tremendous efforts to
synthesize and characterize olivine NaFePO4 materials for SIBs. Oh et al. then
studied the electrochemical performance of NaFePO4 obtained by an
50
electrochemical exchange from olivine LiFePO4, and reported a stable capacity of
125 mA h g–1.[336] Structural and electrochemical features of olivine NaFePO4
compared to olivine LiFePO4 have also been investigated. Zhu et al. attributed the
more sluggish Na storage behaviour of NaFePO4 to the lower Na+ diffusion
coefficient and higher charge transfer resistance compared to LiFePO4.[337] It was
also found that NaFePO4 differs from LiFePO4 in their surface structures and
relative energies, which are important for rate performance.[338] However, density
functional studies of Li+ and Na+ diffusion in LiFePO4 and NaFePO4 showed that
electronic and Li or Na ionic migration in the bulk materials did not differ
significantly between LiFePO4 and NaFePO4.[339, 340] As mentioned above, maricite
NaFePO4 is believed to be electrochemically inactive. However, maricite NaFePO4
has been proven to exhibit excellent Na storage performance with the ability
extract all Na+ by transforming the maricite structure to amorphous FePO4.[341] The
maricite NaFePO4 electrode delivered a capacity of 142 mA h g–1 displaying
sloping charge/discharge curves and a stable cycle life of over 200 cycles.
NASICON Structures
More promising sodium phosphates for positive SIB electrodes are NASICON
compounds, which feature large tunnels for fast Na+ conduction. Among them,
Na3V2(PO4)3 has been extensively studied.[342, 343] Na3V2(PO4)3 provides a high
operating potential of around 3.37 V vs. Na/Na+ corresponding to the V4+/V3+ redox
couple, which results in a theoretical capacity of 118 mA h g-1. As for all
phosphate-based materials, tremendous efforts have been devoted to improving
the electrochemical performance of Na3V2(PO4)3, including metal ion doping,
carbon coating, and nanostructuring. For instance, Kim et al. incorporated
potassium ions with a larger ionic radius as functional pillar ions into Na3V2(PO4)3,
and thus, enlarging Na+ diffusion pathways and increase the lattice volume.[344]
Furthermore, Na3V2−xMgx(PO4)3/C composites containing various Mg2+ contents
51
were also investigated, which significantly improved ionic and electronic
conductivity, resulting in enhanced rate and cycle performances.[345, 346] Iron
substitution (both Fe2+ and Fe3+) was also found to effectively activate the
V4+/5+redox couple in addition to increasing the cell volume. The Fe3+ substitution
results in the distortion of the M1 octahedra, which allows the extraction of Na+
residing at M1 sites.[347, 348] Similar phenomena were also found when chromium,
manganese, and aluminium substitutions were investigated.[349-351] In addition to
these strategies, carbon decoration has been shown to be very effective to improve
the electrochemical performance Na3V2(PO4)3 with many different carbon matrices
and coating strategies employed to prepare high-performance Na3V2(PO4)3.[352-356]
Sodium fluorophosphates have been explored as new cathode materials due to
their high operating voltage that originates from the presence of highly
electronegative fluorine atoms in the covalent polyanionic framework. Some
representatives of this type of phosphate-based polyanionic material include
Na3V2(PO4)2F3,[357] Na2FePO4F,[358] and Na1.5VPO4.8F0.7.[359] Na3V2(PO4)2F3 was
shown to provide a high average working potential of 3.9 V vs. Na/Na+,
electrochemically reacting in a single-phase transition fashion with negligible
volume changes (2%).[357] Nazar and co-workers reported Na2FePO4F with a layer-
like 2D framework of Fe2O7F2 bioctahedra connected by PO4 tetrahedra, which can
host two Na+ in its interlayer space. The charge/discharge profiles of this material
show two two-phase plateaus centred at 2.90 V and 3.05 V vs. Na/Na+.[358]
Sodium florosulfates, such as NaFeSO4F, provide a tunnel structure with an ionic
conductivity of around 7.14 × 10⁻⁷ S3 cm-1 utilizing the Fe2+/Fe3+ redox couple at a
working potential of around 3.6 V vs. Na/Na+.[311] However, only 0.07 Na+ can be
electrochemically removed from its structure resulting in poor electrochemical
performance.[360] On the other hand, transition metal sulfates such as
Na2Fe(SO4)2·2H2O and Na2Fe2(SO4)3, are more electrochemically active. For
52
example, Barpanda et al. found that kröhnkite-type Na2Fe(SO4)2·2H2O operates at
around 3.25 V vs. Na/Na+ utilizing the Fe2+/Fe3+ redox couple with good structural
reversibility.[361] Interestingly, Na2Fe2(SO4)3 shows the highest ever reported
Fe3+/Fe2+ redox potential at 3.8 V vs. Na/Na+ along with fast kinetics achieving a
reversible capacity of around 102 mA h g-1.[362]
53
2 Chapter 2: Experimental Methods
2.1 Overview
Figure 2-1 shows the methodologies and experimental techniques used in this
research project, which include:
1) Design and preparation of electrode materials using solid state reaction assisted
by ball milling, freeze drying, and spray drying, and solution-based hydrothermal
reaction. All chemicals used throughout this research project are listed in Table 2-1.
2) Characterization of the as-prepared electrode materials using X-ray diffraction
(XRD), scanning electron microscopy (SEM), transmission electron microscopy
(TEM), thermogravimetric analysis (TGA), Raman spectroscopy, and Brunauer–
The solid-state reaction is defined as the direct reaction of a mixture of solids,
which generally requires temperatures 500 to 1500 °C as the starting solids would
not normally react at room temperature. Generally, this method utilizes the thermal
decompositions properties of the solid starting materials to create a new crystalline
material. The nucleation of desired products is considered difficult because of (a)
significant differences in structure between reactants and products and (b) the
large amount of structural reorganization that is involved in forming the products.
The growth of the product might also be hindered because of diffusion in existing
product layers to the new reaction interfaces. In this context, a key step to perform
a successful solid-state reaction is to mix precise amounts reactants sufficiently to
maximize area of contact between reacting solids. A typical procedure is outlined
as follows:
Reagents. The reactants must be dried thoroughly and weighed according to the
expected nature of the product and volatility of the starting materials under the
given reaction conditions. Fine grained materials should be used if possible in
56
order to maximize surface area and hence reaction rates. This is accomplished by
incorporating the spray drying method, which generates well-dried fine particles
and particle clusters.
Mixing. After acquisition of precise quantities of the solid starting materials, the
reactants are mixed. For manual mixing of small quantities, usually an agate
mortar and pestle are employed. For large quantities, wet ball milling is generally
used to adequately combine all starting materials before solid-state reaction.
Sufficient amounts of some volatile organic solvent, such as acetone or ethanol,
can be added to the mixture to aid homogenization.
Heat treatment. After mixing, the reactants are put in suitable containers chemically
inert to the reactants under the heating conditions and are then heated. The
heating program to be used depends strongly on the form and reactivity of the
reactants. According to the demands of the final products, a protection gas (argon,
nitrogen, argon/hydrogen, etc.) can be applied to avoid oxidization.
In this research project, the solid-state reaction route was employed to prepare
LiFePO4 and Na3V2(PO4)3 cathode materials. The thermal decomposition
behaviour of different sugars and microcrystalline cellulose was also utilized within
the solid-state reaction method to generate carbon coatings or free-standing
current collector substrates.
2.3 Materials Characterization
2.3.1 X-ray Diffraction (XRD)
The phase and crystallographic structure of all as-prepared materials presented in
this project were characterized by X-ray diffraction. Crystalline atoms cause the
diffraction of a beam of incident X-rays into many specific directions. Measuring the
angles and intensities of the diffracted beams, a three-dimensional picture of the
57
density of electrons within the crystal can be produced, which allows the
determination of the mean positions of the atoms in the crystal, as well as their
chemical bonds, their disorder, and various other information. This correlation is
described by Bragg's Law:
nλ=2d sin θ (2-1)
where d is the interplanar spacing, θ is the Bragg angle, n is the order of reflection,
and λ is the wavelength of the X-rays. By comparing the obtained XRD pattern to
the known standard diffraction datasets complied by the Joint Committee on
Powder Diffraction Standards (JCPDS), the crystal phase of unknown powder or
thin-film samples can be identified.
2.3.2 Scanning Electron Microscopy (SEM)
The scanning electron microscope (SEM) utilizes a focused beam of high-energy
electrons to reveal information about the sample including external morphology
and chemical composition. In this research project, a high-resolution field emission
SEM (Zeiss Supra 55VP) was used, operated with an acceleration voltage of 10-20
kV depending on conductivity and sensitivity of the sample. The Supra 55VP is
also equipped with Oxford energy dispersive spectroscopy (EDS), which enables
elemental analysis. EDS mapping was conducted on a Zeiss Evo LS15 SEM
equipped with a Bruker SDD XFlash 5030 detector which allows high speed
elemental analysis and mapping with images generated in micron resolution.
2.3.3 Transmission Electron Microscopy (TEM)
Transmission electron microscopy is a microscopy technique in which a beam of
electrons is transmitted through a specimen, creating an image from the interaction
of the electron with the examined sample as the beam penetrates the specimen.
Transmission electron microscopes are capable of imaging at extremely high
resolutions, enabling the instrument to capture fine details as small as a single
58
column of atoms. In this research project, TEM was applied to generate lattice-
resolved images of samples to determine their crystal orientation and interplanar
spacing as well as to obtain detailed information about crystallinity and thickness of
carbon coatings on the surface of different samples. Moreover, phase features of
crystalline samples (to support XRD investigations) can be obtained by selected
area electron diffraction (SAED). For single crystals, SAED patterns are a
characteristic arrangement of dots, while for polycrystalline or amorphous materials,
the pattern shows a series of rings.
2.3.4 Thermogravimetric Analysis (TGA)
Thermogravimetric analysis (TGA) is a popular method of thermal analysis in which
physical and chemical changes of materials can be monitored as a function of
increasing temperature. Depending on the desired information, TGA can be
conducted in air or under inert atmosphere. For instance, the thermal
decomposition (used to optimize solid-state reaction conditions) of solids or
carbonization temperature of biomass can be determined by TGA in N2
atmosphere. In carbon-containing composite materials, the nominal carbon content
can be estimated by conducting TGA experiments in air. The resolution of the
information gained by this technique can be adjusted by choosing the heating rate
of the experiment accordingly. However, using TGA to determine the carbon
content of a composite is only suitable for samples and reaction products with
melting points above the chosen temperature limits and special considerations
need to be taken into account when investing samples that are easily oxidized,
such as LiFePO4.
2.3.5 Raman Spectroscopy
Raman spectroscopy is a technique to observe vibrational, rotational, and other
low-frequency modes in a system commonly used in chemistry to provide a
structural fingerprint to identify molecules. Raman spectroscopy relies on inelastic
59
scattering of monochromatic light, usually from a laser in the visible, near infrared,
or near ultraviolet range. The laser light interacts with molecular vibrations, photons,
or other excitations in the system, which results in a shift in the energy of the laser
photons. This change can be detected and assigned to specific molecules or
chemical structures in organic molecules. In this research project, Raman
spectroscopy is used to detect defect information of carbon in carbon-containing
composites. In particular, Chapter 3 will discuss the use of Raman spectroscopy as
a tool to evaluate not only the order/disorder but also the quality of the carbon
coating in terms of electrochemical performance.
2.3.6 N2 Sorption/Desorption Measurement
To measure the surface area of porous or nanostructured materials, the Brunauer-
Emmett-Teller (BET) method can be applied. BET theory describes the physical
adsorption of gas molecules on a solid surface for the measurement of the specific
surface area. The amount of gas adsorbed depends on the exposed surface area,
the temperature, gas pressure, and interaction between the gas and solid. Nitrogen
is the most commonly used gas for this technique because of its availability in high
purity and its strong interaction with most solids. Because the interaction between
gaseous and solid phases is usually weak, the surface needs to be cooled using
liquid N2 to obtain detectable amounts of adsorption. Known amounts of nitrogen
gas are then released stepwise into the sample cell under relative pressures of
P/P0 = 0.05-0.25. After the saturation pressure is reached, no more adsorption
takes place regardless of any further increase in pressure, which can be precisely
monitored and recorded. After the adsorption layers are formed, the sample is
removed from the nitrogen atmosphere and heated to release and quantify the
adsorbed nitrogen in form of BET isotherms (plots of the amount of adsorbed gas
as a function of the relative pressure). N2 sorption/desorption measurements were
conducted in this research project on a Micromeritics 3Flex analyser at 77 K.
60
2.4 Electrode Preparation and Battery Assembly
2.4.1 Electrode Preparation
For water-sensitive powder electrode materials, electrodes were prepared by
mixing the as-prepared material (80 wt%), carbon black (10 wt%) and poly
(vinylidene fluoride) binder (PVdF, 10 wt%) in N-methyl-2-pyrrolidone (NMP) to
form a slurry. The resultant slurry was spread onto Al foil and dried in a vacuum
oven at 100 °C for 12 h, followed by pressing at 200 kg cm-2. For all powder
electrode materials insensitive to water, the PVdF binder was replaced by water-
soluble carboxymethyl cellulose sodium salt (CMC) binder to allow the use of DI
water instead the toxic solvent NMP. For the free-standing electrode materials, the
as-prepared products were used directly as electrode material without further
modification.
2.4.2 Cell Assembly
For LIBs, lithium foil is used as counter and reference electrode, and a Celgard
2400 as the separator. In SIBs, sodium metal pieces freshly cut for each cell where
used as counter and reference electrode, and Whatmann glass fibre filters are
applied separator. CR2032-type coin cells were assembled in an argon-filled glove
box (UniLab, Mbraun, Germany), in which both the moisture and oxygen contents
are controlled to less than 0.1 ppm. The electrolyte used for LIBs was 1 M LiPF6 in
a 1:1 (volume ratio) mixture of ethylene carbonate (EC) and diethyl carbonate
(DEC). Non-commercial electrolyte (1 M NaClO4 dissolved in a mixture of ethylene
carbonate (EC) and propylene carbonate (PC) in a volume ratio of 1:1, in which 5
vol.% fluoroethylene carbonate (FEC) was added as additive) is used for SIBs.
2.5 Electrochemical Measurements
In this research project, electrochemical properties of the as-prepared materials
were tested using cyclic voltammetry (CV), electrochemical impedance
61
spectroscopy (EIS), and galvanostatic charge-discharge profiles. The details of
these electrochemical measurements are discussed as follows.
2.5.1 Cyclic Voltammetry
Cyclic voltammetry (CV) is a type of potentiodynamic electrochemical
measurement conducted at a constant voltage ramping (scan rate, V s-1). For this
measurement, a potential between a reference electrode and a working electrode
is applied and the resulting current between a working electrode and a counter
electrode is recorded. Reduction or oxidation reactions on the working electrode at
a certain potential are manifested in sharp increases in current visible as current
peaks in the recorded profile. As a result, CV provides information about the redox
potential and electrochemical reaction kinetics of electrode materials, which can be
analysed to identify the reaction mechanism and to calculate metal-ion diffusion
coefficients.
2.5.2 Electrochemical Impedance Spectroscopy
Electrochemical impedance spectroscopy (EIS) is a widely used method to gain
deeper insights into electrochemical systems.[363] Impedance spectra of
lithium/sodium-ion electrochemical cells show a characteristic type and shape of
curve in a Nyquist plot, as illustrated in Figure 2-2. The sub-sections and the
associated kinetic processes are explained in more detail as follows:
62
Figure 2-2. Schematic Nyquist plot of the impedance spectrum obtained for lithium/sodium-ion electrochemical cells. Reproduced with permission.[363] Copyright 2011, Elsevier.
Section 1. At very high frequencies, the spectrum shows inductive behaviour
caused by inductive reactance of metallic elements in the cell and wires.
Section 2. Ohmic resistance RΩ of the cell at the intersection with the real axis Z’,
which can be assumed as the sum of the resistances of current collectors, active
material, electrolyte, and separator.
Section 3. First semi-circle, which is associated with the solid electrolyte interface
(SEI) that is formed during the initial charge/discharge cycles on the surface of the
anode.
Section 4. Second semi-circle, which represents the double layer capacity and
charge transfer resistance at the electrodes.
Section 5. Diffusion processes in the electrode active material at very low
frequencies.
63
In this research project, Nyquist plots of different electrodes were collected to
investigate the kinetics of different electrode materials to evaluate their
electrochemical performances.
2.5.3 Galvanostatic Charge-Discharge
Galvanostatic charge-discharge experiments are conducted at a constant
charge/discharge current within a fixed voltage range. The specific
charge/discharge capacities Q (mA h g-1) of the evaluated electrode materials can
then be calculated using the following equation:
Q = I∙t (2-2)
where I is the applied current density (mA g-1) and t is the charge/discharge time.
Rate performance profiles can be obtained by stepwise altering the applied current
density in the galvanostatic charge-discharge measurements. Moreover, by
repeating galvanostatic charge-discharge tests at a constant current density, long-
term cycling performance or cycling stability of the evaluated electrode materials
can be obtained.
64
3 Chapter 3: Scalable preparation of LiFePO4/C nanocomposites with sp2-coordinated carbon coating as high performance cathode materials for lithium-ion batteries
3.1 Introduction
Since the first report in 1997, olivine-type materials have attracted extensive
research attention as one of the most promising cathode materials for lithium-ion
batteries.[7, 8] Even though excessive research work has been performed to
optimize the electrochemical performance, this type of cathode material still has
to overcome several drawbacks, specifically for high-power battery applications.
Primarily, its poor electronic conductivity, ion diffusivity, and stability issues have to
be improved by using cheap and environmentally friendly techniques not only to
satisfy performance requirements, but also to address economic and ecological
aspects.
Various approaches have been investigated to overcome these ionic and electronic
conductivity problems, such as size/morphology control,[364] coatings,[365-369]
doping,[370, 371] or even electrode engineering methods.[372] Carbon coating
techniques appear to be the most sufficient ecological solution to improve the
performance of LiFePO4, with the main purpose to increase the electronic
conductivity on the surface of LiFePO4 particles, simultaneously reducing the
particle size, and alleviating aggregation.[202, 203, 373, 374] In addition, carbon can
serve as reducing agent during the sintering process, which prevents the oxidation
of Fe2+ to Fe3+, and thus, simplifies the synthesis procedure.[375, 376] Chemical
synthesis routes are widely adopted to achieve homogeneous carbon coatings
around the surface of LiFePO4 particles. For instance, chemical vapour deposition
(CVD),[365] in situ polymerization restriction methods,[366] mechanochemical
activation/sintering,[368] and hydrothermal methods[369] have shown very promising
results. All these examples lead to the conclusion that carbon coating is an
65
effective approach to improve the electrochemical performance of LiFePO4.
However, more practical methods would be beneficial in a mass production scale.
Therefore, we hereby report a carbon-coated LiFePO4 cathode material prepared
through industrial ball milling and solid-state reaction by using Li2CO3, NH4H2PO4,
FeC2O4·2H2O, and soluble starch as a carbon source to generate highly graphitic
carbon coatings. A uniform morphology could be achieved, featuring a primary
particle size of less than 200 nm. Special attention has been paid to the correlation
between the applied amount of carbon and the sp2-coordinated carbon generation,
as low-temperature sintering usually yields more disordered carbons.[377] The
optimum carbon content is 10 wt% to achieve considerably high reversible
capacities and improved rate performance compared with previous reports.[378-381]
3.2 Experimental Section
Preparation of LiFePO4/C Cathode Materials: LiFePO4/C was prepared by mixing
stoichiometric amounts of FeC2O4·2H2O, NH4H2PO4, and Li2CO3 (Sigma–Aldrich)
through industrial-scale ball milling in ethanol (95 vol%) for 24 h. The untreated
precursor mixture was filtered and vacuum dried for at least 2 h in preparation for
the decomposition and degassing step. The dried untreated precursor mixture was
transferred into a ceramic crucible and thermally decomposed in a tubular furnace
at 350 °C for 10 h under argon protection. The pre-sintered precursor mixture was
then combined with different amounts (5–20 wt%) of soluble starch (Sigma-Aldrich)
as carbon source by industrial-scale ball milling in ethanol (95 vol%) for 24 h. The
obtained pre-sintered precursor and starch mixture was filtered and vacuum dried
for at least 2 h and sintered in a tubular furnace at 700 °C for 10 h under H2/Ar
atmosphere.
Characterization of LiFePO4/C cathode materials: Crystallographic measurements
were conducted with a Siemens D5000 X-ray diffractometer using CuKα radiation
66
between 10° and 80°. The morphology analyses of the as-prepared samples were
carried out by field-emission scanning electron microscopy (FE-SEM, Zeiss Supra
55VP) and energy dispersive X-ray spectroscopy (SEM, Zeiss Evo LS15 with
extended pressure and Bruker SDD EDS Quantax 400 system). The structure of
the carbon network was revealed by high-resolution transmission electron
Zhangjiagang Guotai-Huarong New Chemical Materials Co., Ltd.). All electrodes
were stored and all standard CR2032 type coin cells were assembled in an argon-
filled glovebox (UniLab, Mbraun).
Electrochemical characterization: Galvanostatic charge-discharge and cycling
performance tests were performed in the voltage range of 2.00 – 4.25 V at various
current densities (based on the mass of LiFePO4 and 1C = 170 mA h g-1) on a
Neware battery tester at room temperature. The cyclic voltammograms were
obtained at different scan rates of 0.1–2.0 mV s-1 between 2.0–4.5 V, and EIS
67
measurements were conducted at open circuit voltage over a frequency range from
100 kHz to 0.01 Hz by using a CHI 660C electrochemistry workstation.
3.3 Results and Discussion
3.3.1 Characterization
The particle size and morphology were investigated by using field-emission
scanning electron microscopy (FESEM). Figure 3-1 shows the FESEM images of
LiFePO4/C prepared with 5-20 wt% soluble starch as the carbon source. It displays
uniformly dispersed grape-like particles of 50–200 nm in size and highlights the
influence of the added amount of carbon precursor on the morphology and
agglomeration. For instance, the samples prepared with 5, 8, and 10 wt% (Figure
3-1a–c, respectively) share a similar morphology and low agglomeration features.
The samples prepared with 15, 18.5, and 20 wt% soluble starch (Figure 3-1d–f,
respectively) tend to show reduced uniformity and much higher agglomeration
rates, as marked with white arrows. This can be confirmed by energy dispersive X-
ray spectroscopy (EDS). Figure 3-2a shows the uniform distribution of the elements
iron (Fe), phosphorous (P), oxygen (O), and carbon (C) throughout the mapped
sample area of LiFePO4/C prepared with 10 wt% starch.
68
Figure 3-1. SEM images of LiFePO4/C prepared with (a) 5 wt%; (b) 8 wt%; (c) 10 wt%; (d) 15 wt%; (e) 18.5 wt%; (f) 20 wt% soluble starch. Marked with white arrows are some obvious agglomerations.
In contrast, LiFePO4/C prepared with 20 wt% starch (Figure 3-2b) displays very
bright spots of Fe and C scattered throughout the mapped area, indicating denser
areas of agglomeration in this sample.
69
Figure 3-2. SEM energy dispersive X-ray spectroscopy (EDS) elemental mapping of LiFePO4/C prepared with a) 10 wt% and b) 20 wt% soluble starch, showing the distribution of the elements iron (Fe), phosphorous (P), oxygen (O), and carbon (C).
70
According to this observation, it can be assumed that the addition of
approximately 10 wt% soluble starch marks the optimized content regarding
particle morphology and particle size, with the remark that, owing to the
uncertainty of the impact of potential impurities on performance and conductivity,
all six samples remain subject to further investigations, regardless of the
suboptimal particle morphology.
Figure 3-3 shows the X-ray diffraction (XRD) patterns of the six LiFePO4/C
composites, which are consistent with the LiFePO4 pattern of JCPDS card number
83-2092. This result indicates that the presence of soluble starch as the carbon
source has no negative effect on the final crystal formation of LiFePO4. However,
the amount of starch has an effect on the formation of phase impurities. The
patterns clearly indicate that, depending on the amount of added carbon
precursor, conductivity enhancing impurities (*Fe2P) can be detected, specifically
for the samples prepared with 15, 18.5, and 20 wt% starch. On the other hand,
for samples prepared with 10, 8, and 5 wt% starch, Fe2P impurities become less
obvious. As Fe2P cannot contribute to the overall electrochemical capacity, it is an
undesired synthesis product for high-energy applications. Yet, as aforementioned,
its conductivity-enhancing properties, combined with a high-quality carbon coating,
could be beneficial for the rate capability of the synthesized composites, and thus,
might provide interesting features for potential high-power applications.
71
Figure 3-3. XRD patterns of LiFePO4/C prepared with 5-20 wt% soluble starch compared with calculated patterns of Fe2P and LiFePO4 (JPDS card number 83-2092).
To investigate the structure and distribution of the carbon layer and to visualize
the interconnection of the LiFePO4 particles, a transmission electron microscopy
(TEM) analysis was conducted. Figure 3-4a shows the TEM image of the LiFePO4/C
composite nanoparticles, and no loose carbon sheets can be seen, referring to
Figure 3-4b and Figure 3-4d, which indicates that the carbon presence detected
using Raman spectroscopy (Figure 3-5) can only be attributed to an existing
carbon coating around the LiFePO4 particles. Figure 3-4d displays the uniform,
well-defined, and highly ordered carbon layer of around 3 nm thickness covering a
LiFePO4 crystallite, which is successfully generated through the thermal
decomposition of the soluble starch precursor. The selected area electron
diffraction (SAED) pattern in Figure 3-4c reveals distinct diffraction spots, which
can be indexed to the LiFePO4 triphylite crystal structure, confirming the previous
XRD analysis.
72
Figure 3-4. (a) and (b) TEM images; (c) the corresponding selected area electron diffraction pattern (SAED); and (d) lattice resolved HRTEM image of LiFePO4/C prepared with 5 wt% soluble starch (Inset: Interplanar distance of the (121) crystal plane).
The lattice-resolved high-resolution TEM (HRTEM) image presented in Figure 3-4d
shows the LiFePO4 nanocrystal wrapped in a thin layer of carbon, in which the
(121) crystal plane is indexed with an interplane spacing of 0.301 nm. This
result demonstrates that soluble starch applied as carbon precursor during the
solid-state reaction can successfully generate a very thin and uniform,
conductivity enhancing carbon coating on the surface of LiFePO4 particles.
Moreover, Figure 3-5 shows the Raman spectra of LiFePO4/C prepared with 5, 8,
10, 15, 18.5, and 20 wt% starch, which were employed to further evaluate the
quality of the generated carbon coating in terms of graphitization and orbital
hybridization. Basically, the intense peaks located at ~1335 cm-1 and ~1605 cm-1
73
are corresponding to the D (disordered) and G (graphite) band of the carbonized
soluble starch covering the LiFePO4 particles, respectively. The shape and relative
intensity of D/G changes with the varying amount of added carbon. However, since
band fitting with two D and G lines cannot produce accurate plots of the measured
curves, a four-bands Gaussian-Lorentz fit was applied to resolve the observed
Raman features.[382] As shown in Figure 3-5a–f (coloured lines), the two fitted
bands located at ~1335 cm-1 and ~1605 cm-1 correspond to the D band and G
band of sp2-type carbon, respectively. The other two bands at ~1150 cm-1 and
~1520 cm-1 can be assigned to sp3-type (diamond-like) carbon. As a consequence,
the integrated area ratio of the sp3 and sp2 bands (Asp3/Asp2) is related to the
relative content of graphite carbon in a composite, which has been associated with
enhanced conductivity and electrochemical performance of LiFePO4/C
composites.[377, 382, 383] Furthermore, the intensity ratio of D/G (ID/IG) can be used as
estimation of the graphitization degree of this composite.[384, 385] Ultimately, to
visualize the relationship of Asp3/Asp2 and ID/IG as a function of the added carbon
content, the graph displayed in Figure 3-5g was plotted and demonstrates the
proposed correlation. According to the diagram, the ID/IG ratios are calculated as
1.03, 1.06, 1.05, 1.05, 1.05, and 0.99 for the samples prepared with 5, 8, 10, 15,
18.5, and 20 wt% soluble starch, respectively, while the corresponding Asp3/Asp2
ratios are calculated as 0.598, 0.605, 0.278, 0.332, 0.328, and 0.484. Both ratios
indicate the high graphitization of the carbon layer, and thus, improved electronic
conductivity. In particular, the sample prepared with 10 wt% shows the lowest
Asp3/Asp2 and a low ID/IG ratio, which makes this sample the most promising for
improved electrochemical performance. It is important to note that all Raman
spectra feature a strong D band, which illustrates a slightly more amorphous
character of the carbon coating due to the low temperature carbonization
necessary for the preparation of LiFePO4.[377]
74
Figure 3-5. Raman spectra of LiFePO4/C prepared with (a) 5 wt%, (b) 8 wt%, (c) 10 wt%, (d) 15 wt%, (e) 18.5 wt%, and (f) 20 wt% soluble starch as carbon source. The two broad bands are resolved into four coloured lines; (g) shows the Asp3/Asp2 and ID/IG values as a function of the amount of added carbon precursor.
75
However, this conclusion is consistent with the HRTEM observations in Figure 3-4d.
The nominal carbon contents of the as-prepared LiFePO4/C composites are
roughly estimated as 2.63, 3.27, 4.58, 5.86, 6.82, and 9.34 wt% for the materials
prepared with 5, 8, 10, 15, 18.5, and 20 wt% starch as carbon source,
respectively. The basic procedure is carried out as follows. A representative
amount of composite sample is thoroughly dispersed in concentrated hydrochloric
acid for 24 h. Clean filter papers are vacuum-dried overnight and the blank filter
paper weight is recorded. The residual carbon of each sample is washed several
times with distilled water and ethanol, vacuum dried overnight on the before-
mentioned blank filter papers, and weighed to determine the nominal carbon
content. The Brunauer–Emmett–Teller (BET) surface area was calculated to be
around 10.6 m2 g-1. In summary, the structural, morphological, and carbon quality
outcomes are competitive compared with previously reported LiFePO4 composites
that required much more expensive and more complex preparation methods.[386-390]
3.3.2 Electrochemical Performance
The charge/discharge profiles of LiFePO4/C prepared with 5–20 wt% soluble starch
as the carbon source can be seen in Figure 3-6. It is demonstrated in Figure 3-6a
that, due to the increasing carbon content, the initial reversible capacity of
LiFePO4/C prepared with 5, 8, and 10 wt% added carbon source is 153 mA h g-1,
whereas the sample prepared with 15 wt% added carbon source reaches 147 mA
h g-1 and the samples prepared with 18.5 and 20 wt% only provide 135 and 137
mA h g-1 at 0.2C, respectively. Based on these initial galvanostatic (dis)charge
profiles, the differential capacity analysis given in Figure 3-6b allows the
determination of over-potential of each sample, which is a first indication for good
electric conductivity. All six samples achieved very low over-potential values from
74.1 to 91.4 mV as seen in the inset of Figure 3-6b.
76
Figure 3-6. (a) Charge-discharge curves; (b) differential capacity analysis of LiFePO4/C prepared with 5-20 wt% soluble starch as carbon source (insets: differential capacity analysis in the voltage range 3.35 to 3.51 V and a list of the corresponding over-potential values for all six samples).
A rate performance evaluation was conducted to compare the individual
conductivity enhancing features of each sample. The rate performance test
displayed in Figure 3-7a confirms the good capacity retention and appropriate
rate capabilities of the LiFePO4/C composites prepared with 10, 15, and 18.5 wt%
77
soluble starch as the carbon source. These samples provide the highest rate
capability of all six tested samples, wherein the sample prepared with 10 wt%
starch also achieves high reversible capacities at low current rates. This particular
sample delivers reversible capacities of 154, 149, 140, 131, 114, 100, and 85 mA h
g-1 when cycled at 0.2, 0.5, 1, 2, 5, 10, and 20C, respectively, combined with a
capacity retention of 55% from 0.2 to 20C. These are highly competitive results
compared with recent publications using similar methods, but which are not
scalable and include much more expensive and complicated preparation methods
for high performance LiFePO4/C composites.[204, 365, 387, 388, 391-396] Furthermore, as
an additional comparison approach, Figure 3-7b visualizes the energy and power
density of the LiFePO4/C composite prepared with 10 wt% starch at different
current rates. It can be seen that this sample can also deliver a high specific
energy of 555 Wh kg-1 at 0.2C and high specific power of 13.64 kW kg-1 at 20C
Besides, the cycling stability test displayed in Figure 3-7c revealed that 80% of the
initial capacity can be maintained even after 300 deep charge/discharge cycles at
a high rate of 10C, which further outlines the enhanced electrochemical
performance of this material. It is shown that the columbic efficiency remains
steady at about 99.4% over the entire test extent. Interestingly, according to
Figure 3-7a, the samples prepared with 15 and 18.5 wt% carbon precursor provide
similar high rate capabilities to the discussed 10 wt% composite, but cannot deliver
sufficient reversible capacities at lower current densities. On the other hand, owing
to the increased carbon content, and thus stronger carbon network, the cycling
stability at high rates is also increased, as seen in Figure 3-7c. The achieved
capacity retentions after 300 cycles are namely 92.5 and 95.5% for the composites
prepared with 15 and 18.5 wt% added carbon source, respectively, which
provides them with very interesting properties for high-power applications.
78
Figure 3-7. (a) Rate performance of LiFePO4/C prepared with 5-20 wt% soluble starch as the carbon source; (b) Specific energy and specific power of the sample prepared with 10 wt% soluble starch at different current rates; (c) Cycling performance of the sample prepared with 10, 15, and 18.5 wt% soluble starch (dis)charged at 10C for 300 cycles.
79
In contrast, the samples prepared with 5 and 8 wt% starch deliver high reversible
capacities at very low rates, which drastically deteriorate from 5 to 20C and only
achieve a rate capacity retention of 13 and 24% from 0.2 to 20C, respectively.
These drastic performance differences are visualized using charge/discharge
profiles of the tested composites at different current rates, as displayed in Figure 3-8.
It is evident that the (dis)charge plateaus of the LiFePO4/C composites prepared with
5 and 8 wt% starch start to slope with the increase in the current rate, whereas
the electrodes made with 10–20 wt% starch still generate a distinct (dis)charge
voltage plateau even at 20C. Thus, the galvanostatic profiles of all six composites
agree consistently with the previous evaluation of the carbon coating quality using
Raman spectroscopy, as displayed in Figure 3-5, and confirm the initial assumption.
The individual Raman spectra indicate that the optimal graphitization and sp2
carbon content, for both rate performance and high specific capacity, can be
achieved with 10 wt% added soluble starch to generate a conductivity enhancing
carbon coating on the LiFePO4 surface without compromising the specific capacity,
which has certainly been validated. Furthermore, the samples prepared with 15 and
18.5 wt% carbon provide similar high rate capabilities, possibly owing to good
Raman features combined with the presence of conductivity-enhancing Fe2P, which,
just like carbon, does not contribute to the overall capacity, as is evident at low
charge/discharge rates, where these composites cannot reach the same values
as the 10 wt% composite. Furthermore, it has been shown that a low ID/IG ratio or
disordered carbon content of an existing carbon coating is not related to good
electrochemical performance. The samples prepared with 5 and 20 wt% starch
showed the two lowest ID/IG ratios, but, at the same time, highly sp3-hybridized or
diamond-like carbon features, which consequently caused their poor rate
performance as sp3 coordinated carbon is considered to be of insulating nature.[377,
382, 383]
80
Figure 3-8. The charge-discharge voltage curves of LiFePO4/C prepared with (a) 5 wt%, (b) 8 wt%, (c) 10 wt%, (d) 15 wt%, (e) 18.5 wt%, and (f) 20 wt% soluble starch as carbon source in the voltage range from 2.0 to 4.25 V at different current rates.
81
Finally, to conclusively assess the electrochemical behaviour of LiFePO4/C, the
electrochemical kinetic performance, displayed in Figure 3-9, was analysed using
cyclic voltammetry (CV) and electrochemical impedance spectroscopy (EIS),
respectively. Figure 3-9a unveils the CV behaviour of the LiFePO4 electrode
prepared with 10 wt% starch at various scanning rates in the voltage range of 2.0–
4.5 V. A single pair of well-defined redox peaks is observed for all scan rates,
which can be attributed to the Fe3+/Fe2+ redox couple.
Figure 3-9. (a) CV curves at different scan rates and (b) peak current Ip versus square root of scan rate ν1/2 at 25 °C of LiFePO4 prepared with 10 wt% soluble starch; (c) Impedance spectroscopy and (d) linear fitting of the Warburg impedance of fresh and cycled LiFePO4/C cells prepared with 10 wt% soluble starch as carbon source.
82
Furthermore, the height and area of the redox peaks increase with increasing
scan rates, and the anodic and cathodic peaks move to lower and higher potentials,
respectively. Even at a high scan rate of 2.0 mV s-1, the well-defined sharp redox
reaction peaks are maintained, indicating good kinetics for lithium intercalation and
deintercalation. According to these measured peak currents, a Li-ion diffusion
coefficient D (cm2 s-1) can be calculated using the Randles–Sevcik equation:[387, 390,
397]
Ip= 2.69∙105∙A∙C∙ D∙n3
2∙ ν (3-1)
wherein Ip is the peak current (in A), A is the surface area of the electrode, C is
the concentration of Li ions in a solid (0.0228 mol cm-3), n is the number of
electrons involved in the half-reaction for the redox couple (n = 1 for Fe3+/Fe2+
redox couple), and v is the potential scan rate (in V s-1). As shown in Figure 3-9b, Ip
is indeed proportional to n1/2, confirming a diffusion-controlled behaviour. Moreover,
from the slope of the lines, and based on Equation (3-1), the diffusion coefficient
Dcathodic (positive) is 6.49·10-11 cm2 s-1, whereas the diffusion coefficient Danodic
(negative) is 3.62·10-11 cm2 s-1 for the composite prepared with 10 wt% starch. The
high Li-ion diffusion coefficients achieved with this material are related to the thin
and highly sp2-coordinated carbon coating on the LiFePO4 particle surface, which
is reflected in its enhanced rate performance provided earlier in Figure 3-7 and
Figure 3-8. Finally, the Nyquist plot (Figure 3-9c) compares the electrochemical
impedance of the 10 wt% composite fresh and after the rate performance test for
57 cycles. It can be seen that the material generates a depressed semicircle in the
high-frequency region and a slope in the low-frequency region. Firstly, the high-
frequency intercept of the semicircle with the real axis (Z’) refers to the
uncompensated resistance (Ru), which combines the particle–particle contact
resistance, electrolyte resistance, and the electrode–current collector resistance.
Secondly, the semicircle diameter refers to the charge-transfer resistance (RCT),
83
which is related to the electrochemical reactions at the electrode–electrolyte
interface and the particle–particle contact. Lastly, the low-frequency slope
corresponds to lithium-ion diffusion in the bulk of the electrode material and can be
mathematically transformed to the Warburg coefficient (σw).[204, 389, 390, 393, 398]
Consequently, the solid-state diffusion of lithium ions DLi through the LiFePO4/C
particle collective can be estimated using Equation (3-2):
DLi=12
(3-2)
wherein R is the universal gas constant, T is the absolute temperature, F is the
Faraday constant, A is the surface area of the LiFePO4 cathode, C is the molar
concentration of lithium ions in the cathode, and is the Warburg coefficient. It
can be seen in the experimental data plot in Figure 3-9c that the RCT of the fresh
uncycled cell is 239 Ω, whereas the EIS analysis of the cycled half-cell reveals
slight changes in RCT. The value has decreased to 145 Ω, possibly owing to
electrode activation processes during cycling. Additionally, the solid-state diffusion
DLi calculated using Equation (3-2) from the Warburg impedance (shown in Figure
3-9d) reflects the kinetic properties of the 10 wt% composite, revealing a
competitive lithium-ion diffusion rate of 1.34·10-14 cm2 s-1 measured for fully
lithiated LiFePO4. In conclusion, it has been undoubtedly confirmed that the
remarkable rate performance is achieved because of the high solid-state diffusion
rates provided by the LiFePO4 particles combined with the low charge-transfer
resistance delivered by the highly sp2-coordinated carbon coating. The outstanding
rate performance and highly competitive reversible capacity at low
charge/discharge rates marks the composite prepared with 10 wt% soluble starch
as the optimal choice for high-performance and high-power LiFePO4/C composites.
84
3.4 Conclusions
Highly graphitic carbon-coated LiFePO4 cathode materials are successfully
prepared through industrial ball milling and solid-state reaction using soluble starch
as a carbon source and only environmentally friendly iron, lithium, and phosphate
precursors. This method can generate uniform, sp2-coordinated carbon-coated,
grape-like nanoparticles, which are favourable for Li+ transport and tap density. It
has been shown that, even though Fe2P phases in combination with a high-quality
carbon network are beneficial to improve high-rate performance and stability, the
capacity reduction at low rates induced by the high carbon content and the Fe2P
phase is disproportionate to justify adding more than 10 wt% carbon to the pre-
sintered precursor. Furthermore, adding less than 10 wt% soluble starch as the
carbon source results in high capacities at very low current rates, but fails to deliver
considerable capacities at high rates, owing to a lack of a highly sp2-coordinated
carbon network to support ion diffusion through the particle collective. Ultimately,
adding 10 wt% soluble starch as the carbon source combined with environmentally
friendly iron, lithium, and phosphate precursor materials is a suitable and efficient
approach to generate large amounts of high-performance and high-power
LiFePO4/C cathode materials. However, further experimental and theoretical
studies are required to identify the formation mechanism of sp2-coordinated carbon
that arises from the variation in carbon precursor amount rather than variations in
sintering temperature or time.
85
4 Chapter 4: Carbon coated LiFePO4 clusters prepared via spray-drying followed by carbothermal reduction
4.1 Introduction
The spray method is well-trusted in practical uses, such as the manufacturing of
dried food, fertilizers, oxide ceramics, and pharmaceuticals.[399] A large number of
applications of spray methods have been reported and more than 15,000
industrial-size spray dryers are currently in operation. This number would
approximately double if the use in pilot plants and laboratories was added to the
calculation.[400] Several spray methods have been reported with no limitations to a
particular type of process: spray-pyrolysis, spray-drying, flame-spraying, low-
pressure, and electro-spraying.[401]
In general, a starting solution is prepared usually by dissolving the metal
component of an intended product in a solvent. The droplets, which are atomized
from the starting solution, are introduced to the solvent evaporator. Evaporation of
the solvent, diffusion of solute, drying, and precipitation may occur inside the
furnace to form the final product. The reaction among reactants, and sometimes
with surrounding gas, is dependent on the type of the initial solution.[399, 402] The
spray-drying method is similar to other types of spray methods (spray-pyrolysis,
spray-freeze drying, etc.), except for the type of precursor (usually colloidal
particles or sols) and the fact that there is almost no reaction during the drying
process. The ability to produce uniformly spherical particles from nano to micron
sizes is one of the main advantages of this method. Other merit gained from this
method is that when the suspension consists of colloidal nanoparticles (primary
particles), the resulting particles are comprised of nanoparticles that form a
nanostructured powder. Therefore, the spray-drying method may be suitable for
consolidating nanoparticles into macroscopic compacts, and submicron spherical
powders that have nanometre scaled properties can be obtained.[399] This is
86
particularly important for industrial applications of carbon coated LiFePO4 materials.
Although nano-sized LiFePO4 materials with highly engineered shapes have been
reported previously, they rarely provide both excellent electrochemical
performance and high tap density, which is critical to achieve high volumetric
energy densities.[202, 203, 403] Therefore, LiFePO4 nano-micro structures with uniform
carbon coatings are very desirable for commercial high performance lithium-ion
battery applications.[404]
In this report, we systematically evaluated spray-drying conditions and equipment
settings in regards to electrochemical performance of the obtained carbon coated
LiFePO4 cathode material. This includes variations in spray-drying feed rate and
drying temperature while precursor materials, suspension concertation, and
amount of added carbon source remained unchanged for each parameter. After
optimal conditions were established, the impact of the carbon precursor choice on
micro-particle morphology was evaluated. For this investigation, three different
carbon precursor materials were applied, namely citric acid (CA), polyethylene
glycol (PEG), and polyvinyl alcohol (PVA), and their resulting particle morphology
and electrochemical performance was investigated.
4.2 Experimental Section
LiFePO4 named hereafter LFP-A10, LFP-A40, and LFP-A60 was prepared by
mixing stoichiometric amounts of FeC2O4∙2H2O, NH4H2PO4, and Li2CO3 (Sigma-
Aldrich) via industrial-scale ball milling in ethanol (95 vol%) for 24 h. The untreated
precursor mixture was filtered and vacuum dried for at least 2 h as preparation for
the decomposition and degassing step. The dried untreated precursor mixture was
transferred into a ceramic crucible and thermally decomposed in a tubular furnace
at 350 °C for 10 h under argon protection. The pre-sintered mixture was combined
in a suspension with 10 wt% sucrose to encapsulate the precursor materials during
spray-drying and to serve as carbon source in the subsequent carbothermal
87
reduction. The solid content of the suspension was fixed at 1 wt%. The precursor
mixture was spray-dried (Mini Spray Dryer B290, BÜCHI Labortechnik AG,
Switzerland) with an inlet temperature of 170 °C and a feed rate of 4 ml min-1 (LFP-
A10), 12 ml min-1 (LFP-A40), and 18 ml min-1 (LFP-A60), respectively. The dried
powder was then transferred into a ceramic crucible to be sintered at 700 °C for 10
h in H2/Ar atmosphere.
LiFePO4 named hereafter LFP-150-40-60-5, LFP-170-30-74-5, and LFP-200-40-
86-5 was prepared by mixing stoichiometric amounts of FeC2O4∙2H2O, NH4H2PO4,
and Li2CO3 (Sigma-Aldrich) via industrial-scale ball milling in deionized water for 6
h. Simultaneously, 5 wt% sucrose was added to the suspension to encapsulate the
precursor materials during spray-drying and to serve as carbon source in the
subsequent carbothermal reduction. The solid content of the suspension was fixed
at 20 wt%. The untreated precursor mixture was spray-dried (Mini Spray Dryer
B290, BÜCHI Labortechnik AG, Switzerland) with an inlet temperature of 150 °C
(LFP-150-40-60-5), 170 °C (LFP-170-30-74-5), and 200 °C (LFP-200-40-86-5) and
a feed rate of 15 ml min-1. The dried power was then transferred into a ceramic
crucible to thermally decompose in a tubular furnace at 350 °C for 5 h and sintered
at 700 °C for 10 h under argon protection.
LiFePO4 named hereafter LFP-C CA, LFP-C PEG, and LFP-C PVA was prepared
by mixing stoichiometric amounts of FeC2O4∙2H2O, NH4H2PO4, and Li2CO3 (Sigma-
Aldrich) via industrial-scale ball milling in ethanol (95 vol%) for 24 h. The untreated
precursor mixture was filtered and vacuum dried for at least 2 h as preparation for
the decomposition and degassing step. The dried untreated precursor mixture was
transferred into a ceramic crucible and thermally decomposed in a tubular furnace
at 350 °C for 10 h under argon protection. The pre-sintered mixture was combined
in a suspension with 10 wt% sucrose to serve as carbon source in the subsequent
carbothermal reduction and 0.5 g citric acid (LFP-C CA), PEG (LFP-C PEG) or
88
PVA (LFP-C PVA) to encapsulate the precursor materials during spray-drying. The
solid content of the suspension was fixed at 20 wt%. The precursor mixture was
spray-dried (Mini Spray Dryer B290, BÜCHI Labortechnik AG, Switzerland) with an
inlet temperature of 200 °C and a feed rate of 15 ml min-1. The dried powder was
then transferred into a ceramic crucible to be sintered at 700 °C for 10 h in H2/Ar
atmosphere.
Crystallographic measurements were conducted with a Siemens D5000 X-ray
diffractometer using CuKα radiation between 10° and 80°. The morphology
analyses of the as-prepared materials were carried out by field-emission scanning
electron microscopy (FE-SEM, Zeiss Supra 55VP). The carbon contents of the as-
prepared LFP-C CA, LFP-C PEG, and LFP-C PVA were investigated using a
TGA/DTA analyser (TA Instruments, SDT 2960 module, New Castle, DE, USA) at
a heating rate of 5 °C min-1 under air flow from room temperature to 700 °C.
The working electrodes for electrochemical testing were prepared by mixing 80 wt%
as-prepared LiFePO4 with 10 wt% carbon black and 10 wt% poly(vinyl difluoride)
(PVDF, Sigma-Aldrich) in N-Methyl-2-pyrrolidone (NMP, Sigma-Aldrich). The
obtained dispersion was carefully pasted onto aluminium foil, dried in a vacuum
oven at 80 °C for 12 h and pressed before cell assembly. Lithium metal discs were
used as counter and reference electrodes. The electrolyte used for each cell
consisted of 1M LiPF6 in dimethyl carbonate (DMC) / diethyl carbonate (DEC) /
ethyl carbonate (EC) (DMC:DEC:EC = 1:1:1, Zhangjiagang Guotai-Huarong New
Chemical Materials Co., Ltd.). All electrodes were stored and all standard CR2032
type coin cells were assembled in an argon-filled glovebox (UniLab, Mbraun).
Cycling performance tests were performed in the voltage range of 2.00 – 4.25 V at
various current densities (based on the mass of LiFePO4 and 1 C = 170 mA h g-1)
on a Neware battery tester at room temperature.
89
4.3 Results and Discussion
4.3.1 Parameter Optimization
Figure 4-1 shows the XRD patterns of the six LiFePO4 materials prepared for
parameter optimization. The obtained patterns are consistent with the LiFePO4
pattern of JCPDS card number 83-2092. The peak intensity of the LFP-150 – 200
samples (Figure 4-1b) is slightly higher than those of the LFP-A10 – A60 materials
(Figure 4-1a), possibly due to the reduced amount of carbon precursor. The
generated carbon coating is thinner and less X-rays are scattered by the
amorphous carbon structure on the particle surface. The nominal carbon content of
all six samples is 2 wt% or less as determined using thermogravimetric
measurements displayed in Figure 4-2, which is very desirable for industrial
applications. The carbon coating itself does not contribute to specific capacity on
the cathode side of a lithium-ion battery to the extent that high carbon contents in a
composite cathode material cause a significant reduction in volumetric capacity.
Hence, its main purpose is to ensure good interparticle contact and surface
conductivity. Therefore, a high performance LiFePO4/C composite material with
less than 5 wt% carbon is favourable for future large scale applications and mass
production.[198, 367]
90
Figure 4-1. XRD patterns of (a) LFP-A10 – LFP-A60 and (b) LFP-150 – LFP-200. Both compared with the calculated pattern of JCPDS card number 83-2092 and Fe2P.
Figure 4-2. TGA curves of LFP-A60 compared to the TGA result of a carbon free LiFePO4 sample.
The particle size and morphology was investigated using field emission scanning
electron microscopy (FESEM) imaging. Figure 4-3 shows the FESEM images of
as-prepared LiFePO4/C composite materials. Figure 4-3a-c shows the as-prepared
LFP-A10-A60 composites. All three images display randomly agglomerated particle
clusters with a particle size of approximately 200-500 nm, which is typical for
91
LiFePO4 products generated by a carbothermal reduction reaction. No significant
difference can be observed from the SEM images regarding the pump feed rate
setting during the spray-drying process. All three test settings result in similar
morphology, particle size, and degree of agglomeration. A comparable observation
can be made for the LFP-150 – LFP-200 samples, as displayed in Figure 4-3d-f.
Large and dense particle clusters are formed for these samples. The most
significant difference to the former LFP-A10 – LFP-A60 samples is an obvious
highly porous appearance, as seen in Figure 4-3d-f marked there with white arrows.
This porosity is possibly caused by the degassing process of the precursor material
NH4H2PO4, which releases NH3 and H2O upon heating.[405] The LFP-A10 – LFP-
A60 samples were prepared with an already degassed precursor intermediate, and
thus, do not show the same porosity. A porous structure is generally considered
beneficial for electrochemical performance as it improves the electrolyte-particle
interphase.[406, 407] Overall, the morphologies obtained using only sucrose as
carbon source are very similar to a preparation method using ball milling to
homogenize the precursor materials, as described earlier in Chapter 3.[201] The
main advantage of the spray-drying process shown here is its ability to generate
high yield in a very short time compared to the aforementioned ball milling
approach. Additionally, spray-drying provides the opportunity to create very uniform
spherical, hollow or porous structures,[399] which will be discussed in Section 4.3.2
Morphology Optimization.
92
Figure 4-3. SEM images of (a) LFP-A10, (b) LFP-A40, (c) LFP-A60, (d) LFP-150-40-60-5, (e) LFP-170-30-74-5, and (f) LFP-200-40-86-5. Some obvious open pores are marked with white arrows.
Microspherical particle clusters, which contain well interconnected nanoparticles,
have the advantage of higher tape density values without losing the ionic diffusion
benefits of pure nanoparticle materials. First, the electrochemical performance of
the LFP-A10 – LFP-A60 and LFP-150 – LFP-200 composite materials (Figure 4-4)
will be discussed. The rate performances of the LFP-A10 – LFP-A60 and LFP-150
– LFP-200 are displayed in Figure 4-4a,c, respectively. It can be seen that the
porous LFP-150 – LFP-200 samples show the typical electrode activation process
as sometimes observed in porous materials during the initial low rate cycles.[408, 409]
93
Figure 4-4. Rate performance results of (a) LFP-A10 – LFP-A60 and (c) LFP-150 – LFP-200 cycled at current densities from 0.2C to 20C in the voltage range of 2.0 – 4.25 V. Cycling stability test of (b) LFP-A10 – LFP-A60 and (d) LFP-150 – LFP-200 for 500 cycles at 10C in the voltage range of 2.0 – 4.25 V.
All three samples undergo a 4% capacity increase from the first to the seventh
cycle. The nonporous LFP-A10 – LFP-A60 samples do not show the same
behaviour. These samples remain steady at the initial discharge capacity for the
entire seven cycles at 0.2C. Judging from the overall rate performance of the LFP-
A10 – LFP-A60 samples displayed in Figure 4-4a and Table 4-1, it is obvious that a
feed rate somewhere between 40 – 60% (12 - 18 ml min-1) should be chosen as
the optimal feed rate for high performance LiFePO4/C. Even though a feed rate of
10% (4 ml min-1) shows good rate performance, the much longer spray-drying
94
procedure caused by a low feed rate does not justify choosing this setting. Thus, a
feed rate of 50% (15 ml min-1) was selected for the subsequent spray-drying trial to
prepare the LFP-150 – LFP-200 samples. Analysing the rate performance
achievable for those samples, it is obvious that the sample prepared with an inlet
temperature of 170 °C shows the best performance. Additionally, cycling the
samples at a high rate of 10C, the LFP-170 sample again provides the best long-
term cycling stability of all tested samples.
Table 4-1. Rate performance and cycling stability test results of LiFePO4 prepared for the feed rate optimization (top 3) and the samples prepared for the inlet temperature optimization (bottom 3). Marked in green are the best results of each starting material.
The reaction mechanism in solution 1 as described in equation (5-2) to (5-5) was
confirmed by the XRD analysis of the dried solution (Figure 5-2a). The traces of
LiCl, which are possibly caused by an undersupply of phosphoric acid (H3PO4), are
negligible due to the pure phase XRD pattern of the final product (Figure 5-2b). It
can be assumed that this minor Li excess does not result in the formation of
impurities, such as Li3PO4.[438, 439] On the contrary, a slight oversupply of lithium
during solid-state reaction is considered beneficial to compensate for the loss of
the lithium element caused by the evaporation of Li2O.[440]
107
Figure 5-2. (a) XRD pattern of solution 1 after drying compared with the simulated pattern of LiH2PO4 calculated from JCPDS card number 83-1340 (* marks traces for LiCl∙H2O). (b) XRD pattern of LiFePO4@CP and the calculated pattern of JCPDS card number 83-2092. (c) XRD pattern of purified paper towel matching the standard XRD pattern of microcrystalline cellulose.[435, 436]
According to the theoretical assumption of the reaction mechanism during freeze-
drying of solution 1, the mass of the FeCl3 solution (solution 2) required to ensure
an appropriate molar ratio Li:Fe:PO4=1:1:1 can be sufficiently calculated from the
mass load of PT. The impregnation of the iron precursor (Step 2 Figure 5-1)
includes the dissolved carbon precursor, which is applied as reducing agent and to
(a) (b)
(c)
108
generate a conductive carbon coating on the surface of the LiFePO4 layer, which
also serves as structural support. The next stage of the electrode preparation is the
two-stage heat treatment (Step 3 in Figure 5-1). The first heat treatment stage at
312 °C was chosen to allow FeCl3 to melt and consequently enable capillary forces
to homogenously distribute it through the PT fibre network, whilst allowing
degassing of the cellulose fibre. The decomposition of all precursor materials, the
crystal formation of LiFePO4, and the carbon network generation take
simultaneously place in the second and final heat treatment stage from 312 °C to
700 °C. The LiFePO4 shell itself consists of aggregates of LiFePO4 nano-crystals,
which are densely packed on the carbon fibre surface. The close contact between
the carbon fibre and the crystals is supported by a thin carbon coating generated
from the reducing agent used for the carbothermal reduction reaction (Figure 5-1).
According to the XRD investigation (Figure 5-2b), no impurity phases have been
generated during the high temperature treatment. This confirms the successful
synthesis of LiFePO4 covering carbonized paper by the novel impregnation–
carbothermal reduction technique. The obtained pattern can be consistently
indexed to JCPDS card number 83-2092 of LiFePO4.
As shown in the SEM images of Figure 5-3a and b, the generated carbon paper is
an interwoven network of carbon fibres, which are completely covered by LiFePO4
particles. Figure 5-3c shows the as-prepared LiFePO4@CP electrode wherein the
individual intact carbon belts are distinguishable. The carbon fibre network is
covered in a thin layer of LiFePO4 showing uninterrupted contact between the two
surfaces, which is evident in Figure 5-3d and the elemental mapping images in
Figure 5-4. The inevitable shrinkage of the cellulose fibre during carbonization to
carbon paper seemingly does not result in contact loss between the freshly
generated LiFePO4 crystallites and the carbonizing paper surface. Consequently, it
can be seen that the LiFePO4 layer was generated leaving random cavities behind
(Figure 5-3d), possibly caused by de-hydrogen and de-oxygen processes during
109
the transition of cellulose fibre to fully-carbonized carbon paper.[441] These cavities
or pores are beneficial for electrolyte penetration, and thus, ion diffusivity through
the LiFePO4 layer.[372]
Figure 5-3. SEM images of (a) bare carbonized paper at low magnification, (b) bare carbonized paper at high magnification, (c) carbonized paper loaded with LiFePO4, and (d) cross section SEM image of LiFePO4@CP.
110
Figure 5-4. SEM energy-dispersive spectroscopy (EDS) characterization of LiFePO4@CP. (a) SEM image of the selected area for EDS mapping; (b) Integrated Fe-, P-, O-, and C-elemental mapping image; elemental mapping images of (c) carbon C, (d) oxygen O, (e) iron Fe, and (f) phosphorous P.
(a)
(c)
(b)
(d)
(e) (f)
111
TEM imaging was conducted to visualize the cooperative combination of carbon
fibre, LiFePO4 crystallite, and carbon coating.
Figure 5-5. TEM images of (a) a LiFePO4 single crystallite embedded into a carbon fibre and wrapped by a carbon coating and (b) the enlarged section of the LiFePO4 crystal showing the approximate thickness of the carbon coating at different positions; (c) TEM image of a carbon coated LiFePO4 crystal attached to a piece of carbon fibre. Small voids are formed between carbon layer and particle allowing the material to contract during battery operation. (d) Selected area electron diffraction (SAED) pattern of LiFePO4@CP.
112
Figure 5-5a shows the TEM image of a single LiFePO4 crystal (dashed outlines)
closely in contact with a piece of carbon fibre. The LiFePO4 crystals are covered
by a thin layer of amorphous carbon (dotted outline) of about 3–5 nm thickness
(Figure 5-5b). This carbon layer continues on the carbon fibre surface, providing a
conducting network between individual LiFePO4 particles and along the fibre
surface. Furthermore, the carbon coating also formed a closed-packed yolk-shell
structure with the LiFePO4 particles leaving small voids, which allows the material
to contract during (dis)charge (Figure 5-5c). The reinforcement provided by this
thin carbon coating contributes to the cycling stability, which is usually determined
by the added polymeric binder in a conventional electrode design due to swelling,
decomposition, or poor elasticity of some commonly-used products.[156, 442] In the
case of our material, the carbon coating combines the function of a strong binder
and a conducting additive without the disadvantages for cycle life and rate
performance.[443, 444] And lastly, the selected area electron diffraction (SAED)
pattern displayed in Figure 5-5d exhibits a set of concentric rings with bright spots,
which can be indexed as the olivine LiFePO4 phase in consistency with the XRD
investigation shown in Figure 5-2b.
Thermogravimetric measurements displayed in Figure 5-6 allow the determination
of the nominal carbon content of the as-prepared LiFePO4@CP material. Heating
pure LiFePO4 in air from room temperature to 700 °C results in a weight gain of
4.8%, slightly under the theoretical weight gain of 5.1% if Fe2+ is completely
oxidized to Fe3+.[445] The LiFePO4@CP electrode shows a weight loss of 68.9% up
to 475 °C, followed by a slight weight gain plateauing at 72%. This result indicates
a nominal carbon content of around 33 wt%, which is very reasonable assuming
that the nominal carbon content substitutes the Al current collector (CP
component), carbon black additives, and polymeric binders (carbon coating
component).
113
Figure 5-6. TGA curve of LiFePO4@CP and carbon free LiFePO4 from room temperature to 700 °C in air.
The as-prepared LiFePO4@CP electrode can thus be directly used as the cathode
in lithium-ion batteries without the use of an Al current collector, conducting
additives, or binders.
The evaluation of cycling stability and rate performance (Figure 5-7a) was carried
out using an unconventional approach, which incorporates both test conditions into
one uninterrupted test sequence. This combined rate and stability performance test
gives valuable insight on the durability of the as-prepared LiFePO4@CP electrodes
under extremely stressful conditions of long-term fast cycling and relaxation during
short-term slow cycling at various rates, respectively. Individually-tested electrodes
were first cycled at different current rates from 0.1 to 2.5 mA cm−2 and back to 0.1
mA cm−2 in step one. Immediately after this rate performance test in step two, the
cells were cycled at 2.5 mA cm−2 for 500 cycles to evaluate the cycling stability at
high current rates. After that, the sequence was repeated once in step three and
step four to identify performance changes of the cells. As shown in Figure 5-7a,
step one was completed after 42 cycles.
114
Figure 5-7. (a) Cycling stability and rate performance test of LiFePO4@CP for 1000 deep (dis)charge cycles; Galvanostatic profiles of LiFePO4@CP at different current densities in the voltage range of 2.0 to 4.25 V of (b) the Initial rate performance test and (c) the second rate performance test; (d) Capacity retention comparison of LiFePO4@CP and LiFePO4@Al at different current densities for 1000 cycles normalized to the reversible areal capacity at 0.1 mA cm-2.
The LiFePO4@CP electrodes achieved reversible areal capacities of 197, 180, 163,
147, and 127 μA h cm−2 at current densities of 0.1, 0.25, 0.5, 1.0, and 2.5 mA cm−2,
respectively. The capacity retention from 0.1 to 2.5 mA cm−2, displayed in Figure
5-7d, is as high as 65% and the cells recovered to 205 μAh cm-2 after the current
115
density was reduced back to 0.1 mA cm-2. Immediately after the rate performance
test, the same cells were cycled at 2.5 mA cm-2 for 500 cycles in step two and a
progressive capacity increase can be observed in Figure 5-7a. After this first
cycling stability test, the LiFePO4@CP electrodes showed no sign of capacity
fading. Instead, the electrode generated a capacity increase of about 5% to 134
μAh cm-2 (Figure 5-7a and c). A progressive increase of reversible capacity can be
observed. Similar activation phenomena have been reported previously for
LiFePO4 particles incorporated into fibre matrices or conducting polymers, which
also showed increasing capacities even over several 100 cycles.[432, 433, 446] The
reason for this might be found in the very densely packed distribution of particles
forming the LiFePO4 shell. In this arrangement, the electrolyte penetration might
not be completed throughout the entire electrode surface of the uncycled cell. The
slight volume reduction during charging[7] could open up new areas for the
electrolyte, which enables the extraction of even more Li+ in the subsequent cycles
until the electrolyte was able to penetrate the entire surface of the LiFePO4 shell.
Furthermore, no capacity deterioration can be observed during the first rate and
stability performance test sequence, which would indicate particle-particle and/or
particle-CP contact loss. Both the particle collective as well as the particle-CP
interface seem to remain intact even after over 500 deep (dis)charge cycles at high
current densities. The second rate performance test in step three revealed
reversible areal capacities of 222, 202, 186, 166, and 141 μA h cm-2 at current
densities of 0.1, 0.25, 0.5, 1.0, and 2.5 mA cm-2, respectively, which translates into
an average capacity increase of 10.5% compared to the initial rate performance in
step one, as illustrated in Figure 5-7d. Moreover, the capacity retention from 0.1 to
2.5 mA cm-2 remained steady at 64% and the cells now recovered to 227 μA h cm-2
after the current density was decreased back to 0.1 mA cm-2. The subsequent
second stability test in step four revealed a slight capacity decline starting after
around 700 cycles. Consequently, the reversible capacity after 1000 cycles
116
reaches a remarkable 115 μA h cm-2, which is 88% of the initial capacity measured
during the first stability test in step two. Figure 5-7b and c show the galvanostatic
(dis)charge profiles of LiFePO4@CP cycled between 2.0 and 4.25 V at the current
densities from 0.1 mA cm-2 to 2.5 mA cm-2 of step one and step three, respectively.
It is evident that all profiles display the distinct charge-discharge behaviour of
LiFePO4 showing two flat plateaus, one at around 3.5 V during charging and the
other one at around 3.4 V during discharge. These two plateaus are associated
with the Fe2+/Fe3+ redox couple reaction, which in detail refers to oxidizing Fe2+ to
Fe3+, and thus extracting Li+ during the charge process and vice versa reducing
Fe3+ to Fe2+ and inserting Li+ during discharge.[8, 415, 447] The corresponding
differential capacity analyses are displayed in Figure 5-8, respectively. From there
it can be seen that the voltage gaps between charge and discharge have
significantly narrowed by an average of about 35% even for very high current
densities, and the length of each plateau (Figure 5-7b and c) has been increased in
step three compared to step one. This result again indicates improved charge-
transfer kinetics and increased Li+ utilization due to the progressive electrode
activation process.
For comparison, a similar test sequence was conducted using a traditional
electrode (LiFePO4@Al) with the same active material mass load as the
LiFePO4@CP electrodes (around 2.8 mg cm-2) containing a high performance
LiFePO4 material, PVDF binder, and carbon black (Figure 5-7d and Figure 5-9).
117
Figure 5-8. Corresponding differential capacity analysis of (a) step one and (b) step three of LiFePO4@CP (Insets: Overpotentials in mV for the current densities 0.1 to 2.5 mA cm-2)
According to Figure 5-7d, the capacity retention from 0.1 to 2.5 mA cm-2 of around
70% for LiFePO4@Al is very similar to LiFePO4@CP in the first rate performance
test of step one. As the LiFePO4@Al entered the cycling stability test in step two at
2.5 mA cm-2 for 500 cycles, a dramatic capacity loss can be observed and only 54%
of the initial capacity at the beginning of step two was maintained. At the end of
step four after 1000 cycles LiFePO4@Al maintained 30% of its initial capacity at 2.5
mA cm-2 in step two.
(a)
(b)
118
Figure 5-9. (a) Rate performance and (b) stability test sequence of a traditional LiFePO4@Al displayed in areal capacity. The active material mass load of all electrodes is around 2.8 mg cm-2.
Furthermore, a second comparative test, as shown in Figure 5-10, was conducted
to demonstrate capacity and stability in reference to the total weight of the
electrode including Al current collector, binder and additives, which strongly
supports the proposed beneficial properties of a carbon paper based electrode
design.
119
Figure 5-10. (a) Rate performance and (b) stability test sequence of LiFePO4@CP and a traditional LiFePO4@Al. The capacity is displayed in mA h per gram of electrode (weight including current collector, binder and additives). The active material mass load of all electrodes is around 2.8 mg cm-2.
Not only is the reversible capacity at a current density of 0.1 mA cm-2 of the
LiFePO4@Al electrode (28 mA h g-1) significantly reduced compared to our
LiFePO4@CP electrode (45 mA h g-1), the cycling stability also shows much more
obvious decline over the tested 1000 cycles.
120
Figure 5-11. Rate performance and stability test sequence of LiFePO4@CP and a traditional LiFePO4@Al. The capacity is displayed in mA h per gram active material. The active material mass load of all electrodes is around 2.8 mg cm-2.
This further demonstrates the superiority of the LiFePO4@CP electrode over the
disadvantaged traditional electrode designs containing metal current collectors,
polymeric binders, and conducting additives. For the sake of completeness,
however, the rate performance and cycling stability results are also converted into
active material weight-specific capacity shown in Figure 5-11.
Figure 5-12a unveils the cyclic voltammetric (CV) behaviour of LiFePO4@CP at
various scanning rates from 0.1 to 2.0 mV s-1 in the voltage range between 2.0 and
4.5 V after the electrode activation process (step two) was completed. A single pair
of defined redox peaks can be observed for all scan rates, which corresponds to
the Fe3+/Fe2+ redox couple as mentioned before. Furthermore, height and area of
the redox peaks rise with increased scanning rates, whereas the anodic and
cathodic peaks move to the lower and higher potentials, respectively. Even at a
high scanning rate of 2.0 mV s−1, the defined redox reaction peaks are still
maintained, indicating good kinetics for lithium intercalation and de-intercalation.
121
Figure 5-12. (a) CV profiles at different scan rates in the voltage range of 2.0 to 4.5 V and (b) peak current IP versus square root of scan rate ν0.5 at room temperature of LiFePO4@CP after 500 cycles.
According to the measured peak currents, a Li-ion diffusion coefficient D (cm2 s−1)
can be calculated using the Randles-Sevcik equation:[387, 390, 397]
Ip= 2.69∙105∙A∙C∙ D∙n3
2∙ ν (5-6)
wherein Ip is the peak current (A), A is the surface area of the electrode, C is the
concentration of Li-ions in a solid (0.0228 mol cm−3), n is the number of electrons
122
involved in the half-reaction for the redox couple (n = 1 for Fe3+/Fe2+ redox couple),
and ν is the potential scan rate (V s−1). As shown in Figure 5-12b, Ip is proportional
to ν1/2, confirming a diffusion-controlled behaviour. Moreover, from the slope of the
lines, and based on equation (5-6), the diffusion coefficient Dcathodic (positive) is
2.90∙10-11 cm2 s-1, and the diffusion coefficient Danodic (negative) is 3.99∙10-11 cm2 s-
1. These high Li-ion diffusion coefficients achieved by this material are related to
the well maintained particle-particle contact of the LiFePO4 collective, which
enables rapid ion diffusion, and fast charge transfer kinetics through the carbon
paper scaffold. The slight broadness of the peaks might be linked to the carbon
coating generated by the glucose precursor, which has been reported to influence
the shape of the redox peaks noticeably.[448]
The Nyquist plot displayed in Figure 5-13a compares the electrochemical
impedance of fresh LiFePO4@CP and cycled for 500 cycles. It can be seen that
the material generates a depressed semicircle in the high frequency region and a
slope in the low frequency region. Firstly, the high frequency intercept of the
semicircle with the real axis (Z’) refers to the uncompensated resistance (Ru),
which combines particle-particle contact resistance, electrolyte resistance, and
electrode-current collector resistance. Secondly, the semicircle diameter refers to
the charge transfer resistance (RCT), which is related to the electrochemical
reactions at the electrode-electrolyte interface and the particle-particle contact.
Lastly, the low frequency slope corresponds to the lithium-ion diffusion in the bulk
of the electrode material and can be mathematically transformed to the Warburg
coefficient (σw).
123
Figure 5-13. (a) Electrochemical impedance spectra and (b) linear fit of the Warburg impedance of a LiFePO4@CP cell fresh and cycled for 500 cycles.
Consequently, the solid state diffusion of lithium-ions DLi through the LiFePO4
particle collective can be estimated using the following equation.[204, 389, 390, 393, 398]
DLi=12
(5-7)
wherein R is the gas constant, T the absolute temperature, F the Faraday constant,
A the surface area of the LiFePO4@CP cathode, C the molar concentration of
124
lithium-ions in the cathode, and σw the Warburg coefficient. It can be seen in the
experimental data plot in Figure 5-13a that the charge transfer resistance (RCT) of
the fresh cell is 16.15 Ω, whilst the EIS analysis of the cycled half-cell reveals a
reduction in charge transfer resistance. The value has decreased to 4.067 Ω, due
to the aforementioned electrode activation processes during cycling. Overall, the
measured charge transfer resistances are very low indicating excellent ionic and
electronic transport along the electrode-electrolyte interface and strong particle-
particle contact even after 500 high-rate deep (dis)charge cycles. Additionally, the
solid-state diffusion DLi calculated using equation (5-7) from the Warburg
impedance (shown in Figure 5-13b) reflects the kinetic properties of the electrode,
revealing a competitive lithium-ion diffusion rate of 1.35∙10-13 cm2 s-1 for the fresh
and 2.15∙10-13 cm2 s-1 for the cycled cell measured from fully-lithiated LiFePO4,
respectively. Here again, a kinetic improvement is observed upon cycling due to
the cell activation process.
5.4 Conclusions
In conclusion, a novel free-standing LiFePO4@CP hybrid electrode has been
developed, in which a shell of LiFePO4 crystallites on interwoven carbon fibres is
embedded in a conductive carbon network. In this novel architecture, the carbon
fibre fabric serves as the current collector, whilst the carbon coating provides
conducting pathways and structural support for the LiFePO4 particle collective. This
novel electrode design not only ensures close interparticle contact, but also high
electronic conductivity for both mass and charge transfer. The LiFePO4@CP hybrid
electrode delivered high areal capacity and excellent cycling stability for 1000
cycles at a high current density. It has been shown that metallic current collectors,
polymeric binders, and conducting additives can easily be substituted using
commercial cellulose fibres and sugar, to generate a high performance
125
LiFePO4@CP hybrid electrode, which could be used as the cathode in flexible
lithium-ion batteries.
126
6 Chapter 6: 3D interconnected carbon fibre network-enabled ultra-long life Na3V2(PO4)3@carbon paper cathode for sodium-ion batteries
6.1 Introduction
Renewable energy production and energy storage have become the most essential
technologies for the transition from fossil fuels to a sustainable energy supply. The
key issue with most renewable energy sources is the deficiency between
availability and demand due to uncontrollable natural occurrences, which
generates unacceptable energy quality fluctuations within the electricity grid.[449]
Large-scale energy storage systems are believed to be the solution to this problem
by simply buffering this deficiency. Among various kinds of energy storage
technologies, rechargeable batteries are considered a promising option for such
large-scale storage requirements.[450, 451] The dominant rechargeable battery
system today is the lithium-ion battery because it has been the power source of
choice for portable and mobile applications for decades. However, with the
increasing need for large-scale grid energy storage, low-cost sodium-ion batteries,
which have a similar electrochemistry to lithium-ion batteries, are emerging as a
more suitable technology due to the abundance and low cost of sodium.[451]
Among the cathode materials investigated for sodium-ion batteries, Na3V2(PO4)3
has attracted great interest since its first report in 2002[452] owing to the high
sodium conductivity of its 3D (Na Superionic Conductor) NASICON-type
framework,[9, 237] and high thermal stability and energy density.[453] Due to its poor
electronic conductivity,[89, 454] providing electronically conducting networks is highly
important for this type of material to be applicable in a real world application. An
optimized solution for an electrode design featuring Na3V2(PO4)3 as the active
material would be a continuous network of current collector and electrolyte, with an
appropriate size of Na3V2(PO4)3 particles.[455, 456] The particle size needs to be
127
carefully designed for optimal chemical diffusion inside the particle (nanoparticle
size scales are needed when a material is a poor conductor). In recently published
reports, various kinds of carbon coatings are applied as a conducting network to
improve electron transport[318, 319, 353, 356, 457-467] and this may be in the form of
carbon nanotubes/nanofibers/nanorods[468-470] and/or graphene.[471-473] Very
recently, 3D interconnected conducting network strategies, which utilize a
combination of different carbons have been investigated[354, 456, 466, 474, 475] but only
one publication on Na3V2(PO4)3 to date has explored the possibilities of a free-
standing electrode design.[476]
We designed a unique free-standing, binder-free and metallic current collector-free
Na3V2(PO4)3-carbon paper (Na3V2(PO4)3@CP) cathode for sodium-ion batteries.
The simultaneous carbonization of microcrystalline cellulose fibre and in situ crystal
growth of Na3V2(PO4)3 nanoparticles generates an innovative Na3V2(PO4)3-carbon
paper hybrid electrode. This hybrid electrode consists of an interconnected 3D
carbon fibre network (CFN), which enables fast electron transport and provides a
porous structure for electrolyte diffusion. The Na3V2(PO4)3 nanoparticles decorated
on the carbon fibre network facilitate fast ion diffusion over a large surface area.
The innovative electrode design achieved high reversible capacity, exceptional
cycle life over 30 000 cycles, and high rate capabilities. In a proof-of-concept
experiment, we have also investigated the capabilities of this 3D carbon fibre
network to function as the sole current collector of this electrode design, which
extends the range of possible applications for free-standing electrodes in general.
6.2 Experimental Section
Preparation of Na3V2(PO4)3@CP Cathodes:
Na3V2(PO4)3@CP was prepared by a novel impregnation–carbonization technique.
Commercial paper towel (PT) was used as a suitable carbon paper source owing
128
to its porous nature, structural integrity, and light weight. The PT was purified by
soaking in 20 mL deionized water (DI) for 2 h. Subsequently, 4 mL concentrated
hydrochloric acid was added to the solution and left for another 12 h. The purified
PT was washed with DI water several times by vacuum filtration and dried
overnight at 100 °C in a vacuum oven. The dried tissue was impregnated for 10
min to ensure thorough saturation with a solution containing 0.3 g VCl3 (97%),
0.433 g NaH2PO4∙2H2O, and 0.09 g D-glucose in 5 mL DI water. The saturated PT
was subjected to freeze-drying overnight to obtain a homogenous loading of all
precursors. The dried and preloaded PT was then transferred into a ceramic
crucible and sintered at 350 °C for 5 h and 750 °C for 12 h under a H2/Ar
atmosphere. The carbon content was determined by acid removal of the
Na3V2(PO4)3 component, which provides a weight difference between the dry
Na3V2(PO4)3@CP electrode and the residual carbon paper after acid treatment.
Using this method, the nominal carbon content of the as-prepared
Na3V2(PO4)3@CP electrode was estimated to be 64 wt%.
Preparation of Na3V2(PO4)3@C Reference Materials:
A solution containing 0.3 g VCl3 (97 %), 0.433 g NaH2PO4∙2H2O and 0.09 g D-
glucose in 5 ml DI water was slowly converted into a gel using a water bath at
80 °C under constant mild stirring. The gel was dried under vacuum at 100 °C for
12 hours. The obtained dried gel was ground to fine powder, transferred into a
ceramic crucible and sintered at 350 °C for 5 h and 750 °C for 12 h under H2/Ar
protection.
Structural and Physical Characterization:
Crystallographic measurements were conducted using a Bruker D8 Discovery X-
ray diffractometer with CuKα radiation between 10° and 80°. Morphological
analyses of the as-prepared materials were carried out by field-emission scanning
129
electron microscopy (Zeiss Supra 55VP). Elemental mapping was conducted on a
Zeiss EVO MA 15 SEM equipped with energy-dispersive X-ray spectroscopy
(EDX). The carbon fibre/Na3V2(PO4)3 particle interface was investigated by
HRTEM (JEOL JEM-2011). SAED patterns were collected by a Gatan charge-
coupled device camera in a digital format.
Electrode Preparation and Test Cell Assembly:
The as-prepared Na3V2(PO4)3@CP electrodes were used directly as working
electrodes without further modification. The active material (Na3V2(PO4)3) mass
load was 1.0 mg cm-2 with a total footprint area of 1.54 cm2. Sodium metal was
used as counter and reference electrode. The electrolyte consists of 1 M NaClO4 in
a mixture of ethylene carbonate (EC) and propylene carbonate (PC) (EC: PC = 1:1
volume ratio), in which 5 vol% fluoroethylene carbonate was added as the
electrolyte additive. Approximately 140 μL electrolyte was used for each coin cell.
The amount of liquid electrolyte uptake is calculated using the following equation:
(6-1)
where η is the uptake of the liquid electrolyte, and Wo and Wt are the weight of the
electrodes before and after absorption of the liquid electrolyte, respectively. The
electrolyte uptake was calculated to be 200 wt%. As an attempt to prove the
concept of carbon paper serving as the current collector, the cell assembly was
modified using a small piece of aluminium foil and a purified piece of paper towel.
In this proof-of-concept set-up the Na3V2(PO4)3@CP electrode was insulated from
the stainless steel battery shell using a slightly bigger piece of purified paper towel.
The battery shell was electronically connected to the Na3V2(PO4)3@CP electrode
by folding a small piece of aluminium foil around the Na3V2(PO4)3@CP electrode
and the insulating paper towel piece. All electrodes were stored and all standard
130
CR2032 type coin cells were assembled in an argon-filled glovebox (UniLab,
MBRAUN).
Electrochemical Characterization:
Galvanostatic charge–discharge and cycling performance tests were performed in
the voltage range of 2.5 – 3.8 V at various current densities on a Neware battery
tester at room temperature. Cyclic voltammograms were obtained at different
scanning rates of 0.1 – 2.0 mV s-1 between 2.0 and 4.0 V and EIS measurements
were conducted over a frequency range from 100 kHz to 0.01 Hz using a CHI
660C Electrochemistry Workstation.
6.3 Results and Discussion
Sodium vanadium phosphate on carbon paper (Na3V2(PO4)3@CP) was prepared
via a freeze-drying assisted impregnation–carbonization technique (Figure 6-1a)
adapted from our previous reports.[441, 477] Purified commercial paper towel (PT)
has been shown to be an excellent substrate for the growth of a variety of
nanostructured electrochemically active materials in lithium-ion as well as in
sodium-ion battery systems.[441, 477, 478] Its structural integrity, porosity of the fabric,
and good electronic conductivity (postcarbonization) provide intriguing advantages
over conventional metallic substrates, such as copper and aluminium foil.
Furthermore, the freeze-drying assisted impregnation–carbonization methods can
effectively restrict the particle growth on the cellulose fibre surface. First, rapid
freezing of the impregnated paper towel induces immediate supersaturation by
solidification of the aqueous solvent, and thus, fast recrystallization of NaH2PO4,
which drastically limits the crystal growth of alkali metal phosphates.[479, 480]
131
Figure 6-1. (a) Schematic illustration of the preparation procedure for Na3V2(PO4)3@CP. (b) XRD pattern of Na3V2(PO4)3@CP and carbon-coated Na3V2(PO4)3 (Na3V2(PO4)3@C) as reference sample (both resemble the standard pattern of JCPDS card number 62-0345).
Second, vanadium ions can form organometallic compounds with D-glucose,
producing a homogenous glucose wrapping of the vanadium precursor salt upon
solvent removal.[481, 482] After carbonization of the cellulose fibres and calcination of
the Na3V2(PO4)3 nanoparticles on the fibre surfaces, the obtained free-standing
132
composite electrodes can be readily applied as cathodes in sodium-ion batteries.
X-ray diffraction (XRD) patterns were collected from the as-prepared
Na3V2(PO4)3@CP hybrid electrode and a carbon-coated Na3V2(PO4)3 sample,
which was prepared via a sol-gel method using identical precursors (referred to as
Na3V2(PO4)3@C). Both XRD patterns, as shown in Figure 6-1b, resemble the
standard pattern of JCPD card number 62-0345, confirming the successful
preparation of the Na3V2(PO4)3 nanocrystals. It is worth noting that the pattern
collected from the carbon paper electrode only clearly reveals high intensity peaks
of Na3V2(PO4)3 with very obvious background noise, and thus, most low intensity
peaks are indistinguishable from the background. This is first due to the very small
particle size of the Na3V2(PO4)3 crystals on the carbon paper surface compared to
the relatively large particles generated by the sol-gel method (Figure 6-2a). Second,
the amorphous carbon paper substrate has shown low signal-to-noise ratios in
XRD scans before.[477] The bare carbon paper substrate exhibits an amorphous
structure with no obvious peaks associated with graphitic carbon (Figure 6-2b).
The slight irregularity observed below 20° can be ascribed to the low-background
XRD sample holder used, and thus, be disregarded.
Figure 6-2. (a) SEM image of Na3V2(PO4)3@C prepared by a sol-gel method using identical precursor salts to Na3V2(PO4)3@CP; (b) XRD pattern of the carbon paper substrate.
133
The carbon paper substrate shows similar high noise/signal ratios as the
Na3V2(PO4)3@CP pattern displayed in Figure 6-1b. Nevertheless, 14 clearly
identifiable peaks are sufficient to confirm the successful preparation of the
elemental mappings displayed in Figure 6-3 also confirm the uniform distribution of
all five elements (Na, V, P, O, C) on a single fibre of the hybrid electrode. No
obvious lumps or clusters of elements can be observed and no undesired
precursor elements are present in these images. The morphology of the
Na3V2(PO4)3 particles generated on the surface of carbon fibre was identified by
scanning electron microscopy (SEM) and is presented in Figure 6-4a-c. As for the
carbon substrate itself (Figure 6-4a), the carbonized cellulose maintains an
interconnected network of micro sized fibres decorated with Na3V2(PO4)3
nanoparticles (Figure 6-4b). The nanoparticles resemble a spherical droplet-like
morphology in the size range of around 30 nm up to 200 nm (Figure 6-4c), which is
the result of the cooperative effect of D-glucose and optimized precursor solution
concentration. In a trial of preparing Na3V2(PO4)3@CP without the addition of D-
glucose it was found that the generated particle morphology was randomized and a
uniform decoration of the carbon fibre surface could not be achieved (Figure 6-5a).
It was also found that a 30% increase of precursor solution concentration caused
aggregation, which results in the loss of individual spherical nanoparticles and the
Na3V2(PO4)3 decoration effect shifts towards an incomplete thin film distribution
(Figure 6-5b). Thus, an active material load increase requires further optimization
to maintain the desired morphology. Transmission electron microscopy (TEM)
images show the Na3V2(PO4)3 particles embedded in the carbon fibre in Figure
6-4d and the lattice orientation of one individual particle in Figure 6-4e. The lattice
resolved TEM image from the square section marked in Figure 6-4e is shown in
Figure 6-4h. From this image, the (012) crystal plane can be clearly seen.
134
Figure 6-3. Energy-dispersive X-ray spectroscopy (EDS) elemental mapping showing the distribution on the elements sodium (Na), vanadium (V), phosphorus (P), oxygen (O) and carbon (C) of a selected area of a Na3V2(PO4)3@CP fibre.
135
Figure 6-4. (a) Low magnification SEM view of the CFN. (b) Low magnification SEM image of a single carbon fibre decorated with Na3V2(PO4)3 nanoparticles. (c) High magnification SEM image of Na3V2(PO4)3 nanoparticles on the carbon fibre surface. (d) Low resolution TEM image of Na3V2(PO4)3@CP. (e) High resolution TEM image of Na3V2(PO4)3@CP. (f) Digital photograph of a Na3V2(PO4)3@CP electrode. (g) SAED pattern of Na3V2(PO4)3@CP. h) Lattice resolved TEM image including d-spacing along the (012) crystal plane enlarged from the section marked in image (e).
136
Clear lattice fringes with a d-spacing of 0.6 nm demonstrate high crystalline
characteristics of the Na3V2(PO4)3 NASICON structure. Figure 6-4g displays the
selected area electron diffraction (SAED) pattern obtained from the particle shown
in Figure 6-4e and h. This SAED pattern exhibits a set of concentric rings with
bright spots, which can be indexed as Na3V2(PO4)3 in consistency with the XRD
result shown in Figure 6-1b. The as-prepared Na3V2(PO4)3@CP was directly used
as a free-standing electrode in sodium-ion batteries (NIBs) without the usage of an
additional current collector, binder, and conducting additives. The handling and
flexibility of the electrode is demonstrated in Figure 6-4f. From Figure 6-4f it is
evident that the as-prepared electrode can be easily processed using ordinary
tweezers, which predicts good handling in a potential mass production scenario.
The electrode can also sustain a reasonable degree of bend when gently held
between two fingers (Figure 6-6). When the bending force on the disk was
released, no collapse or cracking has taken place and the electrode can be readily
used in an NIB.
Figure 6-5. SEM images of Na3V2(PO4)3@CP materials prepared (a) without the addition of 30 wt% D-glucose to the precursor solution; and (b) with a 30 % higher concentration precursor solution.
137
Figure 6-6. Digital photograph of the Na3V2(PO4)3@CP hybrid electrode slightly bent to demonstrate its structural integrity under stress.
The electrochemical performances were evaluated in a series of different kinetic
and stability tests. First, the galvanostatic charge–discharge profile of
Na3V2(PO4)3@CP at a current density of 0.1 mA cm-2 is shown in Figure 6-7a. The
cell exhibits the standard galvanostatic charge–discharge profile of Na3V2(PO4)3 in
the voltage range of 2.5 – 3.8 V.[354, 456, 474] As can be seen, the obvious charging
and discharging plateaus are observed at 3.40 and 3.30 V, respectively.
Furthermore, the flat plateaus demonstrate that a reversible phase transformation
between Na3V2(PO4)3/NaV2(PO4)3 took place. The cycling performance of the as-
prepared Na3V2(PO4)3@CP hybrid electrodes was evaluated in a combined rate
performance and cycling stability test (shown in Figure 6-7b). The test sequence
begins with a 30 cycle rate performance evaluation at altering current densities
spanning from 0.1 to 2.5 mA cm-2. The current density is then decreased back to
0.1 mA cm-2 to observe the capacity retention capabilities of the hybrid electrode.
Directly after, a long-term cycling stability test at a current density of 2.5 mA cm-2
was conducted, which resulted in an overall cycle count of 30 530 cycles being
attained as displayed in Figure 6-7b.
138
Figure 6-7. (a) Galvanostatic charge–discharge profile of Na3V2(PO4)3@CP at a current density of 0.1 mA cm-2 in the voltage range between 2.5 and 3.8 V. (b) Rate performance and cycling stability evaluation of Na3V2(PO4)3@CP at various current densities. (c) Cyclic voltammetry (CV) performance of Na3V2(PO4)3@CP at different scan rates in the voltage range between 2.0 and 4.0 V versus Na+/Na. (d) Peak current IP versus square root of scan rate ν0.5 at room temperature after 500 cycles with calculated ion diffusion coefficients D.
The novel Na3V2(PO4)3@CP hybrid electrode delivered a reversible areal capacity
of 49, 45, 41, 35, and 24 μAh cm-2 when cycled at 0.1, 0.25, 0.5, 1.0, and 2.5 mA
cm-2, respectively. When the current density is returned from 2.5 to 0.1 mA cm-2 the
139
cell recovered to 50 μAh cm-2. One of our experimental cells was then cycled at 2.5
mA cm-2 for several tens of thousands of cycles, which highlights the exceptional
cycling stability of the hybrid material. The best test cell had successfully reached
30 530 full cycles when we discontinued the testing. The capacity retention (inset
in Figure 6-7b) of this material was calculated every 10 000 cycles and revealed a
capacity loss of around 10% per 10 000 successive deep charge–discharge cycles
at a current density of 2.5 mA cm-2. To the best of our knowledge, this is the
highest capacity retention reported among all publications since 2002, and
furthermore, only the second report on a free-standing paper-like electrode using
intercalation type Na3V2(PO4)3. For the sake of completeness, the cycling
performance of Na3V2(PO4)3@CP prepared using a 30% more concentrated
precursor solution is shown in Figure 6-8. Figure 6-7c displays the cyclic
voltammetric (CV) behaviour of Na3V2(PO4)3@CP at various scanning rates from
0.1 to 2.0 mV s−1 in the voltage range between 2.0 and 4.0 V versus Na+/Na when
the electrode was cycled for 500 cycles. In this voltage range a single pair of
defined redox peaks can be observed at all scan rates, which corresponds to the
V4+/V3+ redox couple and is in good agreement with the charge and discharge
voltage plateau positions displayed in Figure 6-7a.
Figure 6-8. Cycling performance of the sample prepared with a 30% higher concentration precursor solution (~32 wt% carbon).
140
Furthermore, the height and area of the redox peaks increase with increasing
scanning rate. The anodic and cathodic peaks move to lower and higher potentials,
respectively. Even at a high scanning rate of 2.0 mV s-1, the defined redox reaction
peaks are still maintained, indicating good kinetics for sodium intercalation and de-
intercalation. The electrode polarization slightly increases with increased scan rate
(0.1 to 2.0 mV s-1) from 0.13 to 0.40 V, respectively, which is one of the lowest
values reported in recent publications.[354, 468, 476] According to the measured peak
currents, a sodium ion diffusion coefficient D (cm2 s-1) can be calculated using the
Randles–Sevcik equation:[462, 483, 484]
(6-2)
wherein IP is the peak current (A), A is the footprint area of the electrode, C is the
concentration of sodium ions in a solid (0.0069 mol cm-3), n is the number of
electrons involved in the half-reaction for the redox couple (n = 2), and ν is the
potential scan rate (V s-1). As shown in Figure 6-7d, IP is proportional to ν0.5, which
is indicative of a diffusion-controlled behaviour. From the slope of the lines
calculated based on Equation (6-2) the diffusion coefficient Danodic (positive) = 1.30
× 10-11 cm2 s-1, and the diffusion coefficient Dcathodic (negative) = 1.09 × 10⁻¹¹ cm2 s-1
are determined.
The major advantage besides the ultralong cycle life of our Na3V2(PO4)3@CP
hybrid electrode is that the carbon scaffold dispenses the need for polymeric binder
and additional high-conductivity (metallic) current collectors. This material enables
a great reduction in battery costs by simplifying battery packing processes and
eliminating weight of electrochemically inactive materials, such as binder,
conducting additives, and metallic current collector. In recent years, this concept
has been partially implemented in both lithium-ion and sodium-ion battery systems
at both anode[485-488] and cathode[488-490] side of the cells. However, most
141
laboratories use coin cells to conduct half-cell experiments, so the question
remains whether the carbon substrate really acts as the current collector. The
reason for this is the metallic casing of standard coin cells, which one might argue
is in fact the current collector when in contact with electrodes inside. If our free-
standing electrode example was applied in commercial 18 650 cylindrical batteries
or even pouch cells, there might not be sufficient contact surface area for charge
transport as the electrodes are not fully in contact with a conducting cell casing. To
confirm or deny that our carbon paper, and not the battery casing, is functioning as
the main current collector in CR2032 coin cells used for half-cell testing, we
conducted a proof-of-concept experiment. As displayed Figure 6-9, we simulated
the more realistic situation of the electrode not being in contact with a conductive
cell casing by physically disconnecting the electrode from the cell using a slightly
bigger piece of purified paper towel positioned between the two components. A
folded small piece of aluminium foil serves as the only electrical connection
between electrode and cell casing with the result that the electronically connected
surface area of the Na3V2(PO4)3@CP electrode was reduced to around 0.2 cm2 (10%
of electrode footprint area).
Figure 6-9. Digital image of the proof-of-concept set-up.
142
The proof-of-concept cell was otherwise identical to the normal cell as described in
the Experimental Section 6.2 and both set-ups were electrochemically evaluated
under the same cycling conditions (shown in Figure 6-10a). From this image, there
is very little difference between the sole Na3V2(PO4)3@CP ( ) and the insulated
proof-of-concept (Δ) set-up. Initially, we see a capacity value at 0.1 mA cm-2 of
49.4 μAh cm-2 and 56.5 μAh cm-2 for the normal ( ) and the proof-of-concept (Δ)
set-up, respectively, which translates into a difference of around 14%.
Figure 6-10. (a) Rate performance and cycling stability of Na3V2(PO4)3@CP and the modified proof-of-concept cell assembly with Na3V2(PO4)3@CP at various current densities; Galvanostatic charge–discharge profiles of Na3V2(PO4)3@CP at various current densities in the voltage range between 2.5 and 3.8 V. (b) The modified proof-of-concept cell assembly and (c) Na3V2(PO4)3@CP.
143
This difference in capacity decreased until a current density of 0.5 mA cm-2 was
reached whereupon the capacity values difference increased again to a maximum
of 26% at a current density of 2.5 mA cm-2. Interestingly, the average difference in
capacity between the two set-ups from 0.1 to 2.5 mA cm-2 only reaches a total of
1.5%. This means that the drastic surface area restriction of the electronically
connected area of the Na3V2(PO4)3@CP electrode has almost no effect on its rate
performance. An area reduction of 90% only results in a capacity reduction of
around 26% at a current density of 2.5 cm-2, which requires the highest electronic
conductivity from the current collector. If the carbon paper substrate was not the
main current collector in the proof-of-concept set-up, the observed capacity should
be reduced directly proportional to the reduced footprint area electronically
connected to the battery casing. Our experiment demonstrates that the capacity
reduction was only around 26%, not 90%, which undoubtedly proves the concept
that the carbon paper acts fully as a current collector. This also highlights the
structural integrity of the Na3V2(PO4)3@CP electrode (shown in Figure 6-10a). The
cycling stability test results reveal an almost identical capacity retention for the
Na3V2(PO4)3@CP and the proof-of-concept set-up after 20 000 deep charge–
discharge cycles at 2.5 mA cm-2, respectively. If the electrode experienced severe
cracking upon prolonged high current cycling, the reversible capacity should
decline at a much higher rate, as only a small area of the electrode is directly
connected to the battery casing. Our experiment proves that the Na3V2(PO4)3@CP
electrodes maintain the conducting carbon fibre network as well as good particle
contact upon long-term cycling with no rapid capacity degradation observed in the
proof-of-concept battery set-up. To visualize the differences and similarities of both
battery set-ups, galvanostatic charge–discharge profiles were plotted for every
third full cycle at each tested current density. These profiles are displayed in Figure
6-10b-c, wherein Figure 6-10b shows the proof-of-concept cell and Figure 6-10c
represents the normal Na3V2(PO4)3@CP cell without any modification. For both
144
experimental cells, the obvious charging and discharging plateaus are observed at
3.40 and 3.30 V, respectively, shifting with increased current densities. The most
noticeable difference between the two battery set-ups is the electrode polarization,
or in other words, the potential gap between charge and discharge voltage
plateaus at each tested current density, which is likely caused by the small bridging
piece of aluminium foil in the proof-of-concept set-up. By definition, electrode
polarization is the result of an isolating barrier between electrode and electrolyte,
which hinders electrochemical reactions.[491] In case of the proof-of-concept battery
set-up, the aluminium foil is responsible for a slight blockage of 10% of the
electrode’s footprint area and simply replacing this foil with a porous mesh would
likely result in indistinguishable profiles as it would improve the electrolyte
accessibility to the electrode. Besides this polarization voltage gap, there is very
little difference between both battery set-ups in terms of unusual plateaus or
unstable charge curves indicating side reactions. This again proves that the
Na3V2(PO4)3@CP electrode fulfils multiple functions as one single component in a
coin cell battery set-up and potentially also in other commercial battery designs like
pouch or cylindrical cells. It serves as the electrochemically active material
responsible for capacity, as the structural support ensuring mechanical integrity,
and as the sole electronic conductor enabling fast charge transport, which
ultimately could make rechargeable sodium-ion batteries lighter, cheaper, and
more reliable.
The Nyquist plots in Figure 6-11a,b compare the electrochemical impedance of
Na3V2(PO4)3@CP in the normal and the proof-of-concept set-up both freshly
constructed and cycled for 20 000 cycles, respectively. It can be seen that both
cells show a depressed semicircle in the high frequency region and have a slope in
the low frequency region exactly as reported in several previous publications.[347,
472, 473, 475]
145
Figure 6-11. Electrochemical impedance spectra of Na3V2(PO4)3@CP and the modified proof-of-concept cell assembly of Na3V2(PO4)3@CP (a) uncycled coin cells; (b) cycled coin cells (cycled for 500 cycles). Corresponding linear fits of the Warburg impedance and the calculated solid-state diffusion coefficient DNa (c) uncycled coin cells; (d) cycled coin cells (cycled for 500 cycles).
First, the high frequency intercept of the semicircle with the real axis (Z’) refers to
the so called uncompensated resistance (Ru), which is a combination of particle–
particle contact resistance, electrolyte resistance, and electrode-current collector
resistance. Second, the semicircle diameter represents the charge transfer
resistance (RCT), which is associated with the electrochemical reactions at the
electrode–electrolyte interface and the particle–particle contact. Lastly, the low
frequency slope relates to the sodium-ion diffusion in the bulk active material and
can be mathematically transformed to the Warburg coefficient (σw).
146
Accordingly, the solid-state diffusion of sodium ions DNa through the Na3V2(PO4)3
particles can be estimated using the following equations:[466, 492-497]
(6-3)
(6-4)
wherein R is the gas constant, T is the absolute temperature, F is the Faraday
constant, A is the footprint area of the Na3V2(PO4)3@CP electrode, n is the number
of electrons involved in the half-reaction for the redox couple (n = 2), C is the molar
concentration of sodium ions in a solid and σw is the Warburg coefficient.
Electrochemical impedance spectroscopy (EIS) is thus an excellent tool to evaluate
transport kinetics inside the Na3V2(PO4)3 nanoparticles independently from the
charge transfer kinetics of the current collector. From the experimental data plots in
Figure 6-11a, we found that the charge transfer resistances (RCT) of the fresh cells
are almost identical, around 490 and 440 Ω for the normal and the proof-of-concept
set-up, respectively. Most reports observe an increase in RCT upon long term
cycling, which appears to be normal for a traditional active material pasted onto a
metallic current collector.[462, 466, 470] Both our tested cells experience an RCT
reduction during cycling as displayed in Figure 6-11b, likely caused by an electrode
activation process previously observed in carbon paper electrodes tested under
similar conditions.[477] The values decreased to 38 and 80 Ω for the normal and the
proof-of-concept set-up, respectively. The difference between the two set-ups is
likely due to the aforementioned insulation of parts of the proof-of-concept
electrode by the aluminium foil piece and can thus be classified as insignificant.
Overall, the measured charge transfer resistances indicate excellent ionic and
electronic transport along the electrode–electrolyte interface even after 500 high-
rate deep charge/discharge cycles. Additionally, the solid-state diffusion DNa
calculated using Equations (6-3) and (6-4) from the Warburg impedance reflects
147
the kinetic properties of the active material as displayed in Figure 6-11c,d. The
diffusion coefficients for the fresh cells are 9.8 × 10⁻¹⁶ and 4.5 × 10⁻¹⁵ cm2 s-1, which
increase an order of magnitude to 2.1 × 10⁻¹⁴ and 3.9 × 10⁻¹⁴ cm2 s-1 after cycling
for the normal and the proof-of-concept set-up, respectively. Here again, a kinetic
improvement upon cycling is likely due to the electrode and material activation
process. The very small difference in sodium ion diffusion coefficient between the
two cell set-ups after cycling suggests that performance differences only originate
from the insulated area covered by the aluminium foil and not from the electrode
itself.
6.4 Conclusions
In conclusion, we have successfully demonstrated excellent cycling performance of
a novel, free-standing Na3V2(PO4)3@CP hybrid electrode in a sodium-ion battery
system. It was shown that Na3V2(PO4)3 nanoparticles decorated on 3D
interconnected conducting carbon fibres can achieve outstanding long-term cycling
stability (more than 30 000 cycles) without the need of any conducting additives,
polymeric binders, or additional current collectors. By using a simple proof-of-
concept battery assembly, we have demonstrated the ease and efficiency of the
stand-alone carbon paper electrode design, which leads the way toward imminent
consideration of alternative free-standing electrode designs in various battery
architectures.
148
7 Chapter 7: Conclusions and Future Perspective
7.1 Conclusions
7.1.1 Carbon-coated LiFePO4 cathode materials for lithium-ion batteries
Highly graphitic carbon-coated LiFePO4 cathode materials are successfully
prepared through industrial ball milling and solid-state reaction by using soluble
starch as a carbon source and only environmentally friendly iron, lithium, and
phosphate precursors. This method can generate uniform, sp2-coordinated carbon-
coated, grape-like nanoparticles, which are favourable for Li+ transport and tap
density. It has been shown that, even though Fe2P phases in combination with a
high-quality carbon network are beneficial to improve high-rate performance and
stability, the capacity reduction at low rates induced by the high carbon content and
the Fe2P phase is disproportionate to justify adding more than 10 wt% carbon to
the pre-sintered precursor. Furthermore, adding less than 10 wt% soluble starch as
the carbon source results in high capacities at very low current rates, but fails to
deliver considerable capacities at high rates, owing to a lack of a highly sp2-
coordinated carbon network to support ion diffusion through the particle collective.
Ultimately, adding 10 wt% soluble starch as the carbon source combined with
environmentally friendly iron, lithium, and phosphate precursor materials is a
suitable and efficient approach to generate large amounts of high-performance and
high-power LiFePO4/C cathode materials.
The spray-drying method has been successfully applied to prepare high
performance carbon-coated LiFePO4 materials. The optimisation trial has identified
the most suitable process conditions for the precursor materials and spray-dryer
model used to prepare pure and practical LiFePO4 cathode materials in a large
scale. It was found that an inlet temperature of 170 °C, a feed rate of 15 ml min-1,
and a suspension concentration of 20 wt% are both practical and efficient
149
parameter settings for the preparation of LiFePO4 cathode materials. In the
subsequent morphology optimisation trial the impact of different additives on
particle morphology of the final product was also investigated. In this trial, it was
found that the addition of polyvinyl alcohol (PVA) generates micron-sized donut
shaped particle clusters that provide a high tap density product without sacrificing
electrochemical performance. The LiFePO4 cathode material prepared with the
addition of PVA achieved remarkable rate performance results and could maintain
a capacity of 113.95 mA h g-1 at 10C. Further experimental work has to be
conducted in regards to further reducing the nominal carbon content of the final
product, the quality of the carbon coating, and cycling stability of the composite to
fully evaluate to advantages of a spray-drying process integration into the large
scale production of LiFePO4.
7.1.2 Free-standing phosphate-based cathode materials for lithium-ion and
sodium-ion batteries
A novel free-standing LiFePO4@CP hybrid electrode has been developed, in which
a shell of LiFePO4 crystallites on interwoven carbon fibres is embedded in a
conductive carbon network. In this novel architecture, the carbon fibre fabric serves
as the current collector, whilst the carbon coating provides conducting pathways
and structural support for the LiFePO4 particle collective. This novel electrode
design not only ensures close interparticle contact, but also high electronic
conductivity for both mass and charge transfer. The LiFePO4@CP hybrid electrode
delivered high areal capacity and excellent cycling stability for 1000 cycles at a
high current density. It has been shown that metallic current collectors, polymeric
binders, and conducting additives can easily be substituted using commercial
cellulose fibres and sugar, to generate a high performance LiFePO4@CP hybrid
electrode, which could be used as the cathode in flexible lithium-ion batteries.
150
Excellent cycling performance of a novel, free-standing Na3V2(PO4)3@CP hybrid
electrode in a sodium-ion battery system has been successfully demonstrated. It
was shown that Na3V2(PO4)3 nanoparticles decorated on 3D interconnected
conducting carbon fibres can achieve outstanding long-term cycling stability (more
than 30 000 cycles) without the need of any conducting additives, polymeric
binders, or additional current collectors. By using a simple proof-of-concept battery
assembly, we have demonstrated the ease and efficiency of the stand-alone
carbon paper electrode design, which leads the way toward imminent
consideration of alternative free-standing electrode designs in various battery
architectures.
7.2 Future Perspective
This research project has shown the importance of the quality of carbon coatings
applied to LiFePO4 cathode materials. Using Raman spectroscopy, a correlation
between hybridization of the carbon coating, carbon content, and electrochemical
performance of carbon-coated LiFePO4 was established. This could be a useful
tool to evaluate the potential electrochemical performance of any other type of
carbon-coated active material to better identify optimal material compositions
without the need of a full electrochemical characterization. Importantly, only
industry-ready and scalable preparation methods have been applied to prepare the
cathode material. However, the mechanism behind the formation of highly graphitic
carbon coatings depending on the amount of added carbon precursor remains
unclear and requires further experimental and theoretical investigations.
By integrating the spray-drying method into the solid-state preparation process of
carbon-coated LiFePO4, high tap-density (micron-sized) particle clusters of
different morphologies can be created, which is particularly interesting for the
commercial fabrication of this cathode material. This method is not widely
151
implemented in the battery industry, although large-scale production facilities exist
in food manufacturing and pharmaceutical production. A full integration of the
spray-drying method could lead to performance improvements in commercial
LiFePO4 cathode materials as it enables control over secondary particles size and
shape without sacrificing the benefits of the primary particle size reduction induced
by the incorporation of a carbon source in the solid-state reaction.
A free-standing electrode design using widely available microcrystalline cellulose
and an aqueous solution based approach to combined active material precursors
with the cellulose substrate has been shown to be effective in both LiFePO4 and
Na3V2(PO4)3 cathode materials. While the process requires further optimization in
terms of materials loading, resulting particle morphology, and substrate flexibility,
the general concept of the in situ formation of the active material and its current
collector has been proven. The high solubility of the phosphate and transition metal
precursors allows for a homogenous distribution across the highly absorptive
surface of the cellulose substrate, which is crucial for the success of the
subsequent solid-state reaction. The implementation of this electrode preparation
technique could assist in simplifying the industrial production process of battery
electrodes as well as significantly reduce the manufacturing cost of both lithium-ion
and sodium-ion batteries.
152
APPENDIX: NOMENCLATURE
Abbreviations/Symbols Full name
a.u. Arbitrary unit
Ar Argon
BET Brunauer-Emmett-Teller
BJH Barrett-Joyner-Halenda
CB Carbon Black
CNT Carbon Nanotube
CV Cyclic Voltammetry
C-rate Current Rate
153
DI De-ionized
EC Ethylene Carbonate
EIS Electrochemical Impedance Spectroscopy
EVs Electric Vehicles
FESEM Field-Emission Scanning Electron Microscopy
g Gram
h Hour
Hz Hertz
I Intensity
HEVs Hybrid Electric Vehicles
154
HRTEM High-Resolution Transmission Electronic
Microscopy
JCPDS Joint Committee on Powder Diffraction Standards
Li Lithium
LIBs Lithium-Ion Batteries
M Molar Concentration
mA h g-1 Milliampere Hour per Gram
min Minute
mm Millimetre
nm Nanometre
NMP 1-methyl-2-pyrrolidinone
155
PC Propylene Carbonate
PVDF Poly(Vinylidene Difluoride)
Rct Charge Transfer Resistance
RΩ Ohmic Resistance
SAED Selected Area Electron Diffraction
SEI Solid Electrolyte Interface
SEM Scanning Electron Microscopy
SIBs Sodium-Ion Batteries
TEM Transmission Electron Microscopy
TGA Thermogravimetric Analysis
XRD X-ray Diffraction
156
° Degree
Ω Ohm
°C Degree Celsius
Zw (σw) Warburg Impedance
157
REFERENCES
[1] ABC News, SA heatwave forces blackouts to cope with electricity demand, angering Government, http://www.abc.net.au/news/2017-02-08/sa-heatwave-forces-rolling-blackouts-angering-government/8252512, 09.02.2017.
[2] B. Dunn, H. Kamath, J.-M. Tarascon, Science 2011, 334, 928-935.
[4] World Energy Resources E-Storage, 2016 World Energy Council, London, UK.
[5] M. Aneke, M. Wang, Applied Energy 2016, 179, 350-377.
[6] C. Masquelier, L. Croguennec, Chem Rev 2013, 113, 6552-6591.
[7] A. K. Padhi, K. S. Nanjundaswamy, J. B. Goodenough, J Electrochem Soc 1997, 1180-1194.
[8] A. K. Padhi, K. S. Nanjunclaswamy, C. Masquelier, S. Okada, J. B. Goodenough, J Electrochem Soc 1997, 5, 1609-1613.
[9] C. Masquelier, A. Padhi, K. Nanjundaswamy, J. Goodenough, J Solid State Chem 1998, 135, 228-234.
[10] W. Xu, J. Wang, F. Ding, X. Chen, E. Nasybulin, Y. Zhang, J.-G. Zhang, Energy Environ Sci 2014, 7, 513-537.
[11] H. Kim, G. Jeong, Y.-U. Kim, J.-H. Kim, C.-M. Park, H.-J. Sohn, Chem Soc Rev 2013, 42, 9011-9034.
[12] Y. Liu, D. Lin, Z. Liang, J. Zhao, K. Yan, Y. Cui, Nat Commun 2016, 7.
[13] T. Nagaura, K. Tozawa, Prog Batteries Solar Cells 1990, 9, 209-217.
[14] Andrew Stock, Petra Stock, V. Sahajwalla, Powerful Potential: Battery Storage for Renewable Energy and Electric Cars, 2015 Climate Council of Australia Ltd.
[15] P. Roy, S. K. Srivastava, J Mater Chem A 2015, 3, 2454-2484.
[16] D. Liu, G. Cao, Energy Environ Sci 2010, 3, 1218-1237.
[17] N. Nitta, F. Wu, J. T. Lee, G. Yushin, Mater Today 2015, 18, 252-264.
158
[18] P. Poizot, S. Laruelle, S. Grugeon, L. Dupont, J. Tarascon, Nature 2000, 407, 496-499.
[19] J. Cabana, L. Monconduit, D. Larcher, M. R. Palacin, Adv Mater 2010, 22.
[20] N. Godshall, I. Raistrick, R. Huggins, Mater Res Bull 1980, 15, 561-570.
[21] M. Reddy, G. Subba Rao, B. Chowdari, Chem Rev 2013, 113, 5364-5457.
[22] D. Larcher, G. Sudant, J. Leriche, Y. Chabre, J. Tarascon, J Electrochem Soc 2002, 149, A234-A241.
[23] X. W. Lou, D. Deng, J. Y. Lee, J. Feng, L. A. Archer, Adv Mater 2008, 20, 258-262.
[24] B. Guo, C. Li, Z.-Y. Yuan, J Phys Chem C 2010, 114, 12805-12817.
[25] H. Guan, X. Wang, H. Li, C. Zhi, T. Zhai, Y. Bando, D. Golberg, Chem Commun 2012, 48, 4878-4880.
[26] J. C. Park, J. Kim, H. Kwon, H. Song, Adv Mater 2009, 21, 803-807.
[27] S. Bijani, M. Gabas, G. Subias, J. Garcia, L. Sanchez, J. Morales, L. Martinez, J. Ramos-Barrado, J Mater Chem 2011, 21, 5368-5377.
[28] F. Lin, D. Nordlund, T. C. Weng, Y. Zhu, C. Ban, R. M. Richards, H. L. Xin, Nat Commun 2014, 5, 3358.
[29] M. F. Hassan, Z. Guo, Z. Chen, H. Liu, J Power Sources 2010, 195, 2372-2376.
[30] P. Meduri, E. Clark, J. H. Kim, E. Dayalan, G. U. Sumanasekera, M. K. Sunkara, Nano Lett 2012, 12, 1784-1788.
[31] A. Kushima, X. H. Liu, G. Zhu, Z. L. Wang, J. Y. Huang, J. Li, Nano Lett 2011, 11, 4535-4541.
[32] P. Balaya, H. Li, L. Kienle, J. Maier, Adv Funct Mater 2003, 13, 621-625.
[33] K. E. Gregorczyk, Y. Liu, J. P. Sullivan, G. W. Rubloff, ACS Nano 2013, 7, 6354-6360.
[34] Y. Y. Hu, Z. Liu, K. W. Nam, O. J. Borkiewicz, J. Cheng, X. Hua, M. T. Dunstan, X. Yu, K. M. Wiaderek, L. S. Du, K. W. Chapman, P. J. Chupas, X. Q. Yang, C. P. Grey, Nat Mater 2013, 12, 1130-1136.
[35] J. Hu, H. Li, X. Huang, Electrochem Solid-State Lett 2005, 8, A66-A69.
[36] J. Hu, H. Li, X. Huang, L. Chen, Solid State Ion 2006, 177, 2791-2799.
159
[37] S. Yoon, C. Jo, S. Y. Noh, C. W. Lee, J. H. Song, J. Lee, Phys Chem Chem Phys 2011, 13, 11060-11066.
[38] M. Sasidharan, N. Gunawardhana, M. Yoshio, K. Nakashima, Nano Energy 2012, 1, 503-508.
[39] D.-M. Kim, S.-J. Kim, Y.-W. Lee, D.-H. Kwak, H.-C. Park, M.-C. Kim, B.-M. Hwang, S. Lee, J.-H. Choi, S. Hong, Electrochim Acta 2015, 163, 132-139.
[40] S. H. Yu, S. H. Lee, D. J. Lee, Y. E. Sung, T. Hyeon, Small 2016, 12, 2146-2172.
[41] N. Nitta, G. Yushin, Part Part Syst Char 2014, 31, 317-336.
[42] A. S. Arico, P. Bruce, B. Scrosati, J. M. Tarascon, W. van Schalkwijk, Nat Mater 2005, 4, 366-377.
[43] P. G. Bruce, B. Scrosati, J. M. Tarascon, Angew Chem Int Ed Engl 2008, 47, 2930-2946.
[44] R. Mukherjee, R. Krishnan, T.-M. Lu, N. Koratkar, Nano Energy 2012, 1, 518-533.
[45] X. Jia, C. Yan, Z. Chen, R. Wang, Q. Zhang, L. Guo, F. Wei, Y. Lu, Chem Commun 2011, 47, 9669-9671.
[46] N. Pereira, L. Dupont, J. Tarascon, L. Klein, G. Amatucci, J Electrochem Soc 2003, 150, A1273-A1280.
[47] Z.-W. Fu, Y. Wang, X.-L. Yue, S.-L. Zhao, Q.-Z. Qin, J Phys Chem B 2004, 108, 2236-2244.
[48] B. Das, M. Reddy, P. Malar, T. Osipowicz, G. S. Rao, B. Chowdari, Solid State Ion 2009, 180, 1061-1068.
[49] S. W. Kim, D. H. Seo, H. Gwon, J. Kim, K. Kang, Adv Mater 2010, 22, 5260-5264.
[50] F. Wang, R. Robert, N. A. Chernova, N. Pereira, F. Omenya, F. Badway, X. Hua, M. Ruotolo, R. Zhang, L. Wu, V. Volkov, D. Su, B. Key, M. S. Whittingham, C. P. Grey, G. G. Amatucci, Y. Zhu, J. Graetz, J Am Chem Soc 2011, 133, 18828-18836.
[51] T.-J. Kim, C. Kim, D. Son, M. Choi, B. Park, J Power Sources 2007, 167, 529-535.
[52] K. Chang, W. Chen, ACS Nano 2011, 5, 4720-4728.
160
[53] Q. Wang, L. Jiao, Y. Han, H. Du, W. Peng, Q. Huan, D. Song, Y. Si, Y. Wang, H. Yuan, J Phys Chem C 2011, 115, 8300-8304.
[54] N. Mahmood, C. Zhang, Y. Hou, Small 2013, 9, 1321-1328.
[55] F. Gillot, S. Boyanov, L. Dupont, M. L. Doublet, M. Morcrette, L. Monconduit, J. M. Tarascon, Chem Mater 2005, 17, 6327-6337.
[56] Y. Kim, H. Hwang, C. S. Yoon, M. G. Kim, J. Cho, Adv Mater 2007, 19, 92-96.
[57] S. Boyanov, K. Annou, C. Villevieille, M. Pelosi, D. Zitoun, L. Monconduit, Ionics 2008, 14, 183-190.
[58] J. Wang, Y. c. K. Chen Wiegart, J. Wang, Angew Chem Int Ed Engl 2014, 53, 4460-4464.
[59] C. K. Chan, H. Peng, G. Liu, K. McIlwrath, X. F. Zhang, R. A. Huggins, Y. Cui, Nat Nanotech 2008, 3, 31-35.
[60] W.-J. Zhang, J Power Sources 2011, 196, 13-24.
[193] P. P. Prosini, M. Lisi, D. Zane, M. Pasquali, Solid State Ion 2002, 148, 45-51.
[194] C. Ouyang, S. Shi, Z. Wang, X. Huang, L. Chen, Phys Rev B 2004, 69, 104303.
[195] G. K. P. Dathar, D. Sheppard, K. J. Stevenson, G. Henkelman, Chem Mater 2011, 23, 4032-4037.
[196] S.-i. Nishimura, G. Kobayashi, K. Ohoyama, R. Kanno, M. Yashima, A. Yamada, Nat Mater 2008, 7, 707-711.
[197] S. Yang, P. Y. Zavalij, M. S. Whittingham, Electrochem Commun 2001, 3, 505-508.
[198] J. Wang, X. Sun, Energy Environ Sci 2012, 5, 5163-5185.
[199] B. Ding, W. C. Tang, G. Ji, Y. Ma, P. Xiao, L. Lu, J. Y. Lee, J Power Sources 2014, 265, 239-245.
[200] X. Yang, J. Tu, M. Lei, Z. Zuo, B. Wu, H. Zhou, Electrochim Acta 2016, 193, 206-215.
[201] K. Kretschmer, B. Sun, D. Su, Y. Zhao, G. Wang, ChemElectroChem 2015.
168
[202] G. X. Wang, H. Liu, J. Liu, S. Qiao, G. M. Lu, P. Munroe, H. Ahn, Adv Energy Mater 2010, 22, 4944-4948.
[203] S. Deng, H. Wang, H. Liu, J. Lui, H. Yan, Nano-Micro Lett 2014, 6, 209-226.
[204] Z. Ma, G. Shao, Y. Fan, G. Wang, J. Song, T. Liu, ACS Appl Mater Interfaces 2014, 9236-9244.
[205] K. Bazzi, M. Nazri, V. Naik, V. Garg, A. Oliveira, P. Vaishnava, G. Nazri, R. Naik, J Power Sources 2016, 306, 17-23.
[206] S. Novikova, S. Yaroslavtsev, V. Rusakov, T. Kulova, A. Skundin, A. Yaroslavtsev, Electrochim Acta 2014, 122, 180-186.
[207] B. Wang, W. Al Abdulla, D. Wang, X. Zhao, Energy Environ Sci 2015, 8, 869-875.
[208] B. Wang, B. Xu, T. Liu, P. Liu, C. Guo, S. Wang, Q. Wang, Z. Xiong, D. Wang, X. Zhao, Nanoscale 2014, 6, 986-995.
[209] I. D. Johnson, M. Lübke, O. Y. Wu, N. M. Makwana, G. J. Smales, H. U. Islam, R. Y. Dedigama, R. I. Gruar, C. J. Tighe, D. O. Scanlon, J Power Sources 2016, 302, 410-418.
[211] J. Wolfenstine, J. Allen, J Power Sources 2004, 136, 150-153.
[212] F. Zhou, M. Cococcioni, K. Kang, G. Ceder, Electrochem Commun 2004, 6, 1144-1148.
[213] T. Satyavani, A. S. Kumar, P. S. Rao, Engineering Science and Technology, an International Journal 2016, 19, 178-188.
[214] Z. Yang, Y. Dai, S. Wang, J. Yu, J Mater Chem A 2016, 4, 18210-18222.
[215] A. Yamada, H. Koizumi, S.-i. Nishimura, N. Sonoyama, R. Kanno, M. Yonemura, T. Nakamura, Y. Kobayashi, Nat Mater 2006, 5, 357.
[216] G. Chen, X. Song, T. J. Richardson, Electrochem Solid-State Lett 2006, 9, A295-A298.
[217] L. Laffont, C. Delacourt, P. Gibot, M. Y. Wu, P. Kooyman, C. Masquelier, J. M. Tarascon, Chem Mater 2006, 18, 5520-5529.
[218] C. Delmas, M. Maccario, L. Croguennec, F. Le Cras, F. Weill, Nat Mater 2008, 7, 665-671.
169
[219] G. Brunetti, D. Robert, P. Bayle-Guillemaud, J. Rouviere, E. Rauch, J. Martin, J. Colin, F. Bertin, C. Cayron, Chem Mater 2011, 23, 4515-4524.
[220] Y. Orikasa, T. Maeda, Y. Koyama, H. Murayama, K. Fukuda, H. Tanida, H. Arai, E. Matsubara, Y. Uchimoto, Z. Ogumi, J Am Chem Soc 2013, 135, 5497-5500.
[221] H. Liu, F. C. Strobridge, O. J. Borkiewicz, K. M. Wiaderek, K. W. Chapman, P. J. Chupas, C. P. Grey, Science 2014, 344, 1252817.
[222] T. Mueller, G. Hautier, A. Jain, G. Ceder, Chem Mater 2011, 23, 3854-3862.
[223] J. Barker, M. Saidi, J. Swoyer, J Electrochem Soc 2003, 150, A1394-A1398.
[224] R. Gover, P. Burns, A. Bryan, M. Saidi, J. Swoyer, J. Barker, Solid State Ion 2006, 177, 2635-2638.
[225] M. Kim, S. Lee, B. Kang, Adv Sci 2016, 3.
[226] J. Barker, R. Gover, P. Burns, A. Bryan, Electrochem Solid-State Lett 2005, 8, A285-A287.
[227] K. Zaghib, M. Dontigny, A. Guerfi, J. Trottier, J. Hamel-Paquet, V. Gariepy, K. Galoutov, P. Hovington, A. Mauger, H. Groult, J Power Sources 2012, 216, 192-200.
[228] W. Li, B. Song, A. Manthiram, Chem Soc Rev 2017.
[229] T. Ramesh, K. T. Lee, B. Ellis, L. Nazar, Electrochem Solid-State Lett 2010, 13, A43-A47.
[230] D. Chen, G.-Q. Shao, B. Li, G.-G. Zhao, J. Li, J.-H. Liu, Z.-S. Gao, H.-F. Zhang, Electrochim Acta 2014, 147, 663-668.
[231] J. Barker, M. Y. Saidi, J. Swoyer, Vol. US 7261977 B2, Valence Technology, Inc., USA, 2007.
[232] A. Padhi, K. Nanjundaswamy, C. Masquelier, J. Goodenough, J Electrochem Soc 1997, 144, 2581-2586.
[233] G. Hautier, A. Jain, S. P. Ong, B. Kang, C. Moore, R. Doe, G. Ceder, Chem Mater 2011, 23, 3495-3508.
[234] D. L. Smiley, L. J. Davis, G. R. Goward, J Phys Chem C 2013, 117, 24181-24188.
[235] M. Morcrette, C. Wurm, C. Masquelier, Solid State Sci 2002, 4, 239-246.
170
[236] J. Cabana, J. Shirakawa, M. Nakayama, M. Wakihara, C. P. Grey, J Mater Chem 2011, 21, 10012-10020.
[237] C. Masquelier, C. Wurm, J. Rodriguez-Carvajal, J. Gaubicher, L. Nazar, Chem Mater 2000, 12, 525-532.
[238] A. Andersson, B. Kalska, P. Eyob, D. Aernout, L. Häggström, J. Thomas, Solid State Ion 2001, 140, 63-70.
[239] X. Rui, Q. Yan, M. Skyllas-Kazacos, T. M. Lim, J Power Sources 2014, 258, 19-38.
[240] S.-C. Yin, H. Grondey, P. Strobel, M. Anne, L. F. Nazar, J Am Chem Soc 2003, 125, 10402-10411.
[241] M. Morcrette, J. Leriche, S. Patoux, C. Wurm, C. Masquelier, Electrochem Solid-State Lett 2003, 6, A80-A84.
[242] J. Yoon, S. Muhammad, D. Jang, N. Sivakumar, J. Kim, W.-H. Jang, Y.-S. Lee, Y.-U. Park, K. Kang, W.-S. Yoon, J Alloys Compd 2013, 569, 76-81.
[243] M. Saıdi, J. Barker, H. Huang, J. Swoyer, G. Adamson, J Power Sources 2003, 119, 266-272.
[244] X. Rui, C. Li, C. Chen, Electrochim Acta 2009, 54, 3374-3380.
[245] S. Chen, C. Wu, L. Shen, C. Zhu, Y. Huang, K. Xi, J. Maier, Y. Yu, Adv Mater 2017.
[246] Z. Dai, U. Mani, H. T. Tan, Q. Yan, Small Methods 2017.
[247] M. D. Slater, D. Kim, E. Lee, C. S. Johnson, Adv Funct Mater 2013, 23, 947-958.
[248] H. Pan, Y.-S. Hu, L. Chen, Energy Environ Sci 2013, 6, 2338-2360.
[249] S. Hariharan, K. Saravanan, V. Ramar, P. Balaya, Phys Chem Chem Phys 2013, 15, 2945-2953.
[250] B. Huang, K. Tai, M. Zhang, Y. Xiao, S. J. Dillon, Electrochim Acta 2014, 118, 143-149.
[251] P. R. Kumar, Y. H. Jung, K. K. Bharathi, C. H. Lim, D. K. Kim, Electrochim Acta 2014, 146, 503-510.
[252] D. Y. Park, S. T. Myung, ACS Appl Mater Interfaces 2014, 6, 11749-11757.
[253] B. Philippe, M. Valvo, F. Lindgren, H. k. Rensmo, K. Edström, Chem Mater 2014, 26, 5028-5041.
171
[254] M. Valvo, F. Lindgren, U. Lafont, F. Björefors, K. Edström, J Power Sources 2014, 245, 967-978.
[255] X. Liu, T. Chen, H. Chu, L. Niu, Z. Sun, L. Pan, C. Q. Sun, Electrochim Acta 2015, 166, 12-16.
[256] S. Liu, Y. Wang, Y. Dong, Z. Zhao, Z. Wang, J. Qiu, ChemElectroChem 2016, 3, 38-44.
[257] J. W. Choi, D. Aurbach, Nat Rev Mater 2016, 1, 16013.
[258] Y. Jiang, M. Hu, D. Zhang, T. Yuan, W. Sun, B. Xu, M. Yan, Nano Energy 2014, 5, 60-66.
[259] F. Klein, B. Jache, A. Bhide, P. Adelhelm, Phys Chem Chem Phys 2013, 15, 15876-15887.
[260] H. Liu, F. Cao, H. Zheng, H. Sheng, L. Li, S. Wu, C. Liu, J. Wang, Chem Commun 2015, 51, 10443-10446.
[261] X. Wang, X. Shen, Z. Wang, R. Yu, L. Chen, ACS Nano 2014, 8, 11394-11400.
[262] Y. X. Wang, S. L. Chou, D. Wexler, H. K. Liu, S. X. Dou, Chem Eur J 2014, 20, 9607-9612.
[263] S. Zhang, X. Yu, H. Yu, Y. Chen, P. Gao, C. Li, C. Zhu, ACS Appl Mater Interfaces 2014, 6, 21880-21885.
[264] F. Zhou, S. Xin, H. W. Liang, L. T. Song, S. H. Yu, Angew Chem Int Ed Engl 2014, 53, 11552-11556.
[265] C. Zhu, X. Mu, P. A. van Aken, Y. Yu, J. Maier, Angew Chem Int Ed Engl 2014, 53, 2152-2156.
[266] S. H. Choi, Y. N. Ko, J.-K. Lee, Y. C. Kang, Adv Funct Mater 2015, 25, 1780-1788.
[267] J. Wang, C. Luo, T. Gao, A. Langrock, A. C. Mignerey, C. Wang, Small 2015, 11, 473-481.
[268] X. Xiong, W. Luo, X. Hu, C. Chen, L. Qie, D. Hou, Y. Huang, Sci Rep 2015, 5, 9254.
[269] B. Qu, C. Ma, G. Ji, C. Xu, J. Xu, Y. S. Meng, T. Wang, J. Y. Lee, Adv Mater 2014, 26, 3854-3859.
[270] C. Ma, J. Xu, J. Alvarado, B. Qu, J. Somerville, J. Y. Lee, Y. S. Meng, Chem Mater 2015, 27, 5633-5640.
172
[271] W. Xu, K. Zhao, L. Zhang, Z. Xie, Z. Cai, Y. Wang, J Alloys Compd 2016, 654, 357-362.
[272] Y. Liu, Y. Yang, X. Wang, Y. Dong, Y. Tang, Z. Yu, Z. Zhao, J. Qiu, ACS Appl Mater Interfaces 2017, 9, 15484-15491.
[273] Z. Li, J. Ding, D. Mitlin, Acc Chem Res 2015, 48, 1657-1665.
[274] Y. Kim, K.-H. Ha, S. M. Oh, K. T. Lee, Chem Eur J 2014, 20, 11980-11992.
[275] N. Yabuuchi, K. Kubota, M. Dahbi, S. Komaba, Chem Rev 2014, 114, 11636-11682.
[276] Y.-X. Wang, Y.-G. Lim, M.-S. Park, S.-L. Chou, J. H. Kim, H.-K. Liu, S.-X. Dou, Y.-J. Kim, J Mater Chem A 2014, 2, 529-534.
[277] L. Pei, Q. Jin, Z. Zhu, Q. Zhao, J. Liang, J. Chen, Nano Res 2014, 8, 184-192.
[278] P. Ge, Solid State Ion 1988, 28-30, 1172-1175.
[279] D. A. Stevens, J. R. Dahn, J Electrochem Soc 2001, 148, A803.
[280] B. Jache, P. Adelhelm, Angew Chem Int Ed Engl 2014, 53, 10169-10173.
[281] H. Kim, J. Hong, Y.-U. Park, J. Kim, I. Hwang, K. Kang, Adv Funct Mater 2015, 25, 534-541.
[282] H. Kim, J. Hong, G. Yoon, H. Kim, K.-Y. Park, M.-S. Park, W.-S. Yoon, K. Kang, Energy Environ Sci 2015, 8, 2963-2969.
[283] M. M. Doeff, J Electrochem Soc 1993, 140, L169.
[284] D. Stevens, J. Dahn, J Electrochem Soc 2000, 147, 1271-1273.
[285] C. Bommier, T. W. Surta, M. Dolgos, X. Ji, Nano Lett 2015, 15, 5888-5892.
[286] P.-c. Tsai, S.-C. Chung, S.-k. Lin, A. Yamada, J Mater Chem A 2015, 3, 9763-9768.
[287] K. Gotoh, T. Ishikawa, S. Shimadzu, N. Yabuuchi, S. Komaba, K. Takeda, A. Goto, K. Deguchi, S. Ohki, K. Hashi, J Power Sources 2013, 225, 137-140.
[288] H.-G. Wang, S. Yuan, D.-L. Ma, X.-B. Zhang, J.-M. Yan, Energy Environ Sci 2015, 8, 1660-1681.
[289] H. Xiong, M. D. Slater, M. Balasubramanian, C. S. Johnson, T. Rajh, J Phys Chem Lett 2011, 2, 2560-2565.
173
[290] K. T. Kim, G. Ali, K. Y. Chung, C. S. Yoon, H. Yashiro, Y. K. Sun, J. Lu, K. Amine, S. T. Myung, Nano Lett 2014, 14, 416-422.
[291] L. Wu, D. Bresser, D. Buchholz, G. A. Giffin, C. R. Castro, A. Ochel, S. Passerini, Adv Energy Mater 2015, 5.
[292] Y. Sun, L. Zhao, H. Pan, X. Lu, L. Gu, Y. S. Hu, H. Li, M. Armand, Y. Ikuhara, L. Chen, X. Huang, Nat Commun 2013, 4, 1870.
[293] J. Liu, K. Tang, K. Song, P. A. van Aken, Y. Yu, J. Maier, Phys Chem Chem Phys 2013, 15, 20813-20818.
[294] P. Senguttuvan, G. Rousse, V. Seznec, J.-M. Tarascon, M. R. Palacín, Chem Mater 2011, 23, 4109-4111.
[295] J.-Y. Liao, A. Manthiram, Nano Energy 2015, 18, 20-27.
[296] D. Wu, X. Li, B. Xu, N. Twu, L. Liu, G. Ceder, Energy Environ Sci 2015, 8, 195-202.
[297] A. Rudola, K. Saravanan, S. Devaraj, H. Gong, P. Balaya, Chem Commun 2013, 49, 7451-7453.
[298] H. Li, H. Fei, X. Liu, J. Yang, M. Wei, Chem Commun 2015, 51, 9298-9300.
[299] M. Naguib, M. Kurtoglu, V. Presser, J. Lu, J. Niu, M. Heon, L. Hultman, Y. Gogotsi, M. W. Barsoum, Adv Mater 2011, 23, 4248-4253.
[300] B. Anasori, Y. Xie, M. Beidaghi, J. Lu, B. C. Hosler, L. Hultman, P. R. Kent, Y. Gogotsi, M. W. Barsoum, ACS Nano 2015, 9, 9507-9516.
[301] M. Naguib, O. Mashtalir, J. Carle, V. Presser, J. Lu, L. Hultman, Y. Gogotsi, M. W. Barsoum, ACS Nano 2012, 6, 1322-1331.
[302] P. Urbankowski, B. Anasori, T. Makaryan, D. Er, S. Kota, P. L. Walsh, M. Zhao, V. B. Shenoy, M. W. Barsoum, Y. Gogotsi, Nanoscale 2016, 8, 11385-11391.
[303] M. Naguib, J. Halim, J. Lu, K. M. Cook, L. Hultman, Y. Gogotsi, M. W. Barsoum, J Am Chem Soc 2013, 135, 15966-15969.
[304] Y. Xie, Y. Dall'Agnese, M. Naguib, Y. Gogotsi, M. W. Barsoum, H. L. Zhuang, P. R. Kent, ACS Nano 2014, 8, 9606-9615.
[305] X. Wang, X. Shen, Y. Gao, Z. Wang, R. Yu, L. Chen, J Am Chem Soc 2015, 137, 2715-2721.
[306] E. Yang, H. Ji, J. Kim, H. Kim, Y. Jung, Phys Chem Chem Phys 2015, 17, 5000-5005.
174
[307] C. Eames, M. S. Islam, J Am Chem Soc 2014, 136, 16270-16276.
[308] Y. Dall'Agnese, P. L. Taberna, Y. Gogotsi, P. Simon, J Phys Chem Lett 2015, 6, 2305-2309.
[309] P. Eklund, M. Beckers, U. Jansson, H. Högberg, L. Hultman, Thin Solid Films 2010, 518, 1851-1878.
[310] C. Delmas, F. Cherkaoui, A. Nadiri, P. Hagenmuller, Mater Res Bull 1987, 22, 631-639.
[311] Q. Ni, Y. Bai, F. Wu, C. Wu, Adv Sci 2017.
[312] D. Wang, Q. Liu, C. Chen, M. Li, X. Meng, X. Bie, Y. Wei, Y. Huang, F. Du, C. Wang, ACS Appl Mater Interfaces 2016, 8, 2238-2246.
[313] C. Wu, P. Kopold, Y.-L. Ding, P. A. van Aken, J. Maier, Y. Yu, ACS Nano 2015, 9, 6610-6618.
[314] Y. Jiang, J. Shi, M. Wang, L. Zeng, L. Gu, Y. Yu, ACS Appl Mater Interfaces 2015, 8, 689-695.
[315] Y. Zuo, L. Chen, Z. Zuo, Y. Huang, X. Liu, Ceram Int 2017.
[316] J. Yang, H. Wang, P. Hu, J. Qi, L. Guo, L. Wang, Small 2015, 11, 3744-3749.
[317] B. Zhao, B. Lin, S. Zhang, C. Deng, Nanoscale 2015, 7, 18552-18560.
[318] Z. Jian, W. Han, X. Lu, H. Yang, Y. S. Hu, J. Zhou, Z. Zhou, J. Li, W. Chen, D. Chen, Adv Energy Mater 2013, 3, 156-160.
[319] Z. Jian, L. Zhao, H. Pan, Y.-S. Hu, H. Li, W. Chen, L. Chen, Electrochem Commun 2012, 14, 86-89.
[320] Z. Jian, Y. Sun, X. Ji, Chem Commun 2015, 51, 6381-6383.
[321] Y. Zhang, H. Zhao, Y. Du, J Mater Chem A 2016, 4, 7155-7159.
[322] Q. Zhu, B. Nan, Y. Shi, Y. Zhu, S. Wu, L. He, Y. Deng, L. Wang, Q. Chen, Z. Lu, J Solid State Electrochem 2017, 1-11.
[323] C. Delmas, C. Fouassier, P. Hagenmuller, Physica B+C 1980, 99, 81-85.
[324] R. Kanno, Y. Takeda, T. Ichikawa, K. Nakanishi, O. Yamamoto, J Power Sources 1989, 26, 535-543.
[325] X. Ma, H. Chen, G. Ceder, J Electrochem Soc 2011, 158, A1307-A1312.
175
[326] N. Yabuuchi, M. Kajiyama, J. Iwatate, H. Nishikawa, S. Hitomi, R. Okuyama, R. Usui, Y. Yamada, S. Komaba, Nat Mater 2012, 11, 512-517.
[327] J. Xu, D. H. Lee, R. J. Clément, X. Yu, M. Leskes, A. J. Pell, G. Pintacuda, X.-Q. Yang, C. P. Grey, Y. S. Meng, Chem Mater 2014, 26, 1260-1269.
[328] J. Billaud, G. Singh, A. R. Armstrong, E. Gonzalo, V. Roddatis, M. Armand, T. Rojo, P. G. Bruce, Energy Environ Sci 2014, 7, 1387-1391.
[329] X. Wang, G. Liu, T. Iwao, M. Okubo, A. Yamada, J Phys Chem C 2014, 118, 2970-2976.
[330] Y. Lu, L. Wang, J. Cheng, J. B. Goodenough, Chem Commun 2012, 48, 6544-6546.
[331] D. Kundu, E. Talaie, V. Duffort, L. F. Nazar, Angew Chem Int Ed Engl 2015, 54, 3431-3448.
[332] Y. Fang, J. Zhang, L. Xiao, X. Ai, Y. Cao, H. Yang, Adv Sci 2017.
[333] K. Zaghib, J. Trottier, P. Hovington, F. Brochu, A. Guerfi, A. Mauger, C. Julien, J Power Sources 2011, 196, 9612-9617.
[334] P. Moreau, D. Guyomard, J. Gaubicher, F. Boucher, Chem Mater 2010, 22, 4126-4128.
[335] N. Le Poul, E. Baudrin, M. Morcrette, S. Gwizdala, C. Masquelier, J.-M. Tarascon, Solid State Ion 2003, 159, 149-158.
[336] S.-M. Oh, S.-T. Myung, J. Hassoun, B. Scrosati, Y.-K. Sun, Electrochem Commun 2012, 22, 149-152.
[337] Y. Zhu, Y. Xu, Y. Liu, C. Luo, C. Wang, Nanoscale 2013, 5, 780-787.
[338] A. Whiteside, C. A. Fisher, S. C. Parker, M. S. Islam, Phys Chem Chem Phys 2014, 16, 21788-21794.
[339] M. Nakayama, S. Yamada, R. Jalem, T. Kasuga, Solid State Ion 2016, 286, 40-44.
[340] M. Dixit, H. Engel, R. Eitan, D. Aurbach, M. D. Levi, M. Kosa, D. T. Major, J Phys Chem C 2015, 119, 15801-15809.
[341] J. Kim, D.-H. Seo, H. Kim, I. Park, J.-K. Yoo, S.-K. Jung, Y.-U. Park, W. A. Goddard III, K. Kang, Energy Environ Sci 2015, 8, 540-545.
[342] K. Saravanan, C. W. Mason, A. Rudola, K. H. Wong, P. Balaya, Adv Energy Mater 2013, 3, 444-450.
176
[343] C. Zhu, K. Song, P. A. van Aken, J. Maier, Y. Yu, Nano Lett 2014, 14, 2175-2180.