Phosphorus in manures and other organic products: What limits proper recycling of this resource in agriculture? Sylvain PELLERIN, Christian MOREL, Thomas NESME, Bruno RINGEVAL NOM DE L’AUTEUR 03 / 12 / 2013
Transcript
Phosphorus in manures and other organic products: What limits proper recycling of this resource in agriculture?
Sylvain PELLERIN, Christian MOREL, Thomas NESME, Bruno RINGEVAL
NOM DE L’AUTEUR 03 / 12 / 2013
Outline
- Background
- Four barriers / issues for optimal recycling of P from manures
- Geographical segregation between livestock and crop production systems
- Inadequate N/P ratio- Mismatch with temporal crop requirements- Uncertainties in P fertilizing value assessment
- Conclusion
Phosphorus in manures and other organic products 02 Sept 2014
1. Farm specialisation and increasing geographical segregation between livestock and crop production systems• hamper the use of manure as a P fertilizer source in specialised arable
farming regions• are responsible for excess P in animal farming regions
Phosphorus in manures and other organic products 02 Sept 2014
Source: Eurostat
Livestock density (LU ha-1) P manure (kg P ha-1) P mineral fertilisers (kg P ha-1)
Phosphorus in manures and other organic products 02 Sept 2014
Brittany
Centre
P budgets for two contrasted French agricultural regions
Phosphorus in manures and other organic products 02 Sept 2014
►The soil P budget is highly positive (+ 18.9 kg P ha-1 yr-1)
►High P inflows due to feed imports (28.9 kg P ha-1 yr-1) and fertiliser use (7.9 kg P ha-1 yr-1)
►Even without P fertiliser use, the soil P budget would remain positive
Intensive animal farming region (Brittany)
Senthilkumar et al., 2012
Phosphorus in manures and other organic products 02 Sept 2014
► The soil P budget is close to the equilibrium (+1.1 kg P ha-1 yr-1)
► However, crop exports are supported by massive mineral P fertiliser imports (+12.9 kg P ha-1 yr-1)
Intensive arable farming region (Centre)
Senthilkumar et al., 2012
.03Phosphorus in manures and other organic products 02 Sept 2014
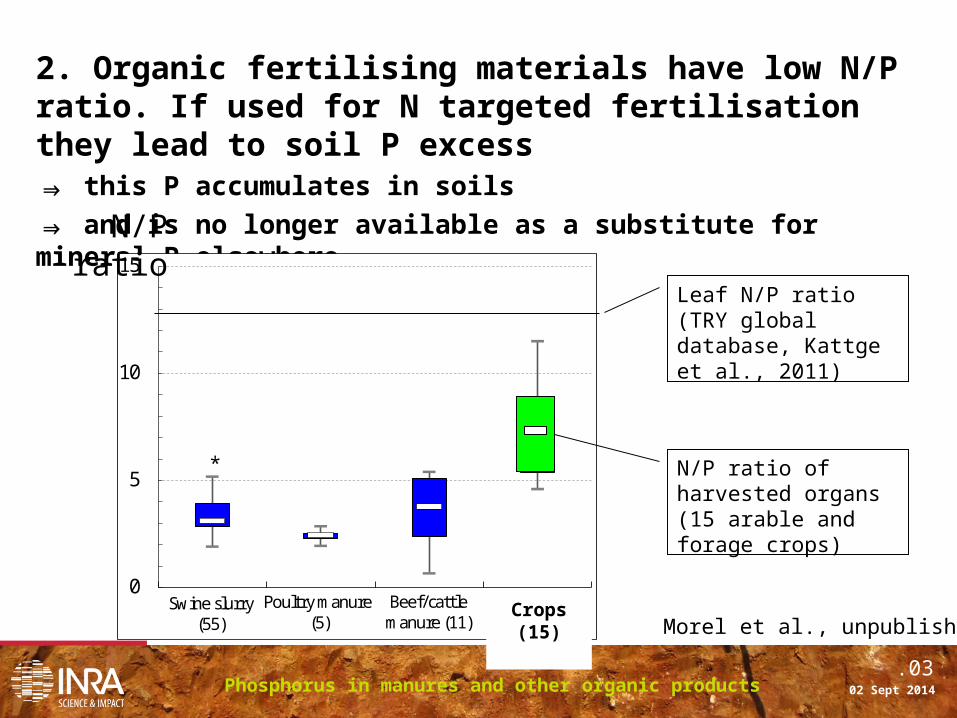
2. Organic fertilising materials have low N/P ratio. If used for N targeted fertilisation they lead to soil P excess⇒ this P accumulates in soils ⇒ and is no longer available as a substitute for mineral P elsewhere
Morel et al., unpublished
0
5
10
15
1 2 3 4
N/P ratio of organic products
Beef/cattlemanure (11)
Swine slurry(55)
Poultry manure (5)
N/P ratio(15)
*
Crops (15)
N/P ratio
Leaf N/P ratio (TRY global database, Kattge et al., 2011)
N/P ratio of harvested organs (15 arable and forage crops)
.03Phosphorus in manures and other organic products 02 Sept 2014
Target yield Mg dry matter ha-1
N content in grain mg g-1 dry matter
P content in grain mg g-1 dry matter
N exports kg N ha-1
P exports kg P ha-1
Amount of cattle manure required to compensate N exports kg DM ha-1
Amount of P supplied kg P ha-1
N budget kg N ha-1
P budget kg P ha-1
8 20 3 160 24 6400 44.8 0 +20.8
Example of a N-P budget for wheat fertilised with cattle manure
.03Phosphorus in manures and other organic products 02 Sept 2014
3. Questions remain about the ability of P from organic fertilizers to match crop requirements in time
Ex of the early « critical stage » on maize
Mineral P « starter fertilisers » are often used by farmers to supply high P concentrations close to the roots during this critical stage
This questions the ability of organic products to act as an effective substitute to soluble mineral fertilisers in this context
Moreover, scheduling applications of organic fertilisers is often constrained by practical aspects (trafficability, etc…)
Mollier, 2013
P d
eman
d (m
g P
km-
1 d-
1)
.03Phosphorus in manures and other organic products 02 Sept 2014
Classical approach: Standardized plant P tests
100
controlPMFP
controlPOFP%) (in Efficiency Relative
uptake uptake
uptake uptake
No P added(control)
Organic fertilizer(OF)
Same amount of P added as soluble
mineral fertilizer (MF)
+ POF + PMF0 P
This approach may be misleading because it assumes that the amount of P taken up by plants originating from the soil is not modified by experimental treatments (Puptakecontrol)
⇒ Standardized plant test using labelling techniques (32P or 33P) are more reliable, but require dedicated laboratory facilities.
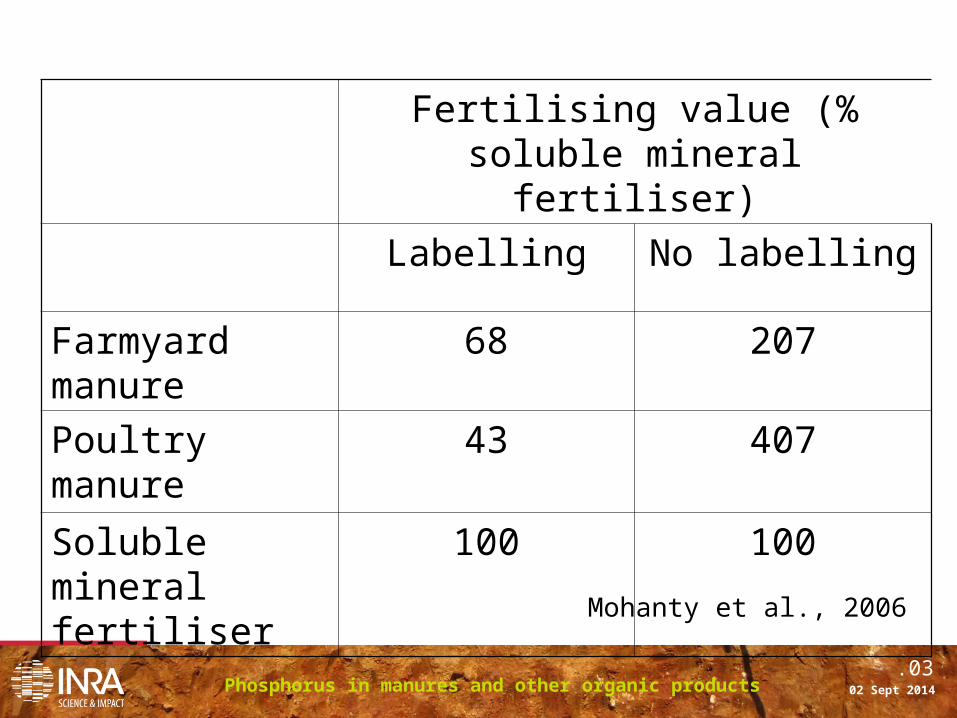
4. Methodological issues and uncertainties in P fertilizing value assessment
.03Phosphorus in manures and other organic products 02 Sept 2014
Fertilising value (% soluble mineral fertiliser)
Labelling No labelling
Farmyard manure 68 207
Poultry manure 43 407
Soluble mineral fertiliser
100 100
Mohanty et al., 2006
.03Phosphorus in manures and other organic products 02 Sept 2014
Reliable studies show that the short term P fertilising value of animal manures is generally high
But it remains that the short-term dynamics of P after manure application may be affected by many factors (e.g. P immobilisation by microbial biomass if high C/P ratio)
⇒ Standardized plant tests are useful tools to rank organic products in standardized conditions
⇒ We need a better understanding of the short term fate of P after manure application in field conditions
Relative efficiency (% of soluble mineral fertiliser)
Organic sources Range
Pig manure 84-102%
Beef manure 68-111%
Poultry manure 43-88%
.03Phosphorus in manures and other organic products 02 Sept 2014
Summary and Conclusion• Organic fertilisers are as effective as mineral fertilisers for mid-
term soil P fertility build-up. • Reliable results suggest that short term P availability in manures
is generally high, although variable• Optimal substitution of mineral P by P from organic products is
limited by – the increasing geographical segregation of animal and crop farming
regions, – inadequate N/P ratio, – Questions about the ability of P from organic fertilizers to match crop
requirements in time– Uncertainties in P fertilizing value assessment
• Practical constraints (storage, handling, trafficability) may also act as barrier
.03Phosphorus in manures and other organic products 02 Sept 2014
Summary and Conclusion• Innovations are needed
– To reconnect livestock and crop production• Regulation on maximum livestock densities?• Exchange markets of manures• Technologies to reduce volumes and transportation expenses (granular, pellets,
…)• Recovery options (struvite precipitation,…)
– to get a N:P ratio better adapted to plant requirements• Reduce P content in manure by re-aligning P diets on animal requirements,…• Increase N content by reducing N gaseous losses
• A research effort is still needed to better understand and predict short term P release and availability for plants after application
.03Phosphorus in manures and other organic products 02 Sept 2014
.03Phosphorus in manures and other organic products 02 Sept 2014
Today, the lack of robust references about short term P fertilising value of organic products may partly explain why farmers do not fully take into account manure application as mineral dose diminishing factors
1:1 line⇒ Full substitution hypothesis
.03Phosphorus in manures and other organic products 02 Sept 2014
More reliable approaches are based on labelling techniques
(1) Isotopic labelling of plant-available soil P with 32P-PO4 or 33PO4
(2) 50 mg P kg -1 soil applied as:Organic fertiliser (OF)or Triplesuperphosphate (MF)
(3) Determination of the 31P and 32P quantities in aerial parts
(4) Calculation of the fraction of the P taken up by plants which derives from the fertilizer (Pdff, in %)