Page 1
Int.J.Curr.Microbiol.App.Sci (2017) 6(4): 1919-1930
1919
Original Research Article https://doi.org/10.20546/ijcmas.2017.604.229
Phosphorus Movement and Vertical Distribution in Four Soil Orders of
India: Column Leaching Experiment
I. Rashmi1*, A.K. Biswas
2, K.C. Shinogi
2, S. Kala
1, K.S. Karthika
3,
S.P. Prabha4 and Yushma Sao
5
1ICAR-IISWC, Research Centre, Kota (Rajasthan), India
2ICAR- IISS, Bhopal (M.P.), India
3ICAR- CPCRI, Research Centre, Vittal (Karnataka), India
4ICAR-DCR, Puttur (Karnataka), India
5TCB College of Agriculture and Research Station, Bilaspur (C.G.), India
*Corresponding author
A B S T R A C T
Introduction
In Indian agriculture, P is considered as a
major constrain in crop yield and significant
response is obtained with its application.
Phosphorus is the vital component of DNA,
RNA, ATP and photosynthetic system and
catalyses a number of biochemical reactions
from the beginning of seedling growth
through to the formation of grain and
maturity. With increasing population
pressure, global food production will need to
increase by 70% by 2050 (Fraiture, 2007).
The major challenge is high prices of P
fertilisers in India but continuous supply of P
through manures and fertilizers is
indispensable for crop production sustenance.
Thus good agronomic management requires
the efficient use of fertilizer P for optimum
crop production whereas excess soil P can be
detrimental for water quality. Phosphorus thus
plays a key role in sustainable crop
production as well as environmental quality.
As reported by Muralidharudu et al., (2011)
based on GIS based soil fertility map of India
revealed high fertilizer consumption in Punjab
International Journal of Current Microbiology and Applied Sciences ISSN: 2319-7706 Volume 6 Number 4 (2017) pp. 1919-1930 Journal homepage: http://www.ijcmas.com
A soil column leaching experiment was conducted with different levels of P
application to P accumulation and vertical distribution of phosphorus in some
major soil orders (vertisol, inceptisol, alfisol and ultisol) of India. The result
showed that soluble reactive P (RP) content in four soils increased with P
application rates and decreased with number of leaching events. Phosphorus
leaching mainly occurred during the initial five leaching events accounting to
55-60% of total P leached over whole period. The Olsen and bray P content in
all the four soils were higher beneath 0-10cm depth and increased with P
application and decreased in untreated column section. The study showed that
inceptisol have higher potential for P leaching and that is associated with soil
texture and P sorption capacity of the soil.
K e y w o r d s
Reactive
phosphorus,
Vertisol, Inceptisol,
Alfisol, Ultisol,
Phosphorus
leaching.
Accepted:
15 March 2017
Available Online: 10 April 2017
Article Info
Page 2
Int.J.Curr.Microbiol.App.Sci (2017) 6(4): 1919-1930
1920
state followed by Andhra Pradesh and Tamil
Nadu. The overuse of high analysis and
complex P fertilizers in excess of crop
requirement can increase the P content in
agricultural soil. For example, in Kerala
where out of 1.5 lakh soil samples collected,
62% of samples showed high P content
between 25 to 100kg ha-1
which corresponds
to high soil P content. This build up of soil P
pool can lead to increased risk of P loss from
soil (Dinesh et al., 2014). The high P
accumulation also results downward
movement P to deeper layers in coarse-
textured irrigated soil as observed by Aulakh
et al., (2007), pointing to the potential for
extensive leaching under long-term P
fertilizer applications. More information is
thus to be elicited from subtropical soils of
India where P fertilizers are fully imported
and applied in excess of crop requirement.
Many studies conducted in temperate soils
illustrated increased P concentration in
subsoil horizons attributed to the buildup of P
as evidence of past P leaching and
translocation of P from applied sources
mostly organics (Eghball et al., 1996; Withers
et al., 2005). Most of the studies were
concentrated on P movement under manure
applications. However, in India the major
input is soluble P fertilizers and P movement
under inorganics has not been extensively
studied. In China Zhoa et al., (2009) reported
P leaching in light chernozem soil under
different P fertiliser rates in soil column study
where high clay content influenced vertical P
distribution. Soil and sub soil properties, P
application rates affect P leaching in soil
column experiment (Djodjic et al., 2004).
With recent reports of P application leading to
P movement to beyond 30cm depth observed
in coarse textured soils of Punjab (Garg and
Aulakh, 2010), deteriorating drinking water
quality in Tamil Nadu (Rajmohan and Elango
2005) there is a need to understand vertical
movement of P under inorganic fertilization
and the soil potential for P loss. Currently
information of P movement is minimal for
Indian subtropics. In the study soil were taken
major cultivable orders namely black
(vertisol), alluvial (inceptisol), red (alfisol)
and laterite (ultisol) soils of India. Therefore,
the objective of the study was to investigate
the different form of P in leachate, examine
downward movement of soil P and comparing
the P leaching characteristics of the soils.
Materials and Methods
Four soils from different taxonomy classes
were taken for the study. The soils were
vertisol (Typic Haplustert) from Bhopal (23º
18’N 77º 24’ E), inceptisol (Eutrochrepts)
from Barrackpore (22º 45’ N 88º 25’E) alfisol
(Kandic paleustalf) from Bangalore (13º 14’
22.54’’N 77 º35’ 09.21’’ E) and ultisol (Typic
Plintustult) from Trivandrum (8 º32’ 44.91’’N
76º 54’ 49.67’’E). The soil samples were
collected from 0-20cm depth from four soils
and processed passed through 2mm sieve. The
soil samples were processed and analysed at
Soil Chemistry and Fertility Division of
Indian Institute of Soil Science, Bhopal. The
initial physico chemical properties of the soils
were determined prior to soil column leaching
experiment and shown in Table1. The P
sorption was conducted in four soils using
Langmuir equation to derive P sorption
maxima (Psmax) of soils.
Soil column leaching experiment
To study P leaching characteristics of four
soils a column experiment was conducted by
adding different P fertilizer concentration.
The P application rates were 0, 100, 200, 300,
400 and 500mg kg-1
(on oven dry basis)
designated as P1, P2, P3, P4, P5 and P6
respectively. Three replications were set and
inorganic source of P applied was KH2PO4.
The P fertilizer was dissolved in distilled
water and sprayed on to the soils and were
Page 3
Int.J.Curr.Microbiol.App.Sci (2017) 6(4): 1919-1930
1921
incubated for six weeks by maintaining at
field capacity. The soils were subjected to
alternate wetting and drying depending upon
the moisture content to be maintained to get a
homogenized soil sample. After incubation,
the soil samples were used for soil column
experiment and are henceforth referred as P
treated soil. A portion of the untreated soil
was filled at the bottom of column section.
One pore volume of the vertisol, inceptisol,
alfisol and ultisol was 1152, 1044, 1037 and
1003ml respectively based upon porosity.
The incubated soils was filled in column
made of polyvinyl chloride (PVC) material to
study phosphorus leaching under twenty
leaching events. The PVC columns of
dimension 10.12cm diameter and 60cm length
was coated with paraffin wax inside to seal
between soil and column wall before filling
the soil. The bottom of the column were
packed glass wool and filled with acid washed
gravels, 2cm layer of acid washed sand was
spread uniformly so as to get clear leachate.
Then columns were first filled with P
untreated soil from respective soil orders and
was slowly packed into the column to a depth
of 20cm. Then a thin layer of acid washed
sand was spread on which P treated soil were
filled slowly and pressed to its bulk density to
a height of 30cm respectively for all the six
treatments. A portion of P treated soil
approximately weighing equivalent to 1.3 to
1.45 kg was filled to a depth of 30cm and
column was tapped uniformly on laboratory
table resulting in average bulk density of 1.32
g cm-3
for vertisol, 1.52 g cm-3
for inceptisol,
1.41 g cm-3
for alfisol and 1.45 g cm-3
for
ultisol similar to field bulk densities (Table
1). After packing 10 mm thickness of fine
sand was spread on soil to avoid disturbance
while applying deionised water. Each
treatment was replicated three times. Total
number of columns were 72 (six treatments
with three replications and four soils) stacked
on wooden platform. After the soil was
packed the column was wetted from the
bottom by allowing the water to rise by
capillary action, until it was fully saturated.
The columns were leached by uniformly
applying 500 ml of double distilled water at
interval of 5 days and 20 leaching events were
carried out. After leaching experiment the soil
columns were allowed to dry at room
temperature and were slowly loosened. The
soil from column was taken out carefully and
sliced into different sections 0-10cm (10cm),
10-20cm (20cm), 20-30cm (30cm) from
treated column section and 30-40cm (40cm),
40-50cm (50cm) from untreated section.
Leachate samples from each leaching events
were collected and filtered through a
Whatman 42 filter prior and analysed for
soluble reactive P (RP) by blue color method
(Murphy and Riley 1962). The soil samples
taken from column sections were oven dried
and sieved (2mm) and analysed for Olsen and
Bray P and water extractable P (WEP) (1:10
soil: solution ratio for 1hour) and 0.01M
CaCl2 P (1:30 soil: solution ratio for 1hour as
described by Borling et al., 2004).
Data analysis
The amount of P in leachate was calculated
by multiplying volume of leachate and P
content in leachate. The leachate data was
analysed for analysis of variance using SAS,
9.3 (2013) at 5% level of significance.
Results and Discussion
Pattern of P leaching
The soluble RP content of vertisol, inceptisol,
alfisol and ultisol varied significantly with
(p=0.05) different P treatments. From figure 1
the soluble RP content in leachate initially
increased with batches of leaching, but after
10th
and 11th
leaching events the content
decreased subsequently. In vertisol the
Page 4
Int.J.Curr.Microbiol.App.Sci (2017) 6(4): 1919-1930
1922
soluble RP on average varied from 0 to 0.12
mg l-1
in P1 to P6 treatment. The soluble RP
decreased after 11th
leaching event in all the
treatments. The significant amount of soluble
RP was lost in P4, P5 and P6 treatments. The
average soluble RP decreased from 5th
to 9th
leaching events ranging from 0.12 to 0.087
mg l-1
across treatments.
In inceptisol the average soluble RP varied
from 0 to 0.28 mg l-1
in P1 to P6 treatment
from 20 leaching events. Significant amount
of soluble RP was leached in P5 and P6
treatment during 1st batch of leaching events
over control (P1) and P2 treatment whereas in
vertisol, alfisol and ultisol it was observed in
P6 treatment. In P6 treatment a sharp increase
in soluble RP in leachate was observed from
3rd
batch of leaching to 6th
batch of leaching
ranging from 0.23 to 0.36 mg l-1
, although the
amount of soluble RP leached after 6th
batch
of leaching was significantly higher compared
to other treatments (Fig. 1). The concentration
soluble RP in leachate in P6 treatment were
0.25 mg l-1
during 5th
leaching event which
was 2 times more than control treatment (P1)
and in P6 treatment soluble RP content in
leachate were 0.36 mg l-1
which was nearly 3
times the control treatment.
In alfisol the mean soluble RP content ranged
from 0.006 to 0.148 mg l-1
when subjected to
20 leaching events. The soluble RP content
varied from 0.037 to 0.122 mg l-1
during the
first 6 leaching events and later decreased
sharply. The soluble RP content on average
ranged from 0 in P1 to 0.14 mg l-1
in P6
treatment (Fig. 1). The amount of soluble RP
content leached were almost similar in P5 and
P6 treatment and significantly differed from
other treatments. The amount of soluble RP
leached became negligible after 12th
leaching
events in all the treatments.
In ultisol the soluble RP content ranged from
0.003 to 0.128 mg l-1
during 20 leaching
events. Significant amount of soluble RP was
leached out during the initial 10 leaching
events. The soluble RP content varied from
0.025 to 0.122 mg l-1
initially up to 6th
batch
of leaching and later decreased sharply
thereafter (Fig:1). The amount of soluble RP
leached was significantly higher in P6
treatment compared to P2 and P3 treatments.
Significant amount of P was leached during
P5 and P6 treatments. In ultisol soluble RP
was not detected till P4 treatment during the
1st leaching event and was similar to those of
vertisol.
Significant amount of soluble RP leached
from inceptisol followed by alfisol, ultisol and
vertisol at P5 and P6 treatments. The soluble
RP content in leachate during the initial 10
leaching events were on average 0.08 mg l-1
and later decreased to negligible amount in
last 10 leaching events in vertisol, alfisol and
ultisol, whereas in inceptisol the soluble RP
content was 0.154 mg l-1
during the initial
leaching events. The more soluble RP content
in leachate was observed for longer time in
inceptisol (0.02 mg l-1
) throughout leaching
events compared to vertisol, alfisol and
ultisol. Concentration of soluble RP content in
leachate samples at the first 5 leaching events
varied from soil to soil and for inceptisol was
highest ranging from 0.065 to 0.154 mg l-1
,
vertisol was 0.032 to 0.117 mg l-1
, alfisol was
0.037 to 0.122 mg l-1
and ultisol was 0.025 to
0.124 mg l-1
. The concentration of soluble RP
in leachate was higher in inceptisol, followed
by ultisol, alfisol and vertisol.
Thus, in vertisol significant amount of P was
leached from P6 (1000ppm) treatment as
compared to all other treatments, in inceptisol
significant amount of P was leached from P5
and P6 treatment during initial leaching
events.. In acid soils, significant amount of P
was leached from P6 treatment in alfisol and
ultisol during the 1st leaching events.
Page 5
Int.J.Curr.Microbiol.App.Sci (2017) 6(4): 1919-1930
1923
Comparison of different P extractants and
its effect on P leaching
On comparing the extractable P content at
similar depths (Fig. 2) showed that Olsen P
varied depth wise in columns of vertisol and
inceptisol and significantly increased with P
additions. Olsen P was higher significantly in
upper layer of inceptisol compared to vertisol.
In surface 0-30cm depth Olsen P ranged from
75 to 115 mg kg-1
in vertisol and in inceptisol
varied from 95 to 145.36 mg kg-1
respectively
at P6 treatment. The P movement from treated
soil to the P untreated soil was observed from
P2 to P6 treatment except for control. The
amount of Olsen P varied significantly among
the different depths. Higher Olsen P content
was observed in three sections of P treated
soils (0-10, 10-20cm and 20-30cm). In P
untreated significant difference was observed
in column depth of P5 and P6 treatments in
vertisol and inceptisol whereas there was no
significant difference between Olsen P
content in P0 to P4 treatments shown in figure
2a and b. Concentration of Olsen P increased
significantly up to 30cm depth and thereafter
decreased sharply. Higher Olsen P
accumulation was observed in P6 treatment.
Similarly for acid soils of alfisol and ultisol,
Bray 1 was used as P extractable soil test at
different soil column depth showed no
significant difference in in upper soil layers.
The Bray P content of alfisol and ultisol
significantly varied among different P
application rates. No significant difference in
Bray P content was observed depth wise in P1
(control) and P2 treatment of alfisol and
ultisol. High Bray P content was observed in
P treated column section and higher
accumulation was observed in third column
depth (20-30cm) in P5 and P6 treatments. In
both alfisol and ultisol P6 treatment showed
high P accumulation and movement in
column (Fig. 2c and d). In untreated column
section there was no significant difference
between Bray P content in all treatments.
The environmental STP like WEP and 0.01 M
CaCl2-P was also detected column depth wise
for four soil orders. The WEP and CaCl2 P
content were comparatively less in vertisol,
inceptisol, alfisol and ultisol compared to
routine STP like Olsen and Bray extractant.
Table.1 Initial physico chemical properties of the experimental soils
Soil parameters Vertisol Inceptisol Alfisol Ultisol
pH 7.5 8.3 6.3 5.5
Electrical Conductivity (dSm-1
) 0.25 0.31 0.15 0.19
Bulk density (g cm-3
) 1.34 1.52 1.41 1.45
Organic carbon(g kg-1
) 5.4 5.4 4.4 4.2
Clay (%) 55.05 19.30 20.66 22.81
Sand (%) 7.41 60.67 59.65 59
Silt (%) 37.54 20.05 15.09 18.19
Amorphous Al (g kg-1
) 1.06 0.37 1 1.7
Amorphous Fe (g kg-1
) 1.96 0.77 2.1 3.6
P smax (mg kg-1
) 510.44 222.33 346.68 419.45
Extractable P (mg kg-1
) 9.48 10.74 10.6 8.51
Page 6
Int.J.Curr.Microbiol.App.Sci (2017) 6(4): 1919-1930
1924
Fig.1 Dynamics of soluble RP content in (a) vertisol (b) inceptisol (c) alfisol (d) ultisol treated
with different P rates. Vertical bars are the standard errors of the mean
Page 7
Int.J.Curr.Microbiol.App.Sci (2017) 6(4): 1919-1930
1925
Fig.2 Vertical distribution of Olsen P in (a) vertisol (b) inceptisol and by Bray P in (c) alfisol (d)
ultisol treated with different P rates. Horizontal bars are the standard errors of the mean
Page 8
Int.J.Curr.Microbiol.App.Sci (2017) 6(4): 1919-1930
1926
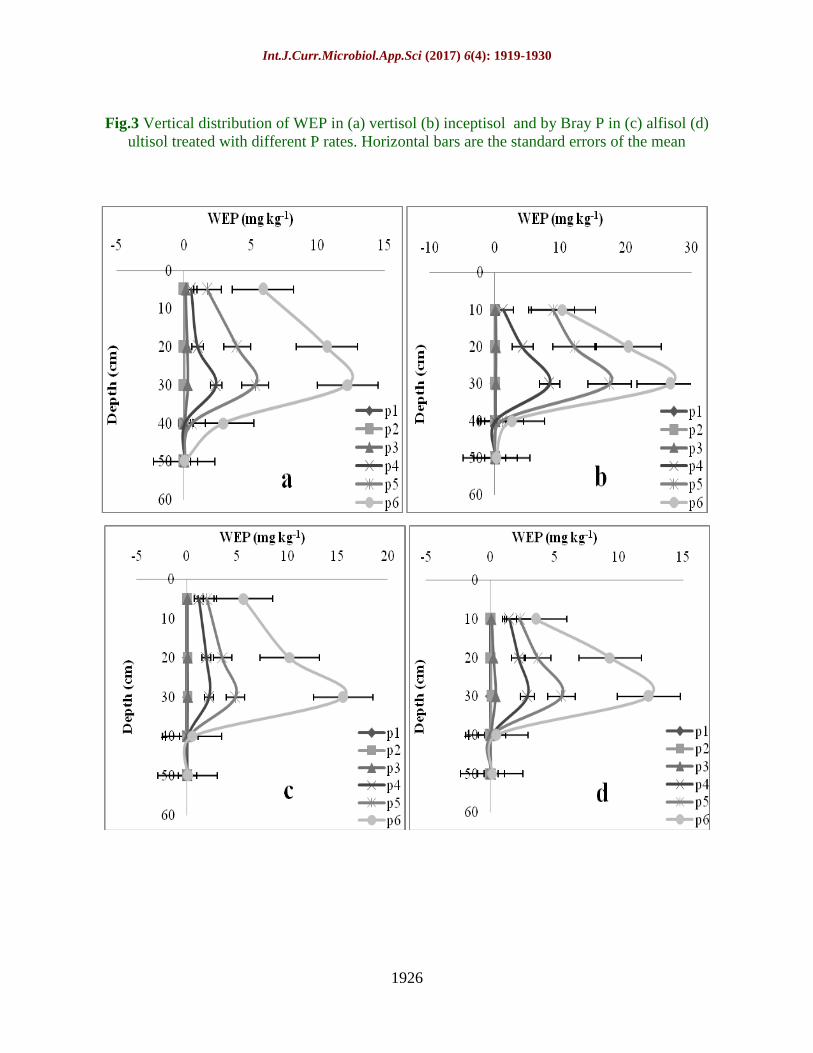
Fig.3 Vertical distribution of WEP in (a) vertisol (b) inceptisol and by Bray P in (c) alfisol (d)
ultisol treated with different P rates. Horizontal bars are the standard errors of the mean
Page 9
Int.J.Curr.Microbiol.App.Sci (2017) 6(4): 1919-1930
1927
Fig.4 Vertical distribution of 0.01MCaCl2 in (a) vertisol (b) inceptisol and by Bray P in
(c) alfisol (d) ultisol treated with different P rates. Horizontal bars are the
standard errors of the mean
The WEP content in column section was
higher than 0.01M CaCl2 P content at similar
depth of column in four soil orders (Fig.: 3&
4). In vertisol higher WEP content was
observed at 30cm depth of P treated column
section and decreased sharply to next P
untreated column depth (Fig.: 4). Similarly
the CaCl2- P content was not significant for
most of the treatments except for P6. In
inceptisol the WEP and 0.01 M CaCl2- P
content varied significantly among treatments
P4, P5 and P6 treatment depth wise compared
to other treatments. The potential release of P
into soil solution (CaCl2- P and WEP) was
higher from 0-30cm depth resulting in higher
amount of leachate P from inceptisol. From
Page 10
Int.J.Curr.Microbiol.App.Sci (2017) 6(4): 1919-1930
1928
the Fig.: 3 & 4 the WEP and 0.01 M CaCl2- P
was higher in inceptisol at the depth of 10-
20cm and more at 20-30cm depth. In alfisol
the WEP content varied significantly among
treatments in P4, P5 and P6 treatments. The
WEP content increased with and accumulated
more at 30cm depth and thereafter it
decreased sharply in P untreated soil column
section (Fig:3). The CaCl2- P content also
varied significantly among P treatment and
depth wise. The CaCl2- P content also
accumulated at 30cm depth and decrease
sharply with depth. Similar trend was
observed in ultisol. The WEP and 0.01 M
CaCl2- P content of ultisol was less than those
in alfisol and followed a similar trend as that
of alfisol (Fig. 3&4).
Among the four soils the soluble P in leachate
was not significantly different in P1 to P3
treatments, but the trend changed with higher
P application from P4 (400 mg kg-1) to P6
(1000 mg kg-1). Highest amount of P
leaching was observed in inceptisol followed
by alfisol and ultisol and least by vertisol. The
sandy loam texture of inceptisol might have
resulted in higher P loss with less time for P
sorption by the soil.
The soluble RP content in the leachate varied
in four soil orders based upon P sorption
capacity of the soil. In field other condition
like crop uptake, climatic factors, fertilizers
application methodologies would affect the
extent of P losses. In vertisol, inceptisol,
alfisol and ultisol the soluble RP
concentration was 0.15, 0.19, 0.14 and 0.11
mg l-1
respectively after 1st batch of leaching
at P6 treatment which according to United
State of Environment Protection Agency
(USEPA) is either ≥ 0.1mg l-1
, the surface
water standard sufficient to cause
eutrophication (USEPA, 1987). The highest
amount of mean soluble RP content in
leachate was observed in inceptisol (0 to 0.28
mg l-1
) followed by alfisol (0 to 0.15 mg l-1
),
ultisol (0 to 0.13 mg l-1
) and vertisol (0 to
0.11 mg l-1
). The high amount of P leaching in
inceptisol is due to the coarse textured soil for
easy water movement and which provide less
time for P sorption (Zhang, 2008). Similar
was the case with alfisol and ultisol and
whereas with vertisol slower P movement was
observed due to high clay content leading to
high P sorption capacity of the soil (510.44
mg kg-1
) as shown in table 1.
The soluble RP content in all the four soils
showed a skewed distribution during leaching
under different rate of P application (Fig: 1).
The soluble RP was negligible during initial
leaching events and thereafter increased up to
5 and 6th
leaching event and later decreased
logarithmically with more number of leaching
events in four soil orders. The soluble RP
content increased during the early phase of
leaching events was associated with travel
time of dissolved P in soil solution and
desorption of P as extractable form during
leaching. The logarithmic decreased in
soluble RP content in the leachate with
increasing number of leaching events might
be due to complete soil surface saturation
with the applied P and the excess P could
rapidly be release to soil solution (Li et al.,
2013). The percentage of P loss was not
dependent upon the rate of P application as
reported in many studies (Lewis et al., 1981).
This may be due to high adsorption capacity
for P retention. Although the soluble RP
content in leachate varied depending upon the
amount of P applied based upon P sorption
capacity of the soils, more amount of P was
desorbed from inceptisol followed by alfisol,
ultisol and vertisol. The extent of P loss for
long term from continuously fertilized soils
cannot be predicted from short term column
studies. However, routine STP like olsen and
bray can be used to monitor the buildup of P
in inceptisol, alfisol with low P sorption
capacity. The environmental STP like WEP
and 0.01 M CaCl2- P can also be included in
Page 11
Int.J.Curr.Microbiol.App.Sci (2017) 6(4): 1919-1930
1929
soil testing programme at field levels in areas
with high soil P values especially in alluvial,
red and black soils of India. The initial soil P
content of soil in present study was medium
in status and therefore no P was detected in
leachate in P1 treatment. In inceptisol, due to
low P sorption capacity compared to other
soils might have resulted in more soluble P
loss. On contrary, vertisol and ultisol had high
P sorption capacity and therefore recorded
less P in leachate. This is similar to the
findings as reported by Djodic et al., (2004)
who reported with high P sorption capacity
can reduce P concentration in soil solution.
Several soil properties are known to influence
P availability when extracted with extractants
like Olsen and Bray 1. Beside the leaching
experiment the properties like P sorption
capacity, clay content, Al and Fe oxides and
Ca content influenced P extraction in P
untreated column section. In vertisol the
Olsen P content was less compared to
inceptisol because of higher clay content
which influenced P sorption capacity and
absorbed more P (table 1). In both alfisol and
ultisol, the oxalate extractable Al and Fe
content played an important role in P sorption
in untreated column section (table 1).
The use of environmental STP like 0.01 M
CaCl2- P and WEP content was found highest
in inceptisol which is due to higher P
accumulation resulting in higher P leaching
compared to other soils. Higher significant
difference was observed in P5 and P6
treatments especially in inceptisol, alfisol,
ultisol and vertisol. The 0.01 M CaCl2- P is
similar to that of soil solution at field capacity
(Wiklander and Andersson, 1974) and can
simulate the release of P to soil solution.
CaCl2- P was highest at all depth in inceptisol
compared to other soil orders. The WEP
represents the rapidly soluble P form that can
be transported though the soil profile
following heavy rainfall or preferential flow
(Yli-Halla et al., 1995; Jensen et al., 1998).
Similarly the WEP was also found to be
highest in inceptisol which might have
contributed to higher P leaching losses.
The outcome of present soil column study
need further verification on more number of
soils with varying physic chemical properties
so that it can used to predict the leaching
threshold values for Indian soils.
References
Aulakh, M.S., A.K. Garg and B.S. Kabba.
2007. Phosphorus accumulation,
leaching and residual effects on crop
yields from long term applications in
the subtropics. Soil Use Manage., 23:
417-427.
Borling, K., E. Otabbong and E. Barbaris.
2004. Soil variables for predicting
phosphorus release in Swedish non-
calcareous soils. J. Environ. Quality,
33: 99–106.
Dinesh, R., V. Srinivasan, S. Hamza and M.
Anandraj. 2014. Massive phosphorus
accumulation in soils: Kerala’s
continuing conundrum. Curr. Sci.,
103(6): 343-344.
Djodjic, F., K. Borling and L. Bergstrom.
2004. Phosphorus leaching in relation to
soil type and soil phosphorus content. J.
Environ. Quality, 33: 678–684.
Eghball, B., G.D., Binford, and D.D.
Baltensperger. 1996. Phosphorus
movement and adsorption in soil
receiving long term manures and
fertilizers. J. Environ. Quality, 25:
1339–1343.
Fraiture, C.D. 2007. Future Water
Requirements for Food—Three
Scenarios, International Water
Management Institute (IWMI), SIWI
Seminar: Water for Food.
Garg, A.K. and M.S. Aulakh. 2010. Effect of
long-term fertilizer management and
Page 12
Int.J.Curr.Microbiol.App.Sci (2017) 6(4): 1919-1930
1930
crop rotations on accumulation and
downward movement of phosphorus in
semi-arid subtropical irrigated soils.
Communication of Soil Sci. Plant
Analysis, 41(7): 848–864.
Jensen, M.B., Hansen, H.C.B., Hansen, S.,
Jørgensen, P.R., Magid, J. and Nielsen,
N.E. 1998. Phosphate and tritium
transport through undisturbed subsoil as
affected by ionic strength. J. Environ.
Quality, 27: 139–145.
Lewis, D.C., A.L. Clarke and W.B. Hall.
1981. Factors affecting the retention of
phosphorus applied as superphosphate
to the sandy soils in south eastern South
Australia. Australian J. Soil Res., 19:
167-174.
Li, Y., R. Gao, R. Yang, H. Wei, Y. Li, H.
Xiao and J. Wu. 2013. Using a simple
soil column method to evaluate soil
phosphorus leaching risk. Clean Soil,
Air Water. doi:
10.1002/clen.201200372.
Muqiu Zhao, M., X. Chen, Yi Shi, Q. Zhou
and C. Lu. 2009. Phosphorus vertical
migration in aquic brown soil and light
Chernozem under different phosphorous
application rate: A soil column leaching
experiment. Bull. Environ.
Contamination and Toxicol., 82: 85–89.
Muralidharudu, Y., K.S. Reddy, B.N. Mandal,
A.S. Rao, K.N. Singh, and S. Sonekar.
2011. GIS based soil fertility maps of
different states of India. All India
Coordinated Research Project on Soil
Test Crop Response Correlation. IISS,
Bhopal.
Murphy, J. and J.P. Riley. 1962. A modified
single solution method for
determination of phosphate in natural
waters. Analytica Chimica Acta, 27: 31–
36.
Rajmohan, N. and L. Elango. 2005. Nutrient
chemistry of groundwater in an
intensively irrigated region of southern
India. Environ. Geol., 47: 820-830.
USEPA, 1986. US Environmental Protection
Agency; Environmental indicators of
water qualityin the United States. EPA
841-R-96-002; US Environmental
Protection Agency (USEPA), Office of
Water (4503F), Washington, DC.
Wiklander, L. and A. Andersson. 1974. The
composition of the soil solution as
influenced by fertilization and nutrient
uptake. Geoderma, 11: 157–166.
Withers, P.J.A., D.M. Nash, and C.A.M.
Laboski. 2005. Environmental
management of phosphorus and
fertilizers In Phosphorus, agriculture
and Environment eds. Sims J.T. and
Sharpley A,N, 781-827 Madison, Wisc.:
American Society of Agronomy.
Yli-Halla M., Hartikainen H., Ekholm P.,
Turtola E., Puustinen M. and Kallio K.
1995. Assessment of soluble
phosphorus load in surface runoff by
soil analyses. Agri. Ecosystem Environ.,
56: 53–62.
Zhang, M.K. 2008. Effects of Soil Properties
on Phosphorus Subsurface Migration in
Sandy Soils, Pedosphere, 18: 599–610.
How to cite this article:
Rashmi, I., A.K. Biswas, K.C. Shinogi and Kala, S. 2017. Phosphorus Movement and Vertical
Distribution in Four Soil Orders of India: Column Leaching Experiment.
Int.J.Curr.Microbiol.App.Sci. 6(4): 1919-1930. doi: https://doi.org/10.20546/ijcmas.2017.604.209